

Deep Learning for Lung Cancer Diagnosis, Prognosis and Prediction Using Histological and Cytological Images: A Systematic Review

 ,
,  ,
,  ,
, 
 ,
,  and
and
Abstract
Simple Summary
Abstract
1. Introduction
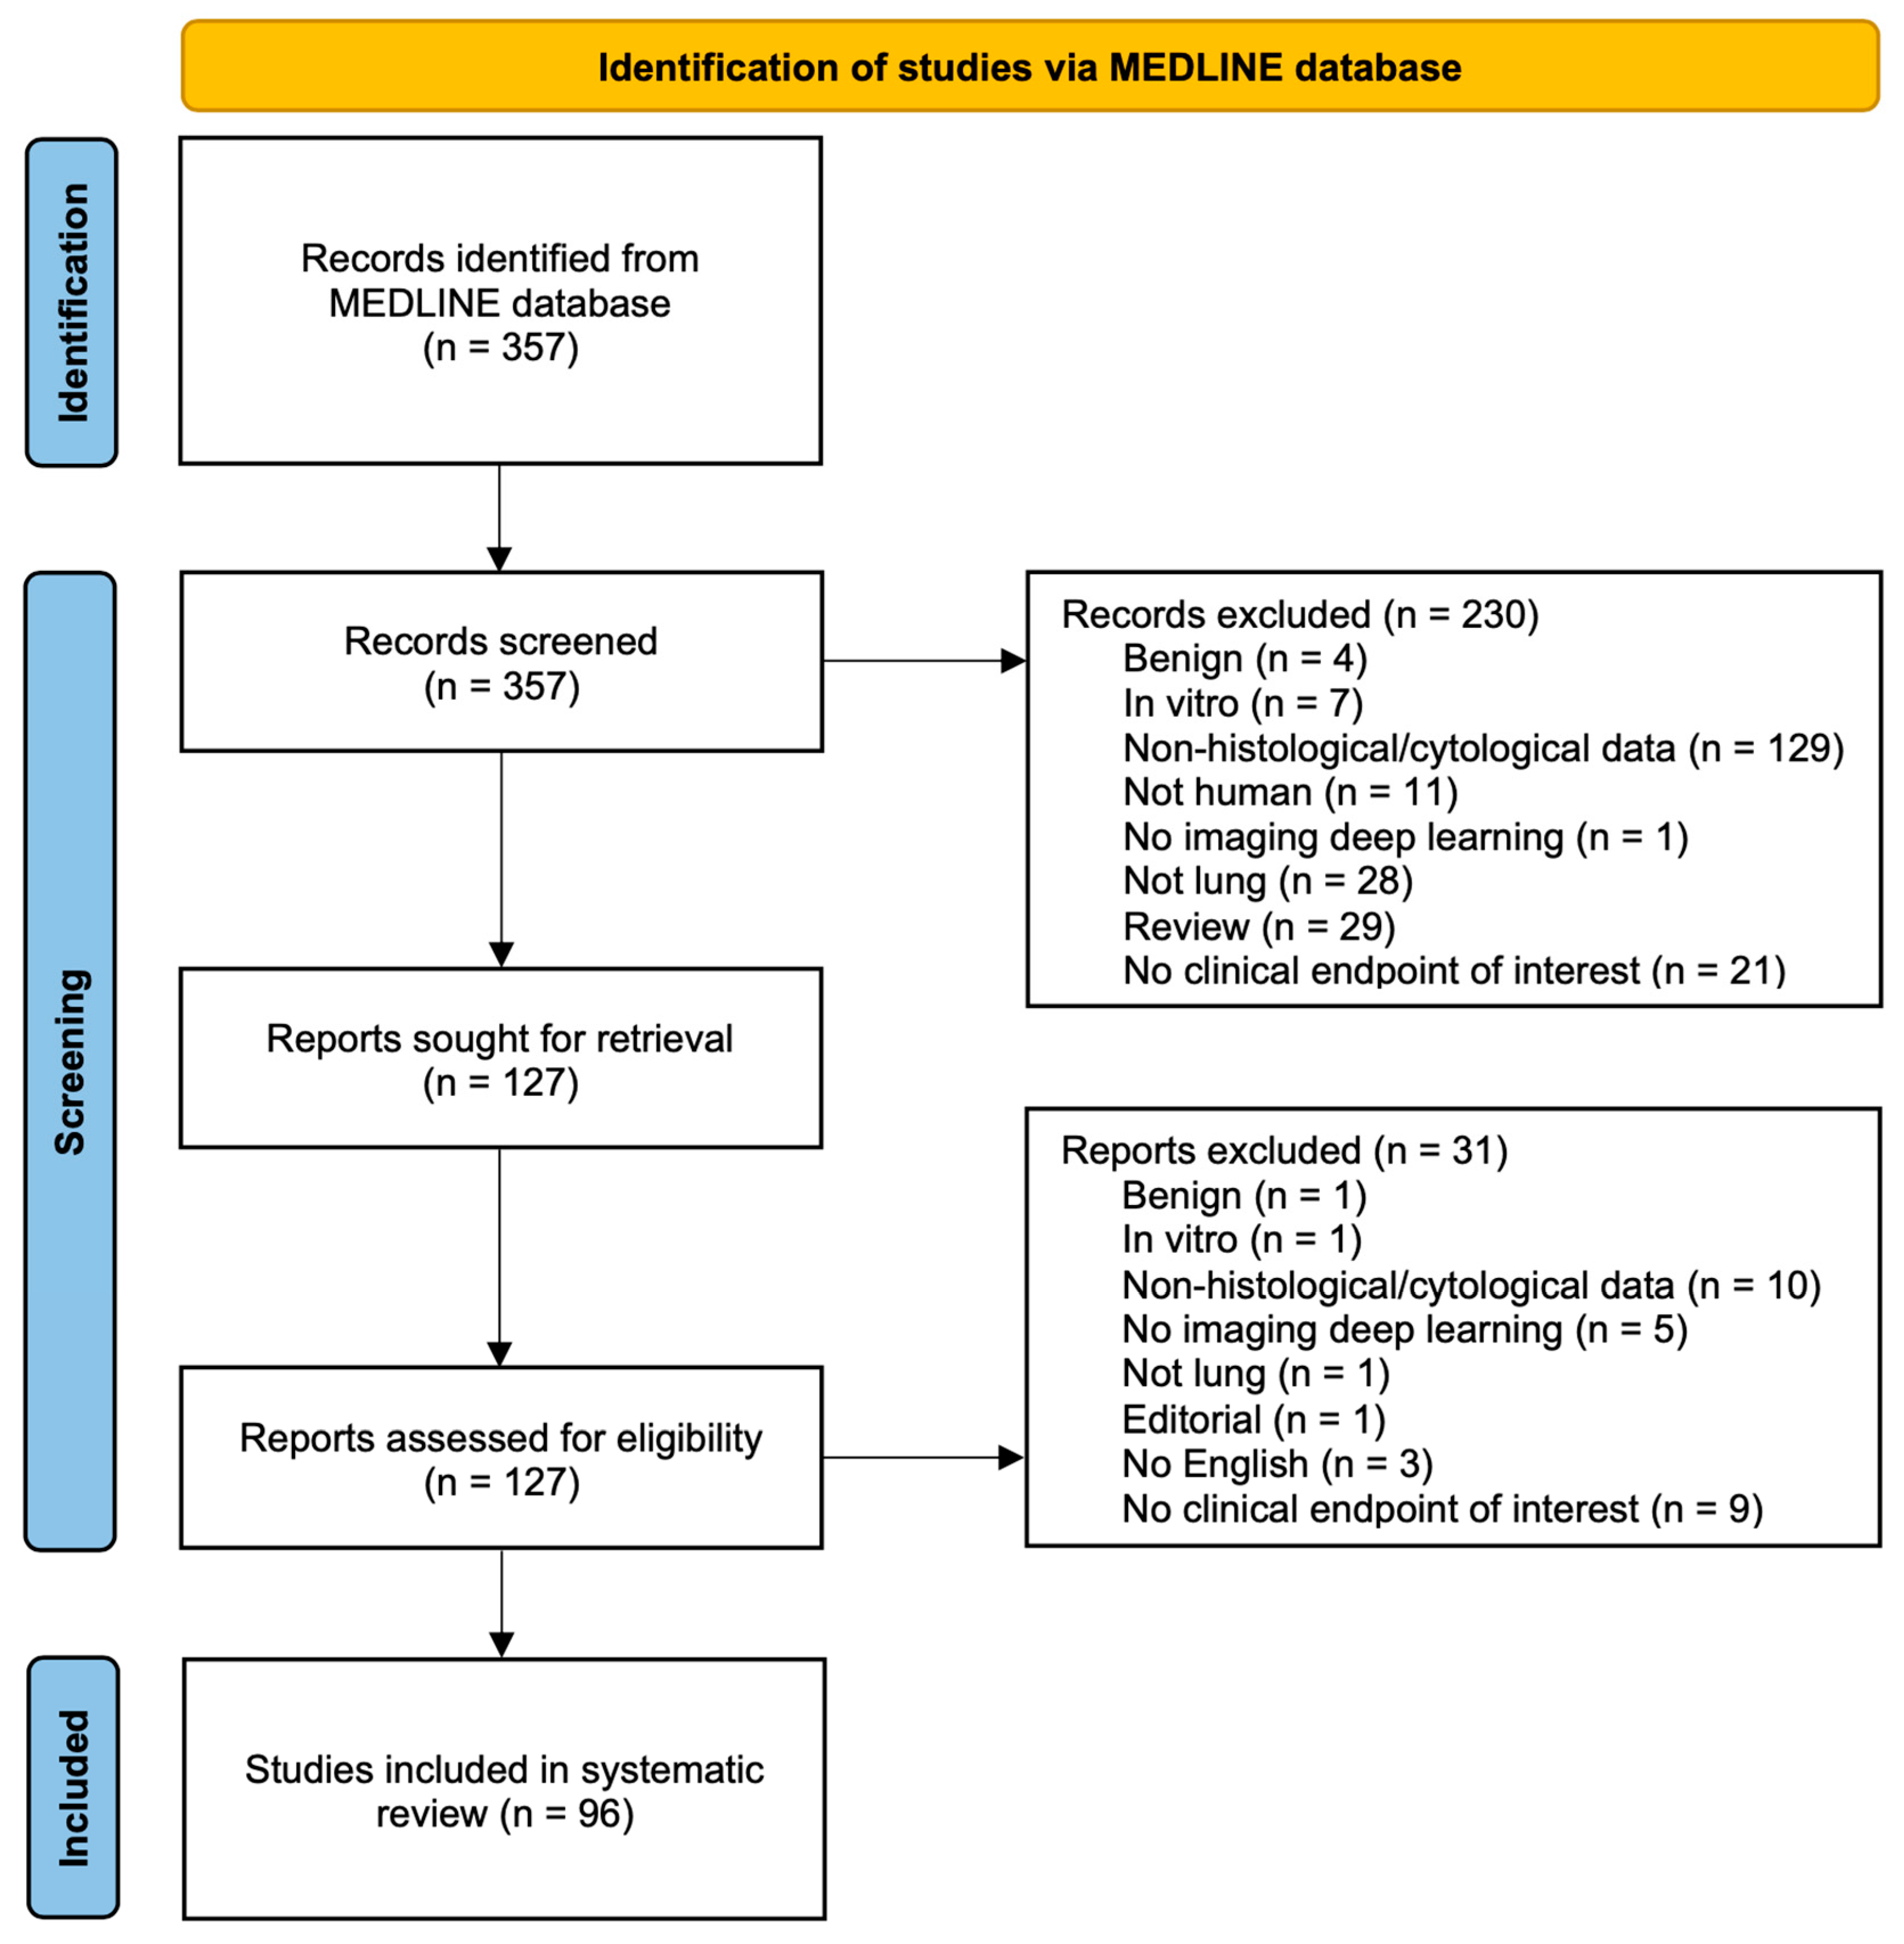
2. Materials and Methods
2.1. Search Strategy
2.2. Study Eligibility Criteria
2.3. Study Selection
2.4. Data Extraction
3. Results
3.1. Histology
3.1.1. Diagnosis
3.1.2. Lung Cancer Classification
3.1.3. NSCLC Subtypes Classification
3.1.4. Lung ADC Predominant Architectural Patterns Classification
3.1.5. Prediction of Prognosis and Survival
3.1.6. Prediction of Significant Molecular Alterations
3.2. Cytology
3.3. PD-L1 Expression Status
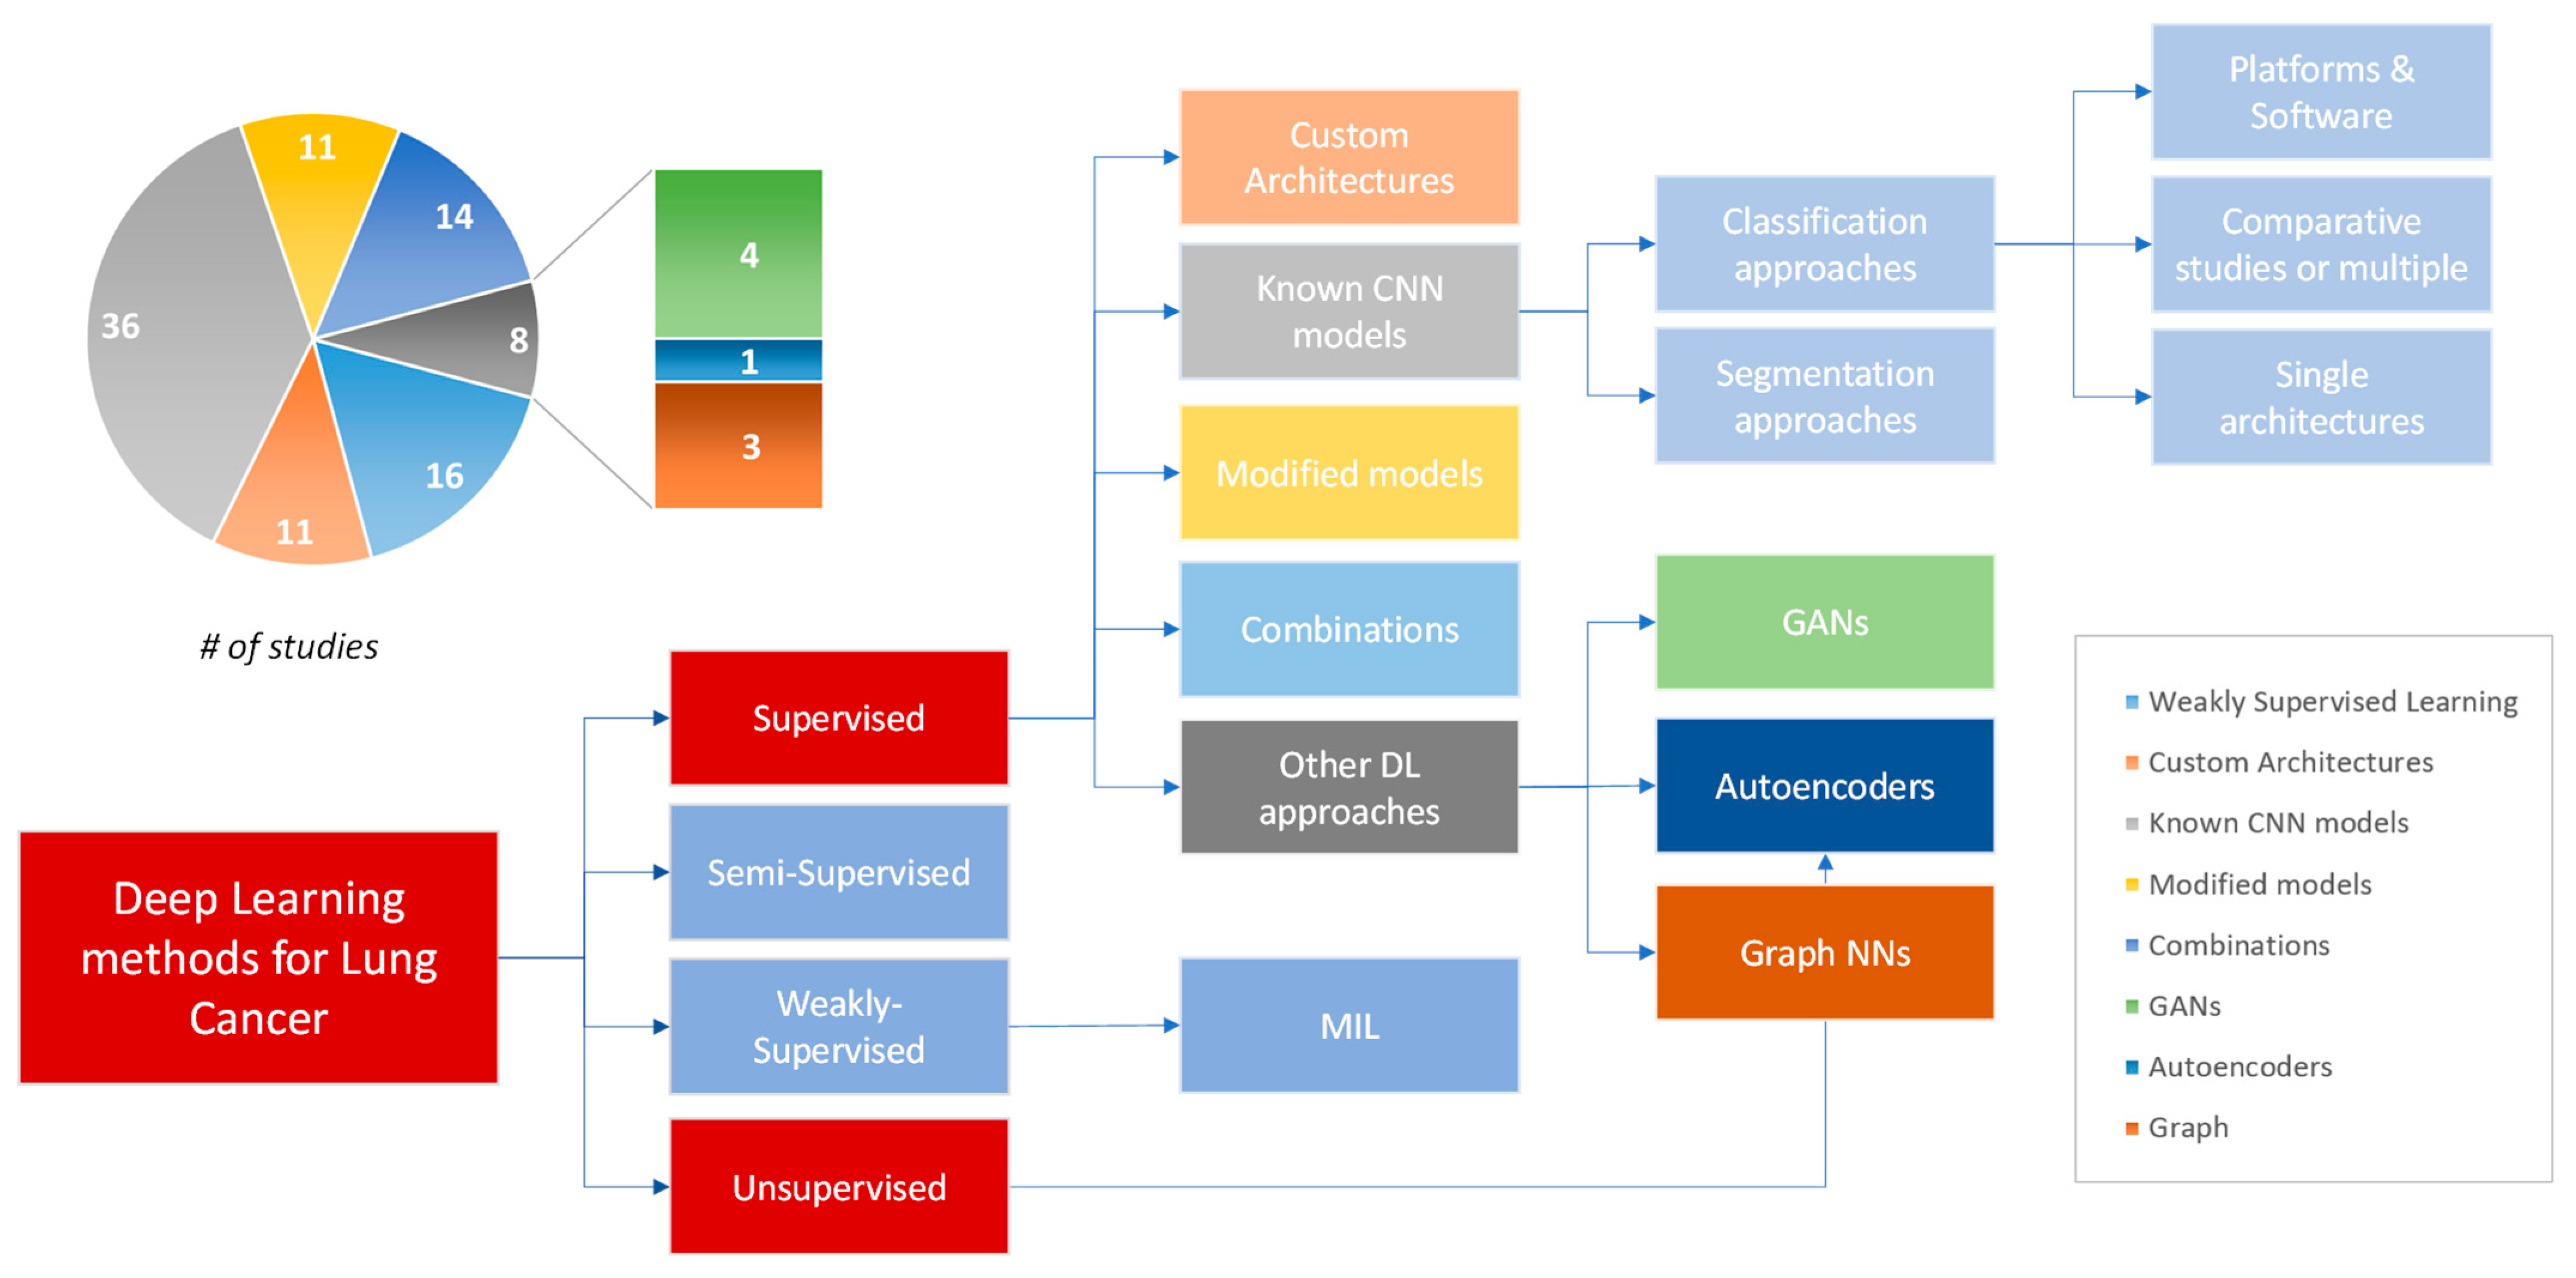
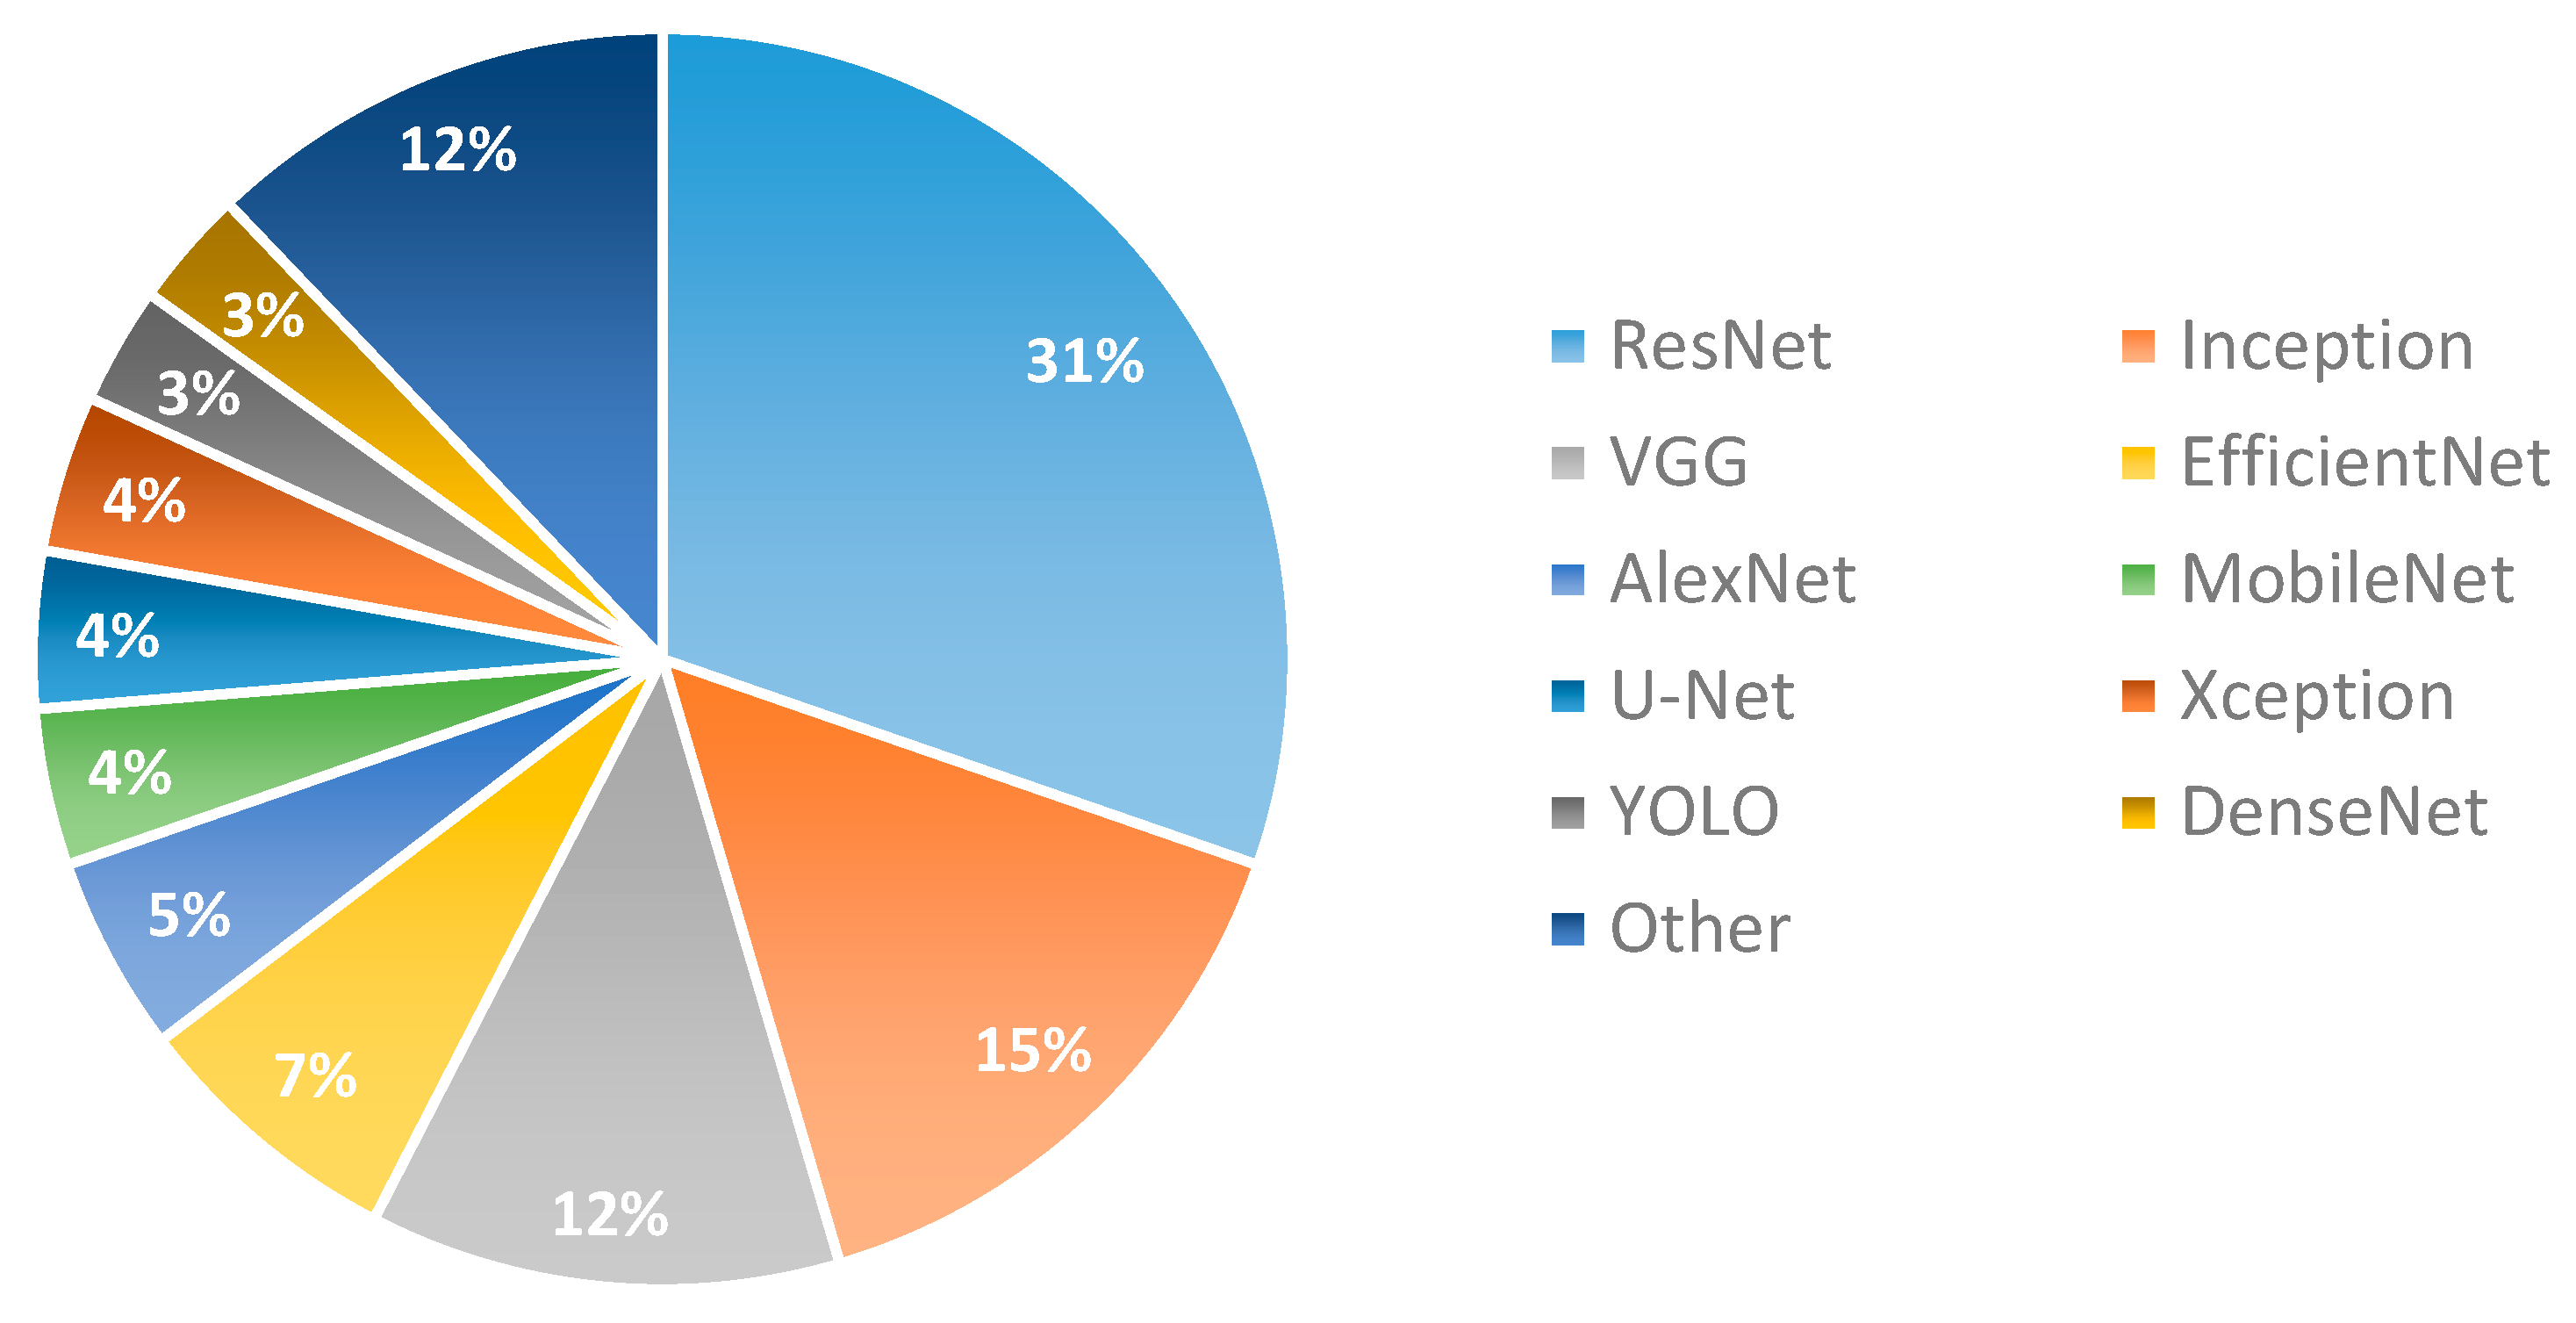
3.4. Deep Learning Approaches
4. Discussion
5. Conclusions
Author Contributions
Funding
Institutional Review Board Statement
Informed Consent Statement
Data Availability Statement
Acknowledgments
Conflicts of Interest
References
- Sung, H.; Ferlay, J.; Siegel, R.L.; Laversanne, M.; Soerjomataram, I.; Jemal, A.; Bray, F. Global Cancer Statistics 2020: GLOBOCAN Estimates of Incidence and Mortality Worldwide for 36 Cancers in 185 Countries. CA Cancer J. Clin. 2021, 71, 209–249. [Google Scholar] [CrossRef]
- WHO Classification of Tumours Editorial Board (Ed.) WHO Classification of Tumours. In Thoracic Tumours, 5th ed.; International Agency for Research on Cancer: Lyon, France, 2021; ISBN 978-92-832-4506-3. [Google Scholar]
- Anand, K.; Phung, T.L.; Bernicker, E.H.; Cagle, P.T.; Olsen, R.J.; Thomas, J.S. Clinical Utility of Reflex Ordered Testing for Molecular Biomarkers in Lung Adenocarcinoma. Clin. Lung Cancer 2020, 21, 437–442. [Google Scholar] [CrossRef]
- Rodriguez-Canales, J.; Parra-Cuentas, E.; Wistuba, I.I. Diagnosis and Molecular Classification of Lung Cancer; Springer: Cham, Switzerland, 2016; pp. 25–46. [Google Scholar] [CrossRef]
- Malapelle, U.; Leprieur, E.G.; Kamga, P.T.; Chiasseu, M.T.; Rolfo, C. Editorial: Emerging Biomarkers for NSCLC: Recent Advances in Diagnosis and Therapy. Front. Oncol. 2021, 11, 694578. [Google Scholar] [CrossRef] [PubMed]
- Lindeman, N.I.; Cagle, P.T.; Aisner, D.L.; Arcila, M.E.; Beasley, M.B.; Bernicker, E.H.; Colasacco, C.; Dacic, S.; Hirsch, F.R.; Kerr, K.; et al. Updated Molecular Testing Guideline for the Selection of Lung Cancer Patients for Treatment with Targeted Tyrosine Kinase Inhibitors: Guideline from the College of American Pathologists, the International Association for the Study of Lung Cancer, and the Association for Molecular Pathology. Arch. Pathol. Lab. Med. 2018, 142, 321–346. [Google Scholar] [CrossRef] [PubMed]
- Osmani, L.; Askin, F.; Gabrielson, E.; Li, Q.K. Current WHO Guidelines and the Critical Role of Immunohistochemical Markers in the Subclassification of Non-Small Cell Lung Carcinoma (NSCLC): Moving from Targeted Therapy to Immunotherapy. Semin. Cancer Biol. 2018, 52, 103–109. [Google Scholar] [CrossRef] [PubMed]
- Udall, M.; Rizzo, M.; Kenny, J.; Doherty, J.; Dahm, S.; Robbins, P.; Faulkner, E. PD-L1 Diagnostic Tests: A Systematic Literature Review of Scoring Algorithms and Test-Validation Metrics. Diagn. Pathol. 2018, 13, 12. [Google Scholar] [CrossRef]
- Kim, H.; Kwon, H.J.; Park, S.Y.; Park, E.; Chung, J.-H. PD-L1 Immunohistochemical Assays for Assessment of Therapeutic Strategies Involving Immune Checkpoint Inhibitors in Non-Small Cell Lung Cancer: A Comparative Study. Oncotarget 2017, 8, 98524–98532. [Google Scholar] [CrossRef]
- Wynes, M.W.; Sholl, L.M.; Dietel, M.; Schuuring, E.; Tsao, M.S.; Yatabe, Y.; Tubbs, R.R.; Hirsch, F.R. An International Interpretation Study Using the ALK IHC Antibody D5F3 and a Sensitive Detection Kit Demonstrates High Concordance between ALK IHC and ALK FISH and between Evaluators. J. Thorac. Oncol. 2014, 9, 631–638. [Google Scholar] [CrossRef]
- Zacharias, M.; Absenger, G.; Kashofer, K.; Wurm, R.; Lindenmann, J.; Terbuch, A.; Konjic, S.; Sauer, S.; Gollowitsch, F.; Gorkiewicz, G.; et al. Reflex Testing in Non-Small Cell Lung Carcinoma Using DNA- and RNA-Based next-Generation Sequencing—A Single-Center Experience. Transl. Lung Cancer Res. 2021, 10, 4221–4234. [Google Scholar] [CrossRef]
- Wang, S.; Yang, D.M.; Rong, R.; Zhan, X.; Fujimoto, J.; Liu, H.; Minna, J.; Wistuba, I.I.; Xie, Y.; Xiao, G. Artificial Intelligence in Lung Cancer Pathology Image Analysis. Cancers 2019, 11, 1673. [Google Scholar] [CrossRef]
- Baxi, V.; Edwards, R.; Montalto, M.; Saha, S. Digital Pathology and Artificial Intelligence in Translational Medicine and Clinical Practice. Mod. Pathol. 2022, 35, 23–32. [Google Scholar] [CrossRef] [PubMed]
- Travis, W.D.; Brambilla, E.; Noguchi, M.; Nicholson, A.G.; Geisinger, K.R.; Yatabe, Y.; Beer, D.G.; Powell, C.A.; Riely, G.J.; Van Schil, P.E.; et al. International Association for the Study of Lung Cancer/American Thoracic Society/European Respiratory Society International Multidisciplinary Classification of Lung Adenocarcinoma. J. Thorac. Oncol. 2011, 6, 244–285. [Google Scholar] [CrossRef] [PubMed]
- Bubendorf, L.; Lantuejoul, S.; de Langen, A.J.; Thunnissen, E. Nonsmall Cell Lung Carcinoma: Diagnostic Difficulties in Small Biopsies and Cytological Specimens. Eur. Respir. Rev. 2017, 26, 170007. [Google Scholar] [CrossRef] [PubMed]
- Page, M.J.; McKenzie, J.E.; Bossuyt, P.M.; Boutron, I.; Hoffmann, T.C.; Mulrow, C.D.; Shamseer, L.; Tetzlaff, J.M.; Akl, E.A.; Brennan, S.E.; et al. The PRISMA 2020 Statement: An Updated Guideline for Reporting Systematic Reviews. Int. J. Surg. 2021, 88, 105906. [Google Scholar] [CrossRef]
- Ouzzani, M.; Hammady, H.; Fedorowicz, Z.; Elmagarmid, A. Rayyan—A Web and Mobile App for Systematic Reviews. Syst. Rev. 2016, 5, 210. [Google Scholar] [CrossRef]
- Jain, D.K.; Lakshmi, K.M.; Varma, K.P.; Ramachandran, M.; Bharati, S. Lung Cancer Detection Based on Kernel PCA-Convolution Neural Network Feature Extraction and Classification by Fast Deep Belief Neural Network in Disease Management Using Multimedia Data Sources. Comput. Intell. Neurosci. 2022, 2022, 3149406. [Google Scholar] [CrossRef]
- Jiao, Y.; Yuan, J.; Qiang, Y.; Fei, S. Deep Embeddings and Logistic Regression for Rapid Active Learning in Histopathological Images. Comput. Methods Programs Biomed. 2021, 212, 106464. [Google Scholar] [CrossRef]
- Kanavati, F.; Toyokawa, G.; Momosaki, S.; Rambeau, M.; Kozuma, Y.; Shoji, F.; Yamazaki, K.; Takeo, S.; Iizuka, O.; Tsuneki, M. Weakly-Supervised Learning for Lung Carcinoma Classification Using Deep Learning. Sci. Rep. 2020, 10, 9297. [Google Scholar] [CrossRef]
- Moranguinho, J.; Pereira, T.; Ramos, B.; Morgado, J.; Costa, J.L.; Oliveira, H.P. Attention Based Deep Multiple Instance Learning Approach for Lung Cancer Prediction Using Histopathological Images. In Proceedings of the 2021 43rd Annual International Conference of the IEEE Engineering in Medicine & Biology Society (EMBC), Guadalajara, Jalisco, Mexico, 1–5 November 2021; pp. 2852–2855. [Google Scholar] [CrossRef]
- Tsuneki, M.; Kanavati, F. Weakly Supervised Learning for Multi-Organ Adenocarcinoma Classification in Whole Slide Images. PLoS ONE 2022, 17, e0275378. [Google Scholar] [CrossRef]
- Civit-Masot, J.; Bañuls-Beaterio, A.; Domínguez-Morales, M.; Rivas-Pérez, M.; Muñoz-Saavedra, L.; Rodríguez Corral, J.M. Non-Small Cell Lung Cancer Diagnosis Aid with Histopathological Images Using Explainable Deep Learning Techniques. Comput. Methods Programs Biomed. 2022, 226, 107108. [Google Scholar] [CrossRef]
- Kanavati, F.; Toyokawa, G.; Momosaki, S.; Takeoka, H.; Okamoto, M.; Yamazaki, K.; Takeo, S.; Iizuka, O.; Tsuneki, M. A Deep Learning Model for the Classification of Indeterminate Lung Carcinoma in Biopsy Whole Slide Images. Sci. Rep. 2021, 11, 8110. [Google Scholar] [CrossRef]
- Wang, X.; Chen, H.; Gan, C.; Lin, H.; Dou, Q.; Tsougenis, E.; Huang, Q.; Cai, M.; Heng, P.-A. Weakly Supervised Deep Learning for Whole Slide Lung Cancer Image Analysis. IEEE Trans. Cybern. 2020, 50, 3950–3962. [Google Scholar] [CrossRef]
- Yang, H.; Chen, L.; Cheng, Z.; Yang, M.; Wang, J.; Lin, C.; Wang, Y.; Huang, L.; Chen, Y.; Peng, S.; et al. Deep Learning-Based Six-Type Classifier for Lung Cancer and Mimics from Histopathological Whole Slide Images: A Retrospective Study. BMC Med. 2021, 19, 80. [Google Scholar] [CrossRef] [PubMed]
- Yang, J.W.; Song, D.H.; An, H.J.; Seo, S.B. Classification of Subtypes Including LCNEC in Lung Cancer Biopsy Slides Using Convolutional Neural Network from Scratch. Sci. Rep. 2022, 12, 1830. [Google Scholar] [CrossRef] [PubMed]
- Kosaraju, S.; Park, J.; Lee, H.; Yang, J.W.; Kang, M. Deep Learning-Based Framework for Slide-Based Histopathological Image Analysis. Sci. Rep. 2022, 12, 19075. [Google Scholar] [CrossRef]
- Kriegsmann, M.; Haag, C.; Weis, C.A.; Steinbuss, G.; Warth, A.; Zgorzelski, C.; Muley, T.; Winter, H.; Eichhorn, M.E.; Eichhorn, F.; et al. Deep Learning for the Classification of Small-Cell and Non-Small-Cell Lung Cancer. Cancers 2020, 12, 1604. [Google Scholar] [CrossRef] [PubMed]
- Ilié, M.; Benzaquen, J.; Tourniaire, P.; Heeke, S.; Ayache, N.; Delingette, H.; Long-Mira, E.; Lassalle, S.; Hamila, M.; Fayada, J.; et al. Deep Learning Facilitates Distinguishing Histologic Subtypes of Pulmonary Neuroendocrine Tumors on Digital Whole-Slide Images. Cancers 2022, 14, 1740. [Google Scholar] [CrossRef]
- Chen, Y.; Yang, H.; Cheng, Z.; Chen, L.; Peng, S.; Wang, J.; Yang, M.; Lin, C.; Chen, Y.; Wang, Y.; et al. A Whole-Slide Image (WSI)-Based Immunohistochemical Feature Prediction System Improves the Subtyping of Lung Cancer. Lung Cancer 2022, 165, 18–27. [Google Scholar] [CrossRef]
- Mengash, H.A.; Alamgeer, M.; Maashi, M.; Othman, M.; Hamza, M.A.; Ibrahim, S.S.; Zamani, A.S.; Yaseen, I. Leveraging Marine Predators Algorithm with Deep Learning for Lung and Colon Cancer Diagnosis. Cancers 2023, 15, 1591. [Google Scholar] [CrossRef]
- Al-Jabbar, M.; Alshahrani, M.; Senan, E.M.; Ahmed, I.A. Histopathological Analysis for Detecting Lung and Colon Cancer Malignancies Using Hybrid Systems with Fused Features. Bioengineering 2023, 10, 383. [Google Scholar] [CrossRef]
- Wang, Z.; Bi, Y.; Pan, T.; Wang, X.; Bain, C.; Bassed, R.; Imoto, S.; Yao, J.; Daly, R.J.; Song, J. Targeting Tumor Heterogeneity: Multiplex-Detection-Based Multiple Instance Learning for Whole Slide Image Classification. Bioinformatics 2023, 39, btad114. [Google Scholar] [CrossRef]
- Patil, A.; Diwakar, H.; Sawant, J.; Kurian, N.C.; Yadav, S.; Rane, S.; Bameta, T.; Sethi, A. Efficient Quality Control of Whole Slide Pathology Images with Human-in-the-Loop Training. J. Pathol. Inform. 2023, 14, 100306. [Google Scholar] [CrossRef]
- El-Ghany, S.A.; Azad, M.; Elmogy, M. Robustness Fine-Tuning Deep Learning Model for Cancers Diagnosis Based on Histopathology Image Analysis. Diagnostics 2023, 13, 699. [Google Scholar] [CrossRef] [PubMed]
- Zheng, Y.; Gindra, R.H.; Green, E.J.; Burks, E.J.; Betke, M.; Beane, J.E.; Kolachalama, V.B. A Graph-Transformer for Whole Slide Image Classification. IEEE Trans. Med. Imaging 2022, 41, 3003–3015. [Google Scholar] [CrossRef] [PubMed]
- Liu, Y.; Wang, H.; Song, K.; Sun, M.; Shao, Y.; Xue, S.; Li, L.; Li, Y.; Cai, H.; Jiao, Y.; et al. CroReLU: Cross-Crossing Space-Based Visual Activation Function for Lung Cancer Pathology Image Recognition. Cancers 2022, 14, 5181. [Google Scholar] [CrossRef]
- Attallah, O.; Aslan, M.F.; Sabanci, K. A Framework for Lung and Colon Cancer Diagnosis via Lightweight Deep Learning Models and Transformation Methods. Diagnostics 2022, 12, 2926. [Google Scholar] [CrossRef] [PubMed]
- Wang, Z.; Xu, Y.; Tian, L.; Chi, Q.; Zhao, F.; Xu, R.; Jin, G.; Liu, Y.; Zhen, J.; Zhang, S. A Multi-Task Convolutional Neural Network for Lesion Region Segmentation and Classification of Non-Small Cell Lung Carcinoma. Diagnostics 2022, 12, 1849. [Google Scholar] [CrossRef]
- Le Page, A.L.; Ballot, E.; Truntzer, C.; Derangère, V.; Ilie, A.; Rageot, D.; Bibeau, F.; Ghiringhelli, F. Using a Convolutional Neural Network for Classification of Squamous and Non-Squamous Non-Small Cell Lung Cancer Based on Diagnostic Histopathology HES Images. Sci. Rep. 2021, 11, 23912. [Google Scholar] [CrossRef] [PubMed]
- Wang, X.; Yu, G.; Yan, Z.; Wan, L.; Wang, W.; Cui, L. Lung Cancer Subtype Diagnosis by Fusing Image-Genomics Data and Hybrid Deep Networks. IEEE/ACM Trans. Comput. Biol. Bioinform. 2023, 20, 512–523. [Google Scholar] [CrossRef]
- Zhao, L.; Xu, X.; Hou, R.; Zhao, W.; Zhong, H.; Teng, H.; Han, Y.; Fu, X.; Sun, J.; Zhao, J. Lung Cancer Subtype Classification Using Histopathological Images Based on Weakly Supervised Multi-Instance Learning. Phys. Med. Biol. 2021, 66, 235013. [Google Scholar] [CrossRef]
- Dehkharghanian, T.; Rahnamayan, S.; Riasatian, A.; Bidgoli, A.A.; Kalra, S.; Zaveri, M.; Babaie, M.; Seyed Sajadi, M.S.; Gonzalelz, R.; Diamandis, P.; et al. Selection, Visualization, and Interpretation of Deep Features in Lung Adenocarcinoma and Squamous Cell Carcinoma. Am. J. Pathol. 2021, 191, 2172–2183. [Google Scholar] [CrossRef] [PubMed]
- Toğaçar, M. Disease Type Detection in Lung and Colon Cancer Images Using the Complement Approach of Inefficient Sets. Comput. Biol. Med. 2021, 137, 104827. [Google Scholar] [CrossRef] [PubMed]
- Carrillo-Perez, F.; Morales, J.C.; Castillo-Secilla, D.; Molina-Castro, Y.; Guillén, A.; Rojas, I.; Herrera, L.J. Non-Small-Cell Lung Cancer Classification via RNA-Seq and Histology Imaging Probability Fusion. BMC Bioinform. 2021, 22, 454. [Google Scholar] [CrossRef] [PubMed]
- Lu, M.Y.; Williamson, D.F.K.; Chen, T.Y.; Chen, R.J.; Barbieri, M.; Mahmood, F. Data-Efficient and Weakly Supervised Computational Pathology on Whole-Slide Images. Nat. Biomed. Eng. 2021, 5, 555–570. [Google Scholar] [CrossRef]
- Chen, C.L.; Chen, C.C.; Yu, W.H.; Chen, S.H.; Chang, Y.C.; Hsu, T.I.; Hsiao, M.; Yeh, C.Y.; Chen, C.Y. An Annotation-Free Whole-Slide Training Approach to Pathological Classification of Lung Cancer Types Using Deep Learning. Nat. Commun. 2021, 12, 1193. [Google Scholar] [CrossRef]
- Masud, M.; Sikder, N.; Nahid, A.-A.; Bairagi, A.K.; AlZain, M.A. A Machine Learning Approach to Diagnosing Lung and Colon Cancer Using a Deep Learning-Based Classification Framework. Sensors 2021, 21, 748. [Google Scholar] [CrossRef]
- Wang, Y.; Coudray, N.; Zhao, Y.; Li, F.; Hu, C.; Zhang, Y.-Z.; Imoto, S.; Tsirigos, A.; Webb, G.I.; Daly, R.J.; et al. HEAL: An Automated Deep Learning Framework for Cancer Histopathology Image Analysis. Bioinformatics 2021, 37, 4291–4295. [Google Scholar] [CrossRef]
- Kobayashi, K.; Bolatkan, A.; Shiina, S.; Hamamoto, R. Fully-Connected Neural Networks with Reduced Parameterization for Predicting Histological Types of Lung Cancer from Somatic Mutations. Biomolecules 2020, 10, 1249. [Google Scholar] [CrossRef]
- Xu, X.; Hou, R.; Zhao, W.; Teng, H.; Sun, J.; Zhao, J. A Weak Supervision-Based Framework for Automatic Lung Cancer Classification on Whole Slide Image. In Proceedings of the 2020 42nd Annual International Conference of the IEEE Engineering in Medicine & Biology Society (EMBC), Montreal, QC, Canada, 20–24 July 2020; pp. 1372–1375. [Google Scholar] [CrossRef]
- Yu, K.H.; Wang, F.; Berry, G.J.; Ré, C.; Altman, R.B.; Snyder, M.; Kohane, I.S. Classifying Non-Small Cell Lung Cancer Types and Transcriptomic Subtypes Using Convolutional Neural Networks. J. Am. Med. Inform. Assoc. 2020, 27, 757–769. [Google Scholar] [CrossRef]
- Shi, X.; Su, H.; Xing, F.; Liang, Y.; Qu, G.; Yang, L. Graph Temporal Ensembling Based Semi-Supervised Convolutional Neural Network with Noisy Labels for Histopathology Image Analysis. Med. Image Anal. 2020, 60, 101624. [Google Scholar] [CrossRef]
- Khosravi, P.; Kazemi, E.; Imielinski, M.; Elemento, O.; Hajirasouliha, I. Deep Convolutional Neural Networks Enable Discrimination of Heterogeneous Digital Pathology Images. EBioMedicine 2018, 27, 317–328. [Google Scholar] [CrossRef] [PubMed]
- Coudray, N.; Ocampo, P.S.; Sakellaropoulos, T.; Narula, N.; Snuderl, M.; Fenyö, D.; Moreira, A.L.; Razavian, N.; Tsirigos, A. Classification and Mutation Prediction from Non–Small Cell Lung Cancer Histopathology Images Using Deep Learning. Nat. Med. 2018, 24, 1559–1567. [Google Scholar] [CrossRef] [PubMed]
- Hou, L.; Samaras, D.; Kurc, T.M.; Gao, Y.; Davis, J.E.; Saltz, J.H. Patch-Based Convolutional Neural Network for Whole Slide Tissue Image Classification. In Proceedings of the 2016 IEEE Conference on Computer Vision and Pattern Recognition (CVPR), Las Vegas, NV, USA, 27–30 June 2016; Volume 2016, pp. 2424–2433. [Google Scholar] [CrossRef]
- Dolezal, J.M.; Srisuwananukorn, A.; Karpeyev, D.; Ramesh, S.; Kochanny, S.; Cody, B.; Mansfield, A.S.; Rakshit, S.; Bansal, R.; Bois, M.C.; et al. Uncertainty-Informed Deep Learning Models Enable High-Confidence Predictions for Digital Histopathology. Nat. Commun. 2022, 13, 6572. [Google Scholar] [CrossRef]
- Tavolara, T.E.; Gurcan, M.N.; Niazi, M.K.K. Contrastive Multiple Instance Learning: An Unsupervised Framework for Learning Slide-Level Representations of Whole Slide Histopathology Images without Labels. Cancers 2022, 14, 5778. [Google Scholar] [CrossRef] [PubMed]
- Liu, M.; Li, L.; Wang, H.; Guo, X.; Liu, Y.; Li, Y.; Song, K.; Shao, Y.; Wu, F.; Zhang, J.; et al. A Multilayer Perceptron-Based Model Applied to Histopathology Image Classification of Lung Adenocarcinoma Subtypes. Front. Oncol. 2023, 13, 1172234. [Google Scholar] [CrossRef] [PubMed]
- Antonio, V.A.A.; Ono, N.; Saito, A.; Sato, T.; Altaf-Ul-Amin, M.; Kanaya, S. Classification of Lung Adenocarcinoma Transcriptome Subtypes from Pathological Images Using Deep Convolutional Networks. Int. J. Comput. Assist. Radiol. Surg. 2018, 13, 1905–1913. [Google Scholar] [CrossRef]
- Sadhwani, A.; Chang, H.-W.; Behrooz, A.; Brown, T.; Auvigne-Flament, I.; Patel, H.; Findlater, R.; Velez, V.; Tan, F.; Tekiela, K.; et al. Comparative Analysis of Machine Learning Approaches to Classify Tumor Mutation Burden in Lung Adenocarcinoma Using Histopathology Images. Sci. Rep. 2021, 11, 16605. [Google Scholar] [CrossRef]
- Wei, J.W.; Tafe, L.J.; Linnik, Y.A.; Vaickus, L.J.; Tomita, N.; Hassanpour, S. Pathologist-Level Classification of Histologic Patterns on Resected Lung Adenocarcinoma Slides with Deep Neural Networks. Sci. Rep. 2019, 9, 3358. [Google Scholar] [CrossRef]
- Gertych, A.; Swiderska-Chadaj, Z.; Ma, Z.; Ing, N.; Markiewicz, T.; Cierniak, S.; Salemi, H.; Guzman, S.; Walts, A.E.; Knudsen, B.S. Convolutional Neural Networks Can Accurately Distinguish Four Histologic Growth Patterns of Lung Adenocarcinoma in Digital Slides. Sci. Rep. 2019, 9, 1483. [Google Scholar] [CrossRef]
- DiPalma, J.; Suriawinata, A.A.; Tafe, L.J.; Torresani, L.; Hassanpour, S. Resolution-Based Distillation for Efficient Histology Image Classification. Artif. Intell. Med. 2021, 119, 102136. [Google Scholar] [CrossRef]
- Xiao, W.; Jiang, Y.; Yao, Z.; Zhou, X.; Sui, X.; Zheng, Y. LAD-GCN: Automatic Diagnostic Framework for Quantitative Estimation of Growth Patterns during Clinical Evaluation of Lung Adenocarcinoma. Front. Physiol. 2022, 13, 946099. [Google Scholar] [CrossRef]
- Sheikh, T.S.; Kim, J.Y.; Shim, J.; Cho, M. Unsupervised Learning Based on Multiple Descriptors for WSIs Diagnosis. Diagnostics 2022, 12, 1480. [Google Scholar] [CrossRef] [PubMed]
- Gao, Y.; Ding, Y.; Xiao, W.; Yao, Z.; Zhou, X.; Sui, X.; Zhao, Y.; Zheng, Y. A Semi-Supervised Learning Framework for Micropapillary Adenocarcinoma Detection. Int. J. Comput. Assist. Radiol. Surg. 2022, 17, 639–648. [Google Scholar] [CrossRef]
- Maleki, F.; Ovens, K.; Gupta, R.; Reinhold, C.; Spatz, A.; Forghani, R. Generalizability of Machine Learning Models: Quantitative Evaluation of Three Methodological Pitfalls. Radiol. Artif. Intell. 2023, 5, e220028. [Google Scholar] [CrossRef]
- Tan, Z.; Xue, H.; Sun, Y.; Zhang, C.; Song, Y.; Qi, Y. The Role of Tumor Inflammatory Microenvironment in Lung Cancer. Front. Pharmacol. 2021, 12, 688625. [Google Scholar] [CrossRef] [PubMed]
- Barmpoutis, P.; Di Capite, M.; Kayhanian, H.; Waddingham, W.; Alexander, D.C.; Jansen, M.; Kwong, F.N.K. Tertiary Lymphoid Structures (TLS) Identification and Density Assessment on H&E-Stained Digital Slides of Lung Cancer. PLoS ONE 2021, 16, e0256907. [Google Scholar] [CrossRef]
- Shim, W.S.; Yim, K.; Kim, T.-J.; Sung, Y.E.; Lee, G.; Hong, J.H.; Chun, S.H.; Kim, S.; An, H.J.; Na, S.J.; et al. DeepRePath: Identifying the Prognostic Features of Early-Stage Lung Adenocarcinoma Using Multi-Scale Pathology Images and Deep Convolutional Neural Networks. Cancers 2021, 13, 308. [Google Scholar] [CrossRef]
- Wu, Z.; Wang, L.; Li, C.; Cai, Y.; Liang, Y.; Mo, X.; Lu, Q.; Dong, L.; Liu, Y. DeepLRHE: A Deep Convolutional Neural Network Framework to Evaluate the Risk of Lung Cancer Recurrence and Metastasis from Histopathology Images. Front. Genet. 2020, 11, 768. [Google Scholar] [CrossRef] [PubMed]
- Wang, S.; Wang, T.; Yang, L.; Yang, D.M.; Fujimoto, J.; Yi, F.; Luo, X.; Yang, Y.; Yao, B.; Lin, S.Y.; et al. ConvPath: A Software Tool for Lung Adenocarcinoma Digital Pathological Image Analysis Aided by a Convolutional Neural Network. EBioMedicine 2019, 50, 103–110. [Google Scholar] [CrossRef]
- Wang, S.; Rong, R.; Yang, D.M.; Fujimoto, J.; Yan, S.; Cai, L.; Yang, L.; Luo, D.; Behrens, C.; Parra, E.R.; et al. Computational Staining of Pathology Images to Study the Tumor Microenvironment in Lung Cancer. Cancer Res. 2020, 80, 2056–2066. [Google Scholar] [CrossRef]
- Shvetsov, N.; Grønnesby, M.; Pedersen, E.; Møllersen, K.; Busund, L.-T.R.; Schwienbacher, R.; Bongo, L.A.; Kilvaer, T.K. A Pragmatic Machine Learning Approach to Quantify Tumor-Infiltrating Lymphocytes in Whole Slide Images. Cancers 2022, 14, 2974. [Google Scholar] [CrossRef] [PubMed]
- Guo, H.; Diao, L.; Zhou, X.; Chen, J.N.; Zhou, Y.; Fang, Q.; He, Y.; Dziadziuszko, R.; Zhou, C.; Hirsch, F.R. Artificial Intelligence-Based Analysis for Immunohistochemistry Staining of Immune Checkpoints to Predict Resected Non-Small Cell Lung Cancer Survival and Relapse. Transl. Lung Cancer Res. 2021, 10, 2452–2474. [Google Scholar] [CrossRef] [PubMed]
- Pham, H.H.N.; Futakuchi, M.; Bychkov, A.; Furukawa, T.; Kuroda, K.; Fukuoka, J. Detection of Lung Cancer Lymph Node Metastases from Whole-Slide Histopathologic Images Using a Two-Step Deep Learning Approach. Am. J. Pathol. 2019, 189, 2428–2439. [Google Scholar] [CrossRef]
- Rączkowski, Ł.; Paśnik, I.; Kukiełka, M.; Nicoś, M.; Budzinska, M.A.; Kucharczyk, T.; Szumiło, J.; Krawczyk, P.; Crosetto, N.; Szczurek, E. Deep Learning-Based Tumor Microenvironment Segmentation Is Predictive of Tumor Mutations and Patient Survival in Non-Small-Cell Lung Cancer. BMC Cancer 2022, 22, 1001. [Google Scholar] [CrossRef]
- Qaiser, T.; Lee, C.-Y.; Vandenberghe, M.; Yeh, J.; Gavrielides, M.A.; Hipp, J.; Scott, M.; Reischl, J. Usability of Deep Learning and H&E Images Predict Disease Outcome-Emerging Tool to Optimize Clinical Trials. NPJ Precis. Oncol. 2022, 6, 37. [Google Scholar] [CrossRef] [PubMed]
- Sakamoto, T.; Furukawa, T.; Pham, H.H.N.; Kuroda, K.; Tabata, K.; Kashima, Y.; Okoshi, E.N.; Morimoto, S.; Bychkov, A.; Fukuoka, J. A Collaborative Workflow between Pathologists and Deep Learning for the Evaluation of Tumour Cellularity in Lung Adenocarcinoma. Histopathology 2022, 81, 758–769. [Google Scholar] [CrossRef]
- Hattori, H.; Sakashita, S.; Tsuboi, M.; Ishii, G.; Tanaka, T. Tumor-Identification Method for Predicting Recurrence of Early-Stage Lung Adenocarcinoma Using Digital Pathology Images by Machine Learning. J. Pathol. Inform. 2023, 14, 100175. [Google Scholar] [CrossRef]
- Pan, X.; Lin, H.; Han, C.; Feng, Z.; Wang, Y.; Lin, J.; Qiu, B.; Yan, L.; Li, B.; Xu, Z.; et al. Computerized Tumor-Infiltrating Lymphocytes Density Score Predicts Survival of Patients with Resectable Lung Adenocarcinoma. iScience 2022, 25, 105605. [Google Scholar] [CrossRef]
- Aprupe, L.; Litjens, G.; Brinker, T.J.; Van Der Laak, J.; Grabe, N. Robust and Accurate Quantification of Biomarkers of Immune Cells in Lung Cancer Micro-Environment Using Deep Convolutional Neural Networks. PeerJ 2019, 7, e6335. [Google Scholar] [CrossRef]
- Yu, F.; Wang, X.; Sali, R.; Li, R. Single-Cell Heterogeneity-Aware Transformer-Guided Multiple Instance Learning for Cancer Aneuploidy Prediction from Whole Slide Histopathology Images. IEEE J. Biomed. Heal. Inform. 2023, 1–11. [Google Scholar] [CrossRef]
- Levy-Jurgenson, A.; Tekpli, X.; Kristensen, V.N.; Yakhini, Z. Spatial Transcriptomics Inferred from Pathology Whole-Slide Images Links Tumor Heterogeneity to Survival in Breast and Lung Cancer. Sci. Rep. 2020, 10, 18802. [Google Scholar] [CrossRef] [PubMed]
- Yang, Y.; Yang, J.; Liang, Y.; Liao, B.; Zhu, W.; Mo, X.; Huang, K. Identification and Validation of Efficacy of Immunological Therapy for Lung Cancer From Histopathological Images Based on Deep Learning. Front. Genet. 2021, 12, 642981. [Google Scholar] [CrossRef] [PubMed]
- Hu, J.; Cui, C.; Yang, W.; Huang, L.; Yu, R.; Liu, S.; Kong, Y. Using Deep Learning to Predict Anti-PD-1 Response in Melanoma and Lung Cancer Patients from Histopathology Images. Transl. Oncol. 2021, 14, 100921. [Google Scholar] [CrossRef] [PubMed]
- Terada, Y.; Takahashi, T.; Hayakawa, T.; Ono, A.; Kawata, T.; Isaka, M.; Muramatsu, K.; Tone, K.; Kodama, H.; Imai, T.; et al. Artificial Intelligence–Powered Prediction of ALK Gene Rearrangement in Patients with Non–Small-Cell Lung Cancer. JCO Clin. Cancer Inform. 2022, 6, e2200070. [Google Scholar] [CrossRef]
- Tomita, N.; Tafe, L.J.; Suriawinata, A.A.; Tsongalis, G.J.; Nasir-Moin, M.; Dragnev, K.; Hassanpour, S. Predicting Oncogene Mutations of Lung Cancer Using Deep Learning and Histopathologic Features on Whole-Slide Images. Transl. Oncol. 2022, 24, 101494. [Google Scholar] [CrossRef]
- Huang, K.; Mo, Z.; Zhu, W.; Liao, B.; Yang, Y.; Wu, F.-X. Prediction of Target-Drug Therapy by Identifying Gene Mutations in Lung Cancer with Histopathological Stained Image and Deep Learning Techniques. Front. Oncol. 2021, 11, 642945. [Google Scholar] [CrossRef]
- Mayer, C.; Ofek, E.; Fridrich, D.E.; Molchanov, Y.; Yacobi, R.; Gazy, I.; Hayun, I.; Zalach, J.; Paz-Yaacov, N.; Barshack, I. Direct Identification of ALK and ROS1 Fusions in Non-Small Cell Lung Cancer from Hematoxylin and Eosin-Stained Slides Using Deep Learning Algorithms. Mod. Pathol. 2022, 35, 1882–1887. [Google Scholar] [CrossRef]
- Niu, Y.; Wang, L.; Zhang, X.; Han, Y.; Yang, C.; Bai, H.; Huang, K.; Ren, C.; Tian, G.; Yin, S.; et al. Predicting Tumor Mutational Burden from Lung Adenocarcinoma Histopathological Images Using Deep Learning. Front. Oncol. 2022, 12, 927426. [Google Scholar] [CrossRef]
- Dammak, S.; Cecchini, M.J.; Breadner, D.; Ward, A.D. Using Deep Learning to Predict Tumor Mutational Burden from Scans of H&E-Stained Multicenter Slides of Lung Squamous Cell Carcinoma. J. Med. Imaging 2023, 10, 017502. [Google Scholar] [CrossRef]
- Pao, J.J.; Biggs, M.; Duncan, D.; Lin, D.I.; Davis, R.; Huang, R.S.P.; Ferguson, D.; Janovitz, T.; Hiemenz, M.C.; Eddy, N.R.; et al. Predicting EGFR Mutational Status from Pathology Images Using a Real-World Dataset. Sci. Rep. 2023, 13, 4404. [Google Scholar] [CrossRef]
- Li, X.; Cen, M.; Xu, J.; Zhang, H.; Xu, X.S. Improving Feature Extraction from Histopathological Images through a Fine-Tuning ImageNet Model. J. Pathol. Inform. 2022, 13, 100115. [Google Scholar] [CrossRef]
- Teramoto, A.; Tsukamoto, T.; Kiriyama, Y.; Fujita, H. Automated Classification of Lung Cancer Types from Cytological Images Using Deep Convolutional Neural Networks. Biomed Res. Int. 2017, 2017, 4067832. [Google Scholar] [CrossRef] [PubMed]
- Teramoto, A.; Tsukamoto, T.; Yamada, A.; Kiriyama, Y.; Imaizumi, K.; Saito, K.; Fujita, H. Deep Learning Approach to Classification of Lung Cytological Images: Two-Step Training Using Actual and Synthesized Images by Progressive Growing of Generative Adversarial Networks. PLoS ONE 2020, 15, 0229951. [Google Scholar] [CrossRef] [PubMed]
- Xie, X.; Fu, C.C.; Lv, L.; Ye, Q.; Yu, Y.; Fang, Q.; Zhang, L.; Hou, L.; Wu, C. Deep Convolutional Neural Network-Based Classification of Cancer Cells on Cytological Pleural Effusion Images. Mod. Pathol. 2022, 35, 609–614. [Google Scholar] [CrossRef] [PubMed]
- Lin, C.-K.; Chang, J.; Huang, C.-C.; Wen, Y.-F.; Ho, C.-C.; Cheng, Y.-C. Effectiveness of Convolutional Neural Networks in the Interpretation of Pulmonary Cytologic Images in Endobronchial Ultrasound Procedures. Cancer Med. 2021, 10, 9047–9057. [Google Scholar] [CrossRef]
- Teramoto, A.; Kiriyama, Y.; Tsukamoto, T.; Sakurai, E.; Michiba, A.; Imaizumi, K.; Saito, K.; Fujita, H. Weakly Supervised Learning for Classification of Lung Cytological Images Using Attention-Based Multiple Instance Learning. Sci. Rep. 2021, 11, 20317. [Google Scholar] [CrossRef]
- Tsukamoto, T.; Teramoto, A.; Yamada, A.; Kiriyama, Y.; Sakurai, E.; Michiba, A.; Imaizumi, K.; Fujita, H. Comparison of Fine-Tuned Deep Convolutional Neural Networks for the Automated Classification of Lung Cancer Cytology Images with Integration of Additional Classifiers. Asian Pac. J. Cancer Prev. 2022, 23, 1315–1324. [Google Scholar] [CrossRef]
- Gonzalez, D.; Dietz, R.L.; Pantanowitz, L. Feasibility of a Deep Learning Algorithm to Distinguish Large Cell Neuroendocrine from Small Cell Lung Carcinoma in Cytology Specimens. Cytopathology 2020, 31, 426–431. [Google Scholar] [CrossRef]
- Wang, C.-W.; Khalil, M.-A.; Lin, Y.-J.; Lee, Y.-C.; Huang, T.-W.; Chao, T.-K. Deep Learning Using Endobronchial-Ultrasound-Guided Transbronchial Needle Aspiration Image to Improve the Overall Diagnostic Yield of Sampling Mediastinal Lymphadenopathy. Diagnostics 2022, 12, 2234. [Google Scholar] [CrossRef]
- Doroshow, D.B.; Bhalla, S.; Beasley, M.B.; Sholl, L.M.; Kerr, K.M.; Gnjatic, S.; Wistuba, I.I.; Rimm, D.L.; Tsao, M.S.; Hirsch, F.R. PD-L1 as a Biomarker of Response to Immune-Checkpoint Inhibitors. Nat. Rev. Clin. Oncol. 2021, 18, 345–362. [Google Scholar] [CrossRef]
- Hopkins, E.; Moffat, D.; Parkinson, I.; Robinson, P.; Jersmann, H.; Dougherty, B.; Birader, M.I.; Francis, K.; Nguyen, P. Cell Block Samples from Endobronchial Ultrasound Transbronchial Needle Aspiration Provide Sufficient Material for Ancillary Testing in Lung Cancer—A Quaternary Referral Centre Experience. J. Thorac. Dis. 2016, 8, 2544–2550. [Google Scholar] [CrossRef] [PubMed]
- Herbst, R.S.; Baas, P.; Kim, D.-W.; Felip, E.; Pérez-Gracia, J.L.; Han, J.-Y.; Molina, J.; Kim, J.-H.; Arvis, C.D.; Ahn, M.-J.; et al. Pembrolizumab versus Docetaxel for Previously Treated, PD-L1-Positive, Advanced Non-Small-Cell Lung Cancer (KEYNOTE-010): A Randomised Controlled Trial. Lancet 2016, 387, 1540–1550. [Google Scholar] [CrossRef] [PubMed]
- Reck, M.; Rodríguez-Abreu, D.; Robinson, A.G.; Hui, R.; Csőszi, T.; Fülöp, A.; Gottfried, M.; Peled, N.; Tafreshi, A.; Cuffe, S.; et al. Pembrolizumab versus Chemotherapy for PD-L1–Positive Non–Small-Cell Lung Cancer. N. Engl. J. Med. 2016, 375, 1823–1833. [Google Scholar] [CrossRef] [PubMed]
- Lantuejoul, S.; Damotte, D.; Hofman, V.; Adam, J. Programmed Death Ligand 1 Immunohistochemistry in Non-Small Cell Lung Carcinoma. J. Thorac. Dis. 2019, 11, S89–S101. [Google Scholar] [CrossRef] [PubMed]
- Hondelink, L.M.; Hüyük, M.; Postmus, P.E.; Smit, V.T.H.B.M.; Blom, S.; von der Thüsen, J.H.; Cohen, D. Development and Validation of a Supervised Deep Learning Algorithm for Automated Whole-Slide Programmed Death-Ligand 1 Tumour Proportion Score Assessment in Non-Small Cell Lung Cancer. Histopathology 2022, 80, 635–647. [Google Scholar] [CrossRef]
- Liu, J.; Zheng, Q.; Mu, X.; Zuo, Y.; Xu, B.; Jin, Y.; Wang, Y.; Tian, H.; Yang, Y.; Xue, Q.; et al. Automated Tumor Proportion Score Analysis for PD-L1 (22C3) Expression in Lung Squamous Cell Carcinoma. Sci. Rep. 2021, 11, 15907. [Google Scholar] [CrossRef]
- Wang, X.; Chen, P.; Ding, G.; Xing, Y.; Tang, R.; Peng, C.; Ye, Y.; Fu, Q. Dual-Scale Categorization Based Deep Learning to Evaluate Programmed Cell Death Ligand 1 Expression in Non-Small Cell Lung Cancer. Medicine 2021, 100, E25994. [Google Scholar] [CrossRef]
- Sha, L.; Osinski, B.L.; Ho, I.Y.; Tan, T.L.; Willis, C.; Weiss, H.; Beaubier, N.; Mahon, B.M.; Taxter, T.J.; Yip, S.S.F. Multi-Field-of-View Deep Learning Model Predicts Nonsmall Cell Lung Cancer Programmed Death-Ligand 1 Status from Whole-Slide Hematoxylin and Eosin Images. J. Pathol. Inform. 2019, 10, 24. [Google Scholar] [CrossRef]
- Kapil, A.; Meier, A.; Steele, K.; Rebelatto, M.; Nekolla, K.; Haragan, A.; Silva, A.; Zuraw, A.; Barker, C.; Scott, M.L.; et al. Domain Adaptation-Based Deep Learning for Automated Tumor Cell (TC) Scoring and Survival Analysis on PD-L1 Stained Tissue Images. IEEE Trans. Med. Imaging 2021, 40, 2513–2523. [Google Scholar] [CrossRef]
- Kapil, A.; Meier, A.; Zuraw, A.; Steele, K.E.; Rebelatto, M.C.; Schmidt, G.; Brieu, N. Deep Semi Supervised Generative Learning for Automated Tumor Proportion Scoring on NSCLC Tissue Needle Biopsies. Sci. Rep. 2018, 8, 17343. [Google Scholar] [CrossRef]
- Wu, J.; Liu, C.; Liu, X.; Sun, W.; Li, L.; Gao, N.; Zhang, Y.; Yang, X.; Zhang, J.; Wang, H.; et al. Artificial Intelligence-Assisted System for Precision Diagnosis of PD-L1 Expression in Non-Small Cell Lung Cancer. Mod. Pathol. 2022, 35, 403–411. [Google Scholar] [CrossRef] [PubMed]
- Cheng, G.; Zhang, F.; Xing, Y.; Hu, X.; Zhang, H.; Chen, S.; Li, M.; Peng, C.; Ding, G.; Zhang, D.; et al. Artificial Intelligence-Assisted Score Analysis for Predicting the Expression of the Immunotherapy Biomarker PD-L1 in Lung Cancer. Front. Immunol. 2022, 13, 893198. [Google Scholar] [CrossRef] [PubMed]
- Choi, S.; Cho, S.I.; Ma, M.; Park, S.; Pereira, S.; Aum, B.J.; Shin, S.; Paeng, K.; Yoo, D.; Jung, W.; et al. Artificial Intelligence–Powered Programmed Death Ligand 1 Analyser Reduces Interobserver Variation in Tumour Proportion Score for Non–Small Cell Lung Cancer with Better Prediction of Immunotherapy Response. Eur. J. Cancer 2022, 170, 17–26. [Google Scholar] [CrossRef] [PubMed]
- Huang, Z.; Chen, L.; Lv, L.; Fu, C.C.; Jin, Y.; Zheng, Q.; Wang, B.; Ye, Q.; Fang, Q.; Li, Y. A New AI-Assisted Scoring System for PD-L1 Expression in NSCLC. Comput. Methods Programs Biomed. 2022, 221, 106829. [Google Scholar] [CrossRef]
- Sadoughi, F.; Kazemy, Z.; Hamedan, F.; Owji, L.; Rahmanikatigari, M.; Talebi Azadboni, T. Artificial Intelligence Methods for the Diagnosis of Breast Cancer by Image Processing: A Review. Breast Cancer Targets Ther. 2018, 10, 219–230. [Google Scholar] [CrossRef]
- Robertson, S.; Azizpour, H.; Smith, K.; Hartman, J. Digital Image Analysis in Breast Pathology—From Image Processing Techniques to Artificial Intelligence. Transl. Res. 2018, 194, 19–35. [Google Scholar] [CrossRef]
- Naik, N.; Tokas, T.; Shetty, D.K.; Hameed, B.M.Z.; Shastri, S.; Shah, M.J.; Ibrahim, S.; Rai, B.P.; Chłosta, P.; Somani, B.K. Role of Deep Learning in Prostate Cancer Management: Past, Present and Future Based on a Comprehensive Literature Review. J. Clin. Med. 2022, 11, 3575. [Google Scholar] [CrossRef]
- Reddy, B.S.K.; Balakrishna, R. A Review on Detection of Prostate Cancer Using Deep Learning Techniques. AIP Conf. Proc. 2022, 2463, 020004. [Google Scholar] [CrossRef]
- Davri, A.; Birbas, E.; Kanavos, T.; Ntritsos, G.; Giannakeas, N.; Tzallas, A.T.; Batistatou, A. Deep Learning on Histopathological Images for Colorectal Cancer Diagnosis: A Systematic Review. Diagnostics 2022, 12, 837. [Google Scholar] [CrossRef]
- Rompianesi, G.; Pegoraro, F.; Ceresa, C.D.; Montalti, R.; Troisi, R.I. Artificial Intelligence in the Diagnosis and Management of Colorectal Cancer Liver Metastases. World J. Gastroenterol. 2022, 28, 108–122. [Google Scholar] [CrossRef]
- Thakur, N.; Yoon, H.; Chong, Y. Current Trends of Artificial Intelligence for Colorectal Cancer Pathology Image Analysis: A Systematic Review. Cancers 2020, 12, 1884. [Google Scholar] [CrossRef]
- Li, Y.; Chen, D.; Wu, X.; Yang, W.; Chen, Y. A Narrative Review of Artificial Intelligence-Assisted Histopathologic Diagnosis and Decision-Making for Non-Small Cell Lung Cancer: Achievements and Limitations. J. Thorac. Dis. 2021, 13, 7006–7020. [Google Scholar] [CrossRef] [PubMed]
- Tanaka, I.; Furukawa, T.; Morise, M. The Current Issues and Future Perspective of Artificial Intelligence for Developing New Treatment Strategy in Non-Small Cell Lung Cancer: Harmonization of Molecular Cancer Biology and Artificial Intelligence. Cancer Cell Int. 2021, 21, 454. [Google Scholar] [CrossRef] [PubMed]
- Singhal, N.; Soni, S.; Bonthu, S.; Chattopadhyay, N.; Samanta, P.; Joshi, U.; Jojera, A.; Chharchhodawala, T.; Agarwal, A.; Desai, M.; et al. A Deep Learning System for Prostate Cancer Diagnosis and Grading in Whole Slide Images of Core Needle Biopsies. Sci. Rep. 2022, 12, 3383. [Google Scholar] [CrossRef] [PubMed]
- Li, D.; Han, X.; Gao, J.; Zhang, Q.; Yang, H.; Liao, S.; Guo, H.; Zhang, B. Deep Learning in Prostate Cancer Diagnosis Using Multiparametric Magnetic Resonance Imaging with Whole-Mount Histopathology Referenced Delineations. Front. Med. 2022, 8, 810995. [Google Scholar] [CrossRef]
- Tătaru, O.S.; Vartolomei, M.D.; Rassweiler, J.J.; Virgil, O.; Lucarelli, G.; Porpiglia, F.; Amparore, D.; Manfredi, M.; Carrieri, G.; Falagario, U.; et al. Artificial Intelligence and Machine Learning in Prostate Cancer Patient Management—Current Trends and Future Perspectives. Diagnostics 2021, 11, 354. [Google Scholar] [CrossRef]
- de Sousa, V.M.L.; Carvalho, L. Heterogeneity in Lung Cancer. Pathobiology 2018, 85, 96–107. [Google Scholar] [CrossRef]


| 1st Author, Year | Technical Method | Classification | Dataset | Performance Metrics |
|---|---|---|---|---|
| Jain, 2022 [18] | Kernel PCA combined with Fast Deep Belief Neural Network | Binary: cancerous/normal cells | 15,000 images from LZ2500 dataset, 215 tiles from the NLST dataset and 1634 images from NCI Genomic dataset | Acc: 97.10% in LZ2500 dataset, 98.00% in NLST dataset and 97.50% in NCI Genomic dataset |
| Civit-Masot, 2022 [23] | Custom Architecture with 3 Convolution and 2 dense layers | Binary: benign/malignant | 15,000 images from LC25000 dataset | Overall Acc: 99.69% using 50 epochs |
| Tsuneki, 2022 [22] | Weakly supervised learning using EfficientNet-B1 | Binary: ADC/non-ADC | 8896 slides from Mita, Wajiro, Shinkuki, Shinkomonji and Shinmizumaki Hospitals | Acc: 85.30% Se: 88.50% Sp: 82.50% |
| Moranguinho, 2021 [21] | MIL approach using attention module and Grad-Cam algorithm | Binary: tumor/normal | 3220 samples from TCGA dataset | Standard Attention Acc: 90.00% AUC: 0.94 Gated Attention Acc: 91.20% AUC: 0.95 |
| Jiao, 2021 [19] | DELR: deep feature extraction and active learning for sample selection in Logistic Regression | Binary: tumor/non-tumor | 338 ROIs from TCGA dataset | AUC: >0.95 |
| Kanavati, 2020 [20] | Weakly supervised learning employing EfficientNet-B3 architecture | Binary: carcinoma/non-neoplastic | 4204 WSIs from Kyushu Medical Center, 500 WSIs from International University of Health and Welfare, Mital Hospital, 680 WSIs from TCGA dataset and 500 WSIs from TCIA dataset | Weakly supervised AUC: 0.97–0.98 Fully supervised AUC: 0.88–0.96 |
| 1st Author, Year | Technical Method | Classification | Dataset | Performance Metrics |
|---|---|---|---|---|
| Lung cancer classification | ||||
| Yang, 2022 [27] | ResNet-152 VGG-19 Xception NASNetLarge | 5-class: ADC/SCC/SCLC/ LCNEC/ non-tumor | 205 WSIs from Gyeongsang National University Hospital | Novel CNN model Acc: 75.03% Macro-average AUC: 0.90 |
| Chen, 2022 [31] | EfficientNet-B5 WSI-based IHC feature prediction system: a novel DL model based on EfficientNet-B5 | Binary: normal/tumor tissue Binary: negative/positive expression of biomarkers 3-class: ADC/SCC/SCLC | 1101 WSIs from First Affiliated Hospital of Sun Yat-sen University, Shenzhen People’s Hospital and Cancer Center of Guangzhou Medical University | Tissue classification Micro-average AUC: 0.98 Macro-average AUC: 0.99 Biomarkers expression AUC: 0.53–0.95 3-class Acc: 90.00% |
| Kosaraju, 2022 [28] | DEEP-HIPO: two magnifications (20× and 5×), based on CAT-NET with 19 layers | 4-class: ADC/SCC/SCLC/ LCNEC | 113 WSIs from Gyeongsang National University Hospital and 657 ADC WSIs from TCGA dataset | AUC: 0.96 |
| Ilié, 2022 [30] | HALO-AI | 4-class: SCLC/LCNEC/AC/ poorly differentiated ADC | 150 NET and 25 poorly differentiated ADC WSIs from Laboratory of Clinical and Experimental Pathology of Nice University Hospital | Acc: 98.00% (95% CI: 93.70–1.00%) AUC: 0.93 F1-score: 0.99 (95% CI: 0.94–1.00) |
| Yang, 2021 [26] | EfficientNet-B5-based and ResNet-50-based DL model | 6-class: ADC/SCC/SCLC/ pulmonary tuberculosis/organizing pneumonia/normal lung | 1059 WSIs from First Affiliated Hospital of Sun Yat-sen University, 212 WSIs from Shenzhen People’s Hospital, and 422 WSIs from TCGA dataset | EfficientNet-B5-based deep learning model AUC: 0.97 in Sun Yat-sen University dataset 1, 0.92 in Sun Yat-sen University dataset 2, 0.96 in Shenzhen People’s Hospital dataset and 0.98 in TCGA dataset ICC: >0.87 |
| Kanavati, 2021 [24] | Combination of EfficientNet-B1 and RNN | 4-class: ADC/SCC/SCLC/ non-neoplastic | 1723 WSIs from Kyushu Medical Center, 500 WSIs from Mita Hospital and 905 NSCLC WSIs from TCGA dataset | Independent TBLB dataset of 83 indeterminate WSIs AUC: 0.99 1 independent TBLB and 3 independent surgical resection datasets of 2407 WSIs AUC: 0.94–0.99 |
| Wang, 2020 [25] | Modification of VGG-16 | 4-class: ADC/SCC/SCLC/ normal | 939 WSIs from Sun Yat-sen University Cancer Center and 500 WSIs from TCGA dataset | Acc: 97.30% in Sun Yat-sen University Cancer Center dataset and 82.00% in TCGA dataset AUC: 0.86 in TCGA dataset |
| Kriegsmann, 2020 [29] | VGG-16 InceptionV3 InceptionResNetV2 | 4-class: ADC/SCC/SCLC/ skeletal muscle | 270 cases from Institute of Pathology, University Clinic Heidelberg | InceptionV3 with weights trained on the training dataset Acc: 86.00% in validation dataset using 20 epochs and 85.00% in validation dataset using 50 epochs |
| NSCLC subclassification | ||||
| Mengash, 2023 [32] | MPADL-LC3 algorithm based on MobileNet and DBN | 5-class: lung ADC/lung SCC/lung benign tissue/colon ADC/colon benign tissue | 25,000 images from LC25000 dataset | In testing phase using 80% of the dataset for training and 20% for testing Acc: 99.42% for lung ADC, 99.28% for lung SCC and 99.30% for lung benign tissue |
| Al-Jabbar, 2023 [33] | ANN GooLeNet VGG-19 | 5-class: lung ADC/lung SCC/lung benign tissue/colon ADC/colon benign tissue | 25,000 images from LC25000 dataset | ANN with fusion features of VGG-19 and handcrafted Acc: 99.60% for lung ADC, 99.80% for lung SCC and 99.70% for lung benign tissue |
| Wang, 2023 [34] | A novel multiplex-detection-based MIL model | Binary: ADC/SCC | 993 WSIs from TCGA dataset | Overall metrics Acc: 90.52% AUC: 0.96 |
| Patil, 2023 [35] | HistoROI: a ResNet18-based 6-class classifier | Binary: ADC/SCC | 1034 WSIs from TCGA dataset | AUC: 0.93 |
| El-Ghany, 2023 [36] | ResNet 101 | 5-class: lung ADC/lung SCC/lung benign tissue/colon ADC/colon benign tissue | 25,000 images from LC25000 dataset | Average overall metrics Acc: 99.94% Sp: 99.96% Pr: 99.84% Re: 99.85% F1-score: 99.84% |
| Zheng, 2022 [37] | Graph-based modules with ResNet | 3-class: ADC/SCC/normal | 2071 WSIs from 435 patients from the CPTAC dataset, 2082 WSIs from 996 patients from TCGA dataset and 665 WSIs from 345 patients from NLST dataset | Five-fold cross-validation Acc: 91.20% ± 2.50% AUC: 0.98 External test data Acc: 82.30% ± 1.00% AUC: 0.93 |
| Liu, 2022 [38] | SE-ResNet-50 with novel activation function CroRELU | 3-class: infiltration/microinfiltration/normal 5-class: lung ADC/lung SCC/normal lung/colon ADC/normal colon | 766 lung WSIs from First Hospital of Baiqiu’en and 25,000 images from LC25000 dataset | 3-class Acc 98.33% 5-class Acc: 99.96% Se: 99.86% Pr: 99.87% |
| Attallah, 2022 [39] | ShuffleNet, SqueezeNet, and MobileNet: 3 pre-trained lightweight CNN models | 5-class: lung ADC/lung SCC/lung benign tissue/colon ADC/colon benign tissue | 25,000 images from LC25000 dataset | Acc: 99.30% for lung ADC, 99.00% for lung SCC and 100.00% for lung benign tissue |
| Civit-Masot, 2022 [23] | Custom Architecture with 3 Convolution and 2 dense layers | 3-class: ADC/SCC/benign | 15,000 images from LC25000 dataset | Colour CNN classifier Overall Acc: 97.11% using 50 epochs Greyscale CNN classifier Overall Acc: 94.01% using 50 epochs |
| Wang, 2022 [40] | A custom architecture consisting of 5 Convolution and 3 Fully Connected layers along with a segmentation branch for up-sampling | 3 class: ADC/SCC/normal | 312 images from 36 patients from Qilu Hospital of Shandong University | DSC: 93.50% for segmenting SCC and 89.00% for segmenting ADC Acc: 97.80% in classifying SCC versus normal tissue and 100.00% in classifying ADC versus normal tissue |
| Dolezal, 2022 [37] | CNN models based on Xception architecture | Binary: ADC/SCC | 941 WSIs from TCGA dataset, 1.306 from CPTAC dataset and 190 slides from Mayo Clinic dataset | AUROC: 0.96 at maximum dataset size for non-uncertainty quantification models AUROC: 0.98 at maximum dataset size for uncertainty quantification models |
| Le Page, 2021 [41] | A novel CNN model based on InceptionV3 | Binary: squamous/non-squamous NSCLC | 132 slides from Dijon University Hospital, 65 slides from Caen University Hospital, 60 slides from TCGA database and 1 cytological pericardium specimen | Based on WSIs Acc: 99.00% in the training dataset, 87.00% in validation dataset, 85.00% in the test dataset, 85.00% in the external validation cohort and 75.00% in TCGA dataset Based on virtual TMAs Acc: 99.00% in training dataset, 83.00% in validation dataset, 88.00% in test dataset, 92.00% in external validation cohort and 83.00% in TCGA dataset AUC: 0.94 in external validation cohort and 0.77 in TCGA dataset |
| Wang, 2021 [42] | LungDIG: Combination of InceptionV3 with multilayer perceptron | Binary: ADC/SCC | 988 samples with both CNV and histological data | Acc: 87.10% AUC: 92.70% F1-Score: 87.60% |
| Zhao, 2021 [43] | MR-EM-CNN: Hierarchical multiscale features on EM-CNN | Binary: ROI/non-ROI Binary: ADC/SCC | 2125 slides from TCGA dataset | ROI localization F1-score: 0.88 AUC: 0.96 NSCLC classification Se: 94.74% Sp: 85.83% F1-score: 0.90 AUC: 0.96 |
| Dehkharghanian, 2021 [44] | KimiaNet-22: a DL model based on DenseNet | Binary: ADC/SCC | 735 WSIs from TCGA dataset and 23 WSIs from Grand River Hospital | Validation Sample Pr: 92.00% Re: 91.00% F1-score: 0.91 |
| Toğaçar, 2021 [45] | DarkNet-19 combined with YOLO and SVM | 5-class: lung ADC/lung SCC/lung benign tissue/colon ADC/colon benign tissue | 25,000 images from LC25000 dataset | Acc: 99.73% for lung ADC, 99.74% for lung SCC, 99.98% for lung benign tissue |
| Carrillo-Perez, 2021 [46] | Merging ResNet-18 | 3-class: ADC/SCC/healthy | 1420 WSIs and 980 RNA-sequencing data from TCGA dataset | Histology Classifier Acc: 86.03% F1-Score: 83.39% AUC: 0.95 |
| Lu, 2021 [47] | Clustering-Constrained-Attention MIL: a novel DL-based weakly supervised model | Binary: ADC/SCC | 131 resection and 110 biopsy NSCLC WSIs from Brigham and Women’s Hospital, 993 NSCLC WSIs from TCGA dataset, and 974 NSCLC WSIs from TCIA dataset | Public NSCLC WSI dataset (TCGA and TCIA) AUC: 0.96 ± 0.02 using 100%, 0.95 ± 0.02 using 75% and 0.94 ± 0.02 using 50% of cases in training dataset Independent NSCLC WSI dataset (Brigham and Women’s Hospital) AUC: 0.94 ± 0.02 using 100%, 0.92 ± 0.01 using 75% and 0.88 ± 0.02 using 50% of cases in training dataset |
| Chen, 2021 [48] | MIL combined with ResNet-50 | 3-class: ADC/SCC/non-cancer | 9662 WSIs from 2843 patients from Taipei Medical University Hospital, Taipei Municipal Wanfang Hospital and Taipei Medical University Shuang-Ho Hospital and 532 WSIs from TCGA dataset | AUC: 0.96 for ADC and 0.94 for SCC |
| Masud, 2021 [49] | Custom CNN architecture consisting of 3 Convolution and 1 Fully Connected layers | 5-class: lung ADC/lung SCC/benign lung tissue/colon ADC/benign colonic tissue | 25,000 images from LC25000 dataset | Testing dataset Acc: 96.33% Pr: 96.39% Re: 96.37% F1-score: 96.38% |
| Wang, 2021 [50] | InceptionV3, ResNet-50, VGG-19, MobileNetV2, ShuffleNetV2 and MNASNET on HEAL Platform | 3-class: ADC/SCC/normal | NSCLC WSIs from TCGA dataset | AUC: 0.98 for ADC, 0.98 for SCC and 0.99 for normal |
| Kobayashi, 2020 [51] | A proposed modification to Diet Networks | Binary: ADC/SCC | 950 patients from Pan-Lung Cancer dataset | Acc: ~80.00% |
| Xu, 2020 [52] | Hierarchical multiscale features on EM-CNN | Binary: tumor/normal Binary: ADC/SCC | 2125 images from TCGA dataset | Tumor/normal AUC: 1.00 ADC/SCC AUC: 0.97 |
| Yu, 2020 [53] | AlexNet GoogLeNet VGGNet-16 ResNet-50 | Binary: ADC/benign Binary: SCC/benign Binary: ADC/SCC 3-class: terminal respiratory unit/proximal-inflammatory/proximal-proliferative ADC transcriptome subtype 4-class: classical/basal/secretor/primitive SCC transcriptome subtype | 884 WSIs from TCGA dataset and 125 images from ICGC dataset | ADC/benign AUC: 0.95–0.97 in TCGA test dataset and 0.92–0.94 in ICGC test dataset SCC/benign AUC: 0.94–0.99 in TCGA test dataset and >0.97 in ICGC test dataset ADC/SCC AUC: 0.88–0.93 in TCGA test dataset and 0.73–0.86 in ICGC test dataset ADC transcriptome subtype AUC: 0.77–0.89 SCC transcriptome subtype AUC: ~0.70 |
| Shi, 2019 [54] | Graph temporal ensembling: a novel semi-supervised CNN model based on AlexNet | Binary: ADC/SCC | 2904 NSCLC image patches from WSIs of 42 patients from TCGA | Acc: 90.50% using 20% labeled patients, 91.00% using 35% labeled patients, 91.10% using 50% labeled patients and 94.00% using all labeled patients |
| Khosravi, 2018 [55] | CNN-basic InceptionV3-Last layer-4000 steps InceptionV3-Last layer-12,000 steps InceptionV1-Fine tune Inception-ResNetV2-Last layer InceptionV3-Fine tune | Binary: ADC/SCC | 1273 images from TMAD and 3149 from TCGA dataset | InceptionV1-Fine tune Acc: 92% for TMAD images, 100% for TCGA intra-images and 83% for TCGA inter-images |
| Coudray, 2018 [56] | InceptionV3 | Binary: tumor/normal 3-class: normal/ADC/SCC | 1634 WSIs from Genetic Data Commons database and 340 slides from New York University Langone Medical Center | Binary AUC: 0.99 3-class AUC: 0.97 |
| Hou, 2016 [57] | 14 different combinations of EM-based MIL approach with CNN and multiclass logistic regression or SVM | 3-class: ADC/SCC/ADC with mixed subtypes | 718 WSIs from 641 patients from TCGA dataset | Acc: 79.80% |
| 1st Author, Year | Technical Method | Classification | Dataset | Performance Metrics |
|---|---|---|---|---|
| Gao, 2022 [68] | Inspired by YOLOv5 | Binary: micropapillary/non-micropapillary | ADC WSIs from Shandong Provincial Hospital | Supervised model Pr: 76.20% Re: 88.40% Semi-supervised model Pr: 77.50% Re: 89.60% |
| Xiao, 2022 [66] | GCNs combined with VGG-16 | 5-class: lepidic/acinar/papillary/ micropapillary/solid | 243 images from 243 patients from Shandong Provincial Hospital | LAD-GCN Acc: 90.35% Pr: 86.53–98.34% Re: 85.80–98.78% F1-score: 0.86–0.99 |
| Sheikh, 2022 [67] | Unsupervised deep learning model which employs stacked autoencoders | 5-class: lepidic/acinar/papillary/ micropapillary/solid | 31 WSIs from Dartmouth-Hitchcock Medical Center | Acc: 94.60% Se: 94.10% Pr: 94.20% F1-score: 0.94 |
| Maleki, 2022 [69] | Four novel CNN models based on ResNet-50 | Binary: solid/acinar | 110 WSIs from Dartmouth-Hitchcock Medical Center | Acc: 65.90–99.90% |
| Sadhwani, 2021 [62] | InceptionV3 and Deep features extraction combined with logistic regression in two stages | 9-class: acinar/lepidic/solid/papillary/micropapillary cribriform/necrosis/leukocyte aggregates/other | ADC WSIs from TCGA dataset and 50 ADC WSIs for external validation from an independent pathology laboratory in the United States | AUC: 0.93 in TCGA dataset and 0.92 in external validation dataset |
| DiPalma, 2021 [65] | MIL approach using ResNet | 5-class: lepidic/acinar/papillary/ micropapillary/solid | 269 slides from TCGA dataset and Dartmouth-Hitchcock Medical Center | Acc: 94.51% (95% CI: 92.77–96.20%) Pr: 80.41% (95% CI: 70.55–89.56%) Re: 81.67% (95% CI: 71.20–90.43%) F1-score 0.80 (95% CI: 0.71–0.88) |
| Wei, 2019 [63] | ResNet-18 | 6-class: lepidic/acinar/papillary/ micropapillary/solid/benign | 422 ADC WSIs from Dartmouth-Hitchcock Medical Center | AUC: 0.97–1.00 |
| Gertych, 2019 [64] | GoogLeNet, ResNet-50 and modified AlexNet developed in Caffe engine | 5-class: solid/micropapillary/ acinar/cribriform/non-tumor | 50 cases from Cedars-Sinai Medical Center in Los Angeles, 33 cases from Military Institute of Medicine in Warsaw and 27 cases from TCGA dataset | Overall Acc: 89.24% |
| 1st Author, Year | Aim of Study | Technical Method | Classification | Dataset | Performance Metrics |
|---|---|---|---|---|---|
| Liu, 2023 [60] | ADC prognosis prediction | MIM (MLP IN MLP): a novel deep learning-based model | 3-class: infiltration/microinfiltration/ normal | 780 images from the First Hospital of Jilin University | Overall metrics in the test dataset Acc: 95.31% Se: 93.10% Sp: 96.43% F1-score: 93.10% Pr: 93.09% |
| Yu, 2023 [85] | ADC prognosis prediction | Transformer-guided MIL with both handcrafted and deep features | Binary: negative/positive aneuploidy | Slides from 339 patients from TCGA dataset | In lung ADC test dataset Acc: 77.60% F1-score: 79.50% Cohen’s kappa: 0.55 AUC: 0.82 |
| Qaiser, 2022 [80] | Lung cancer prognosis prediction | ResNet-18 along with attention mechanism | Binary: high/low OS | 1122 WSIs from 410 patients from NLST dataset | C-index: 0.70 |
| Shvetsov, 2022 [76] | NSCLC prognosis prediction | HoVer-Net | Binary: high-TIL/low-TIL | WSIs from CoNSeP, PanNuke, MoNuSAC and UiT-TILs datasets | HoVer-Net PanNuke Aug model HR: 0.30 (95% CI: 0.15–0.60) HoVer-Net MoNuSAC Aug model HR: 0.27 (95% CI: 0.14–0.53) |
| Guo, 2021 [77] | NSCLC prognosis prediction | EfficientUnet: a combination of EfficientNet and Unet ResNet | Binary: tumor/non-tumor area Binary: positive/negative tumor cell staining Binary: positive/negative TILs staining | 1859 NSCLC TMAs from Medical University of Gdansk and 214 NSCLC WSIs from Shanghai Pulmonary Hospital | Integrated score in the training dataset AUC: 0.90 for OS and 0.85 for RFS Res-score in the external validation dataset AUC: 0.80–0.87 for OS and 0.83–0.94 for RFS |
| Pan, 2022 [83] | ADC prognosis prediction | ResNet-50 HoVer-Net | Binary: high-risk/low-risk | Patients from Guangdong Provincial People’s Hospital, Shanxi Cancer Hospital, Yunnan Cancer Hospital and TCGA | In terms of OS HR: 2.68 in discovery cohort, 3.05 in validation cohort 1, 2.39 in validation cohort 2 and 1.99 in validation cohort 3 In terms of DFS HR: 2.07 in discovery cohort, 1.54 in validation cohort 1, and 3.80 in validation cohort 2 |
| Levy-Jurgenson, 2020 [86] | ADC prognosis prediction | 5 deep learning models based on InceptionV3 | Binary: low/high heterogeneity index | 469 ADC slides from TCGA dataset and mRNA/miRNA expression data from GDC database | Log rank p-value: 0.07 |
| Wang, 2020 [75] | ADC prognosis prediction | Mask-RCNN | Binary: high-risk/low-risk | 208 images from 135 patients from NLST dataset and 431 histological images from 372 patients from TCGA dataset | HR: 2.23 (95% CI: 1.37–3.65) |
| Wang, 2019 [74] | ADC prognosis prediction | ConvPath: A custom architecture with 2 convolution layers | Binary: high-risk/low-risk | 1337 images from 523 patients from TCGA dataset, 345 images from 201 patients from NLST dataset, 102 images from 102 patients from Chinese Academy of Medical Sciences dataset and 130 images from 112 patients from Special Program of Research Excellence dataset | Log rank p-value: <0.01 in TCGA dataset and 0.03 in Chinese Academy of Medical Sciences dataset |
| Wu, 2020 [73] | Lung cancer recurrence and metastasis prediction | DeepLRHE: a novel deep learning model consisting of a CNN and a ResNet component | Binary: high-risk/low-risk | 211 images from TCGA dataset | Se: 84.00% Sp: 67.00% Pr: 78.00% F1-score: 81.00% AUC: 0.79 |
| Hattori, 2022 [82] | ADC recurrence prediction | Custom Architecture consisting of 3 Convolution and 1 Fully Connected layer in different color spaces | Binary: presence/absence of recurrence | WSIs from 55 stage IB ADC patients | Se: 91.70% Sp: 90.20% Acc: 90.90% |
| Shim, 2021 [72] | ADC recurrence prediction | DeepRePath: a novel CNN model based on ResNet-50 | Binary: high/low probability of recurrence within 3 years | 3923 slides from 5 St. Mary’s hospitals affiliated with the Catholic University of Korea in Seoul, Incheon, Uijeongbu, Bucheon, and Yeouido and 1067 WSIs from TCGA dataset | HR: 5.56 |
| Yang, 2021 [87] | Lung cancer immunotherapy efficacy prediction | DeepLRHE: a novel deep learning model consisting of a CNN and a ResNet component | Binary: positive/negative expression of TP53, EGFR, DNMT3A, PBRM1 and STK11 | 180 WSIs from TCGA dataset | AUC: 0.87 for TP53, 0.84 for EGFR, 0.78 for DNMT3A, 0.75 for PBRM1 and 0.71 for STK11 |
| Barmpoutis, 2021 [71] | Lung cancer TLS identification and quantification | Combination of DeepLadV3 with Inception-ResNetV2 | Binary: TLS/non-TLS region | Slides from 18 patients from Norfolk and Norwich University Hospital | Sp: 92.87% with Se: 95.00% Sp: 88.79% with Se: 98.00% Sp: 84.32% with Se: 99.00% AUROC: 0.96 |
| Hu, 2021 [88] | Anti-PD-L1 response prediction | Combination of Xception, PCA, and SVM | Binary: response/non-response | 190 melanoma slides from TCGA-SKCM dataset and 55 NSCLC slides from Guangdong Province Cancer Hospital | AUC: 0.65 (95% CI: 49.40–78.40%) |
| 1st Author, Year | Technical Method | Classification | Dataset | Performance Metrics |
|---|---|---|---|---|
| Pao, 2023 [95] | An attention-based MIL model based on ResNet50 | Binary: mutated/wild-type EGFR | 2099 specimens | AUC: 0.87 NPV: 95.40% PPV: 41.00% |
| Dammak, 2023 [94] | VGG16 Xception NASNet-Large | Binary: high/low TMB | 50 slides from TCGA dataset | Per-patient metrics for the optimal model (VGG16) AUC: 0.65 Acc: 65.00% Se: 77.00% Sp: 43.00% |
| Mayer, 2022 [92] | GANs along with unsupervised and semi-supervised learning | Binary: positive/negative ALK and ROS1 rearrangement | Slides from 234 advanced-stage NSCLC patients from Sheba Medical Center | Se: 100% for both ALK and ROS1 Sp: 100% for ALK and 98.57% for ROS1 NPV: 100% for both ALK and ROS1 PPV: 100% for ALK and 50.50% for ROS1 |
| Terada, 2022 [89] | DenseNet via the HALO-AI platform | Binary: positive/negative ALK rearrangement | 300 patients from Shizuoka Cancer Center, Shizuoka, Japan | With 50% probability threshold AUC: 0.73 (95% CI: 0.65–0.82) Acc: 73.00% Se: 73.00% Sp: 73.00% PPV: 73.00% NPV: 73.00% F1-score: 37.00% |
| Tomita, 2022 [90] | ResNet-18, EfficientNet-B0 | Binary: mutated/wild-type BRAF, EGFR, KRAS, STK11, and TP53 | 747 WSIs from 232 patients from Dartmouth-Hitchcock Medical Center and 111 cases from CPTAC-3 study | Internal test dataset from Dartmouth-Hitchcock Medical Center AUC: 0.80 (95% CI: 0.69–0.90) for EGFR and 0.71 (95% CI: 0.61–0.81) for TP53 External test dataset from CPTAC-3 study AUC: 0.69 (95% CI: 0.62–0.75) for EGFR and 0.68 (95% CI: 0.60–0.75) for TP53 |
| Rączkowski, 2022 [79] | ARA-CNN inspired by ResNet and DarkNet | Binary: mutated/wild-type ALK, BRAF, DDR2, EGFR, KEAP1, KRAS, MET, PIK3CA, RET, ROS1, STK11, TP53 and PDGFRB | Samples from 55 tumors from the Medical University of Lublin, Poland, and 467 images from TCGA dataset | AUC: up to 0.74 for PDGFRB |
| Niu, 2022 [93] | ResNet-18 | Binary: high/low TMB | 427 WSIs from 427 patients from TCGA dataset | AUC: 0.64 |
| Li, 2022 [96] | Fine-tuned pre-trained Xception model | Binary: mutated/wild-type STK11, TP53, LRP1B, NF1, FAT1, FAT4, KEAP1, EGFR and KRAS | 100,000 images from NCT-CRC-100k dataset and 900 ADC WSIs from TCGA dataset | AUC |
| Wang, 2021 [50] | InceptionV3, ResNet-50, VGG-19, MobileNetV2, ShuffleNetV2 and MNASNET on HEAL Platform | Binary: mutated/wild-type STK11, KEAP1, NF1, TP53, EGFR, FAT1, FAT4, LRP1B, SETBP1 and KRAS | NSCLC WSIs from TCGA dataset | AUC: 0.63 for STK11, 0.77 for KEAP1, 0.70 for NF1, 0.72 for TP53, 0.82 for EGFR, 0.55 for FAT1, 0.69 for FAT4, 0.76 for LRP1B, 0.54 for SETBP1, 0.66 for KRAS |
| Huang, 2021 [91] | DeepIMLH: a novel CNN model based on ResNet concept | Binary: mutated/wild-type AKT1, FGFR1, FGFR2, HRAS and MET | 180 WSIs from TCGA dataset | Acc: 72.00% for AKT1, 83.00% for FGFR1, 82.00% for FGFR2, 79.00% for HRAS and 86.00% for MET AUC: 0.83 for FGFR1, 0.82 for FGFR2, 0.79 for HRAS and 0.86 for MET |
| Sadhwani, 2021 [62] | InceptionV3 and Deep features extraction combined with logistic regression in two stages | Binary: low/high TMB | ADC WSIs from TCGA dataset and 50 ADC WSIs for external validation from an independent pathology laboratory in the United States | AUC: 0.71 (95% CI: 0.63–0.79) |
| Coudray, 2018 [56] | InceptionV3 | Binary: mutated/wild-type NF1, FAT4, LRP1B, KEAP1, KRAS, FAT1, TP53, SETB1, EGFR and STK11 | 1634 WSIs from Genetic Data Commons database and 340 slides from New York University Langone Medical Center | AUC: 0.64 for NF1, 0.64 for FAT4, 0.66 for LRP1B, 0.68 for KEAP1, 0.73 for KRAS, 0.75 for FAT1, 0.76 for TP53, 0.78 for SETB1, 0.83 for EGFR and 0.86 for STK11 |
| 1st Author, Year | Technical Method | Classification | Dataset | Performance Metrics |
|---|---|---|---|---|
| Tsukamoto, 2022 [102] | AlexNet GoogLeNet/InceptionV3 VGG-16 ResNet-50 | 3-class: ADC/SCC/SCLC | 82 images from 36 ADC cases, 125 images from 14 SCC cases and 91 images from 5 SCLC cases | AlexNet Acc: 73.70% GoogLeNet/InceptionV3 Acc: 66.80% VGG16 Acc: 76.80% ResNet50 Acc: 74.00% |
| Wang, 2022 [104] | Custom Architecture with 8 Convolution and 1 Deconvolution layers | Binary: positive/negative lymph node metastasis | 122 WSIs from EBUS-guided TBNA samples from Tri-Service General Hospital | Novel DL model Pr: 93.40% in 1st and 91.80% in 2nd experiment Se: 89.80% in 1st and 96.30% in 2nd experiment DSC: 82.20% in 1st and 94.00% in 2nd experiment IoU: 83.20% in 1st and 88.70% in 2nd experiment |
| Xie, 2022 [99] | ResNet-18 | Binary: benign/malignant | 404 WSIs from Shangai Pulmonary Hospital | Acc: 91.67% Sp: 94.44% Se: 87.50% AUC: 0.95 (95% CI: 0.90–0.99) |
| Lin, 2021 [100] | ResNet-101 | Binary: benign/malignant | 499 images from 97 patients from National Taiwan University Cancer Center and National Taiwan University Hsin-Chu Hospital | Acc: 98.80% for patch-based classification, 95.50% for image-based classification and 92.90% for patient-based classification Se: 98.80% for patch-based classification Sp: 98.80% for patch-based classification |
| Teramoto, 2021 [101] | MIL approach with attention mechanism and several CNN architectures as backbone | Binary: benign/malignant | Images from 322 patients | Acc: 91.60% |
| Teramoto, 2020 [98] | Combination of progressive growing GAN and VGG-16 architecture | Binary: benign/malignant | Images from 60 patients | Acc: 85.30% |
| Gonzalez, 2020 [103] | A deep learning model based on InceptionV3 | Binary: LCNEC/SCLC | 114 cytological and histological slides from 40 cases | Diff-Quik®-stained model AUC: 1.00 with a threshold at Se: 100.00% and Sp: 87.50% Pap-stained model AUC: 1.00 with a threshold at Se: 100.00% and Sp: 85.70% H&E-stained model AUC: 0.88 with a threshold at Se: 100.00% and Sp: 87.50% |
| Teramoto, 2017 [97] | Custom architecture consisting of 3 convolutions and 3 Fully Connected layers | 3-class: ADC/SCC/SCLC | 76 cases | Original images Acc: 73.20% for ADC, 44.80% for SCC, 75.80% for SCLC and 62.10% overall Augmented images Acc: 89.00% for ADC, 60.00% for SCC, 70.30% for SCLC and 71.10% overall |
| 1st Author, Year | Technical Method | Classification | IHC Assay | Dataset | Performance Metrics |
|---|---|---|---|---|---|
| Cheng, 2022 [117] | MobileNetV2 for classification and YOLO for detection | 3-class: PD-L1+ tumor cells/PD-L1+ immune cells/PD-L1− tumor cells | 22C3 pharmDx (DAKO) and SP263 (Ventana) | 1288 samples from Zhejiang Cancer Hospital | Best model LCC 95% CI: 0.86–0.89 with PD-L1 (22C3) assay and 0.81–0.91 with PD-L1 (SP263) assay |
| Choi, 2022 [118] | Faster R-CNN | Binary: PD-L1+/PD-L1− tumor cells | 22C3 pharmDx (DAKO) | 348 slides from Samsung Medical Center and 131 slides from Seoul National University Bundang Hospital | AUROC: 0.89 for PD-L1+ cells and 0.81 for PD-L1− cells F1-score: 72.30% for PD-L1+ cells and 72.20% for PD-L1− cells |
| Huang, 2022 [119] | U-Net based architecture | 3-class: negative PD-L1 expression (TPS: <1%)/low PD-L1 expression (TPS: 1–49%)/high PD-L1 expression (TPS: ≥50%) | 22C3 pharmDx (DAKO) | 222 WSIs from Fudan University Shanghai Cancer Center | rs: 0.87 Acc: 79.13% for all subsets, 85.29% for negative TPS subset, 77.79% for low TPS subset, and 72.73% for high TPS subset |
| Hondelink, 2022 [110] | A novel supervised deep learning model based on AIFORIA CREATE software (v4.6) | 3-class: TPS < 1%/1–49%/50–100% | 22C3 pharmDx (DAKO) | 199 stage IV NSCLC WSIs stained with PD-L1 22C3 antibody from Leiden University Medical Centre | ICC: 0.96 (95% CI: 0.94–0.97) Cohen’s kappa: 0.68 |
| Wu, 2022 [116] | A novel supervised deep learning algorithm based on U-Net | Binary: tumor/non-tumor 3-class: TPS < 1%/1–49%/50–100% | 22C3 pharmDx (DAKO) and SP263 (Ventana) | 501 NSCLC WSIs from Peking University Cancer Hospital and Tianjin Medical University Cancer Hospital | Binary Acc: 93.26% Sp: 96.41% Pr: 92.48% Re: 86.09% F1-score: 88.71% IoU: 80.51% 3-class r: 0.94–0.95 in 22C3 assay and 0.98 in SP263 assay |
| Kapil, 2021 [114] | DASGAN network: an extension of CycleGAN architecture An extension of the deep survival learning methodology | Binary: epithelial/non-epithelial 3-class: tumor PD-L1+ epithelial region/tumor PD-L1− epithelial region/other regions (immune, stromal, necrotic) | SP263 (Ventana) | 56 WSIs stained with Pan-Cytokeratin and 122 WSIs stained with PD-L1 SP263 antibody | Binary F1-score: 88.60% 3-class F1-score: 85.00% |
| Wang, 2021 [112] | DSC-VGG-16: a novel dual-scale categorization-based deep learning model based on VGG-16 | 4-class: PD-L1+ tumor cells/PD-L1− tumor cells/PD-L1+ immune cells/other region 3-class: maximum counts of PD-L1+ tumor cell (TP1)/50% PD-L1+ tumor cell of TP1 (TP2)/25% PD-L1+ tumor cell of TP1 (TP3) 3-class: TPS < 1%/1–49%/50–100% | 22C3 pharmDx (DAKO) | 300 NSCLC slides stained with PD-L1 22C3 antibody from Changhai and Changzheng hospitals | TPS prediction F1-score: 90.24% with 1% and 81.82% with 50% cut-off AUC: 0.97 with 1% and 0.99 with 50% cut-off Se: 88.10% with 1% and 75.00% with 50% cut-off Sp: 95.59% with 1% and 98.98% with 50% cut-off Cohen’s kappa: 0.79 (95% CI: 0.68–0.90) Lcc: 0.88 (95% CI: 0.83–0.92) |
| Liu, 2021 [111] | Automated Tumor Proportion Scoring System: a novel deep learning model using Res50UNet for tumor region segmentation and MicroNet for tumor nuclei detection | 3-class: TPS < 1%/1–49%/50–100% | 22C3 pharmDx (DAKO) | 96 SCC WSIs stained with PD-L1 22C3 antibody from Fudan University Shanghai Cancer Center | Acc: 74.51% MAE: 8.65 (95% CI: 6.42–10.90) r: 0.94 |
| Sha, 2019 [113] | Modified ResNet-18 | 3-class: tumor PD-L1+/tumor PD-L1−/other | 22C3 pharmDx (DAKO) | 130 NSCLC samples | AUC: 0.80 for all cases, 0.83 for ADC cases and 0.64 for SCC cases |
| Kapil, 2018 [115] | Auxiliary Classifier GAN | Binary: PD-L1+/PD-L1− tumor regions | SP263 (Ventana) | 270 NSCLC slides from NCT01693562 and NCT02000947 clinical trials | Lcc: 0.94 r: 0.95 MAE: 8.00 OPA: 0.88 NPA: 0.90 PPA: 0.85 |
| Limitation | Property |
|---|---|
| Lack of interpretability and explainability | According to the review, only a few approaches focus on performing tasks that require common sense reasoning, such as understanding the physical characteristics of the cells. More explainable artificial intelligence approaches could be proposed in the future. |
| Training limitations with inadequate samples | Deep learning algorithms require massive amounts of labeled data to achieve good performance, and thus, thousands of annotations must be performed by pathologists. |
| Less powerful in problems beyond classification | Deep learning algorithms are mainly designed for classification problems, such as image recognition and natural language processing. They are less effective for other types of problems, such as regression, clustering, etc. |
| Lack of global generalization | Deep learning algorithms often overfit the training data and fail to generalize to new or unlabeled data. For example, a deep learning model may perform well on images from a specific microscopic scanner but poorly on images from a different microscope. |
| High memory and computational cost requirements | The training of deep models using extremely large size of images, such as biopsies, constitutes a very demanding process in terms of computational resources and training time of the supervision. |
Disclaimer/Publisher’s Note: The statements, opinions and data contained in all publications are solely those of the individual author(s) and contributor(s) and not of MDPI and/or the editor(s). MDPI and/or the editor(s) disclaim responsibility for any injury to people or property resulting from any ideas, methods, instructions or products referred to in the content. |
© 2023 by the authors. Licensee MDPI, Basel, Switzerland. This article is an open access article distributed under the terms and conditions of the Creative Commons Attribution (CC BY) license (https://creativecommons.org/licenses/by/4.0/).
Share and Cite
Davri, A.; Birbas, E.; Kanavos, T.; Ntritsos, G.; Giannakeas, N.; Tzallas, A.T.; Batistatou, A. Deep Learning for Lung Cancer Diagnosis, Prognosis and Prediction Using Histological and Cytological Images: A Systematic Review. Cancers 2023, 15, 3981. https://doi.org/10.3390/cancers15153981
Davri A, Birbas E, Kanavos T, Ntritsos G, Giannakeas N, Tzallas AT, Batistatou A. Deep Learning for Lung Cancer Diagnosis, Prognosis and Prediction Using Histological and Cytological Images: A Systematic Review. Cancers. 2023; 15(15):3981. https://doi.org/10.3390/cancers15153981
Chicago/Turabian StyleDavri, Athena, Effrosyni Birbas, Theofilos Kanavos, Georgios Ntritsos, Nikolaos Giannakeas, Alexandros T. Tzallas, and Anna Batistatou. 2023. "Deep Learning for Lung Cancer Diagnosis, Prognosis and Prediction Using Histological and Cytological Images: A Systematic Review" Cancers 15, no. 15: 3981. https://doi.org/10.3390/cancers15153981
APA StyleDavri, A., Birbas, E., Kanavos, T., Ntritsos, G., Giannakeas, N., Tzallas, A. T., & Batistatou, A. (2023). Deep Learning for Lung Cancer Diagnosis, Prognosis and Prediction Using Histological and Cytological Images: A Systematic Review. Cancers, 15(15), 3981. https://doi.org/10.3390/cancers15153981