
A Subset of Non-Small Cell Lung Cancer Patients Treated with Pemetrexed Show 18F-Fluorothymidine “Flare” on Positron Emission Tomography

 , , , and
Abstract
Simple Summary
Abstract
1. Introduction
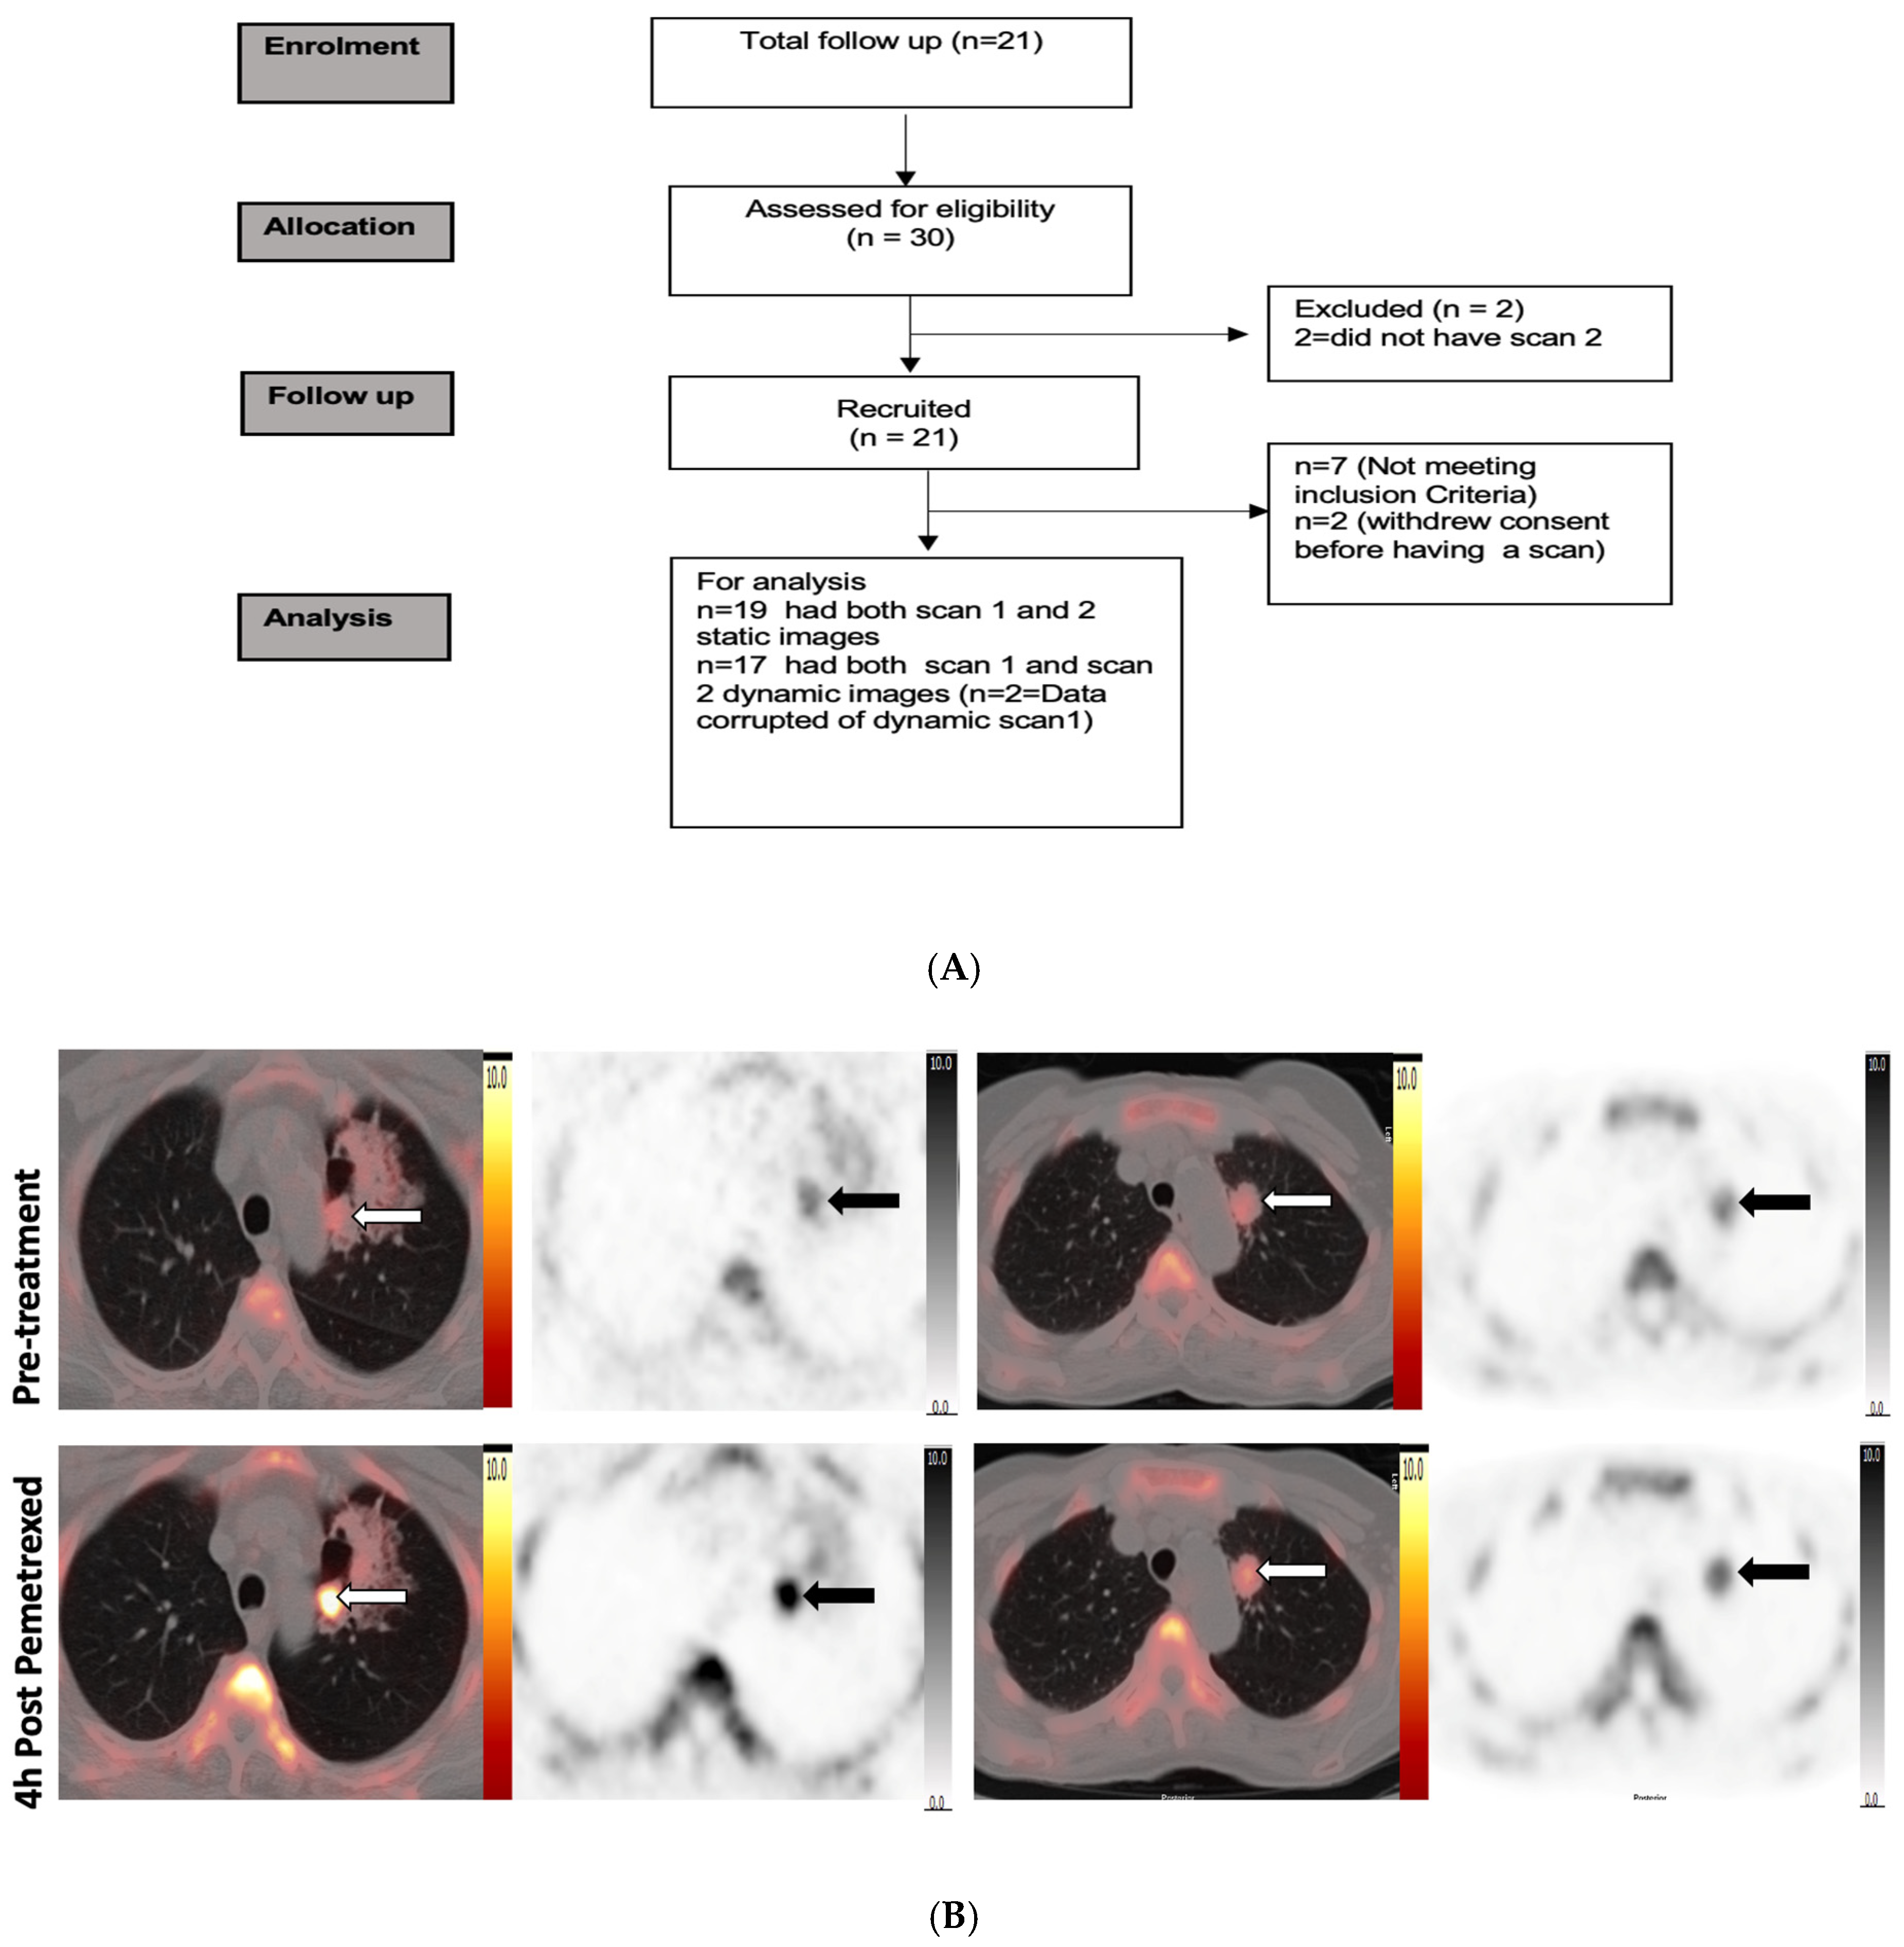
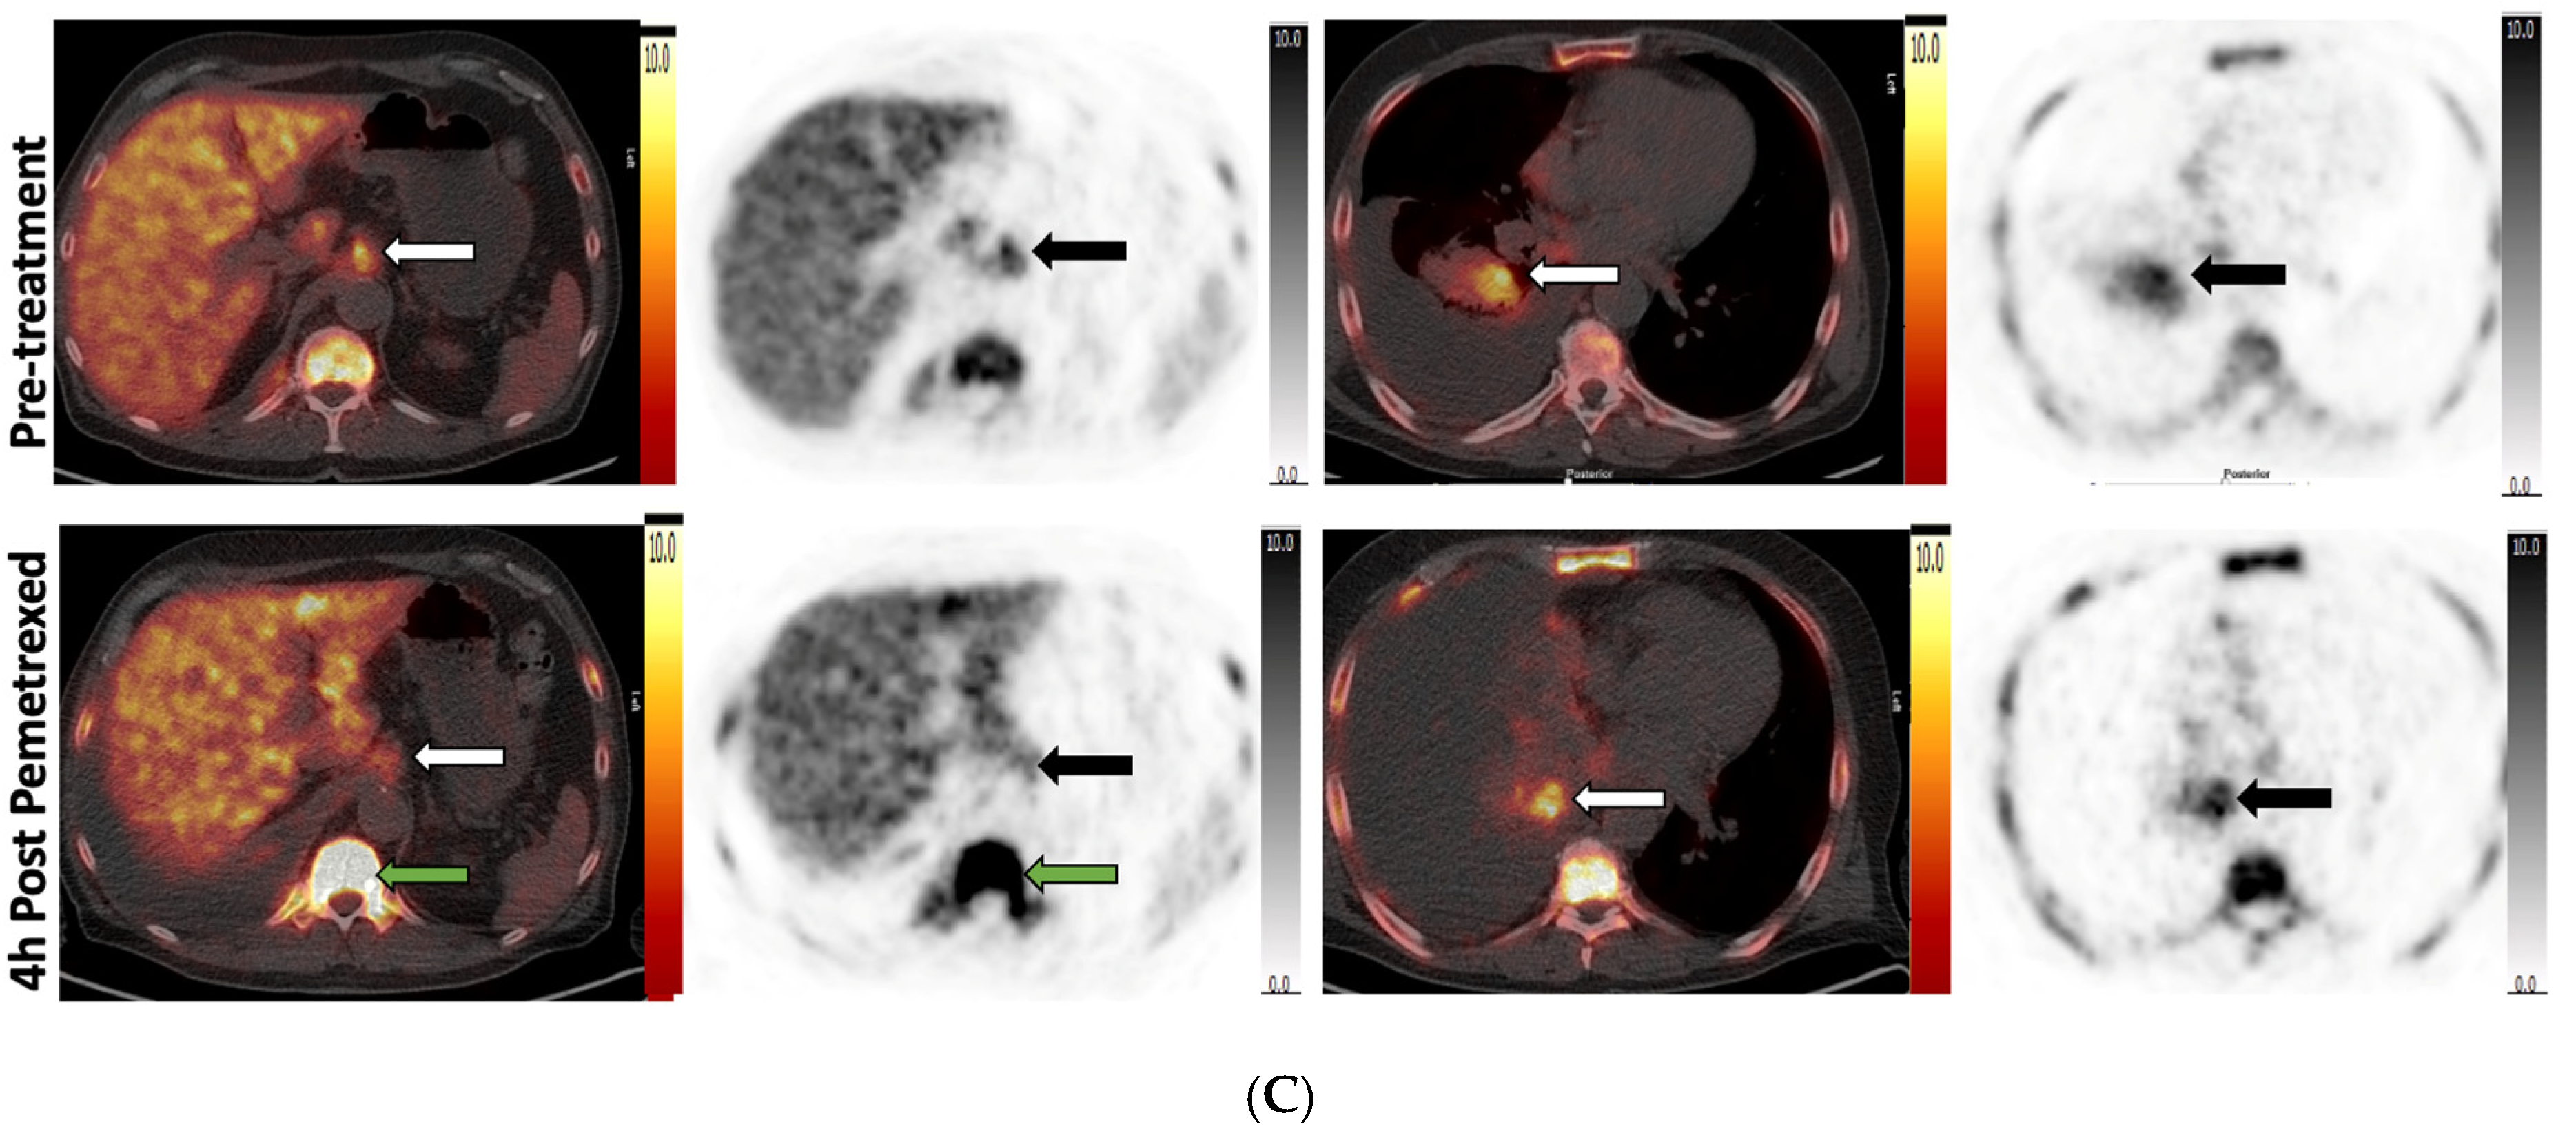
2. Study Design
2.1. Patients
2.2. PET Protocol
2.3. PET Analysis
2.4. Analysis of Plasma Thymidine Kinase 1 (Plasma TK1) and Plasma Deoxy Uridine (Plasma dUrd)
2.5. Statistical Analysis
3. Results
3.1. Demographics
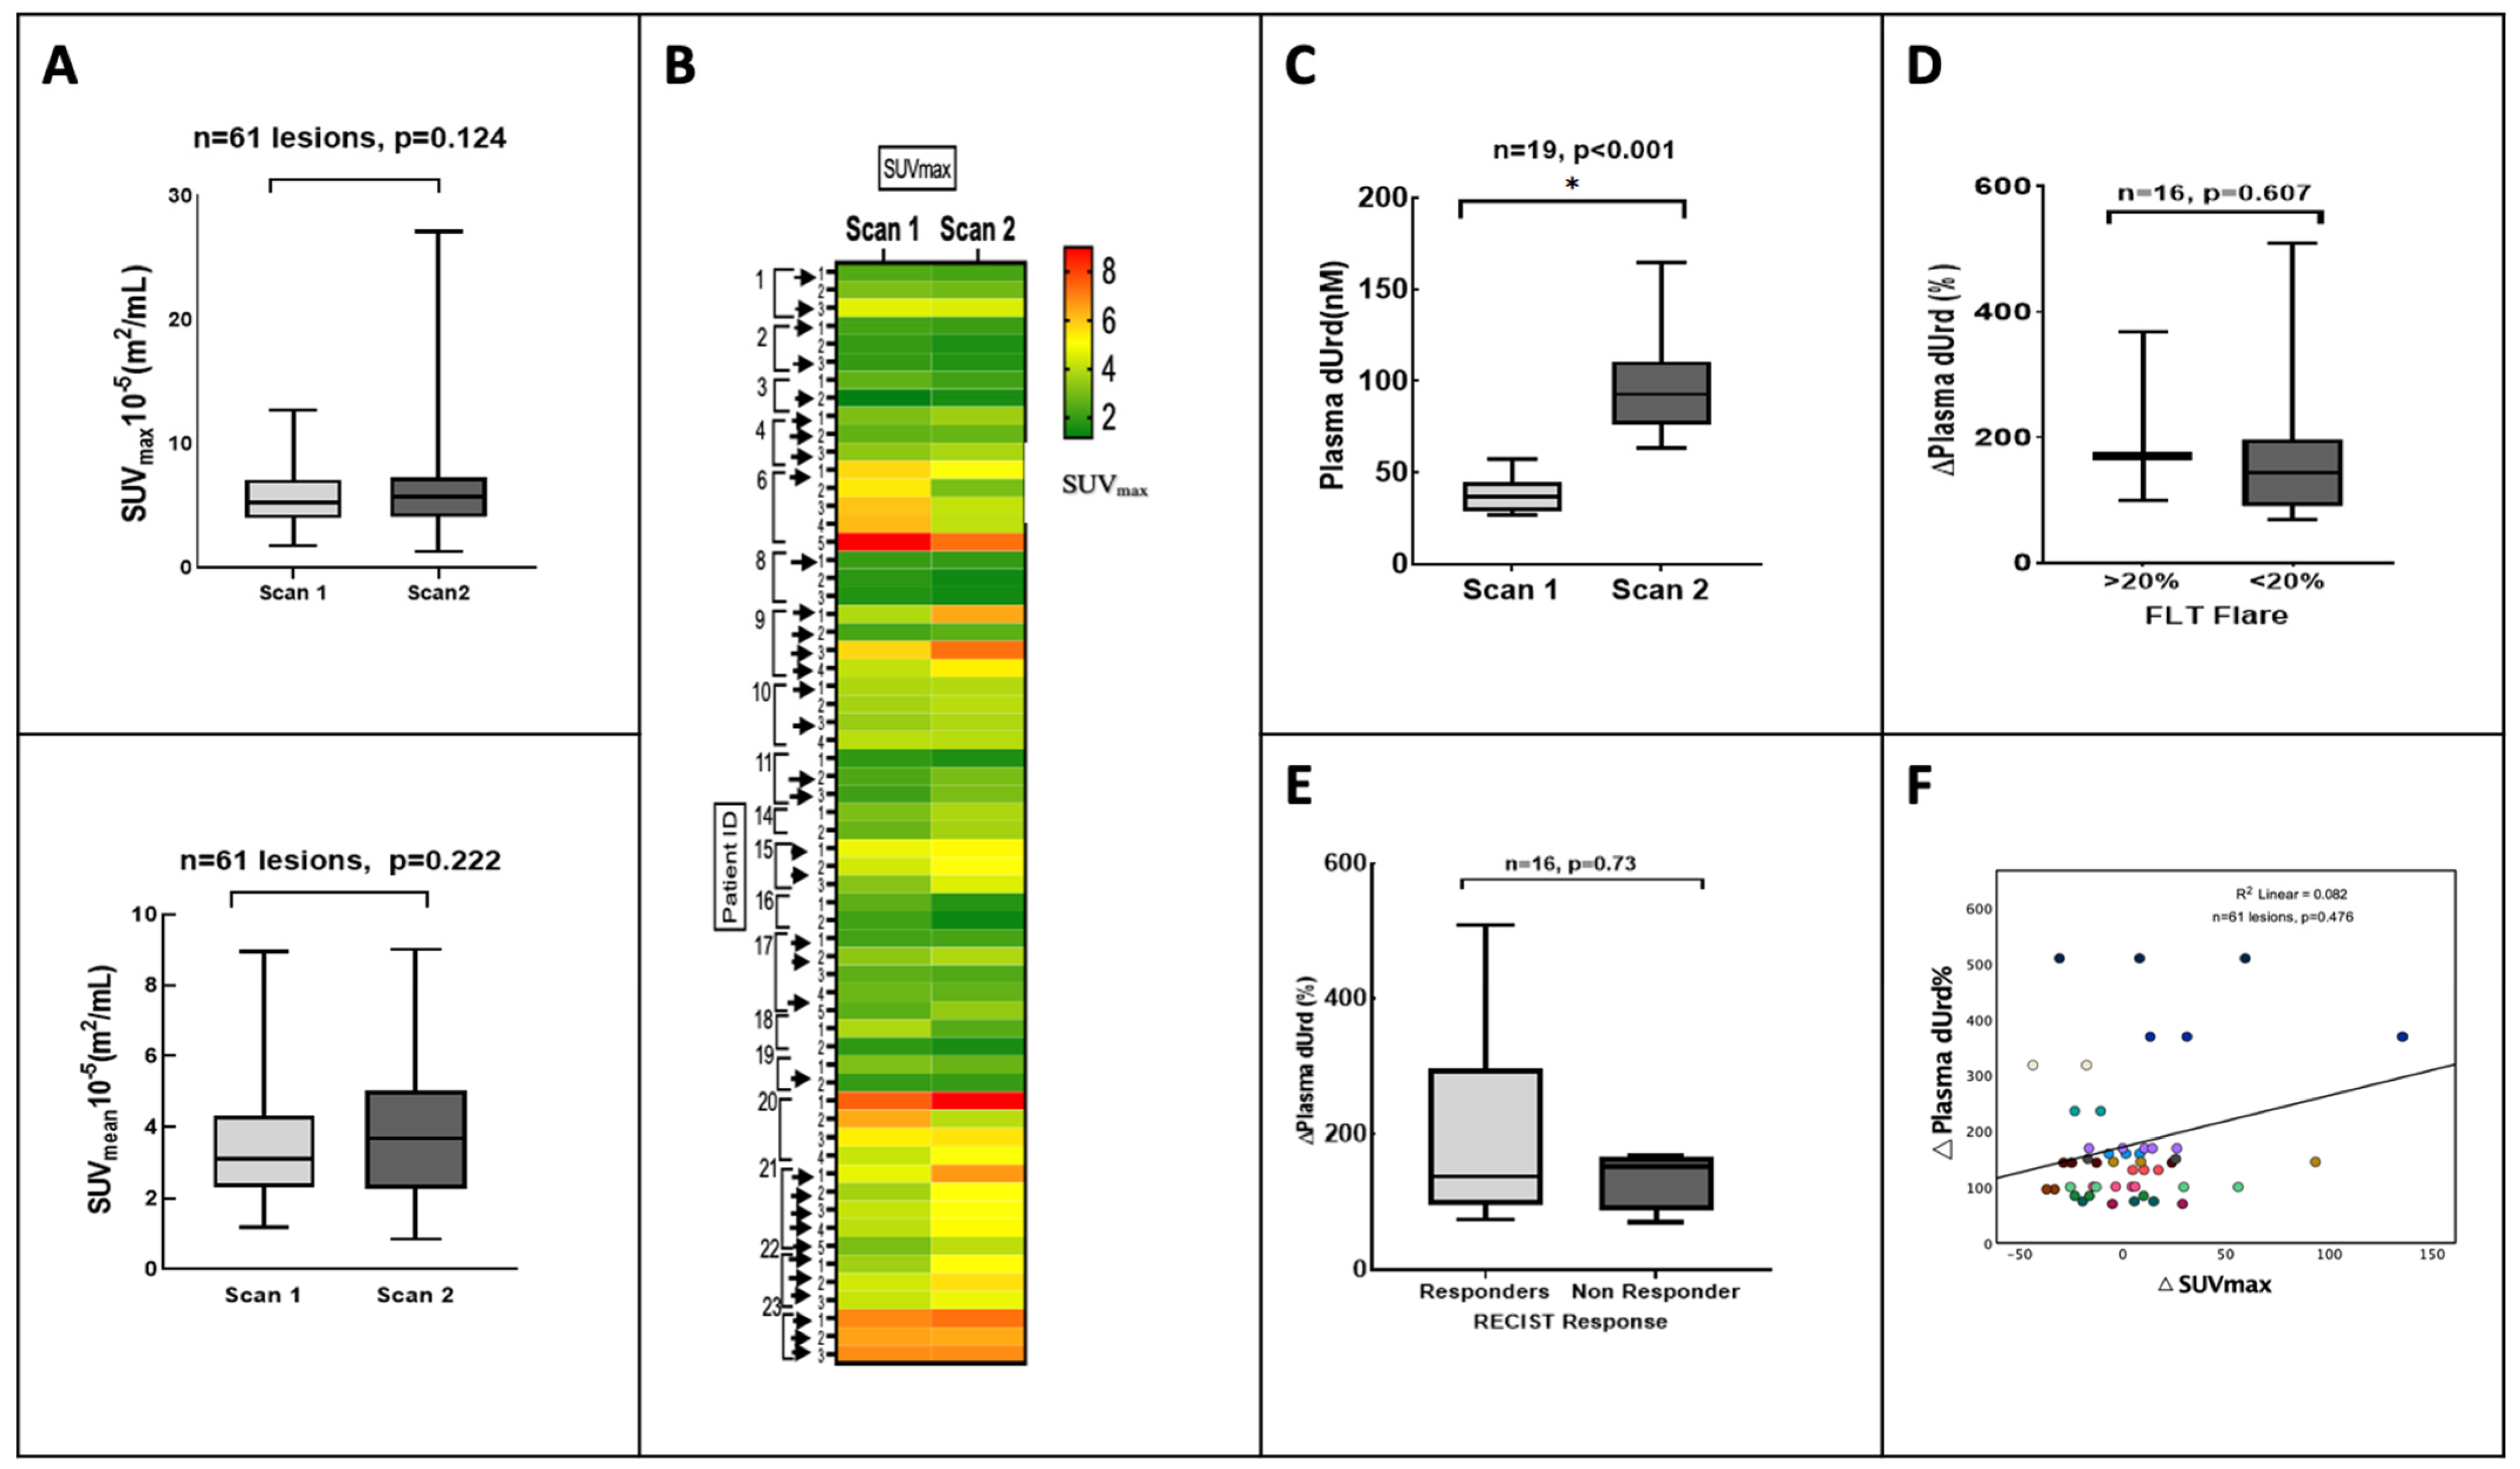
3.2. Analysis by Plasma dUrd
3.3. Clinical Outcome
3.4. Pemetrexed Increased 18F-FLT Uptake in TS-Responsive Healthy Tissues
3.5. Plasma TK1 Activity Is Unchanged with Pemetrexed Treatment
4. Discussion
5. Conclusions
Supplementary Materials
Author Contributions
Funding
Institutional Review Board Statement
Informed Consent Statement
Data Availability Statement
Acknowledgments
Conflicts of Interest
Abbreviations
References
- Sung, H.; Ferlay, J.; Siegel, R.L.; Laversanne, M.; Soerjomataram, I.; Jemal, A.; Bray, F. Global cancer statistics 2020: GLOBOCAN estimates of incidence and mortality worldwide for 36 cancers in 185 countries. CA Cancer J. Clin. 2021, 71, 209–249. [Google Scholar] [CrossRef]
- Li, M.; Zhang, Q.; Fu, P.; Li, P.; Peng, A.; Zhang, G.; Song, X.; Tan, M.; Li, X.; Liu, Y.; et al. Pemetrexed plus platinum as the first-line treatment option for advanced non-small cell lung cancer: A meta-analysis of randomized controlled trials. PLoS ONE 2012, 7, e37229. [Google Scholar] [CrossRef]
- Planchard, D.; Popat, S.; Kerr, K.; Novello, S.; Smit, E.F.; Faivre-Finn, C.; Mok, T.S.; Reck, M.; Van Schil, P.E.; Hellmann, M.D.; et al. Metastatic non-small cell lung cancer: ESMO Clinical Practice Guidelines for diagnosis, treatment and follow-up. Ann. Oncol. 2018, 29, iv192–iv237. [Google Scholar] [CrossRef]
- Wilson, P.M.; Danenberg, P.V.; Johnston, P.G.; Lenz, H.J.; Ladner, R.D. Standing the test of time: Targeting thymidylate biosynthesis in cancer therapy. Nat. Rev. Clin. Oncol. 2014, 11, 282–298. [Google Scholar] [CrossRef]
- Rollins, K.D.; Lindley, C. Pemetrexed: A multitargeted antifolate. Clin. Ther. 2005, 27, 1343–1382. [Google Scholar] [CrossRef]
- Adjei, A.A. Pemetrexed (ALIMTA), a novel multitargeted antineoplastic agent. Clin. Cancer Res. 2004, 10, 4276s–4280s. [Google Scholar] [CrossRef]
- Banerjee, S.; Michalarea, V.; Ang, J.E.; Ingles Garces, A.; Biondo, A.; Funingana, I.G.; Little, M.; Ruddle, R.; Raynaud, F.; Riisnaes, R.; et al. A Phase I Trial of CT900, a Novel α-Folate Receptor-Mediated Thymidylate Synthase Inhibitor, in Patients with Solid Tumors with Expansion Cohorts in Patients with High-Grade Serous Ovarian Cancer. Clin. Cancer Res. 2022, 28, 4634–4641. [Google Scholar] [CrossRef]
- Slusarczyk, M.; Serpi, M.; Ghazaly, E.; Kariuki, B.M.; McGuigan, C.; Pepper, C. Single Diastereomers of the Clinical Anticancer ProTide Agents NUC-1031 and NUC-3373 Preferentially Target Cancer Stem Cells. J. Med. Chem. 2021, 64, 8179–8193. [Google Scholar] [CrossRef]
- Almqvist, H.; Axelsson, H.; Jafari, R.; Dan, C.; Mateus, A.; Haraldsson, M.; Larsson, A.; Martinez Molina, D.; Artursson, P.; Lundbäck, T.; et al. CETSA screening identifies known and novel thymidylate synthase inhibitors and slow intracellular activation of 5-fluorouracil. Nat. Commun. 2016, 7, 11040. [Google Scholar] [CrossRef]
- Very, N.; Hardivillé, S.; Decourcelle, A.; Thévenet, J.; Djouina, M.; Page, A.; Vergoten, G.; Schulz, C.; Kerr-Conte, J.; Lefebvre, T.; et al. Thymidylate synthase O-GlcNAcylation: A molecular mechanism of 5-FU sensitization in colorectal cancer. Oncogene 2022, 41, 745–756. [Google Scholar] [CrossRef]
- Bollineni, V.R.; Kramer, G.M.; Jansma, E.P.; Liu, Y.; Oyen, W.J. A systematic review on [(18)F]FLT-PET uptake as a measure of treatment response in cancer patients. Eur. J. Cancer 2016, 55, 81–97. [Google Scholar] [CrossRef]
- Perumal, M.; Pillai, R.G.; Barthel, H.; Leyton, J.; Latigo, J.R.; Forster, M.; Mitchell, F.; Jackman, A.L.; Aboagye, E.O. Redistribution of nucleoside transporters to the cell membrane provides a novel approach for imaging thymidylate synthase inhibition by positron emission tomography. Cancer Res. 2006, 66, 8558–8564. [Google Scholar] [CrossRef]
- Ford, H.E.; Mitchell, F.; Cunningham, D.; Farrugia, D.C.; Hill, M.E.; Rees, C.; Calvert, A.H.; Judson, I.R.; Jackman, A.L. Patterns of elevation of plasma 2’-deoxyuridine, a surrogate marker of thymidylate synthase (TS) inhibition, after administration of two different schedules of 5-fluorouracil and the specific TS inhibitors raltitrexed (Tomudex) and ZD9331. Clin. Cancer Res. 2002, 8, 103–109. [Google Scholar]
- Pillai, R.G.; Forster, M.; Perumal, M.; Mitchell, F.; Leyton, J.; Aibgirhio, F.I.; Golovko, O.; Jackman, A.L.; Aboagye, E.O. Imaging pharmacodynamics of the alpha-folate receptor-targeted thymidylate synthase inhibitor BGC 945. Cancer Res. 2008, 68, 3827–3834. [Google Scholar] [CrossRef]
- Kenny, L.M.; Contractor, K.B.; Stebbing, J.; Al-Nahhas, A.; Palmieri, C.; Shousha, S.; Coombes, R.C.; Aboagye, E.O. Altered tissue 3’-deoxy-3’-[18F]fluorothymidine pharmacokinetics in human breast cancer following capecitabine treatment detected by positron emission tomography. Clin. Cancer Res. 2009, 15, 6649–6657. [Google Scholar] [CrossRef]
- Frings, V.; van der Veldt, A.A.; Boellaard, R.; Herder, G.J.; Giovannetti, E.; Honeywell, R.; Peters, G.J.; Thunnissen, E.; Hoekstra, O.S.; Smit, E.F. Pemetrexed induced thymidylate synthase inhibition in non-small cell lung cancer patients: A pilot study with 3’-deoxy-3’-[¹⁸F]fluorothymidine positron emission tomography. PLoS ONE 2013, 8, e63705. [Google Scholar] [CrossRef]
- Katayama, H.; Takahashi, S.; Maeda, Y.; Kobata, T.; Oishi, A.; Sasakawa, Y.; Shibata, T. Accuracy of target delineation by positron emission tomography-based auto-segmentation methods after deformable image registration: A phantom study. Phys. Med. 2020, 76, 194–201. [Google Scholar] [CrossRef]
- Eisenhauer, E.A.; Therasse, P.; Bogaerts, J.; Schwartz, L.H.; Sargent, D.; Ford, R.; Dancey, J.; Arbuck, S.; Gwyther, S.; Mooney, M.; et al. New response evaluation criteria in solid tumours: Revised RECIST guideline (version 1.1). Eur. J. Cancer 2009, 45, 228–247. [Google Scholar] [CrossRef]
- Wahl, R.L.; Jacene, H.; Kasamon, Y.; Lodge, M.A. From RECIST to PERCIST: Evolving Considerations for PET response criteria in solid tumors. J. Nucl. Med. 2009, 50 (Suppl. S1), 122S–150S. [Google Scholar] [CrossRef]
- Kramer, G.M.; Liu, Y.; de Langen, A.J.; Jansma, E.P.; Trigonis, I.; Asselin, M.C.; Jackson, A.; Kenny, L.; Aboagye, E.O.; Hoekstra, O.S.; et al. Repeatability of quantitative. Eur. J. Nucl. Med. Mol. Imaging 2018, 45, 951–961. [Google Scholar] [CrossRef]
- Kenny, L.; Coombes, R.C.; Vigushin, D.M.; Al-Nahhas, A.; Shousha, S.; Aboagye, E.O. Imaging early changes in proliferation at 1 week post chemotherapy: A pilot study in breast cancer patients with 3’-deoxy-3’-[18F]fluorothymidine positron emission tomography. Eur. J. Nucl. Med. Mol. Imaging 2007, 34, 1339–1347. [Google Scholar] [CrossRef]
- de Langen, A.J.; Klabbers, B.; Lubberink, M.; Boellaard, R.; Spreeuwenberg, M.D.; Slotman, B.J.; de Bree, R.; Smit, E.F.; Hoekstra, O.S.; Lammertsma, A.A. Reproducibility of quantitative 18F-3’-deoxy-3’-fluorothymidine measurements using positron emission tomography. Eur. J. Nucl. Med. Mol. Imaging 2009, 36, 389–395. [Google Scholar] [CrossRef]
- Paoletti, C.; Barlow, W.E.; Cobain, E.F.; Bergqvist, M.; Mehta, R.S.; Gralow, J.R.; Hortobagyi, G.N.; Albain, K.S.; Pusztai, L.; Sharma, P.; et al. Evaluating Serum Thymidine Kinase 1 in Patients with Hormone Receptor-Positive Metastatic Breast Cancer Receiving First-line Endocrine Therapy in the SWOG S0226 Trial. Clin. Cancer Res. 2021, 27, 6115–6123. [Google Scholar] [CrossRef]
- Li, K.M.; Rivory, L.P.; Clarke, S.J. Rapid quantitation of plasma 2’-deoxyuridine by high-performance liquid chromatography/atmospheric pressure chemical ionization mass spectrometry and its application to pharmacodynamic studies in cancer patients. J. Chromatogr. B Anal. Technol. Biomed. Life Sci. 2005, 820, 121–130. [Google Scholar] [CrossRef]
- Chen, X.; Yang, Y.; Berger, I.; Khalid, U.; Patel, A.; Cai, J.; Farwell, M.D.; Langer, C.; Aggarwal, C.; Albelda, S.M.; et al. Early detection of pemetrexed-induced inhibition of thymidylate synthase in non-small cell lung cancer with FLT-PET imaging. Oncotarget 2017, 8, 24213–24223. [Google Scholar] [CrossRef]
- Korkmaz, T.; Seber, S.; Okutur, K.; Basaran, G.; Yumuk, F.; Dane, F.; Ones, T.; Polat, O.; Madenci, O.C.; Demir, G.; et al. Serum thymidine kinase 1 levels correlates with FDG uptake and prognosis in patients with non small cell lung cancer. Biomarkers 2013, 18, 88–94. [Google Scholar] [CrossRef]
- Wei, Y.T.; Luo, Y.Z.; Feng, Z.Q.; Huang, Q.X.; Mo, A.S.; Mo, S.X. TK1 overexpression is associated with the poor outcomes of lung cancer patients: A systematic review and meta-analysis. Biomark. Med. 2018, 12, 403–413. [Google Scholar] [CrossRef]
- Nisman, B.; Nechushtan, H.; Biran, H.; Gantz-Sorotsky, H.; Peled, N.; Gronowitz, S.; Peretz, T. Serum thymidine kinase 1 activity in the prognosis and monitoring of chemotherapy in lung cancer patients: A brief report. J. Thorac. Oncol. 2014, 9, 1568–1572. [Google Scholar] [CrossRef]
- van der Wilt, C.L.; Marinelli, A.; Pinedo, H.M.; Cloos, J.; Smid, K.; van de Velde, C.J.; Peters, G.J. The effect of different routes of administration of 5-fluorouracil on thymidylate synthase inhibition in the rat. Eur. J. Cancer 1995, 31A, 754–760. [Google Scholar] [CrossRef]


| Demographics | N | (%) |
|---|---|---|
| Median age | 62 | 38–78 (IQR) |
| Gender | ||
| Male | 9 | (43) |
| Female | 12 | (57) |
| Race | ||
| Caucasian | 18 | (86) |
| Asian | 2 | (9.5) |
| African | 1 | (5) |
| Smoking History | ||
| Non-smoker | 5 | (24) |
| Ex-smoker | 8 | (38) |
| Smoking at time of diagnosis | 8 | (38) |
| Clinical | ||
| ECOG PS | ||
| 0 | 3 | (14) |
| 2 | 3 | (14) |
| 1 | 15 | (72) |
| Histology | ||
| Genetic Alterations | ||
| Nil reported | 13 | (62) |
| KRAS codon 61 | 1 | (5) |
| KRAS G12V | 1 | (5) |
| ALK fusions | 2 | (10) |
| EGFR ex 19 del, T790M | 3 | (14) |
| EGFR L858R | 1 | (5) |
| TTF1 | ||
| Negative | 2 | (10) |
| Positive | 19 | (1) |
| Chemotherapy | ||
| Cisplatin + pemetrexed | 12 | (57) |
| Carboplatin + pemetrexed | 9 | (43) |
| Prior local therapies | 3 | (14) |
Disclaimer/Publisher’s Note: The statements, opinions and data contained in all publications are solely those of the individual author(s) and contributor(s) and not of MDPI and/or the editor(s). MDPI and/or the editor(s) disclaim responsibility for any injury to people or property resulting from any ideas, methods, instructions or products referred to in the content. |
© 2023 by the authors. Licensee MDPI, Basel, Switzerland. This article is an open access article distributed under the terms and conditions of the Creative Commons Attribution (CC BY) license (https://creativecommons.org/licenses/by/4.0/).
Share and Cite
Aravind, P.; Popat, S.; Barwick, T.D.; Soneji, N.; Lythgoe, M.; Sreter, K.B.; Lozano-Kuehne, J.P.; Bergqvist, M.; Patel, N.; Aboagye, E.O.; et al. A Subset of Non-Small Cell Lung Cancer Patients Treated with Pemetrexed Show 18F-Fluorothymidine “Flare” on Positron Emission Tomography. Cancers 2023, 15, 3718. https://doi.org/10.3390/cancers15143718
Aravind P, Popat S, Barwick TD, Soneji N, Lythgoe M, Sreter KB, Lozano-Kuehne JP, Bergqvist M, Patel N, Aboagye EO, et al. A Subset of Non-Small Cell Lung Cancer Patients Treated with Pemetrexed Show 18F-Fluorothymidine “Flare” on Positron Emission Tomography. Cancers. 2023; 15(14):3718. https://doi.org/10.3390/cancers15143718
Chicago/Turabian StyleAravind, Preetha, Sanjay Popat, Tara D. Barwick, Neil Soneji, Mark Lythgoe, Katherina B. Sreter, Jingky P. Lozano-Kuehne, Mattias Bergqvist, Neva Patel, Eric O. Aboagye, and et al. 2023. "A Subset of Non-Small Cell Lung Cancer Patients Treated with Pemetrexed Show 18F-Fluorothymidine “Flare” on Positron Emission Tomography" Cancers 15, no. 14: 3718. https://doi.org/10.3390/cancers15143718
APA StyleAravind, P., Popat, S., Barwick, T. D., Soneji, N., Lythgoe, M., Sreter, K. B., Lozano-Kuehne, J. P., Bergqvist, M., Patel, N., Aboagye, E. O., & Kenny, L. M. (2023). A Subset of Non-Small Cell Lung Cancer Patients Treated with Pemetrexed Show 18F-Fluorothymidine “Flare” on Positron Emission Tomography. Cancers, 15(14), 3718. https://doi.org/10.3390/cancers15143718