Article

Voltage-Gated Sodium Channel NaV1.7 Inhibitors with Potent Anticancer Activities in Medullary Thyroid Cancer Cells

by
Piyasuda Pukkanasut
1,
Jason Whitt
2,
Rachael Guenter
2,
Shannon E. Lynch
3,4,
Carlos Gallegos
4,5,
Margarita Jacaranda Rosendo-Pineda
6,
Juan Carlos Gomora
6,
Herbert Chen
2,7,
Diana Lin
7,
Anna Sorace
4,5,8,
Renata Jaskula-Sztul
2,8,* and
Sadanandan E. Velu
1,8,*
1
Department of Chemistry, The University of Alabama at Birmingham, Birmingham, AL 35294, USA
2
Department of Surgery, The University of Alabama at Birmingham, Birmingham, AL 35294, USA
3
Graduate Biomedical Sciences, The University of Alabama at Birmingham, Birmingham, AL 35294, USA
4
Department of Radiology, The University of Alabama at Birmingham, Birmingham, AL 35294, USA
5
Department of Biomedical Engineering, The University of Alabama at Birmingham, Birmingham, AL 35294, USA
6
Departamento de Neuropatología Molecular, Instituto de Fisiología Celular, Universidad Nacional Autónoma de México, Mexico City 04510, Mexico
7
Department of Pathology, The University of Alabama at Birmingham, Birmingham, AL 35233, USA
8
O’Neal Comprehensive Cancer Center, The University of Alabama at Birmingham, Birmingham, AL 35233, USA
*
Authors to whom correspondence should be addressed.
Cancers 2023, 15(10), 2806; https://doi.org/10.3390/cancers15102806
Submission received: 13 March 2023 / Revised: 8 May 2023 / Accepted: 11 May 2023 / Published: 17 May 2023
(This article belongs to the Collection Ion Channels in Cancer Therapies)

Abstract

:

Simple Summary

Despite the recent advances in the diagnosis and treatment of medullary thyroid cancer (MTC), it remains an understudied cancer type and continues to disproportionately contribute to thyroid-cancer-related mortality. In this manuscript, we report, for the first time, the overexpression of voltage-gated sodium channel subtype NaV1.7 in MTC cells and MTC patient samples, which is not expressed in normal thyroid cells and tissues. We establish the druggability of this channel by identifying a novel inhibitor (SV188) of this channel and investigate its mode of binding and ability to inhibit the INa current in NaV1.7. We also show that SV188 significantly inhibited the migration and invasion of aggressive MTC cells at doses lower than its cytotoxic concentration. Overall, our data suggest that the unique overexpression of NaV1.7 in MTC can be exploited for the discovery of novel small-molecule drugs to treat MTC metastasis.

Abstract

Our results from quantitative RT-PCR, Western blotting, immunohistochemistry, and the tissue microarray of medullary thyroid cancer (MTC) cell lines and patient specimens confirm that VGSC subtype NaV1.7 is uniquely expressed in aggressive MTC and not expressed in normal thyroid cells and tissues. We establish the druggability of NaV1.7 in MTC by identifying a novel inhibitor (SV188) and investigate its mode of binding and ability to inhibit INa current in NaV1.7. The whole-cell patch-clamp studies of the SV188 in the NaV1.7 channels expressed in HEK-293 cells show that SV188 inhibited the INa current in NaV1.7 with an IC50 value of 3.6 µM by a voltage- and use-dependent blockade mechanism, and the maximum inhibitory effect is observed when the channel is open. SV188 inhibited the viability of MTC cell lines, MZ-CRC-1 and TT, with IC50 values of 8.47 μM and 9.32 μM, respectively, and significantly inhibited the invasion of MZ-CRC-1 cells by 35% and 52% at 3 μM and 6 μM, respectively. In contrast, SV188 had no effect on the invasion of TT cells derived from primary tumor, which have lower basal expression of NaV1.7. In addition, SV188 at 3 μM significantly inhibited the migration of MZ-CRC-1 and TT cells by 27% and 57%, respectively.

Graphical Abstract

1. Introduction

Medullary thyroid cancer (MTC) is a type of neuroendocrine tumor (NET) evolving from neural-crest-derived calcitonin-producing parafollicular C cells, which in turn are responsible for controlling Ca2+ levels in the bloodstream [1,2,3]. MTC accounts for approximately 4% of all thyroid cancer cases but disproportionally accounts for 13% of thyroid-cancer-related deaths [4,5]. The major cause of MTC deaths is hepatic metastases, and patients with the metastatic form of this disease have a poor prognosis, with a 10-year survival rate of only 10% [6]. This subtype within thyroid cancer is particularly challenging to treat, as it does not respond to standard-of-care treatments [7]. Surgery is the only curative treatment for MTC [8]. Although, there are targeted agents to treat metastatic disease, none show an effect on overall survival [9]. Tyrosine kinase inhibitors (TKIs) are one of the treatment options for metastatic MTC [10]. Currently, there are only four FDA-approved TKIs that have been used for the treatment of advanced or progressive MTC, namely, vandetanib, cabozatinib, selpercatinib, and pralsetinib [4]. Although these are considered to be promising drugs to treat advanced MTC, drug resistance arising from the mutations in tyrosine kinase domains is a significant problem [11]. In addition, these drugs exhibit multiple side effects such as diarrhea, rash, fatigue, hypertension, and weight loss [12]. Furthermore, approximately 27% of vandetanib-treated patients showed QTc (corrected for heart rate) prolongation, which is a serious side effect that could lead to sudden cardiac arrest [12,13]. Despite the recent advances in diagnosis and treatment, MTC remains an understudied cancer type and continues to disproportionately contribute to thyroid-cancer-related mortality. Therefore, there is a need in the field to identify additional therapeutic targets for MTC.
One such promising anti-metastatic drug target is a family of voltage-gated sodium channels (VGSCs) [14,15,16,17], which are responsible for the generation and propagation of action potentials in excitable cells [18,19]. There are nine different subtypes of VGSCs expressed in different organs, namely, NaV1.1–NaV1.9. The complex structure of VGSCs consists of an α-subunit and one or two auxiliary β-subunits. The α-subunit contains four very similar domains, and each domain contains six transmembrane domains, S1–S6, where S1–S4 are the voltage-sensing domains and S5 and S6 are the pore-forming domains (Figure 1A,B) [20]. VGSCs play a crucial role in the membrane depolarization during the action potential in excitable cells such as neurons, skeletal, and cardiac muscle cells. The effect of the membrane potential (Vm) in non-excitable cells such as cancer cells was first discovered in the 1970s. Although a few studies reported the excitability of cancer cells where a larger number of membrane currents and Vm fluctuations was observed [21,22], these discrete fluctuations might not be enough to generate or propagate the action potentials, a distinctive characteristic that defines a cell as “electrically excitable” [23]. The changes in the Vm in cancer cells and other non-excitable cells were found to be related to cell proliferation [24], migration [25], and wound healing and regeneration [26,27]. According to Tokuoka et al., membrane potential becomes significantly less negative during the transformation of normal cells to cancerous [28]. Similarly, several studies showed that the Vm in cancer cells is more depolarized and that cancer cells have substantially higher intracellular Na+ levels compared to non-cancerous tissues [28,29,30,31].
Recent studies have put forth a few plausible mechanisms for the involvement of VGSC sub-types in the development of metastasis in various tumors [14,32,33,34]. VGSCs are co-localized with the Na+/H+ exchanger isoform 1, the NHE1 and Na+/Ca2+ exchanger, and the NCX in the cell membrane [33,35,36]. An increase in Na+ influx activates H+ efflux through NHE1, thereby increasing the acidity of the tumor microenvironment. An acidic tumor microenvironment is known to activate the secretion of extracellular matrix proteases, most notably cathepsins and matrix metalloproteases (MMPs), which facilitate cancer cell migration from the primary tumor to the distal metastatic sites [37,38]. At the same time, an increased Na+ concentration within the cells results in a Ca2+ influx through NCX activation that leads to a higher Ca2+ consumption by the mitochondria, which then release Ca2+ to the cytosol. A greater Ca2+ concentration in the cytosol initiates actin polymerization and the formation of invadopodia, which supports cancer cell movement and migration (Figure 1C) [14,33,36]. Thus, VGSCs play a critical role in promoting tumor metastasis; therefore, the inhibition of VGSC activity by small molecules is a novel strategy for the development of therapeutic drugs for metastatic cancers [39,40,41].
Figure 1. Schematic structure of the voltage-gated sodium channel subtype NaV1.7 (PDB 6j8j) [42] with 𝛽-subunits and tetrodotoxin (TTX). (A) The side view of NaV1.7 transmembrane segments S1–S6; S1–S4 are shown in cyan, S5–S6 are shown in green, TTX binding site is highlighted by yellow circle, and local anesthetic binding site is highlighted by gray oval. (B) The bottom view of NaV1.7 with TTX bound. (C) The proposed mechanism for the involvement of VGSCs in cancer cell motility; VGSC is colocalized with NHE1 and NCX. The activity of VGSC facilitates cancer cell motility by increasing acidity of extracellular matrix (ECM) environment, inducing ECM protease secretion, and increasing the concentration of Ca2+ in intracellular fluid, which supports invadopodia formation by cancer cells.
Cancers 15 02806 g001
VGSCs are druggable targets, and their inhibitors are commonly used as anticonvulsants, local anesthetics, and antiarrhythmics and in the treatment of neuronal excitability disorders [43]. Clinically used VGSC inhibitors are considered to be state-dependent or use-dependent inhibitors, which show higher affinity to the binding site when the channel is in the open or inactivated state and show lower affinity when the channel is in the resting state [44,45]. The selectivity of drugs toward the cells in the disease state vs. the normal state is due to the preferential binding of the drug molecules to the binding site (the S6 of Domain IV), which is located in the inner pore of the channel (Figure 1A). In the disease state, the channels have higher rates of cell depolarization (opening state); as a consequence, the relative time of the channels staying in the resting state is lower than that of the normal cells, resulting in more selective drug binding to the channels in the disease state [46,47,48].
In recent years, VGSC expression has been found to be aberrantly enhanced in non-excitable cells in aggressive human cancers of epithelial origin such as lung, prostate, ovarian, colon, and breast cancer, and this overexpression has been shown to be associated with cancer cells invasiveness [14,16,26,41,49,50]. To date, multiple VGSC subtypes have been targeted for the discovery of potential anticancer drugs [15,16,17,40,51,52]. Recently, NaV1.6 was found to promote human follicular thyroid carcinoma by increasing cell proliferation, epithelial-to-mesenchymal transition, and invasion [53]. However, no such investigation of the sodium channel inhibitors in MTC has been reported since the initial discovery of the presence of sodium channel genes in MTC cells by Klugbauer et al. in 1995 [54].
As a part of our interest in targeting VGSCs for cancer therapy, we recently reported small-molecule inhibitors for the VGSC subtype NaV1.5, with impressive cell invasion-inhibitory activities in breast cancer cells, MDA-MB-231 and colon cancer cells, SW620 and HCT116 [40,55]. As a continuation of these studies, we investigated the expression of VGSC subtype NaV1.7 in MTC and discovered the small-molecule inhibitors of this channel. Here, we report, for the first time, the discovery of the overexpression of NaV1.7 (SCN9A gene) in aggressive MTC cells and patient samples and the lack of this protein in normal thyroid cells and tissues. We further establish the druggability of the NaV1.7 channel in MTC by identifying a novel inhibitor and investigate its mode of binding and ability to inhibit the Na+ current (INa) in NaV1.7. This study demonstrates how the lead compound targeting NaV1.7 inhibits MTC cell viability, migration, and invasion in vitro.

2. Materials and Methods

2.1. Cell Culture

Human MTC cell line MZ-CRC-1 was obtained from Dr. Gilbert Cote (MD Anderson Cancer Center, Houston, TX, USA) and human MTC cell line (TT) was obtained from Barry D. Nelkin (John Hopkins University, Baltimore, MD, USA). Human MTC cell lines were maintained under the condition described in [56]. Mouse MTC cell line (MTC-p25OE) was obtained from James Bibb (University of Alabama at Birmingham, Birmingham, AL, USA). Human normal thyroid cell lines (Htori-3 and Nty-ori) were purchased from Sigma Life Science/European Collection of Cell Cultures.

2.2. Human Tissue Samples

Human MTC tumor samples with pathology status and control tumor samples were obtained from UAB Tissue Biorepository, with approved IRB protocol (IRB-300006132-002). The MTC microarray contained formalin-fixed, paraffin-embedded thyroid biopsies from 45 patients including normal thyroid, primary MTC, and metastatic MTC, each mounted in triplicate for a total of 133 cores. Tumor cell lysates were prepared for Western blot analysis as described below.

2.3. Western Blot Analysis

Cells or tumor specimens were lysed using radio-immunoprecipitation assay (RIPA) buffer with the addition of protease and phosphatase inhibitor (Sigma-Aldrich, St. Louis, MO, USA). Protein concentrations in each sample were quantified using a Pierce BCA Protein Assay Kit (Thermos Scientific, Waltham, MA, USA). Prior to performing gel electrophoresis, 1:1 of 2× Leammli Sample buffer (Bio-Rad, Hercules, CA, USA) was added to protein samples. The mixture was diluted with 5% 2-mercaptoethanol (ThermoFisher Scientific, Waltham, MA, USA). All protein samples were heated at 95 °C for 5 min and run on 4–15% Criterion TGX gradient gels (Bio-Rad). Gel transfer and immunoblotting detections were performed as previously described [57]. Primary antibodies for NaV1.7 (EMD Millipore Corp., Darmstadt, Germany) were used at 1:1000, and the reference protein GAPDH (Cell Signaling Technology, Danvers, CA, USA) and β-actin (Cell Signaling Technology) were used at 1:2000. Horseradish peroxidase-conjugated anti-rabbit/mouse with a dilution of 1:1000 (Cell Signaling Technology) was used as secondary antibodies. The molecular weight-marker broad-range protein ladder (10–260 kDa) (Spectra Multicolor, ThermoFisher Scientific) was used to confirm the size of the protein of our interest.

2.4. TMA Staining, Quantification, and Evaluation

NaV1.7 was immunostained using an anti-NaV1.7 monoclonal antibody (ab85015, Abcam, Cambridge, UK). Positive and negative immunohistochemistry (IHC) controls were generated from cell lines that represent high or no expression of NaV1.7. MZ-CRC-1, which showed high expression of NaV1.7, was used as a positive control, and Nthy-ori3-1 (normal thyroid), which did not have an expression of NaV1.7, was used as a negative control. NaV1.7 expression was quantified within each core using an automated digital quantification (custom MATLAB code). IHC samples were automatically segmented to extract tissue boundaries and transition from RGB images to HSV, followed by a saturation mask to distinguish tissue. The distribution of saturation was plotted, and Otsu’s automated threshold for separating positive vs. negative staining was employed to extract out percentage of positive tissue expression.

2.5. Real-Time Quantitative PCR (RT-qPCR)

Each RNA sample was isolated using RNeasy Plus Mini kit (Qiagen, Hilden, Germany). The RNA concentrations were determined by NanoDrop 1000 spectrophotometer (Thermo Fisher Scientific). RNA samples that have a ratio of absorbance greater than 2.0 at 260 nm and 280 nm were used in the experiments. Complementary DNA (cDNA) was synthesized using iScript RT Supermix (Bio-Rad), and 1 μg total RNA was used in each sample. PCR samples were prepared using SYBR Green master mixes (Bio-Rad). Real-time quantitative PCR was performed in triplicate on CFX Connect Real-Time PCR Detection System (Bio-Rad). The sequences of the PCR primers, SCN5A (NaV1.5), SCN8A (NaV1.6), SCN9A (NaV1.7), and SCN9A1 (NHE1) used for the analysis in this experiment are SCN5A (NaV1.5) forward: CACGCGTTCACTTTCCTTC, reverse: CATCAGCCAGCTTCTTCACA, SCN8A (NaV1.6) forward: CGCCTTATGACCCAGGACTA, reverse: GTGCCTCTTCCTGTTGCTTC, SCN9A (NaV1.7) forward: GGCTCCTTGTTTTCTGCAAG, reverse: TGGCTTGGCTGATGTTACTG and SCN9A1 (NHE1) forward: GGCATCGAGGACATCTGTGG, reverse: CTGCAGACTTGGGGTGGATG, as described in [34]. Target gene expression was normalized to either S27 or GAPDH, and the ΔΔCt method was used to calculate relative gene expression [58]. Error bars show the standard error of the mean (SEM).

2.6. NaV1.7 Transfection

Human embryonic kidney cells (HEK-293) were acquired from the American Type Cell Culture Collection (ATCC CRL-1573) and grown in DMEM/F12 mixture supplemented with 10% FBS, 100 U/mL penicillin, and 100 µg/mL streptomycin at 37 °C in a CO2 incubator. Transient transfections were performed with PEI (polyethylenimine; Santa Cruz Biotechnology, Dallas, TX, USA) in 35 mm dishes, by using a 3:1 ratio for PEI:DNA. HEK-293 cells were transfected with 2.5 µg of rat cDNA NaV1.7 (GenBank No. U79568) and 0.2 µg of GFP cDNA as a reporter gene. After transfection, cells were cultured for 24–72 h before being dissociated and seeded on 0.25 cm2 glass coverslips contained in a 35 mm Petri dish for electrophysiological experiments.

2.7. Electrophysiology

Sodium currents (INa) of NaV1.7 channels were recorded at room temperature (21 ± 2 °C) with the whole-cell configuration of the patch-clamp technique [59,60]. The NaV1.7 channels’ activity was investigated by using an Axopatch 200B amplifier, a Digidata1550B A/D converter, and pCLAMP 10.7 software (Molecular Devices, San Jose, CA, USA). Unless otherwise noted, the holding potential (HP) used in the experiments was −120 mV. Current recordings were usually sampled at 50 kHz, following 5 kHz analogue filtering. Whole-cell series resistance (Rs) and cell capacitance (Cm) were estimated from optimal cancellation of the capacitive transients with the built-in circuitry of the amplifier, and in some cases Rs was compensated electrically by 60–80%. Currents were recorded on two channels: one with on-line leak subtraction using the P/-5 method, and the other to evaluate cell stability and holding current. Only leak-subtracted data are shown. Recording pipettes were made from TW150-3 capillary tubing (WPI, Inc., Sarasota, FL, USA), using a Model P-97 Flaming-Brown pipette puller (Sutter Instrument Co., Novato, CA, USA). Cells were bathed in a solution containing the following composition (in mM): 158 NaCl, 2 CaCl2, 2 MgCl2, and 10 HEPES-NaOH (pH 7.4), with an osmolality of 305–310 mOsm. Cells were patched with microelectrodes containing the following internal solution (in mM): 110 CsF, 30 NaCl, 2 CaCl2, 10 EGTA, and 10 HEPES-CsOH (pH 7.4), with an osmolality of 295–300 mOsm. The recording chamber was continuously perfused by gravity at a rate of 2 mL/min, and solution exchange was accomplished by a manually controlled six-way rotary valve. A 50 mM stock solution of the compound SV188 dissolved in DMSO was used to prepare fresh test concentrations in external solution ranging from 0.3 to 30 µM. The highest concentration of DMSO in the tested SV188 solutions was 0.06%. Voltage-gated sodium currents were monitored by 16-ms depolarizing pulses to −10 mV from an HP of −120 mV applied every 10 s. Modifications to this protocol were used to obtain data concerning current–voltage (I–V) relationships and steady-state inactivation of sodium channels. Peak current values of current recordings were obtained by using the Clampfit application of pCLAMP software. Dose–response relationships for SV188 blockade were fit with the following Hill equation: Y = 1/(1 + 10 [(log IC50 − X) × h]), where X is the logarithm of concentration, Y is the fraction of current remaining after addition of the drug, IC50 is the concentration required for 50% blockade of current, and h is the Hill coefficient. For this analysis, current in control external solution was normalized to 1, and we assumed complete blockade of current with sufficient drug concentration. The voltage dependence of current activation was described with a single Boltzmann distribution: G = Gmax/(1 + exp (−(VmV1/2)/k)), where Gmax is the maximum normalized Na+ conductance, Vm is the test potential, V1/2 is the midpoint of activation, and k is the slope factor. The voltage-dependence of steady-state inactivation was also described with a single Boltzmann function as follows: I = Imax/(1 + exp ((VmV1/2)/k)), where Imax is the maximal normalized sodium current, Vm is the test potential, V1/2 is the midpoint of steady-state inactivation, and k is the slope factor.

2.8. Cell Viability Assay

A 3-(4,5-Dimethylthiazole-2-yl)-2,5-diphenyl tetrazolium bromide (MTT) assay (Sigma-Aldrich) was used to measure the effect of the compound against cell proliferation and IC50 determination. MTC cell lines were plated in flat-bottom 96-well plate at seeding density of 104 cells/well. Cells were allowed to grow overnight. Different concentrations of the treatment up to 100 μM were tested compared to control (0.2% DMSO) and incubated for 72 h. After the incubation, cell viability was determined using MTT reagent, the treatment media was removed, and 25 µL of serum-free media containing 0.5 mg/mL MTT (Sigma-Aldrich) was added to each well, followed by an incubation at 37 °C for 2 h. Then, the cells and MTT reagent were suspended with 75 µL of DMSO prior to the analysis at 562 nm using a plate reader (Infinite M200 PRO, TECAN, Männedorf, Switzerland). Percentage of cell viability and concentrations were plotted, and the IC50 value was calculated using GraphPad Prism9.3.1 [61]. The concentrations were converted to log10 (concentration), and the IC50 curve was plotted with normalized curve fit vs. dose response (variable slope) to obtain the IC50 value.

2.9. Motility Assays (Migration/Invasion)

Inhibition of cell migration and invasion was determined using the Boyden chamber assay. For migration assay, transwell cell culture inserts, with 8.0 μM pore size (Corning Life Sciences, Corning, NY, USA), were plated in 24-well plate (Costar, Corning Life Sciences). MTC cell suspension in serum-free media containing 0.06% DMSO (as a control) and different concentrations of SV188 were plated (4 × 10⁵ cells per insert) in upper compartment of transwell cell culture inserts, with 8.0 μM pore size, while 650 µL of media containing fetal bovine serum (chemo-attractant) was added in 24-well plates. MTC cells were allowed to migrate for 48 h. The cells that migrated through the membrane were stained using three-step staining kit (Fisher, Rockingham County, NH, USA). The membrane was cut and mounted on microscope slides, with size 25 × 75 × 1 mm (Fisher). The membranes were covered using microscope cover glass (Fisher). Migrated cells were counted from microscope (OLYMPUS DP74) imaging. Number of migrated cells from each individual experiment was normalized, and triplicated results were reported as mean fold change in number of cells migrated through membrane ± SEM. For invasion assay, the upper compartment was coated with Matrigel Metrix (Corning Life Sciences) to mimic the extra cellular matrix (ECM) environment. The gel was allowed to set by incubation at 37 °C for 2 h. Number of invaded cells from each individual experiment was normalized and reported as mean fold change in number of cells migrated through membrane ± SEM. Migration/invasion in each concentration was completed in quadruplicate for a total of 3 experiments. The results were plotted, and statistical significance was determined using GraphPad Prism 9.3.1 [61].

2.10. Cell Cycle Analysis Flow Cytometry

Cell cycle analysis data were acquired using Flow Cytometry (BD LSRFortessa™, BD Biosciences, Franklin Lakes, NJ, USA), and at least 3000 events were collected in each sample for 3 individual experiments. MZ-CRC-1 cells were plated on 90 mm Petri dishes in suspension (0.5–1 × 10⁶ cells). Cells were allowed to grow overnight before changing to the treatment media containing different concentrations of SV188; the final concentration were 3 µM, 6 µM, and 9 µM, and growth media containing 0.09% DMSO was used for the control. Cells were incubated for 48 h before being harvested using buffer containing EDTA. The cell pellets were washed with PBS prior to fixing by adding 70% ethanol (ice cold) dropwise while gently vortexing. The cells were fixed at −20 °C overnight. The next day, ethanol was removed, and cells were washed again with PBS and resuspended in staining buffer containing propidium iodide (PI) and RNase (FxCycleTMPI/RNase Staining, Invitrogen, Waltham, MA, USA). Cells were incubated in staining buffer in a dark cold place (4 °C) for 30 min before transferring to a cell cycle analysis tube and acquiring the data using flow cytometry. The data were processed using FlowJo 10.8.1 [62]. The combined results were plotted, and statistical significance was determined using GraphPad Prism 9.3.1 [61].

2.11. Statistical Analysis

Bivariate correlation with confidence interval was achieved through IBM SPSS Statistics for Macintosh, Version 29.0.0 [63]. Statistical significance was assessed using GraphPad Prism 9.3.1 [61], One-way ANOVA followed by Dunnett’s multiple comparisons test (GraphPad Software, San Diego, CA, USA). All data are expressed as mean ± standard error of the mean (SEM), unless otherwise noted.

2.12. General Methods for Compound Synthesis and Characterization

Anhydrous solvents used for reactions were purchased in Sure-Seal™ bottles from Aldrich chemical company. THF and ether were freshly distilled over sodium/benzophenone. Other reagents were purchased from Sigma-Aldrich, Alfa Aesar, or Acros. Solvent evaporations were carried out under vacuum using a rotary evaporator (BUCHI). Thin-layer chromatography (TLC) was performed on aluminum-backed Si gel plates, with fluorescent indicator (20 × 20 cm F-254, 200 μm, Dynamic Adsorbents, Norcross, GA, USA). TLC spots were visualized by UV light at 254 and 365 nm or by using staining agents such as ninhydrin or KMnO4. Purification by column and flash chromatography was carried out using Si gel (32–63 μm, Dynamic Adsorbents), using the solvent systems as indicated. The NMR spectra were recorded on a Bruker DPX 400 spectrometer. The peak calibration was accomplished using TMS or the NMR solvent peaks as internal standard. The chemical shift (δ) values and coupling constants (J) were given in parts per million and in Hz, respectively. Mass spectra were recorded on an Applied Biosystems 4000 Q Trap instrument at the Mass Spectrometry Facility in the department of Chemistry and Biochemistry, University of Alabama, Tuscaloosa, AL. All compounds are >97% pure by HPLC (Supplementary Figures S4–S6). HPLC traces were performed on Shimadzu HPLC with the following parts/software: DGU-20A3 Prominence Degasser, FCV-11AL Valve Unit, 2× LC-20AD Prominence Liquid Chromatographs, SIL-20AC HT Prominence Auto Sampler, CBM-20A Prominence Communications Bus Module, SPD-M20A Prominence Diode Array Detector, CTO-20AC Prominence Column Oven, and LCsolution Version 1.22 SP1. Mobile Phase Buffer (60% MeCN/40% H2O/0.1% formic acid) was freshly prepared using HPLC grade reagents/solvents in a 500 mL volumetric flask and thoroughly degassed using the DGU-20A3 Prominence Degasser. Raw data from the HPLC chromatograms were exported as text files and plotted using GraphPad Prism 9.3.1.

2.12.1. 4,4-Diphenylbutyric Acid (2)

To a solution of phenyl butyrolactone, 1 (0.5 g, 3.08 mmol) in anhydrous benzene (20 mL), anhydrous AlCl3 (0.62 g, 4.63 mmol) was added slowly, and the reaction mixture was stirred overnight under N2 atmosphere. When the reaction was complete as indicated by TLC (50% EtOAc in hexanes, Rf = 0.4), pH of the reaction mixture was adjusted to 1 using 1N. HCl. The reaction mixture was further diluted with distilled water (20 mL) and extracted with ether (3 × 20 mL). The combined organic layer was washed with water (2 × 30 mL) and brine (1 × 30 mL) and dried over Na2SO4. The drying agent was filtered off, and the filtrate was concentrated in a expression and patient disease pure 4,4-diphenylbutyric acid, 2 as a white solid (0. 698g, 94%). mp: 102–103 °C; 1H-NMR (CDCl3, 400MHz) δ 2.19–2.23 (m, 2H), 2.26–2.32 (m, 2H), 3.84 (t, 2H, J = 7.4 Hz), 7.06–7.10 (m, 2H), 7.12–7.20 (m, 8H), 9.47 (brS, 1H); 13C-NMR (CDCl3) δ: 30.4, 30.7, 50.5, 126.6, 128.0, 128.7, 144.1, 179.9; HRMS [M-H]+ calculated for C16H15O2 239.1072, found 239.1074.

2.12.2. 3-(Piperidin-1-yl)propan-1-amine (5)

To a solution of 1-piperidinepropionitrile, 3 (1 g, 7.23 mmol) in anhydrous MeOH (100 mL), Raney-Ni (2.5 g) suspension in water was added quickly and stirred for 12 h at room temperature under a hydrogen atmosphere from a balloon. TLC examination (20% MeOH in CHCl3, Rf = 0.12) showed that the reaction was complete. Raney Ni was filtered off carefully over celite 545 and washed with MeOH (50 mL) continuously without letting the celite dry out. The combined filtrate was concentrated under vacuum, redissolved in CH2Cl2 (50 mL), and dried over Na2SO4. The drying agent was removed by filtration, and the filtrate was concentrated under vacuum to obtain 3-(piperidin-1-yl)propan-1-amine, 5 (0.914 g, 89%) as a colorless oil. 1H-NMR (CDCl3, 400 MHz) δ 1.52–1.58 (m, 6H), 1.63 (quint, 2H, J = 7.44 Hz), 2.33 (t, 6H, J = 7.24 Hz), 2.65 (brS, 2H), 2.73 (t, 2H, J = 6.76 Hz); 13C-NMR (CDCl3, 400 MHz) δ 24.2, 25.8, 27.5, 40.9, 54.4, 57.6, 76.8, 77.2, 77.5; HRMS [M + H]+ calculated for C8 H19 N2 143.1548, found 143.1543.

2.12.3. 4,4-Diphenyl-N-[3-(piperidin-1-yl)propyl]butanamide (6)

To a solution of 3-(piperidin-1-yl)propan-1-amine. 5 (0.88g, 6.20 mmol) in 200 mL CH2Cl2 (200 mL) 4,4-diphenylbutyric acid, 2 (1.79 g, 7.44 mmol) was added, followed by the addition of EDC (1.44 g, 9.30 mmol) and DMAP (0.76g, 0.62 mmol). The reaction mixture was stirred overnight at room temperature under N2 atmosphere. The TLC examination (10% MeOH in CHCl3, Rf = 0.3) indicated the completion of the reaction. The reaction mixture was washed with saturated NaHCO3 (2 × 50 mL), water (2 × 50 mL), and brine (1 × 50 mL) and dried over Na2SO4. The drying agent was removed by filtration, and the filtrate was concentrated under vacuum to obtain the crude product, which was purified by column chromatography over Si gel using 0–5% MeOH in CHCl3 as eluent to afford the pure product 4,4-Diphenyl-N-[3-(piperidin-1-yl)propyl]butanamide, 6 (1.88g, 83.2%) as a white solid. mp: 74 °C; 1H-NMR (CDCl3, 400 MHz) δ 1.41–1.47 (m, 6H), 1.63 (quint, 2H, J = 6.12 Hz), 2.10 (t, 2H, J = 8.64 Hz), 2.37–2.43 (m, 8 H), 3.30 (q, J = 5.36 Hz), 3.93 (t, 1H, J = 7.92 Hz), 7.15–7.19 (m, 2H), 7.24–7.30 (m, 8H), 7.45 (brS, 1H); 13C-NMR (CDCl3, 400 MHz) δ 24.3, 24.7, 26.1, 31.4, 35.4, 40.0, 50.7, 54.5, 58.6, 126.3, 127.9, 128.5, 144.4, 172.4; HRMS [M-H]+calculated for C24H33N2O 365.2593, found 365.2585.

2.12.4. 4,4-Diphenylbutyl [3-(piperidin-1-yl)propyl]amine Hydrochloride (SV188)

To a solution of 4,4-diphenyl-N-[3-(piperidin-1-yl)propyl]butanamide, 6 (2.09 g, 5.73 mmol) in anhydrous THF (100 mL), LiAlH4 (0.87 g, 22.93 mmol) was added slowly under N2 atmosphere. The reaction mixture was refluxed for 2 h. TLC examination (10% MeOH in CHCl3) indicated the completion of the reaction. The reaction mixture was then carefully quenched by a very slow drop-wise addition of saturated Na2SO4 solution until the evolution of H2 ceased. The reaction mixture was then filtered over celite 545 and washed with EtOAc (100 mL). The combined filtrate was concentrated under vacuum, redissolved in EtOAc (100 mL), and dried over Na2SO4. The drying agent was filtered off, and the filtrate was concentrated under vacuum to obtain the amine product as a light-yellow oil. This product was dissolved in ether (10 mL) and treated with 2N. HCl (0.4 mL) to make the hydrochloride salt of 4,4-Diphenylbutyl [3-(piperidin-1-yl)propyl]amine hydrochloride, SV188 as a white solid (1.47 g, 61%). mp: 215 °C (decomposed); 1H-NMR (DMSO-d6, 400 MHz) δ 1.32–1.41 (m, 1H), 1.54 (quint, 2H, J = 6.96 Hz), 1.66–1.84 (m, 5H), 2.06–2.10 (m, 4H), 2.77–2.92 (m, 6H), 3.09 (quint, 2H, J = 5.16 Hz), 3.33–3.40 (m, 2H), 3.94 (t, 1H, J = 7.88 Hz), 7.16 (t, 2H, J = 7.08 Hz), 7.26–7.33(m, 8H), 9.13 (brS, 2H), 10.72 (brS, 1H); 13C-NMR (DMSO-d6, 400 MHz) δ 19.8, 21.2, 22.0, 24.2, 31.6, 43.9, 46.5, 50.0, 51.7, 52.6, 126.0, 127.5, 128.3, 144.6; HRMS [M + H]+ calculated for C24H35N2 351.2800, found 351.2792.

2.12.5. 4,4-Diphenyl-N-(3-phenylpropyl)butanamide (8)

To a solution of 3-phenylpropylamine, 7 (0.5 g, 3.70 mmol) in CH2Cl2 (120 mL) 4-(4-phenyl)butyric acid, 2, (0. 88 g, 3.70 mmol), EDC (0. 861 g, 5.55 mmol) and DMAP (0.045 g, 0.37 mmol) were added, and the reaction mixture was stirred at room temperature under N2 atmosphere overnight. The TLC examination (5% MeOH/in NH3-saturated CHCl3, Rf = 0.71) indicated the completion of the reaction. The reaction mixture was washed with saturated NaHCO3 (2 × 50 mL), water (2 × 50 mL), and brine (1 × 50 mL) and dried over Na2SO4. The drying agent was removed by filtration, and the filtrate was concentrated under vacuum to obtain the crude product, which was purified by column chromatography over Si gel using NH3-saturated CHCl3 as eluent to afford the pure 4,4-Diphenyl-N-(3-phenylpropyl)butanamide, 8 (0.967 g, 73%) as a yellow oil. 1H-NMR (CDCl3) δ 1.78 (quint, 2H, J = 7.32 Hz), 2.04 (t, 2H, J = 7.92 Hz), 2.33–2.38 (m, 2H), 2.61 (t, 2H, J = 7.76 Hz), 3.23 (q, 2H, J = 6.76 Hz), 3.89 (t, 1H, J = 7.96 Hz), 5.32 (brS, 1H), 7.16 (t, 5H, J = 7.40 Hz), 7.21–7.28 (m, 10H); 13C-NMR (CDCl3, 400 MHz) δ 31.1, 31.2, 33.3, 34.9, 39.1, 50.5, 126.0, 126.3, 127.8, 128. 3, 128.4, 128.5, 141.4, 144.2, 172.4; HRMS [M + H]+ calculated for C25H28NO 358.2171, found 358.2178.

2.12.6. 4,4-Diphenylbutyl(3-phenylpropyl)amine Hydrochloride (WJB-133)

To a solution of 4,4-Diphenyl-N-(3-phenylpropyl)butanamide, 8 (0.5 g, 1.40 mmol) in anhydrous THF (35 mL), LiAlH4 (0.159 g, 4.2 mmol) was added slowly under N2 atmosphere. The reaction mixture was refluxed for 2 h. TLC examination (2% MeOH in NH3-saturated CHCl3) indicated the completion of the reaction. The reaction mixture was then carefully quenched by a very slow drop-wise addition of saturated Na2SO4 until the evolution of H2 ceased. The reaction mixture was then filtered over celite 545, and the filtrate was washed with EtOAc (100 mL). The combined filtrate was concentrated under vacuum, redissolved in EtOAc (100 mL), and dried over Na2SO4. The drying agent was filtered off, and the filtrate was concentrated under vacuum to obtain the amine product as a light-yellow oil. This product was dissolved in ether (4 mL) and treated with 2N. HCl (0.2 mL) to make the hydrochloride salt of WJB-133 as a clear, gummy, sticky oil (0.248 g, 47%). 1H-NMR (CDCl3, 400 MHz) δ 1.65–1.80 (m, 2H), 2.03–2.09 (m, 4H), 2.56 (t, 2H, J = 6.60 Hz), 2.71–2.76 (m, 4H), 3.81 (t, 1H, J = 7.40 Hz), 7.10–7.19 (m, 10H), 7.21–7.26 (m, 5H), 9.47 (brS, 2H); 13C-NMR (CDCl3, 400 MHz) δ 24.0, 27.0, 32.5, 32.6, 46.4, 47.1, 50.7, 126.3, 126.4, 127.7, 128.3, 128.6 (2C), 139.7, 144.1; HRMS [M + H]+ calculated for C25H30N 344.2378, found 344.2380.

2.12.7. 4-(4-Fluorophenyl)butyl][3-(piperidin-1-yl)propyl Amine Hydrochloride (Compound 4)

4-(4-Fluorophenyl)butyl][3-(piperidin-1-yl)propyl]amine (compound 4) was prepared following our previously reported procedure [40]. Compound 4 (0.042 g, 0.143 mmol) was converted to hydrochloride salt by the treatment of its solution in ether (2 mL) with 2N. HCl (0.1 mL) to obtain the hydrochloride salt of compound 4 (0.034 g, 72.4%) yield as a white solid. mp: 197 °C (decomposed); 1H-NMR (DMSO-d6, 400 MHz) δ 1.36–1.39 (m, 1H), 1.61–1.66 (m, 5H), 1.74–1.85 (m, 4H), 2.13 (t, 2H, J = 7.1 Hz), 2.58 (t, 2H, J = 7.2 Hz), 2.80–2.87 (m, 4H), 2.96 (t, 2H, J = 5.5 Hz), 3.10–3.15 (m, 2H), 3.35–3.38 (m, 2H), 7.07–7.11 (m, 2H), 7.23–7.27 (m, 2H), 9.28 (brS, 2H), 10.74 (brS, 1H); 13C-NMR (DMSO-d6, 400 MHz) δ 19.9, 21.4, 22.1, 24.9, 28.0, 33.6, 44.0, 46.5, 51.9, 52.8, F-splitting 114.8, 115.0, F-splitting 130.0, 130.1, F-splitting 137.7, 137.8, F-splitting 159.4, 161.8; HRMS [M + H]+ calculated for C18H30N2F 293.2393, found 293.2386.

3. Results and Discussion

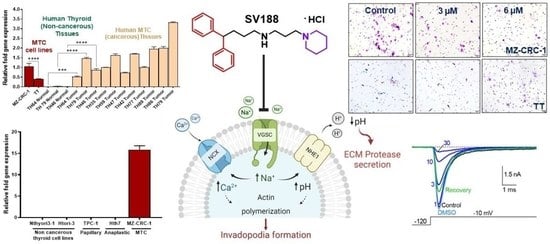
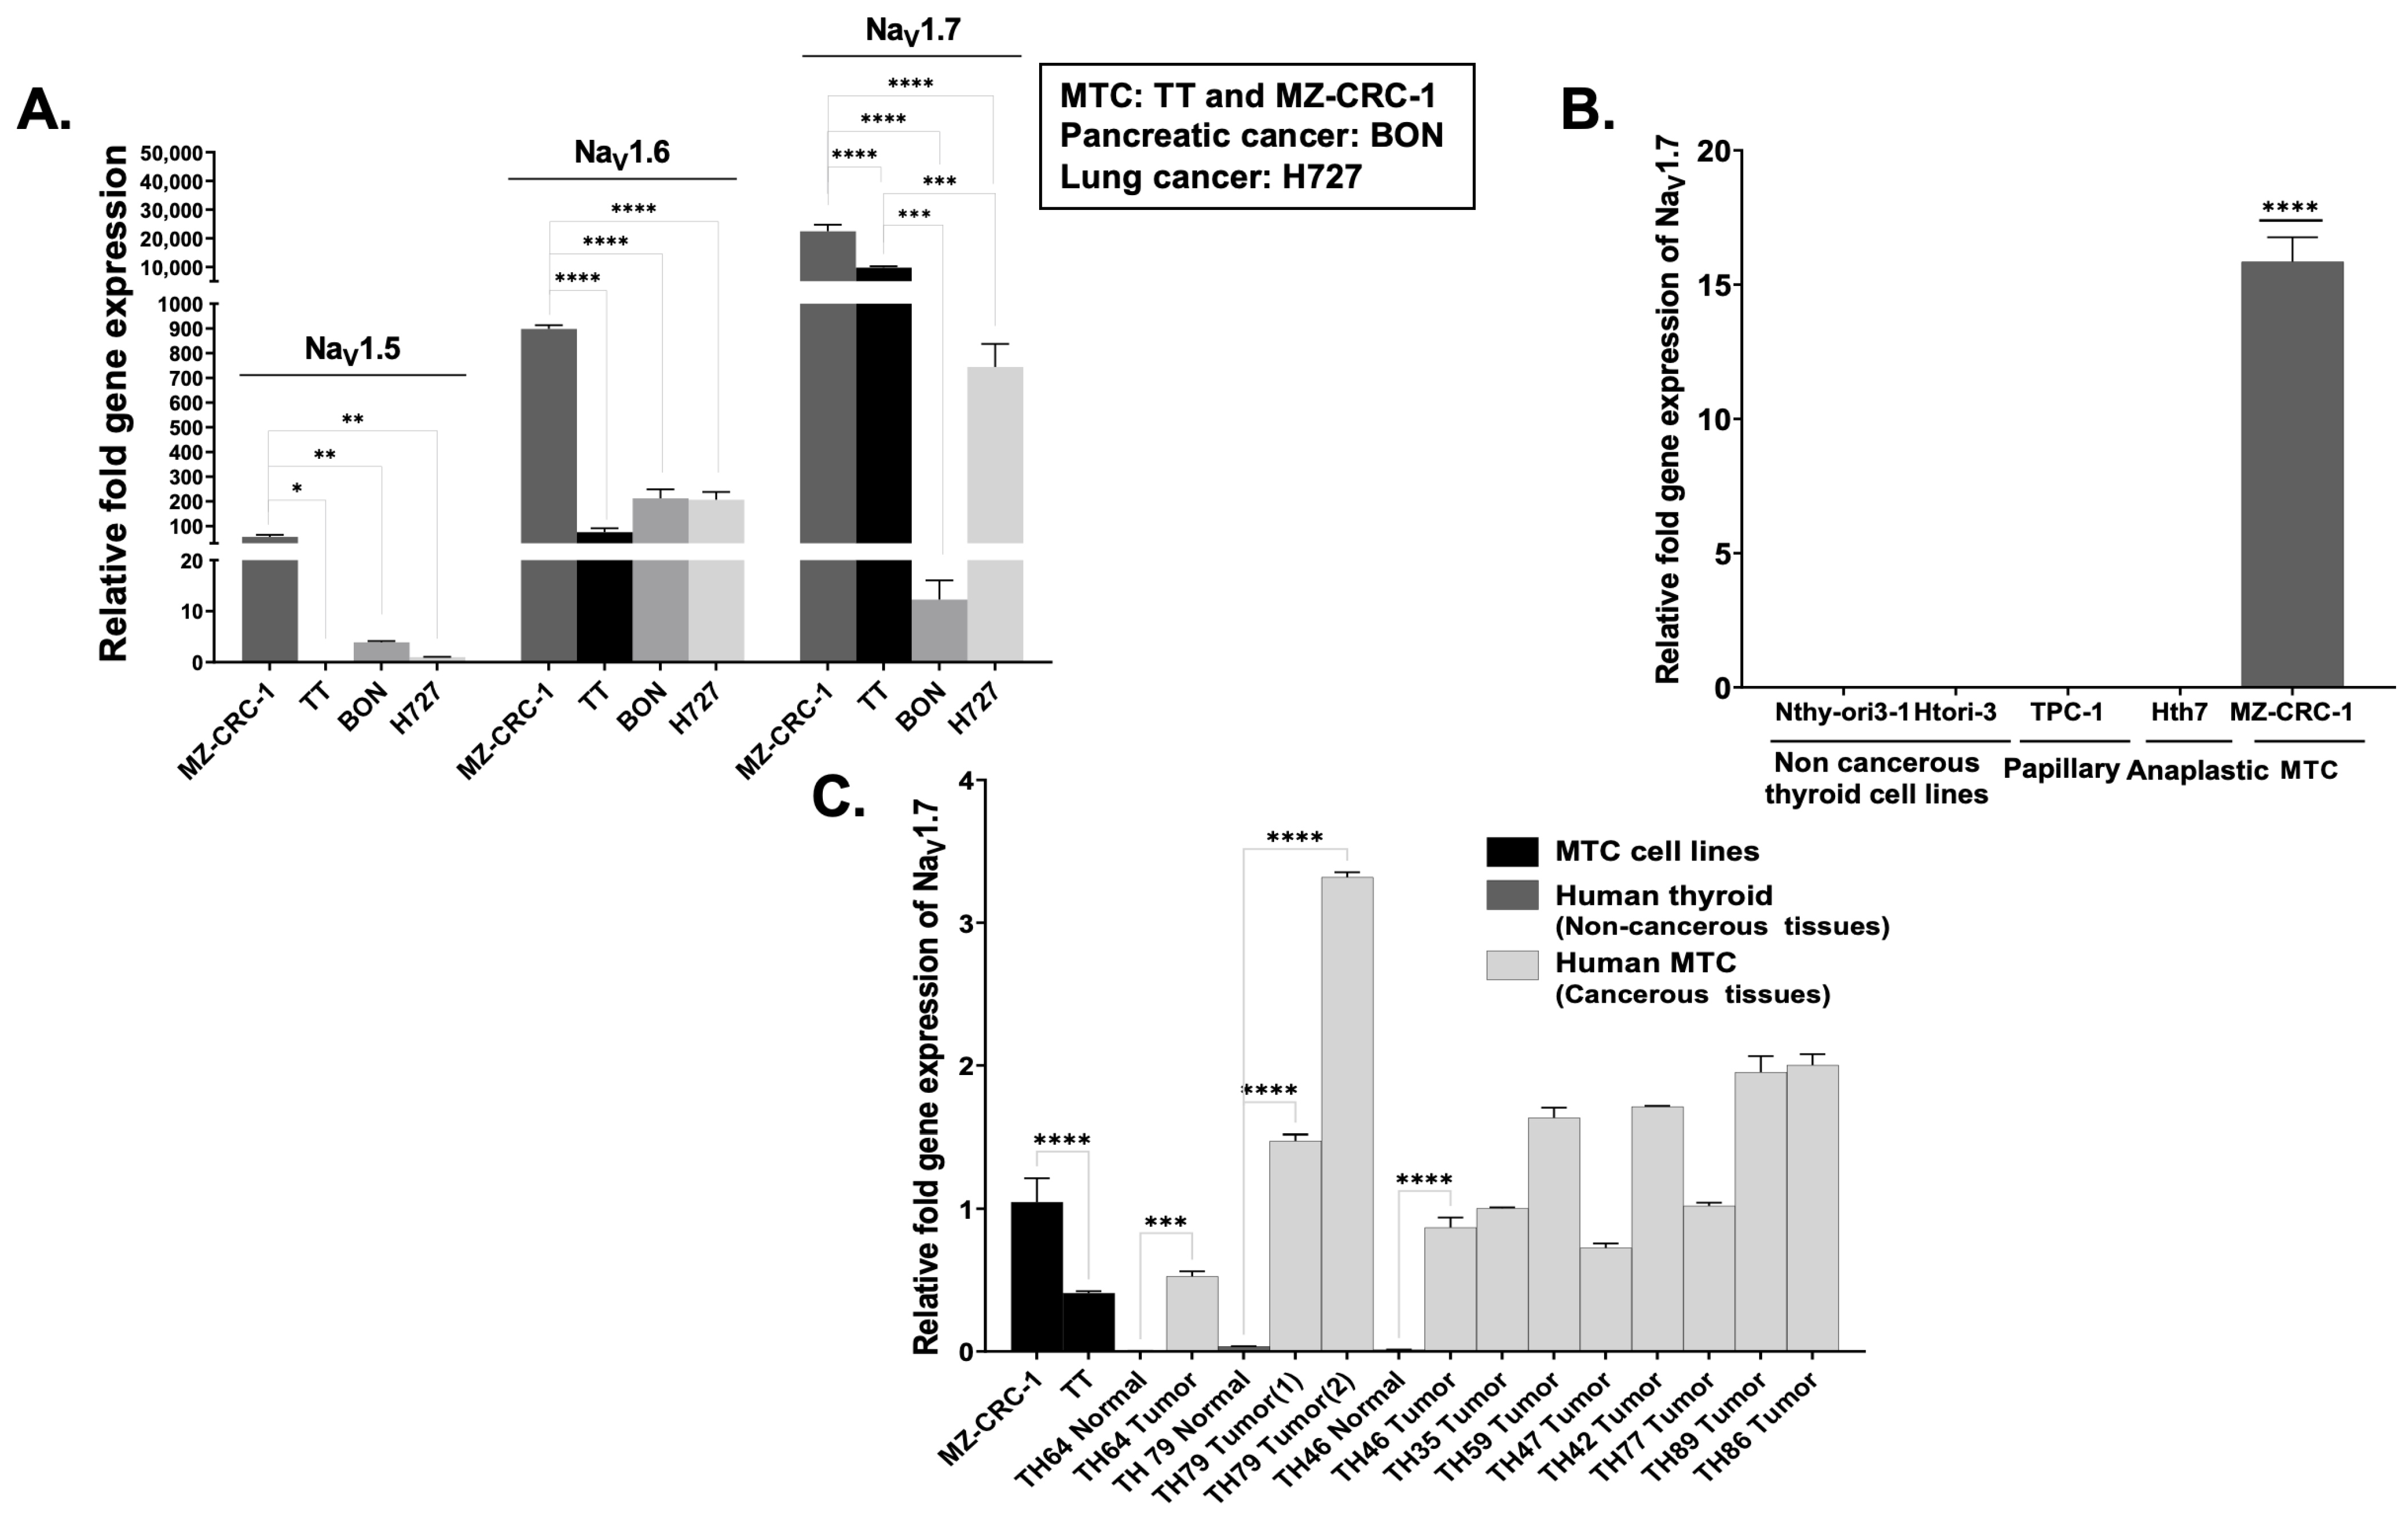
3.1. VGSC Expression in Neuroendocrine Tumors (NETs)

The expression of VGSCs is reported to be associated with invasion and metastatic behavior of various cancers. A few examples of such channels are NaV1.5 in breast [40,51,52], colon [49], and ovarian cancers [64]; NaV1.6 in cervical cancer [65]; and NaV1.7 in prostate [66,67], gastric [34], lung [68], and endometrial cancers [69]. Over the past decade, VGSCs subtypes NaV1.5, NaV1.6, and NaV1.7 have been the most-reported isoforms that are shown to influence migration and invasion [32,41,70]. We initially examined the mRNA expression levels of VGSCs isoforms NaV1.5, NaV1.6, and NaV1.7 in NETs using pancreatic (BON), lung (H727), and thyroid (MZ-CRC-1 and TT) cells and observed that the aggressive MTC cells originated from lymph node metastasis; MZ-CRC-1 showed strong expression of channels NaV1.5, NaV1.6, and NaV1.7. The highest expression was observed in NaV1.7, which was 400-fold higher than the lowest expression of NaV1.5. Moreover, NaV1.7 was uniquely overexpressed in MTC cells, MZ-CRC-1, and TT compared to other NET cell lines, where MZ-CRC-1 was 1800-fold higher than BON and 30-fold higher than H727; TT was 700-fold higher than BON and 13-fold higher than H727. The highly metastatic MZ-CRC-1 cells showed two-fold higher expression of NaV1.7 compared to the weakly metastatic TT cells (Figure 2A), suggesting that the expression level of NaV1.7 could be correlated to the metastatic and aggressive behavior of MTC cell lines. Further, there was detectable expression of NaV1.5 among the less-aggressive NETs: MTC (TT), pancreatic cancer (BON), and lung cancer (H727) cells (Figure 2A). To further confirm this observation, we examined the mRNA expression of NaV1.7 in non-neuroendocrine thyroid cancers cells, normal thyroid cells, and MTC patient samples. We found that the expression of NaV1.7 is conserved in MZ-CRC-1 cells and in MTC patient tissues when compared to normal thyroid cells (Nthy-ori3-1 and Htori-3), normal thyroid counterparts (TH64 normal, TH79 normal, and TH46 normal), and cells that represent both papillary and anaplastic thyroid carcinomas (Figure 2B,C).
The expression of NaV1.7 in MTC cells and patient samples was also confirmed by immunoblotting. To establish the basal expression of NaV1.7 in MTC, we used MZ-CRC-1 and TT human cells; p25OE MTC cells originating from transgenic mice; and MTC patient tissues, cancerous and adjacent non-cancerous thyroid tissues, for direct comparison. We determined that only the MTC specimens, human MTC cell lines, and mouse transgenic MTC cells were Nav1.7 positive, (Figure 3A). The highly metastatic MZ-CRC-1 cells showed higher expression of NaV1.7 compared to the weakly metastatic TT cells (Figure 3A). An additional MTC specimen analysis revealed that the expression of NaV1.7 was found in four of the six patient tissues that were examined, while it was not detected in the normal thyroid specimen (Figure 3B). We also detected the presence of somatostatin receptor, SSTR2, a known MTC biomarker, in four patient tumor tissues, of which three had the presence of NaV1.7 expression (Figure 3C) [71].
Overall, the results from quantitative PCR and immunoblotting showed that the expression of NaV1.7 was found in all MTC cells and in 66.7% (four out of six) of the patient tissues that were examined, while it was not detected in any normal thyroid specimens. The highly metastatic MZ-CRC-1 cells showed higher expression of NaV1.7 compared to the weakly metastatic TT cells. These results are consistent with recent reports of NaV1.7 mRNA expression in the prostate cancer cell lines in rat, MAT-LyLu and AT-2, and human, PC-3 and LNCaP. The cell lines with stronger metastatic potential (MAT-LyLu and PC-3) had 1000-fold higher NaV1.7 expression than the weakly metastatic cell lines (AT-2 and LNCaP) [66]. Moreover, the study of NaV1.7 expression in human prostate biopsies demonstrated that NaV1.7 expression was elevated in prostate cancer samples (~20 fold higher) compared to non-cancerous prostate samples [67]. Similarly, the expression of the neonatal splice variant of NaV1.5 (nNaV1.5) in breast cancer cells was reported to be lower in the weakly metastatic breast cancer cell line, MCF-7, and higher in the highly metastatic triple-negative breast cell line, MDA-MB-231 [16,72,73].

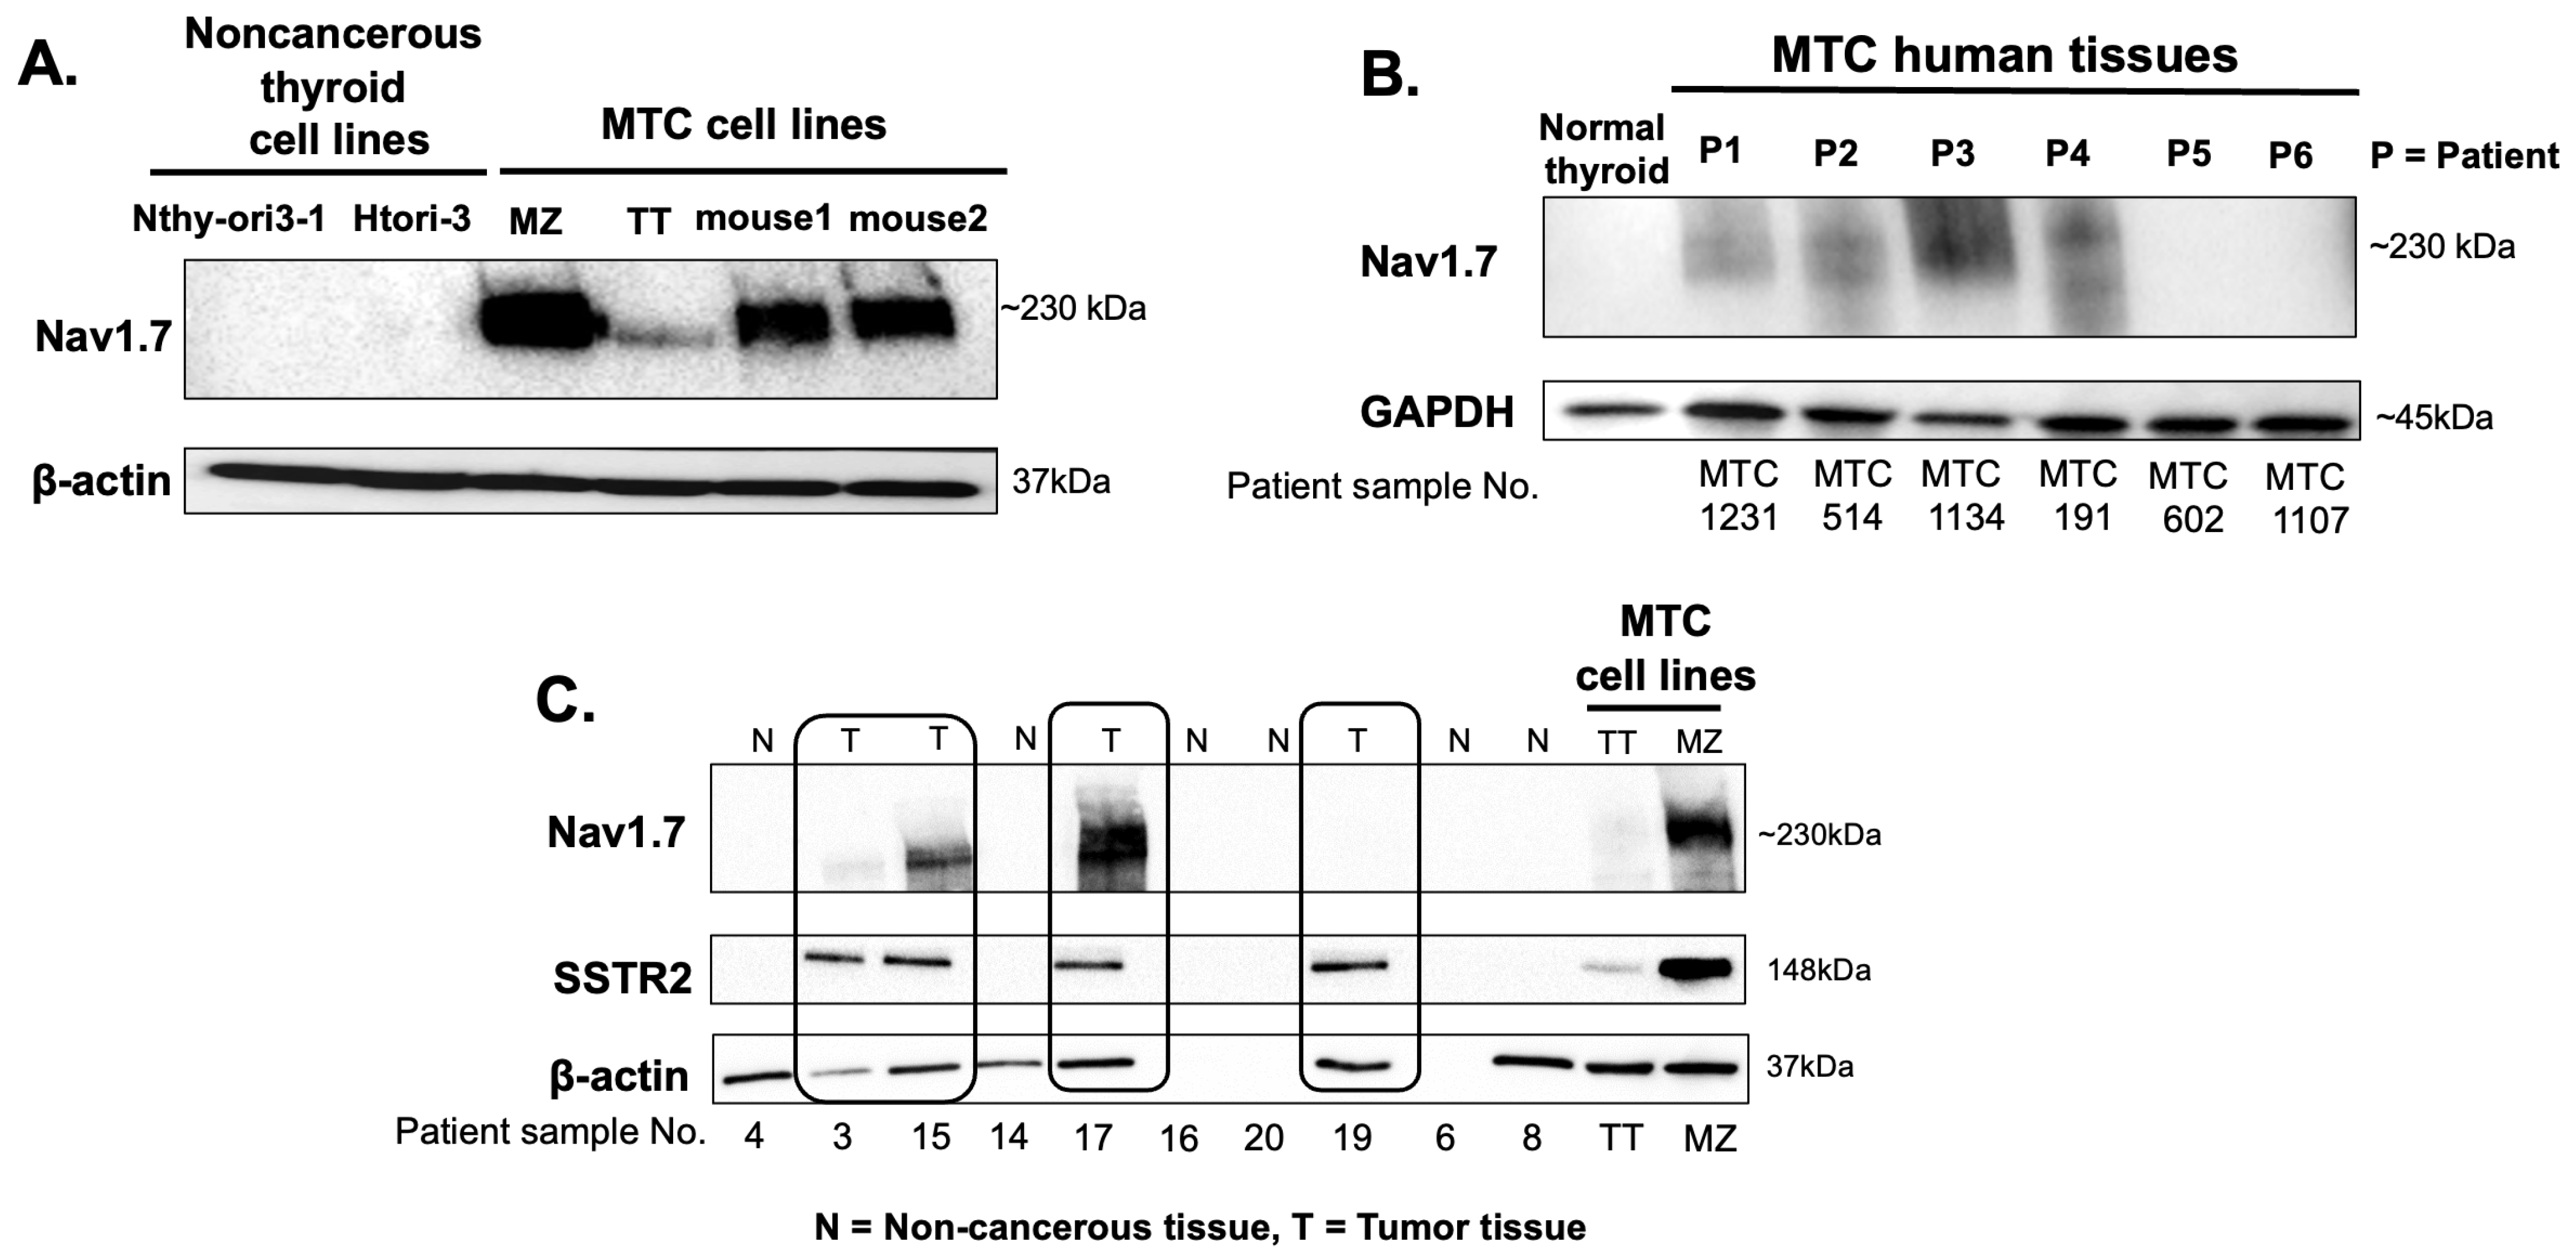
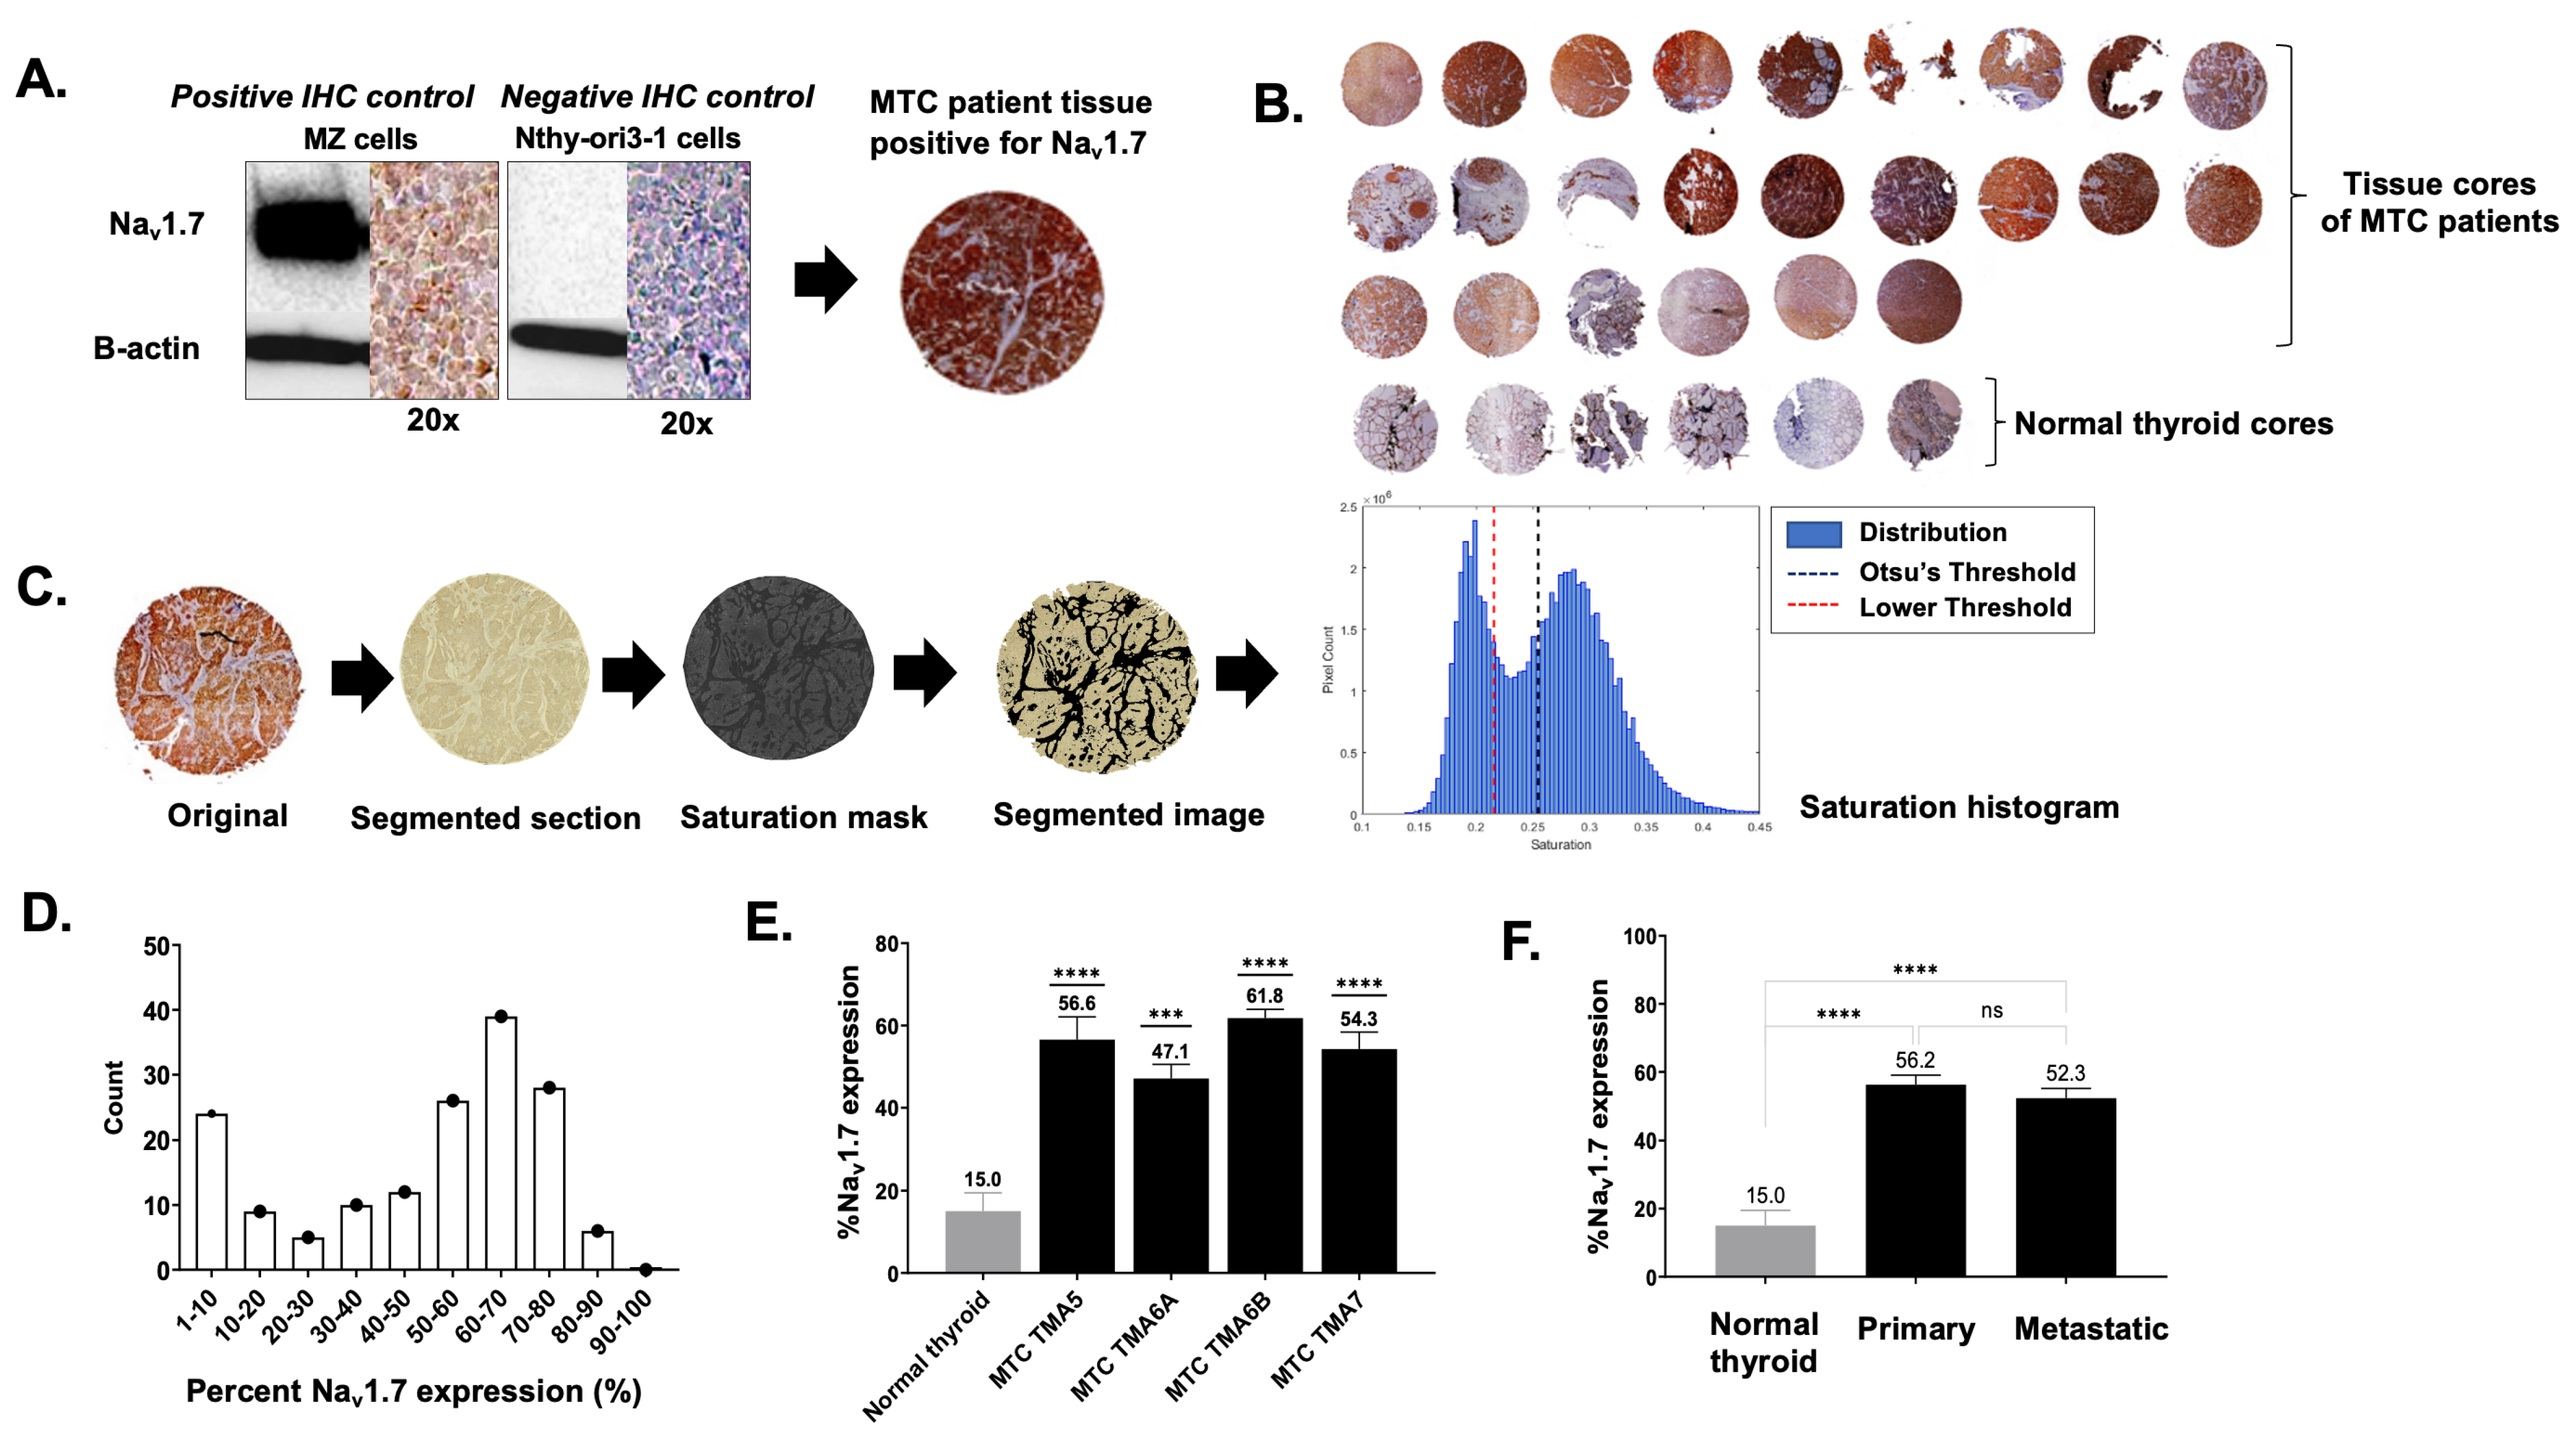
3.2. High-Throughput Analysis of NaV1.7 Expression in Human MTC

We further confirmed the overexpression of NaV1.7 in a larger set of MTC patients. We constructed tissue microarrays (TMAs) consisting of 45 human samples including normal thyroid and MTC tissues and performed an immunohistochemical (IHC) analysis [74]. The IHC results from the TMAs confirmed that NaV1.7 was significantly upregulated in MTC compared to normal thyroid tissue. This result is consistent with the results of our immunoblotting and RT-qPCR analysis. Positive and negative IHC controls were prepared by staining NaV1.7 antibody on a MZ-CRC-1 cell pellet (highly expressed NaV1.7) and the normal thyroid cell line, a Nthy-ori3-1 cell pellet (no detectable expression of NaV1.7) (Figure 4A). A total of 45 tissue samples including normal thyroid, MTC primary, and MTC metastases, distributed on four TMA slides, were prepared and stained with NaV1.7 antibody (Figure 4B). The positive and negative expression of NaV1.7 were verified with a patient’s metastatic status by pathologists at the UAB Department of Pathology. The quantification of TMAs was carried out through the automated processing of the MTC tissue cores with a custom MATLAB code, which enabled segmentation of the tissue and then histogram analysis with Otsu’s thresholding to separate positive versus negative staining (Figure 4C). Overall, 70.7% of MTC patients showed ≥50% NaV1.7 expression (29/41), with a median of 60.37% and a mean of 54.56 ± 1.93% (Figure 4D). There was a statistically significant difference in the percentage of NaV1.7 expression between the normal thyroid samples (non-cancerous) and the MTC patient samples (cancerous) (Figure 4E, Supplementary Figure S1).
The quantitative RT-PCR, immunoblotting, and TMA results suggested that the level of NaV1.7 expression in the MTC cell lines and patient tissues could be related to a patient’s metastatic status, and, therefore, we performed a point-biserial correlation on 133 human specimens from all TMAs to determine the relationship between the percentage of NaV1.7 expression vs. the disease status; using normal thyroid, primary MTC, and metastatic MTC tissues (Supplementary Figure S2 and Table S1). We found that there was a positive correlation between the percentage of NaV1.7 expression and the patient disease status from normal to metastases, which was statistically significant. However, once we investigated the expression level of NaV1.7 in the primary MTC and metastatic MTC samples, the results showed no significant difference between these groups (Figure 4F).
Overall, our results show that the expression of NaV1.7 is substantially higher in the MTC cells and MTC patient tissues compared to that of the normal thyroid cells and normal thyroid tissues. Therefore, NaV1.7 in MTC could be used as a therapeutic target for drug discovery and/or as a biomarker for diagnostic purposes.

3.3. Identification of NaV1.7 Inhibitors

Several compounds from our known NaV1.5 inhibitor library were used for the initial screening, aimed at identifying NaV1.7 inhibitors [40]. This screening resulted in the identification of three potential lead compounds, SV188, compound 4, and WJB-133 (Figure 5A), for NaV1.7 inhibition in MTC. This screening was carried out using the highly metastatic MTC cell line MZ-CRC-1, which has the highest basal expression of NaV1.7. The cytotoxicity of the three compounds against MZ-CRC-1 was determined first using an MTT assay. The results revealed that MZ-CRC-1 is more sensitive to SV188 and WJB-133 compared to compound 4. The IC50 of SV188 and WJB-133 is 9.00 ± 1.92 µM and 8.04 ± 0.47 µM, respectively, whereas compound 4′s IC50 was two-fold higher (Figure 5B). In recent reports, the inhibition of NaV1.7 in gastric cancer using TTX significantly reduced the expression of NHE1 at the mRNA and protein levels [34]. In addition, the inhibition of NaV1.6 and NaV1.7 in prostate cancer cells with small molecules, S0154 and S0161, promoted the degradation of NaV proteins in prostate cancer cells and downregulated both the NaV1.6 and NaV1.7 protein expression levels, with no significant effect on cell apoptosis at the same concentration [35]. To identify NaV1.7 inhibitors using a similar approach, we evaluated the three compounds at a 5 µM concentration after 24 h of treatment for their effects on NaV1.7 and related genes in the MZ-CRC-1 cell line. Based on a preliminary screening using RT-qPCR against two genes, SCN9A (NaV1.7) and SLC9A1 (NHE1), compound SV188 was selected for further evaluation, as it substantially lowered the expression of SLC9A1 (NHE1) and SCN9A (NaV1.7) compared to the corresponding controls (Figure 5C).
Next, we tested SV188 against the NaV1.5, NaV1.6, and NaV1.7 channels that have been reported to be involved in cancer cells’ migration and invasion [41,70]. The results showed that the treatment of SV188 at 5 µM for 48 h significantly decreased the mRNA expression of NaV1.7 and increased the mRNA expression of NaV1.5, with no significant effect on the mRNA expression of NaV1.6 (Figure 6). Although the treatment of SV188 affected NaV1.5 expression, when comparing the expression of all three channels, the expression of NaV1.7 was 400-fold higher than that of NaV1.5 and 25-fold higher than that of NaV1.6 (Figure 2A); the effect on NaV1.7 is more likely to outweigh the effect on NaV1.5.

3.4. Synthesis of Compound 4, SV188 and WJB-133

Compound 4 was synthesized using a previously reported procedure from our lab [40]. The synthesis of the compound SV188 was carried out in three steps starting from γ-phenyl-γ-butyrolactone (1), as outlined in Scheme 1. Lactone 1 was first converted to 4,4-diphenylbutyric acid (2) by treatment with AlCl3 in anhydrous benzene with a 94% yield. Carboxylic acid 2 was converted to amide 6 using the EDC-mediated amide coupling reaction with 3-piperidylpropanamine (5) with an 83% yield. The amine 5 used in the amide coupling reaction was obtained with an 89% yield by the reduction of 3-piperidylpropionitrile (3) using Raney Ni in MeOH. Reduction of amide 6 with LiAlH4 in THF, followed by the conversion of the product amine to its hydrochloride salt by treatment with HCl, afforded SV188 as a hydrochloride salt with a 61% yield in two steps.
Compound WJB-133 was synthesized in two steps, as shown in Scheme 2. Carboxylic acid 2 was converted to amide 8 using the EDC-mediated amide coupling reaction with 3-phenylpropanamine (7) with a 73% yield. Reduction of amide 8 with LiAlH4 in THF, followed by the conversion of the product amine to its hydrochloride salt by treatment with HCl, afforded WJB-133 as a hydrochloride salt with a 47% yield in two steps.

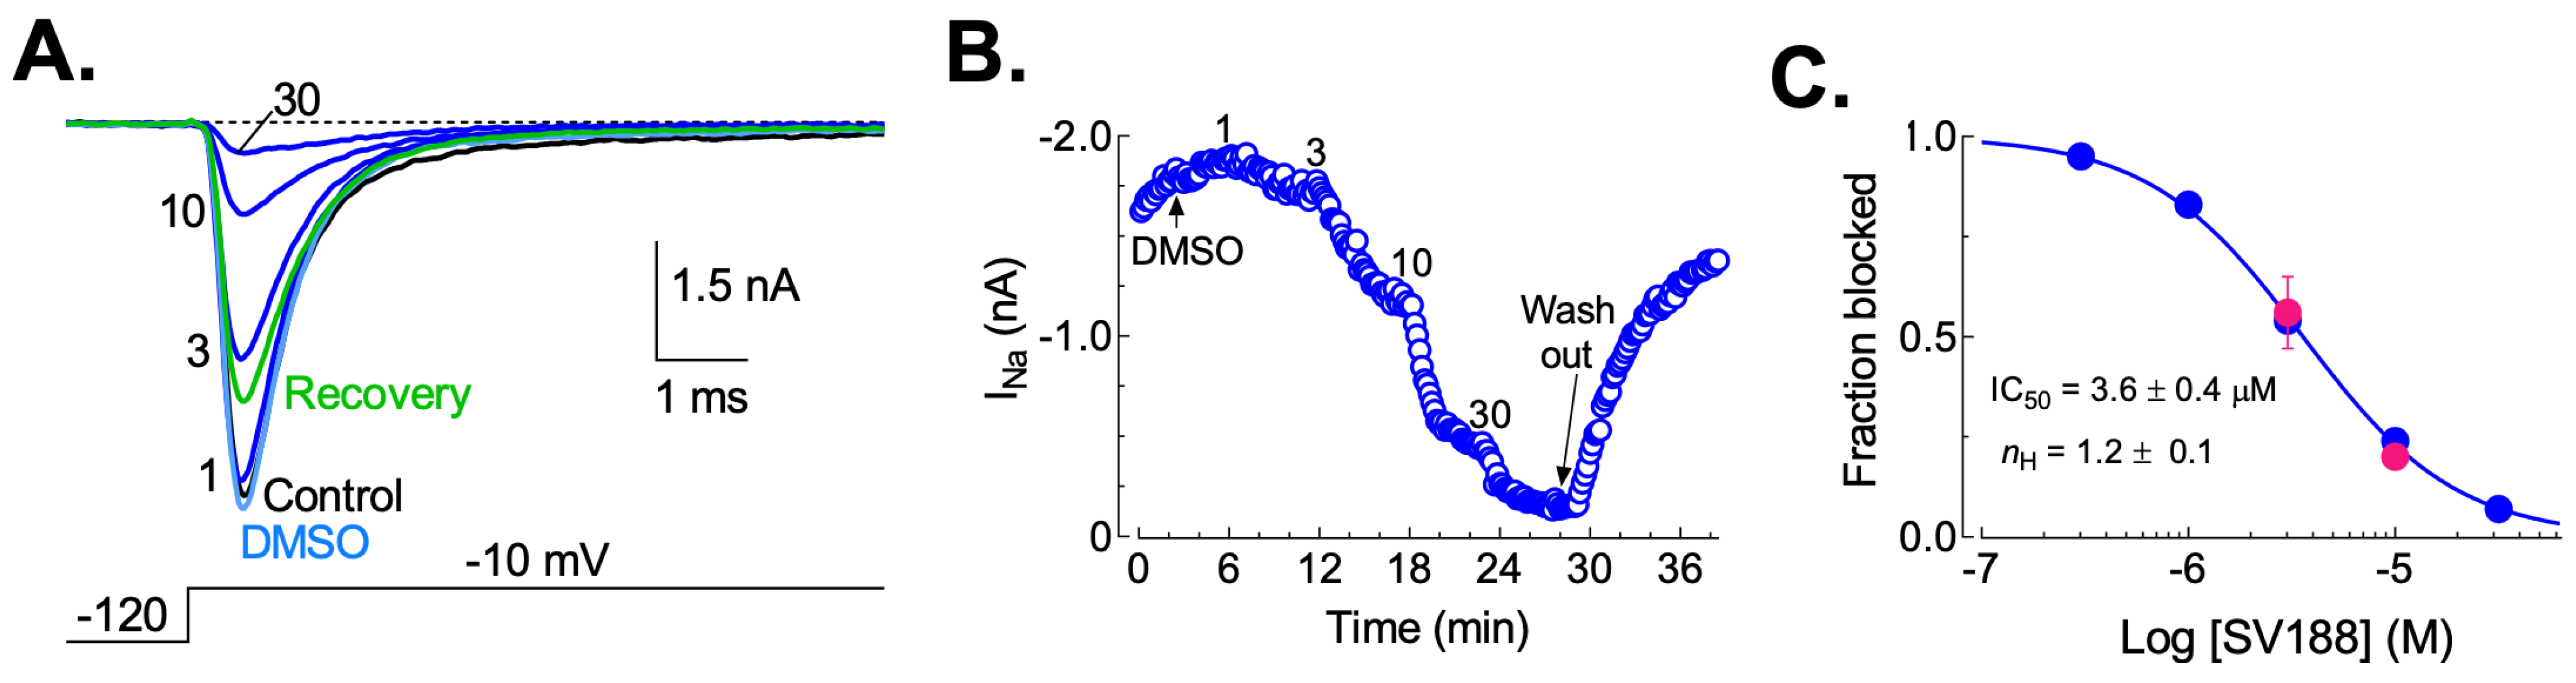
3.5. Dose-Dependent Inhibition of NaV1.7 Currents (INa) by SV188

To test the ability of SV188 to inhibit the sodium currents (INa) carried by the NaV1.7 channel, we performed whole-cell patch-clamp experiments using HEK-293 cells transiently expressing NaV1.7 and measured the dose-dependent inhibition of the INa peak evoked by depolarizations to −10 mV from a holding potential (HP) of −120 mV applied every 10 s. We first tested the effect of 0.06% DMSO alone on the INa amplitude in all the patch-clamped cells and found that DMSO diminished the current magnitude by 3% on average. Then, the cells were superfused with increasing concentrations of SV188, and the INa peak currents were measured (Figure 7A). A stationary blockade of INa was reached around 4–5 min after superfusing the cell with each concentration of the compound (Figure 7B). The inhibition of INa by SV188 was partially reversed (74%) after washing with control saline for a period of 10–15 min. The fraction of INa unblocked by SV188 in each cell was averaged and plotted as a function of the compound concentration, and the data were fitted with the Hill equation (Figure 7C). To determine whether the SV188 blockade of INa was more effective at more depolarized holding potentials, we investigated the effect of SV188 at 3 µM and 10 µM on the partially inactivated channels by using an HP of −80 mV. The fraction of the sodium current that was blocked at −10 mV under these experimental conditions was practically the same as with an HP of −120 mV (solid pink circles in Figure 7C), and both data points overlap with the fit of the data obtained with an HP of −120 mV. These results suggest that SV188 inhibits the INa with the same potency in the closed state (HP of −120 mV) and the inactivation state (HP of −80 mV) of the NaV1.7 channels [75,76].

3.6. Effects of SV188 on NaV1.7 Channels Gating

The current–voltage relationships (IV curves) for NaV1.7 channels were measured using 16-ms step depolarizations to varying potentials from an HP of −60 to +100 mV in 10 mV steps. The representative families of the INa recordings obtained from an HEK-293 cell expressing NaV1.7 channels in the absence of, during, and after exposure to 5 µM of SV188 are shown in Figure 8A. The average I–V curves are shown in Figure 8B. The maximum peak current was observed at −10 mV under control recording conditions, and the blockade by SV188 shifted this value to −20 mV. This effect was also observed in the recordings shown in Figure 8A. To further analyze the effect of SV188 on the voltage-dependent activation of the NaV1.7 channels, we calculated the channel conductance with the equation G(V) = I/(VVrev), where I, V, and Vrev represent the sodium current elicited (as shown in Figure 8A), test potential, and reversal potential, respectively. The conductance values were normalized and plotted as a function of the test potential for the NaV1.7 channels in the absence and presence of 5 µM of SV188, and each data set was fitted to a Boltzmann function (Figure 8C, smooth lines). The obtained parameters indicate that SV188 shifted the voltage-dependence of the NaV1.7 channels’ activation to more negative potentials by 8.5 mV. In addition, although SV188 effectively blocked INa over a wide range of testing potentials, it was clearly more potent at more positive voltages, being more evident for the Vm values beyond the Vrev (Figsure 8A,B). For example, at −10 mV, 5 µM SV188 inhibited INa by an average of 56%. By comparison, at +80 mV, INa was inhibited by 92% (Supplementary Figure S3). These results suggest that the inhibition of the NaV1.7 sodium current by SV188 is voltage-dependent, with a stronger block at membrane potentials where the INa should be outward.
We next sought to determine whether SV188 alters the voltage-dependence of the NaV1.7 channels’ inactivation. For this purpose, we used a classical two-pulse voltage clamp protocol. The first step was a 200 milliseconds prepulse to voltages between −120 and −50 mV, intended to promote channels into an inactivated state. The second voltage step was a brief test pulse to −10 mV, in which the relative amplitude is proportional to the fraction of NaV channels that were not inactivated by the prepulse. The representative INa obtained from the NaV1.7 channel recorded in the absence and presence of 5 µM SV188 is illustrated in Figure 8D. It is shown that in the absence and presence of SV188, the current amplitude at −10 mV after a prepulse to −90 mV is roughly the same, i.e., around 63% of the maximal current in each condition. This observation was further analyzed with the inactivation curves shown in Figure 8E. The normalized data of the INa recorded during the test pulses to −10 mV was plotted as a function of the prepulse potential. The data points were well-fitted by single Boltzmann functions, assuming that the channels fully inactivated at depolarized voltages. In this case, the interaction of SV188 with the NaV1.7 channels led to a non-significant shift of 7 mV in the voltage dependence of inactivation toward more negative potentials, suggesting that the inactivated state of the channel is not affected by SV188 binding, and vice versa. This result is also consistent with the observation that the percentage of INa that was blocked is not different when using an HP of −120 or −80 mV (Figure 7C). Interestingly, in a previous work by our group, several secondary amine compounds that have a similar chemical structure to SV188 induced a significant state-dependent effect on the NaV1.5 sodium currents of the MDA-MB-231 breast cancer cell line [40]; however, the potential use-dependence effect was not explored for such compounds. It is likely that the lack of a state-dependent effect of the SV188 in the NaV1.7 channels could be due to a discrete difference in the sequence/structure when compared with the NaV1.5 channels.

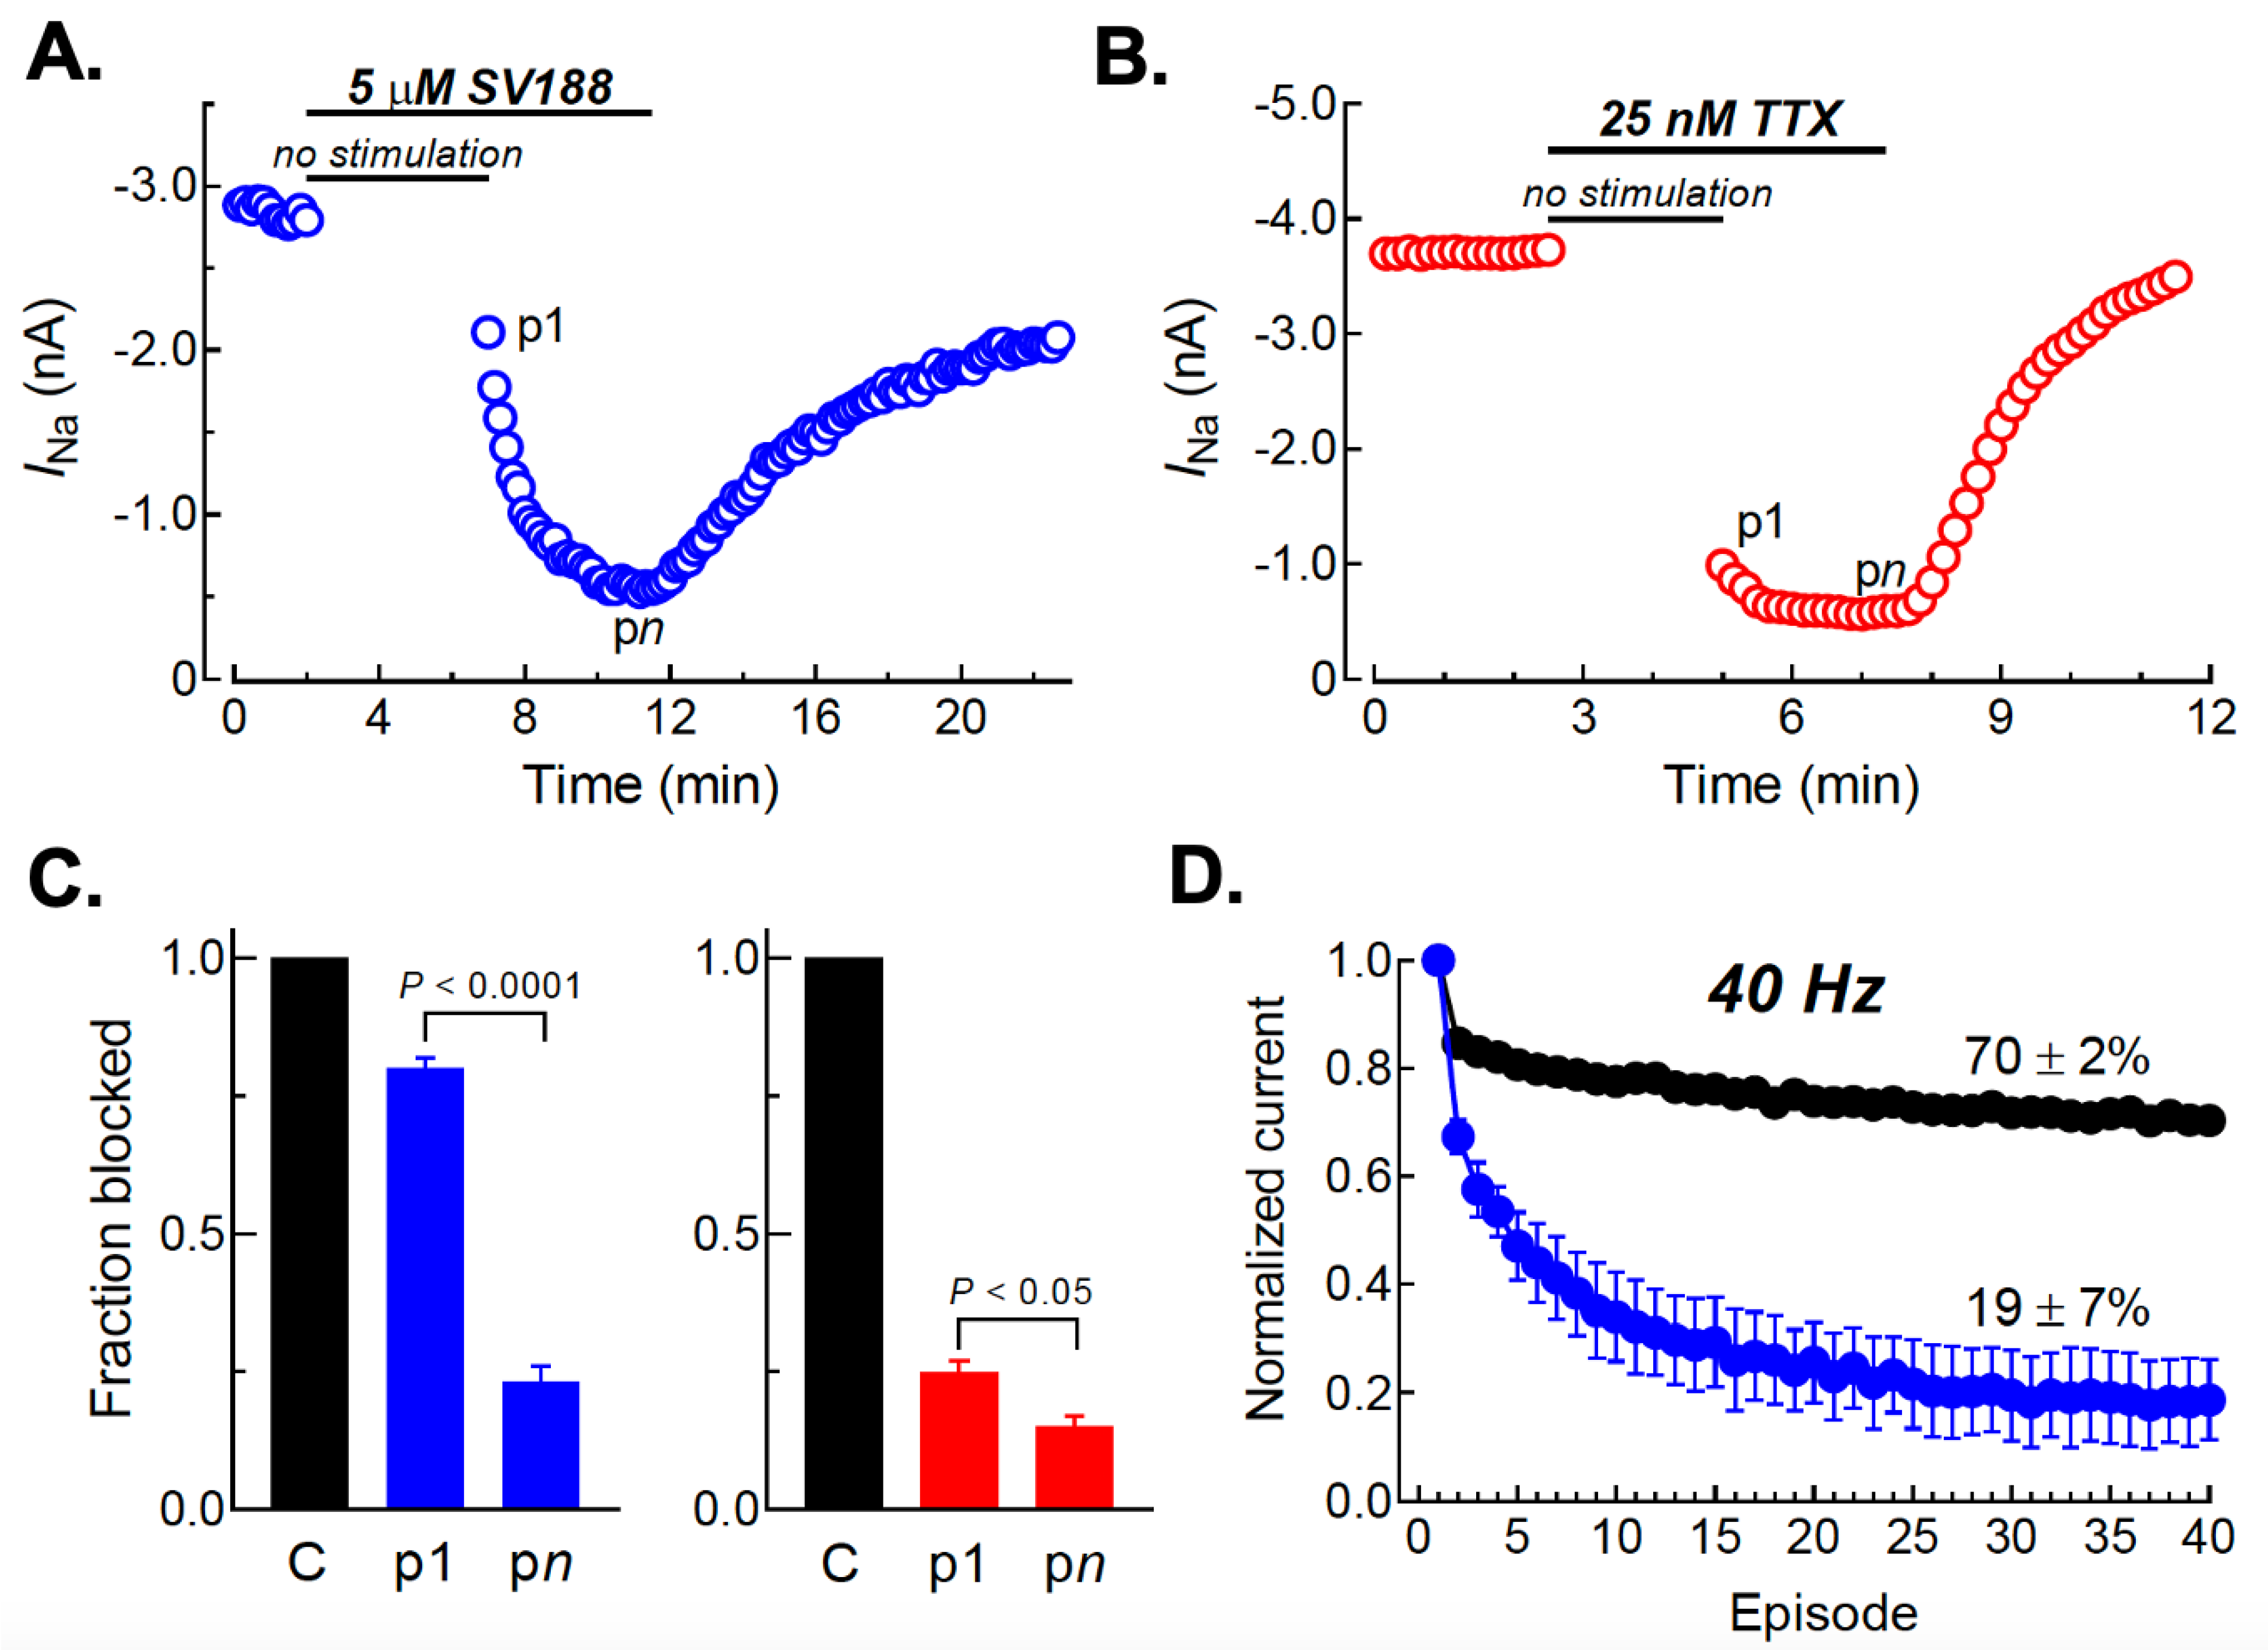
3.7. Use-Dependent Blockade of NaV1.7 Channels by SV188

VGSC inhibitors such as local anesthetics, antiarrhythmics, and opiate antihyperalgesics are known to display state-dependent and use-dependent channel blockades [47,75,77,78,79]. This characteristic constitutes a functional selectivity for inhibitors to preferentially bind to channels that are activated frequently, thus attracting additional molecules to bind to such states. To further investigate the inhibition of the resting state of NaV1.7 channels by SV188, the currents were first recorded at 10-s intervals in a control solution before superfusing the cell with 5 µM of SV188 for 5 min without applying any depolarizing steps (Figure 9A). When the voltage steps were resumed, the INa was initially inhibited by 20% (Figure 9A–C, p1). However, the proportion of inhibition increased with subsequent test pulses, reaching a maximum of 77% at 4.5 min (Figure 9A–C, pn). Thus, the inhibition of NaV1.7 channel currents by SV188 requires the opening of the channel for the binding of the compound to its site of action. Although it was shown that fenestrations of VGSCs could be an alternative gateway to the central cavity of some resting-state blockers [80], this could not be the preferred shortcut for SV188 on the NaV1.7 channel, as only a very small fraction of channels were blocked at −120 mV, suggesting that the main access route for SV188 to its binding site should be the intracellular gate of the NaV1.7 channel [81]. On the contrary, tetrodotoxin (TTX), a well-known open channel blocker of VGSCs [42,82,83], did not need the channel to be opened to induce the maximum blockade of the INa, as the first depolarizing pulse after resuming the voltage steps practically showed the same blocked fraction of the INa as that reached at the stationary blockade (Figure 9B,C, p1, pn). The observation that the compound needed periodic depolarization to block the INa suggests that the channels’ states visited during the depolarizations unmasks higher affinity conformations compared with the closed state.
To further test the use of the dependence effect of SV188 on NaV1.7 channels, cells were held at −120 mV, and sodium currents were elicited by a train of 40 16-ms pulses to −10 mV at 40 Hz. The peak current amplitude at each pulse was normalized to that of the first pulse. As shown in Figure 9D, SV188 displayed preferential inhibition on test pulse 40 compared to pulse 1, showing an 81% current decrease (blue points); whereas, in the absence of the blocker, the level of the current decrease is only 30% from pulse 1 to pulse 40 (black points), which implies that the blockade of NaV1.7 channels by SV188 is increased by around 50% when the channel is activated at 40 Hz, in comparison to when the channels are activated every 10 s (0.1 Hz; Episode 1, blue points, Figure 9D).
The results of the electrophysiological studies presented here suggest that SV188 is a dose-dependent and voltage-dependent inhibitor. The INa blockage was greater at higher concentrations of SV188, and the inhibition of the NaV1.7 channel is stronger at more depolarized membrane potentials. These studies also suggest that SV188 functions as a use-dependent inhibitor of NaV1.7 because the highest percentage of inhibition of INa by SV188 was observed when the channels were activated at higher frequencies (Figure 9D).

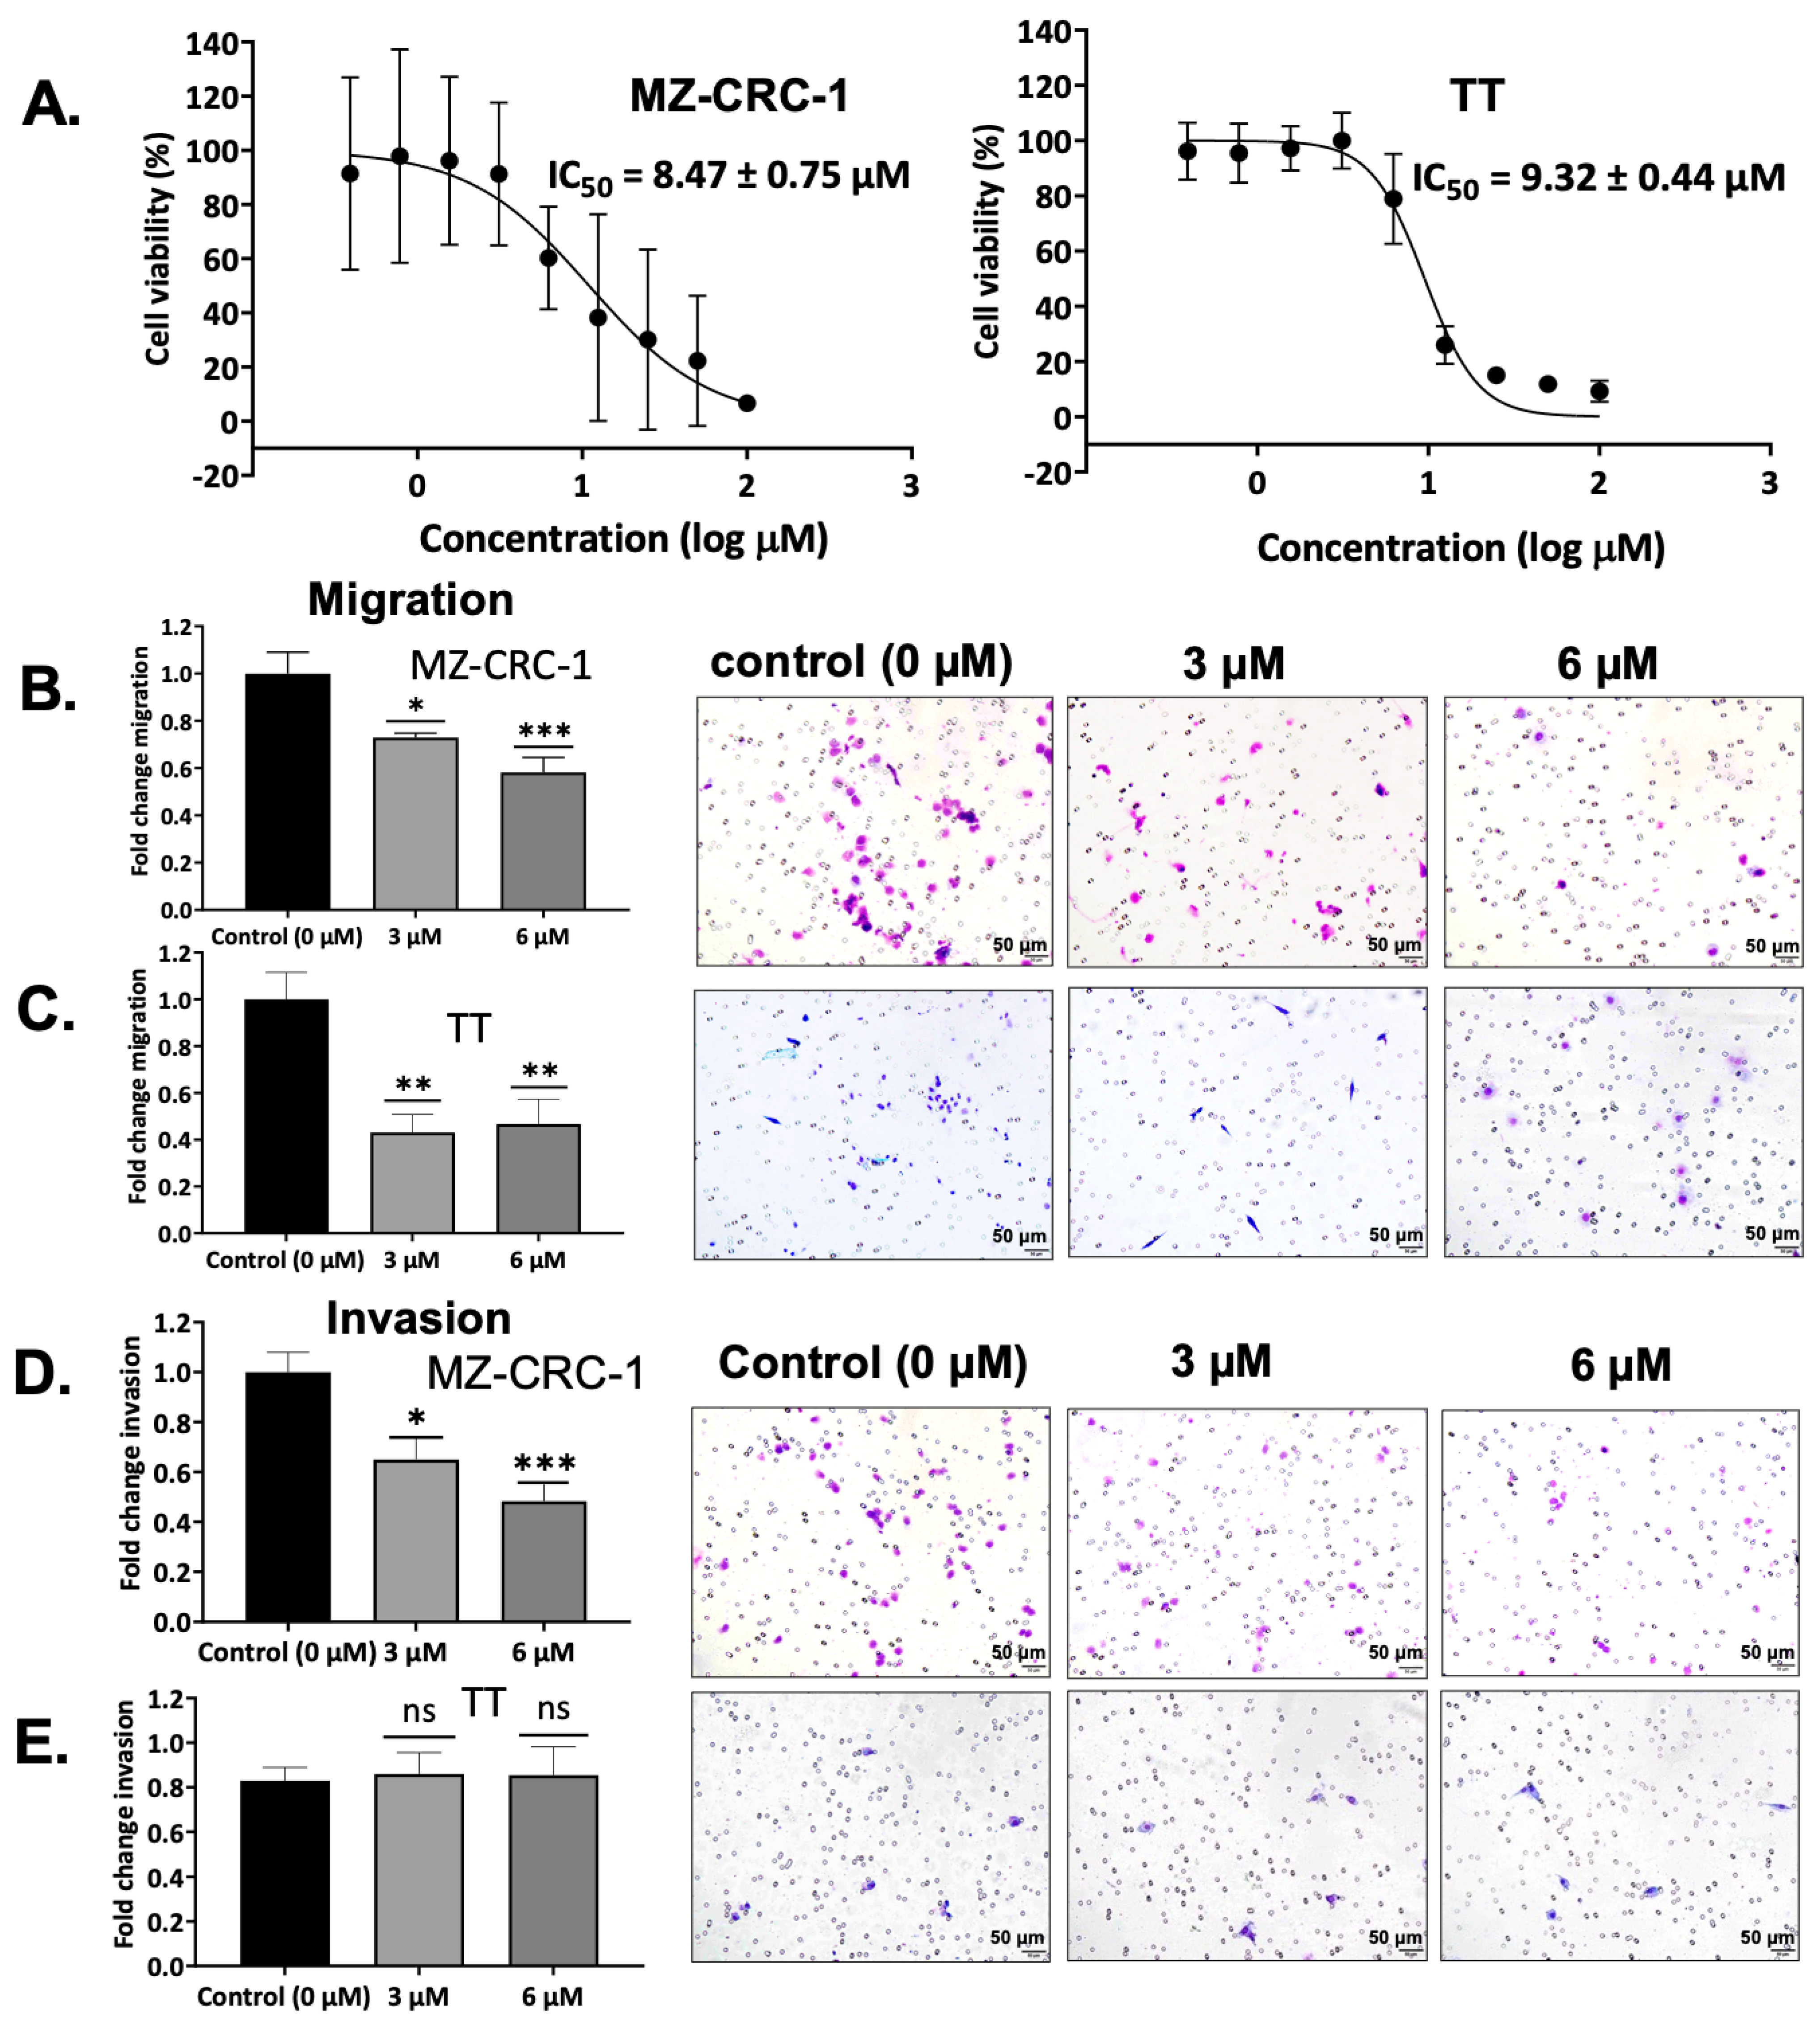
3.8. Effect on MTC Cell Viability by SV188

The results of the electrophysiological study suggested that SV188 is a use-dependent blocker of NaV1.7 at low micromolar concentrations and that the observed effects are reversible, highlighting the potential for SV188 to inhibit the migration and invasion activities of MTC cells. A highly aggressive MTC cell line originated from lymph node metastasis, MZ-CRC-1, and a less-aggressive MTC cell line, TT, derived from the primary tumor, were used for the cell migration and invasion inhibition studies. These two cell lines are the only available human MTC-derived cells. These studies needed to be conducted at lower doses than the cytotoxic concentrations of SV188 to ensure that the observed effects on cell migration and invasion were independent of the effects on the cell viability. Therefore, the inhibitory effects of SV188 on the MTC cell lines (IC50 values), MZ-CRC-1 and TT, were determined using the reported MTT assay [84]. The MTC cells were treated in quadruplicate for each concentration in each individual experiment. The results from each experiment were plotted as a normalized curve fit vs. a dose response (variable slope) to obtain the IC50 value. The experiments were repeated three times, and the average IC50 value was calculated as mean ± SEM. SV188 inhibited the cell viability of the MZ-CRC-1 cells, with an IC50 value of 8.47 μM, and the TT cells, with an IC50 value of 9.32 μM (Figure 10A).

3.9. Effect on Cell Migration by SV188

The migration- and invasion-inhibitory activities of SV188 were evaluated using MZ-CRC-1 and TT cells in a reported Boyden Chamber assay [85] at two doses (3 µM and 6 µM) lower than its cell viability IC50 value. In the Boyden Chamber assay, the ability of cancer cells to invade is measured based on the number of cells that can invade the matrigel and migrate through the pores across the membrane. The MZ-CRC-1 and TT cells were treated with 3 μM and 6 μM of SV188 and compared to control 0.06% DMSO for 48 h, and the number of invade cells was counted manually. Our results revealed that at 3 μM of SV188, the dose significantly reduced the MTC cells’ migration by 27% and 57% for MZ-CRC-1 and TT cells, respectively. The percentage of inhibition on the cell migration in MZ-CRC-1 increased to 42% when treated with 6 μM of SV188. However, the degree of migration inhibition of TT at 6 μM was relatively similar as that at 3 μM: 53% vs. 57%, respectively (Figure 10B,C).

3.10. Effect on Cell Invasion by SV188

SV188 significantly inhibited MZ-CRC-1 cell invasion by 35% and 52% after treatment with 3 μM and 6 μM, respectively. In contrast, SV188 showed no effect on the invasion of TT cells with lower basal expression of NaV1.7 when derived from the primary tumor (Figure 10D,E). The lack of invasion inhibition by SV188 in TT cells may result from the weakly metastatic potential and low expression of NaV1.7. Similar results were found in a previous report of the comparison invasion inhibition of the weakly metastatic breast cancer cell line MCF-7 and the highly metastatic breast cancer cell line MDA-MB-231, where the MCF-7 cell line showed no response to Nav1.5 inhibitor (phenytoin) treatment in contrast to MDA-MB-231, where treatment substantially reduced cancer cell invasion [73]. MZ-CRC-1 cells, which have significantly higher basal expression of both NaV1.5 and NaV1.7 and originated from a lymph node metastasis, showed a reduction in both migration and invasion. In contrast, SV188 treatment of TT cells, which were derived from the primary tumor and expressed lower basal levels of NaV1.5 and NaV1.7, only inhibited migration. Our results suggest that the MTC cell invasion inhibition by SV188 is directly correlated with the expression level of the sodium channels in these cells.

3.11. Cell Cycle Analysis in Response to SV188 Treatment

We performed a flow cytometry analysis to investigate the effects of SV188 on the MZ-CRC-1 cell cycle. This study revealed that SV188 induced cell cycle arrest at the G0/G1 phase and decreased the cell population at the S and G2 phases (Figure 11). Voltage-gated ion channels (VGICs) play an important role in cell cycle progression through the differentiation of the membrane potential (Vm). Cells in the resting state have more negative Vm compared to cells during proliferation. Additionally, Vm becomes less negative or depolarized due to the transition from the G0/G1 phase to the S phase, and VGSCs and/or Ca2+ channels are opened, resulting in a positive (+) ions influx inside the cells. Then, VGSCs and/or Ca2+ channels are close during the S-phase, causing Vm repolarization leading back to an initial phase of the cell cycle, G0/G1 [86,87,88,89]. Therefore, the inhibition of VGSCs could potentially affect cell cycle arrest and inhibit cell proliferation. There are a few studies that explored the effect of VGSC inhibitors on the cell cycle, such as a report from Li et al. in 2018 indicating that three out of six VGSC drugs, levobupivacaine (25 µM), ropivacaine (35 µM), and chloroprocaine (150 µM), inhibited cell migration in a wound healing assay after 24 h in human breast cancer MDA-MB-231 cells that expressed NaV1.5 [90]. From this cell cycle analysis, levobupivacaine and chloroprocaine slightly activated cell cycle arrest at the S phase, while ropivacaine remarkably induced cell cycle arrest at the G2/M phase [90]. Interestingly, lidocaine, a VGSC inhibitor that was reported to decrease cell proliferation and reduce cancer cells’ migration and invasion [64,91,92], showed a mild effect on cell cycle arrest at the S phase, with no significant influence on the migration of MDA-MB-231 cells at its antiarrhythmic plasma concentration (10 µM) after 24 h of treatment [90]. Additionally, the treatment of lidocaine at 100 µM was reported to inhibit cell growth at 72 h and increase apoptosis at 48 h; however, it did not show a significant effect on cell cycle arrest in hepatocellular carcinoma HuH7 and HepaRG cells (both cell lines had no report of VGSCs’ expression) [93]. A recent study on the treatment of lidocaine in cervical cancer HeLa cells that expressed NaV1.6 [65] found that this drug significantly inhibited the cell growth at 0.3 mM by reducing a proliferating protein, Ki-67 (MKI67), and a cell cycle analysis indicated that lidocaine significantly induced arrest at the G0/G1 phase and decreased cells’ population at the G/M and S phases in a dose-dependent manner [91]. In addition, the knockdown of NaV1.5 in oral squamous cell carcinoma (OSCC) HSC-3 cells caused cell cycle arrest at the G1 phase and a drastic reduction in cell migration and invasion [94]. The cell progression in knockdown NaV1.5 HSC-3 was reported to be regulated by the Wnt/β-catenin signaling pathway, which also had an influence on cancer cell migration and invasiveness [95,96,97].
In this current study, we saw the effect of SV188 on cell cycle arrest at the G0/G1 phase, which could lead to the inhibition of cell proliferation by inducing cell apoptosis, as observed in previous reports on the induction of apoptosis associated with Nav1.5 and Nav1.6 expression with siRNAs in astrocytoma [98], the expression of neonatal Nav1.5 in human brain astrocytoma, and its effect on the proliferation, invasion, and apoptosis of astrocytoma cells [99] and follicular thyroid carcinoma cells [53]. We also noticed a significant decrease in the mRNA expression of NaV1.7 and NHE-1 and a reduction in cell migration and invasion after treatments with SV188. The mechanism of how inhibition of sodium channels inhibits cancer metastases have not been fully elucidated. However, a plausible mechanism pathway for this effect could involve VGSCs’ colocalized proteins such as NCX and NHE-1, as shown in the schematic in Figure 1C [33,36,70]. One of the important factors contributing to the metastasis is the ability of highly aggressive cancer cells to cause proteolytic degradation of the extracellular matrix (ECM), break away from the tumor site, enter the bloodstream, and travel to distant sites to initiate metastasis. Recent literature showed that nNav1.5 activity in MDA-MB-231 cells enhances ECM degradation [100] by activating cysteine cathepsins B and S through the acidification of the pericellular microenvironment [38,101]. The Na+/H+ exchanger (NHE1) is the central regulator of intracellular and perimembrane pH, which is also overexpressed and overactivated in cancer cells [102,103]. This acidity activates cathepsins and proteolytic degradation of the ECM [104]. Thus, the persistent activity of nNav1.5 at the membrane potential of breast cancer cells (about −36 mV) is responsible for increased ECM proteolysis and cancer cell invasion [38,105]. Moreover, the changes in sodium level across the cell membrane produced by Nav1.7 inhibition may activate the function of NCX and NHE-1 proteins. Several studies disclosed that the reduction in cell migration and invasion was caused by the decrease in calcium-dependent proteins that are essential for epithelial–mesenchymal transition (EMT) and the reduction of H+ efflux through NHE-1 [55,106,107,108]. Therefore, in addition to the downstream effect on NHE-1, in future studies it would also be interesting to investigate the changes in calcium-dependent proteins (N-cadherin, vimentin, and snai1) and the changes in cysteine cathepsins’ activity between SV188-treated and -untreated MTC cells.

4. Conclusions

In conclusion, we reported, for the first time, the overexpression of NaV1.7 (SCN9A gene) in aggressive and metastatic MTC as a potential target for drug discovery. Our results from quantitative RT-PCR, Western blotting, and the TMA immunostaining of 45 patient specimens, including both normal thyroid and MTC samples, confirmed that the VGSC subtype NaV1.7 was specifically overexpressed in MTC, while it was not expressed in normal thyroid cells and tissues. A highly metastatic cell line, MZ-CRC-1, originating from a lymph node metastasis, showed a remarkably high expression of NaV1.7 compared to the low-level expression in TT cells derived from the primary tumor, suggesting a role for NaV1.7 in MTC metastasis. We demonstrated the druggability of NaV1.7 in MTC, by identifying a novel inhibitor (SV188) of this channel, and investigate its mode of binding and its ability to block the NaV1.7 sodium current. Patch-clamp studies of SV188 in the NaV1.7 channels expressed in HEK-293 cells showed that SV188 inhibited the NaV1.7 current with an IC50 value of 3.6 µM and Hill coefficient of 1.2. The results of our electrophysiological studies suggested that SV188 blocks the NaV1.7 channel in a voltage- and use-dependent manner, without significant effects on the steady-state inactivation of the channel. The inhibition of INa by SV188 led to a significant shift in the NaV1.7 channel’s conductance activation to more hyperpolarized potentials (around 8 mV). The mechanism of the blocking of NaV1.7 channels by SV188 did not involve an effect on the steady-state inactivation nor did the percentage of INa that is blocked show any differences when using different HPs. In addition, our results demonstrated that a higher blockade of outward INa agrees with the use-dependence effect of SV188 in the NaV1.7 channels, as Na+ ions moving out of the cell found the pore channel pathway blocked by the presence of SV188, which is favored by the higher frequencies of the channel openings. Altogether, the electrophysiological data suggested that SV188 might be entering the central cavity of the channel through the intracellular gate and binding somewhere in the permeation pathway of the channel. SV188 inhibited the viability of two MTC cell lines, MZ-CRC-1 and TT, with IC50 values of 8.47 μM and 9.32 μM, respectively. Supporting our hypothesis, SV188 significantly inhibited the invasion of MZ-CRC-1 cells by 35% and 52% after treatment with 3 μM and 6 μM, respectively. In contrast, SV188 showed no effect on the invasion of TT cells derived from the primary tumor, which has lower basal expression of NaV1.7. SV188 significantly inhibited the cell migration of MZ-CRC-1 and TT cells by 27% and 57%, respectively, at a 3 μM concentration. The dose at which SV188 displayed an inhibition of the invasion and migration of MTC cells was below their cell viability IC50 values, indicating that these effects are independent from the drug cytotoxicity. In addition, the cell cycle analysis of MZ-CRC-1 indicated that the treatment of SV188 induced arrest at the G0/G1 phase and decreased the cell population at the S and G2 phases, which led to the inhibition of MZ-CRC-1 cell proliferation, possibly by promoting cell apoptosis. Overall, our data showed that NaV1.7 is uniquely overexpressed in MTC and suggested that NaV1.7 could serve as a target to develop small-molecule drugs and/or as a biomarker for diagnostic purposes. It is reported that individuals carrying a mutation in SCN9A do not express NaV1.7 in their cells and have a congenital insensitivity to pain (CIP), a rare autosomal recessive disorder in which affected individuals are unable to perceive pain from birth to death [109,110]. Therefore, an additional benefit of using NaV1.7 inhibitors in cancer therapy would be their ability to reduce cancer-related pain. Studies to examine SV188 and other NaV1.7 inhibitors as potential pain therapeutics are currently in progress [76,111].

Supplementary Materials

The following supporting information can be downloaded at https://www.mdpi.com/article/10.3390/cancers15102806/s1. Figure S1: TMA quantification; Figure S2: Correlations plot between % NaV1.7 expression and patient disease status; Figure S3: Stronger blockade of NaV1.7 channel outward currents by SV188; Table S1: Point-biserial correlation between percentage of NaV1.7 expression and patient disease status (normal thyroid, primary, and metastases), copies of 1H NMR and 13C NMR spectra, and HPLC traces of three tested compounds. Figure S4: HPLC trace of SV188 hydrochloride. Figure S5: HPLC trace of WJB-133 hydrochloride. Figure S6: HPLC trace of Compound 4 hydrochloride. Figure S7: Original images and signal densities of the blots in Figure 3A of the manuscript. Figure S8: Original images and signal densities of the blots in Figure 3B of the manuscript. Figure S9: Original images and signal densities of the blots in Figure 3C of the manuscript.

Author Contributions

Conceptualization, S.E.V. and R.J.-S.; methodology, P.P., J.W., R.G., S.E.L., C.G., M.J.R.-P., J.C.G., H.C., D.L. and A.S.; funding acquisition, S.E.V. and R.J.-S.; drafting and finalizing the manuscript, P.P., R.J.-S. and S.E.V. All authors have read and agreed to the published version of the manuscript.

Funding

This study is supported by NIH grants, R21CA226491 and R21DE028349, and a Research Investment Program Pre-R01 grant from the O’Neal Comprehensive Cancer Center at the University of Alabama at Birmingham. This work is also supported by grants from CONACYT-México (A1-S-19171) and PAPIIT-DGAPA-UNAM (IN209820) to J.C.G.

Institutional Review Board Statement

The human MTC tumor samples with a pathology status and the control tumor samples were obtained from the UAB Tissue Biorepository, with an approved IRB protocol (IRB-300006132-002). This research was approved by the Scientific and Ethics Committees of the University of Alabama at Birmingham.

Informed Consent Statement

Patient consent was waived because the de-identified human samples were obtained from already collected specimens in the UAB Tissue Biorepository Bank under approved IRB- 300006543-005.

Data Availability Statement

Data is contained within the article or Supplementary Materials.

Acknowledgments

We acknowledge the generous supply of the human medullary thyroid cancer cell line (MZ-CRC-1) from Gilbert Cote, MD Anderson Cancer Center, Houston, TX, USA; the human medullary thyroid cancer cell line (TT) from Barry D. Nelkin, John Hopkins University, Baltimore, MD, USA; and the mouse medullary thyroid cancer cell line (MTC-p25OE) from James Bibb, University of Alabama at Birmingham, Birmingham, USA. We also acknowledge the assistance received from Edwin Rojas, UAB School of Dentistry, in running the HPLC traces of the three compounds.

Conflicts of Interest

The authors declare no conflict of interest.

Abbreviations

MTC (medullary thyroid cancer), NET (neuroendocrine tumors), VGSC (voltage-gated sodium channels), VGIC (voltage-gated ion channels), NHE1 (Na+/H+ exchanger 1), GAPDH (glyceraldehyde-3-phosphate dehydrogenase), PCR (polymerase chain reaction), TMA (Tissue microarray), ANOVA (Analysis of Variance), IHC (Immunohistochemistry), HSV (hue saturation value), CH2Cl2 (dichloromethane), EDC (1-Ethyl-3-(3-dimethylaminopropyl)carbodiimide), DMAP (N,N-Dimethylaminopyridine), MeOH (methanol), CHCl3 (chloroform), MeCN (acetonitrile), NaHCO3 (sodium bicarbonate), KMnO4 (potassium permanganate).

References

  1. Greenblatt, D.Y.; Elson, D.; Mack, E.; Chen, H. Initial lymph node dissection increases cure rates in patients with medullary thyroid cancer. Asian J. Surg. 2007, 30, 108–112. [Google Scholar] [CrossRef] [PubMed]
  2. Sippel, R.S.; Kunnimalaiyaan, M.; Chen, H. Current management of medullary thyroid cancer. Oncologist 2008, 13, 539–547. [Google Scholar] [CrossRef] [PubMed]
  3. Chen, H.; Sippel, R.S.; O’Dorisio, M.S.; Vinik, A.I.; Lloyd, R.V.; Pacak, K. The North American Neuroendocrine Tumor Society consensus guideline for the diagnosis and management of neuroendocrine tumors: Pheochromocytoma, paraganglioma, and medullary thyroid cancer. Pancreas 2010, 39, 775–783. [Google Scholar] [CrossRef] [PubMed]
  4. Okafor, C.; Hogan, J.; Raygada, M.; Thomas, B.J.; Akshintala, S.; Glod, J.W.; Del Rivero, J. Update on Targeted Therapy in Medullary Thyroid Cancer. Front. Endocrinol. 2021, 12, 708949. [Google Scholar] [CrossRef] [PubMed]
  5. Roy, M.; Chen, H.; Sippel, R.S. Current understanding and management of medullary thyroid cancer. Oncologist 2013, 18, 1093–1100. [Google Scholar] [CrossRef] [PubMed]
  6. Schlumberger, M.; Carlomagno, F.; Baudin, E.; Bidart, J.M.; Santoro, M. New therapeutic approaches to treat medullary thyroid carcinoma. Nat. Clin. Pract. Endocrinol. Metab. 2008, 4, 22–32. [Google Scholar] [CrossRef]
  7. Sandilos, G.; Lou, J.; Butchy, M.V.; Gaughan, J.P.; Reid, L.; Spitz, F.R.; Beninato, T.; Moore, M.D. Features of mixed medullary thyroid tumors: An NCDB analysis of clinicopathologic characteristics and survival. Am. J. Surg. 2023, in press. [Google Scholar] [CrossRef]
  8. Shepet, K.; Alhefdhi, A.; Lai, N.; Mazeh, H.; Sippel, R.; Chen, H. Hereditary medullary thyroid cancer: Age-appropriate thyroidectomy improves disease-free survival. Ann. Surg. Oncol. 2013, 20, 1451–1455. [Google Scholar] [CrossRef]
  9. Pajak, C.; Cadili, L.; Nabata, K.; Wiseman, S.M. 68Ga-DOTATATE-PET shows promise for diagnosis of recurrent or persistent medullary thyroid cancer: A systematic review. Am. J. Surg. 2022, 224, 670–675. [Google Scholar] [CrossRef]
  10. Cabanillas, M.E.; Habra, M.A. Lenvatinib: Role in thyroid cancer and other solid tumors. Cancer Treat. Rev. 2016, 42, 47–55. [Google Scholar] [CrossRef]
  11. Priya, S.R.; Dravid, C.S.; Digumarti, R.; Dandekar, M. Targeted Therapy for Medullary Thyroid Cancer: A Review. Front. Oncol. 2017, 7, 238. [Google Scholar] [CrossRef] [PubMed]
  12. Li, L.; Cheng, L.; Sa, R.; Qiu, X.; Chen, L. Real-world insights into the efficacy and safety of tyrosine kinase inhibitors against thyroid cancers. Crit. Rev. Oncol. Hematol. 2022, 172, 103624. [Google Scholar] [CrossRef] [PubMed]
  13. Efstathiadou, Z.A.; Tsentidis, C.; Bargiota, A.; Daraki, V.; Kotsa, K.; Ntali, G.; Papanastasiou, L.; Tigas, S.; Toulis, K.; Pazaitou-Panayiotou, K.; et al. Benefits and Limitations of TKIs in Patients with Medullary Thyroid Cancer: A Systematic Review and Meta-Analysis. Eur. Thyroid J. 2021, 10, 125–139. [Google Scholar] [CrossRef]
  14. Roger, S.; Gillet, L.; Le Guennec, J.-Y.; Besson, P. Voltage-gated sodium channels and cancer: Is excitability their primary role? Front. Pharmacol. 2015, 6, 152. [Google Scholar] [CrossRef]
  15. Roger, S.; Potier, M.; Vandier, C.; Besson, P.; Le Guennec, J.Y. Voltage-gated sodium channels: New targets in cancer therapy? Curr. Pharm. Des. 2006, 12, 3681–3695. [Google Scholar] [CrossRef]
  16. Brackenbury, W.J. Voltage-gated sodium channels and metastatic disease. Channels 2012, 6, 352–361. [Google Scholar] [CrossRef]
  17. Lastraioli, E.; Iorio, J.; Arcangeli, A. Ion channel expression as promising cancer biomarker. Biochim. Biophys. Acta 2015, 1848, 2685–2702. [Google Scholar] [CrossRef] [PubMed]
  18. Hodgkin, A.L.; Huxley, A.F. A quantitative description of membrane current and its application to conduction and excitation in nerve. J. Physiol. 1952, 117, 500–544. [Google Scholar] [CrossRef]
  19. Catterall, W.A. Voltage-gated sodium channels at 60: Structure, function and pathophysiology. J. Physiol. 2012, 590, 2577–2589. [Google Scholar] [CrossRef]
  20. de Lera Ruiz, M.; Kraus, R.L. Voltage-Gated Sodium Channels: Structure, Function, Pharmacology, and Clinical Indications. J. Med. Chem. 2015, 58, 7093–7118. [Google Scholar] [CrossRef]
  21. Quicke, P.; Sun, Y.; Arias-Garcia, M.; Beykou, M.; Acker, C.D.; Djamgoz, M.B.A.; Bakal, C.; Foust, A.J. Voltage imaging reveals the dynamic electrical signatures of human breast cancer cells. Commun. Biol. 2022, 5, 1178. [Google Scholar] [CrossRef] [PubMed]
  22. Ribeiro, M.; Elghajiji, A.; Fraser, S.P.; Burke, Z.D.; Tosh, D.; Djamgoz, M.B.A.; Rocha, P.R.F. Human Breast Cancer Cells Demonstrate Electrical Excitability. Front. Neurosci. 2020, 14, 404. [Google Scholar] [CrossRef] [PubMed]
  23. Miura, R.M. Analysis of excitable cell models. J. Comput. Appl. Math. 2002, 144, 29–47. [Google Scholar] [CrossRef]
  24. Sundelacruz, S.; Levin, M.; Kaplan, D.L. Role of Membrane Potential in the Regulation of Cell Proliferation and Differentiation. Stem Cell Rev. Rep. 2009, 5, 231–246. [Google Scholar] [CrossRef]
  25. Brackenbury, W.J.; Chioni, A.-M.; Diss, J.K.J.; Djamgoz, M.B.A. The neonatal splice variant of Nav1.5 potentiates in vitro invasive behaviour of MDA-MB-231 human breast cancer cells. Breast Cancer Res. Treat. 2007, 101, 149–160. [Google Scholar] [CrossRef]
  26. Yang, M.; Brackenbury, W.J. Membrane potential and cancer progression. Front. Physiol. 2013, 4, 185. [Google Scholar] [CrossRef]
  27. Nuccitelli, R. Endogenous electric fields in embryos during development, regeneration and wound healing. Radiat. Prot. Dosim. 2003, 106, 375–383. [Google Scholar] [CrossRef]
  28. Tokuoka, S.; Morioka, H. The membrane potential of the human cancer and related cells. Gann 1957, 48, 353–354. [Google Scholar]
  29. Djamgoz, M.B.A. Hyponatremia and Cancer Progression: Possible Association with Sodium-Transporting Proteins. Bioelectricity 2020, 2, 14–20. [Google Scholar] [CrossRef]
  30. Yu, H. Depolarization or hyperpolarization: Emerging role of altered bioelectricity in breast cancer metastasis. EBioMedicine 2022, 76, 103853. [Google Scholar] [CrossRef]
  31. James, A.D.; Leslie, T.K.; Kaggie, J.D.; Wiggins, L.; Patten, L.; Murphy O’Duinn, J.; Langer, S.; Labarthe, M.-C.; Riemer, F.; Baxter, G.; et al. Sodium accumulation in breast cancer predicts malignancy and treatment response. Br. J. Cancer 2022, 127, 337–349. [Google Scholar] [CrossRef]
  32. Lopez-Charcas, O.; Pukkanasut, P.; Velu, S.E.; Brackenbury, W.J.; Hales, T.G.; Besson, P.; Gomora, J.C.; Roger, S. Pharmacological and nutritional targeting of voltage-gated sodium channels in the treatment of cancers. iScience 2021, 24, 102270. [Google Scholar] [CrossRef] [PubMed]
  33. Angus, M.; Ruben, P. Voltage gated sodium channels in cancer and their potential mechanisms of action. Channels 2019, 13, 400–409. [Google Scholar] [CrossRef] [PubMed]
  34. Xia, J.; Huang, N.; Huang, H.; Sun, L.; Dong, S.; Su, J.; Zhang, J.; Wang, L.; Lin, L.; Shi, M.; et al. Voltage-gated sodium channel Nav1.7 promotes gastric cancer progression through MACC1-mediated upregulation of NHE1. Int. J. Cancer 2016, 139, 2553–2569. [Google Scholar] [CrossRef]
  35. Hossain, M.M.; Sonsalla, P.K.; Richardson, J.R. Coordinated role of voltage-gated sodium channels and the Na+/H+ exchanger in sustaining microglial activation during inflammation. Toxicol. Appl. Pharmacol. 2013, 273, 355–364. [Google Scholar] [CrossRef] [PubMed]
  36. Besson, P.; Driffort, V.; Bon, É.; Gradek, F.; Chevalier, S.; Roger, S. How do voltage-gated sodium channels enhance migration and invasiveness in cancer cells? Biochim. Biophys. Acta 2015, 1848, 2493–2501. [Google Scholar] [CrossRef]
  37. Egeblad, M.; Werb, Z. New functions for the matrix metalloproteinases in cancer progression. Nat. Rev. Cancer 2002, 2, 161–174. [Google Scholar] [CrossRef]
  38. Gillet, L.; Roger, S.; Besson, P.; Lecaille, F.; Gore, J.; Bougnoux, P.; Lalmanach, G.; Le Guennec, J.-Y. Voltage-gated Sodium Channel Activity Promotes Cysteine Cathepsin-dependent Invasiveness and Colony Growth of Human Cancer Cells. J. Biol. Chem. 2009, 284, 8680–8691. [Google Scholar] [CrossRef]
  39. Pal, R.; Kumar, B.; Akhtar, M.J.; Chawla, P.A. Voltage gated sodium channel inhibitors as anticonvulsant drugs: A systematic review on recent developments and structure activity relationship studies. Bioorg. Chem. 2021, 115, 105230. [Google Scholar] [CrossRef]
  40. Dutta, S.; Lopez Charcas, O.; Tanner, S.; Gradek, F.; Driffort, V.; Roger, S.; Selander, K.; Velu, S.E.; Brouillette, W. Discovery and evaluation of nNav1.5 sodium channel blockers with potent cell invasion inhibitory activity in breast cancer cells. Bioorg. Med. Chem. 2018, 26, 2428–2436. [Google Scholar] [CrossRef]
  41. Djamgoz, M.B.A.; Fraser, S.P.; Brackenbury, W.J. In Vivo Evidence for Voltage-Gated Sodium Channel Expression in Carcinomas and Potentiation of Metastasis. Cancers 2019, 11, 1675. [Google Scholar] [CrossRef] [PubMed]
  42. Shen, H.; Liu, D.; Wu, K.; Lei, J.; Yan, N. Structures of human Nav1.7 channel in complex with auxiliary subunits and animal toxins. Science 2019, 363, 1303–1308. [Google Scholar] [CrossRef] [PubMed]
  43. Lenkey, N.; Karoly, R.; Lukacs, P.; Vizi, E.S.; Sunesen, M.; Fodor, L.; Mike, A. Classification of Drugs Based on Properties of Sodium Channel Inhibition: A Comparative Automated Patch-Clamp Study. PLoS ONE 2010, 5, e15568. [Google Scholar] [CrossRef] [PubMed]
  44. Ragsdale, D.S.; McPhee, J.C.; Scheuer, T.; Catterall, W.A. Molecular determinants of state-dependent block of Na+ channels by local anesthetics. Science 1994, 265, 1724–1728. [Google Scholar] [CrossRef]
  45. Benjamin, E.R.; Pruthi, F.; Olanrewaju, S.; Ilyin, V.I.; Crumley, G.; Kutlina, E.; Valenzano, K.J.; Woodward, R.M. State-dependent compound inhibition of Nav1.2 sodium channels using the FLIPR Vm dye: On-target and off-target effects of diverse pharmacological agents. J. Biomol. Screen 2006, 11, 29–39. [Google Scholar] [CrossRef]
  46. Catterall, W.A. Voltage-Gated Sodium Channels: Structure, Function, and Pathophysiology. In Encyclopedia of Biological Chemistry, 2nd ed.; Lennarz, W.J., Lane, M.D., Eds.; Academic Press: Waltham, MA, USA, 2013; pp. 564–569. [Google Scholar]
  47. Chevrier, P.; Vijayaragavan, K.; Chahine, M. Differential modulation of Nav1.7 and Nav1.8 peripheral nerve sodium channels by the local anesthetic lidocaine. Br. J. Pharmacol. 2004, 142, 576–584. [Google Scholar] [CrossRef]
  48. Ragsdale, D.S.; McPhee, J.C.; Scheuer, T.; Catterall, W.A. Common molecular determinants of local anesthetic, antiarrhythmic, and anticonvulsant block of voltage-gated Na+ channels. Proc. Natl. Acad. Sci. USA 1996, 93, 9270–9275. [Google Scholar] [CrossRef]
  49. House, C.D.; Vaske, C.J.; Schwartz, A.M.; Obias, V.; Frank, B.; Luu, T.; Sarvazyan, N.; Irby, R.; Strausberg, R.L.; Hales, T.G.; et al. Voltage-gated Na+ channel SCN5A is a key regulator of a gene transcriptional network that controls colon cancer invasion. Cancer Res. 2010, 70, 6957–6967. [Google Scholar] [CrossRef]
  50. Fairhurst, C.; Martin, F.; Watt, I.; Doran, T.; Bland, M.; Brackenbury, W.J. Sodium channel-inhibiting drugs and cancer survival: Protocol for a cohort study using the CPRD primary care database. BMJ Open 2016, 6, e011661. [Google Scholar] [CrossRef]
  51. Driffort, V.; Gillet, L.; Bon, E.; Marionneau-Lambot, S.; Oullier, T.; Joulin, V.; Collin, C.; Pagès, J.C.; Jourdan, M.L.; Chevalier, S.; et al. Ranolazine inhibits NaV1.5-mediated breast cancer cell invasiveness and lung colonization. Mol. Cancer 2014, 13, 264. [Google Scholar] [CrossRef]
  52. Martin, F.; Ufodiama, C.; Watt, I.; Bland, M.; Brackenbury, W.J. Therapeutic Value of Voltage-Gated Sodium Channel Inhibitors in Breast, Colorectal, and Prostate Cancer: A Systematic Review. Front. Pharmacol. 2015, 6, 273. [Google Scholar] [CrossRef] [PubMed]
  53. Li, H.; Liu, J.; Fan, N.; Wang, H.; Thomas, A.M.; Yan, Q.; Li, S.; Qin, H. Nav1.6 promotes the progression of human follicular thyroid carcinoma cells via JAK-STAT signaling pathway. Pathol. Res. Pract. 2022, 236, 153984. [Google Scholar] [CrossRef] [PubMed]
  54. Klugbauer, N.; Lacinova, L.; Flockerzi, V.; Hofmann, F. Structure and functional expression of a new member of the tetrodotoxin-sensitive voltage-activated sodium channel family from human neuroendocrine cells. EMBO J. 1995, 14, 1084–1090. [Google Scholar] [CrossRef] [PubMed]
  55. Lopez-Charcas, O.; Poisson, L.; Benouna, O.; Lemoine, R.; Chadet, S.; Pétereau, A.; Lahlou, W.; Guyétant, S.; Ouaissi, M.; Pukkanasut, P.; et al. Voltage-Gated Sodium Channel NaV1.5 Controls NHE-1-Dependent Invasive Properties in Colon Cancer Cells. Cancers 2023, 15, 46. [Google Scholar] [CrossRef] [PubMed]
  56. Jaskula-Sztul, R.; Eide, J.; Tesfazghi, S.; Dammalapati, A.; Harrison, A.D.; Yu, X.M.; Scheinebeck, C.; Winston-McPherson, G.; Kupcho, K.R.; Robers, M.B.; et al. Tumor-suppressor role of Notch3 in medullary thyroid carcinoma revealed by genetic and pharmacological induction. Mol. Cancer Ther. 2015, 14, 499–512. [Google Scholar] [CrossRef]
  57. Aburjania, Z.; Whitt, J.D.; Jang, S.; Nadkarni, D.H.; Chen, H.; Rose, J.B.; Velu, S.E.; Jaskula-Sztul, R. Synthetic Makaluvamine Analogs Decrease c-Kit Expression and Are Cytotoxic to Neuroendocrine Tumor Cells. Molecules 2020, 25, 4940. [Google Scholar] [CrossRef] [PubMed]
  58. Livak, K.J.; Schmittgen, T.D. Analysis of relative gene expression data using real-time quantitative PCR and the 2−ΔΔCT Method. Methods 2001, 25, 402–408. [Google Scholar] [CrossRef]
  59. Hamill, O.P.; Marty, A.; Neher, E.; Sakmann, B.; Sigworth, F.J. Improved patch-clamp techniques for high-resolution current recording from cells and cell-free membrane patches. Pflugers Arch. 1981, 391, 85–100. [Google Scholar] [CrossRef]
  60. Marty, A.; Neher, E. Tight-Seal Whole-Cell Recording. In Single-Channel Recording; Sakmann, B., Neher, E., Eds.; Springer: Boston, MA, USA, 1995; pp. 31–52. [Google Scholar]
  61. GraphPad Prism Version 9.3.1 for Windows, Version 9.3.1; GraphPad Software: San Diego, CA, USA, 2021.
  62. Ashland, O.B. FlowJo™ Software for Windows Version 10.8.1, Version 10.8.1; Dickinson and Company: Franklin Lakes, NJ, USA, 2021.
  63. Kirkpatrick, L.A. A Simple Guide to IBM SPSS Statistics for Versions 20.0 & 21.0, Versions 20.0 & 21.0; Wadsworth Publishing: Belmont, CA, USA, 2013. [Google Scholar]
  64. Liu, C.; Yu, M.; Li, Y.; Wang, H.; Xu, C.; Zhang, X.; Li, M.; Guo, H.; Ma, D.; Guo, X. Lidocaine inhibits the metastatic potential of ovarian cancer by blocking NaV1.5-mediated EMT and FAK/Paxillin signaling pathway. Cancer Med. 2020, 10, 337–349. [Google Scholar] [CrossRef]
  65. Lopez-Charcas, O.; Espinosa, A.M.; Alfaro, A.; Herrera-Carrillo, Z.; Ramirez-Cordero, B.E.; Cortes-Reynosa, P.; Perez Salazar, E.; Berumen, J.; Gomora, J.C. The invasiveness of human cervical cancer associated to the function of NaV1.6 channels is mediated by MMP-2 activity. Sci. Rep. 2018, 8, 12995. [Google Scholar] [CrossRef]
  66. Diss, J.K.; Archer, S.N.; Hirano, J.; Fraser, S.P.; Djamgoz, M.B. Expression profiles of voltage-gated Na+ channel alpha-subunit genes in rat and human prostate cancer cell lines. Prostate 2001, 48, 165–178. [Google Scholar] [CrossRef] [PubMed]
  67. Diss, J.K.J.; Stewart, D.; Pani, F.; Foster, C.S.; Walker, M.M.; Patel, A.; Djamgoz, M.B.A. A potential novel marker for human prostate cancer: Voltage-gated sodium channel expression in vivo. Prostate Cancer Prostatic Dis. 2005, 8, 266–273. [Google Scholar] [CrossRef]
  68. Campbell, T.M.; Main, M.J.; Fitzgerald, E.M. Functional expression of the voltage-gated Na⁺-channel Nav1.7 is necessary for EGF-mediated invasion in human non-small cell lung cancer cells. J. Cell Sci. 2013, 126, 4939–4949. [Google Scholar] [CrossRef] [PubMed]
  69. Liu, J.; Tan, H.; Yang, W.; Yao, S.; Hong, L. The voltage-gated sodium channel Nav1.7 associated with endometrial cancer. J. Cancer 2019, 10, 4954–4960. [Google Scholar] [CrossRef] [PubMed]
  70. Horne, J.; Mansur, S.; Bao, Y. Sodium ion channels as potential therapeutic targets for cancer metastasis. Drug Discov. Today 2021, 26, 1136–1147. [Google Scholar] [CrossRef] [PubMed]
  71. Pacini, F.; Elisei, R.; Anelli, S.; Basolo, F.; Cola, A.; Pinchera, A. Somatostatin in medullary thyroid cancer. In vitro and in vivo studies. Cancer 1989, 63, 1189–1195. [Google Scholar] [CrossRef]
  72. Gould, H.J., 3rd; Norleans, J.; Ward, T.D.; Reid, C.; Paul, D. Selective lysis of breast carcinomas by simultaneous stimulation of sodium channels and blockade of sodium pumps. Oncotarget 2018, 9, 15606–15615. [Google Scholar] [CrossRef]
  73. Yang, M.; Kozminski, D.J.; Wold, L.A.; Modak, R.; Calhoun, J.D.; Isom, L.L.; Brackenbury, W.J. Therapeutic potential for phenytoin: Targeting Nav1.5 sodium channels to reduce migration and invasion in metastatic breast cancer. Breast Cancer Res. Treat. 2012, 134, 603–615. [Google Scholar] [CrossRef]
  74. Simon, R.; Mirlacher, M.; Sauter, G. Immunohistochemical analysis of tissue microarrays. Methods Mol. Biol. 2010, 664, 113–126. [Google Scholar] [CrossRef]
  75. Wu, Y.; Zou, B.; Liang, L.; Li, M.; Tao, Y.X.; Yu, H.; Wang, X.; Li, M. Loperamide inhibits sodium channels to alleviate inflammatory hyperalgesia. Neuropharmacology 2017, 117, 282–291. [Google Scholar] [CrossRef]
  76. Bankar, G.; Goodchild, S.J.; Howard, S.; Nelkenbrecher, K.; Waldbrook, M.; Dourado, M.; Shuart, N.G.; Lin, S.; Young, C.; Xie, Z.; et al. Selective NaV1.7 Antagonists with Long Residence Time Show Improved Efficacy against Inflammatory and Neuropathic Pain. Cell Rep. 2018, 24, 3133–3145. [Google Scholar] [CrossRef]
  77. Wang, G.K.; Russell, C.; Wang, S.Y. Mexiletine block of wild-type and inactivation-deficient human skeletal muscle hNav1.4 Na+ channels. J. Physiol. 2004, 554, 621–633. [Google Scholar] [CrossRef] [PubMed]
  78. Panigel, J.; Cook, S.P. A point mutation at F1737 of the human Nav1.7 sodium channel decreases inhibition by local anesthetics. J. Neurogenet. 2011, 25, 134–139. [Google Scholar] [CrossRef] [PubMed]
  79. Szabo, A.K.; Pesti, K.; Lukacs, P.; Földi, M.C.; Gerevich, Z.; Sperlagh, B.; Mike, A. Non-blocking modulation as the major mechanism of sodium channel inhibition by riluzole. bioRxiv 2017. [Google Scholar] [CrossRef]
  80. Gamal El-Din, T.M.; Lenaeus, M.J.; Zheng, N.; Catterall, W.A. Fenestrations control resting-state block of a voltage-gated sodium channel. Proc. Natl. Acad. Sci. USA 2018, 115, 13111–13116. [Google Scholar] [CrossRef] [PubMed]
  81. Hille, B. Local anesthetics: Hydrophilic and hydrophobic pathways for the drug-receptor reaction. J. Gen. Physiol. 1977, 69, 497–515. [Google Scholar] [CrossRef]
  82. Huang, C.J.; Schild, L.; Moczydlowski, E.G. Use-dependent block of the voltage-gated Na+ channel by tetrodotoxin and saxitoxin: Effect of pore mutations that change ionic selectivity. J. Gen. Physiol. 2012, 140, 435–454. [Google Scholar] [CrossRef]
  83. Narahashi, T. Tetrodotoxin: A brief history. Proc. Jpn. Acad. Ser. B Phys. Biol. Sci. 2008, 84, 147–154. [Google Scholar] [CrossRef]
  84. Van Meerloo, J.; Kaspers, G.J.; Cloos, J. Cell sensitivity assays: The MTT assay. Methods Mol. Biol. 2011, 731, 237–245. [Google Scholar] [CrossRef]
  85. Chen, H.C. Boyden chamber assay. Methods Mol. Biol. 2005, 294, 15–22. [Google Scholar] [CrossRef]
  86. Edenfield, S.; Sims, A.M.; Porretta, C.; Gould, H.J., 3rd; Paul, D. Effect of Cell Cycle on Cell Surface Expression of Voltage-Gated Sodium Channels and Na+,K+-ATPase. Cells 2022, 11, 3240. [Google Scholar] [CrossRef] [PubMed]
  87. Rao, V.R.; Perez-Neut, M.; Kaja, S.; Gentile, S. Voltage-gated ion channels in cancer cell proliferation. Cancers 2015, 7, 849–875. [Google Scholar] [CrossRef] [PubMed]
  88. Clapham, D.E. Calcium signaling. Cell 1995, 80, 259–268. [Google Scholar] [CrossRef] [PubMed]
  89. Abdul Kadir, L.; Stacey, M.; Barrett-Jolley, R. Emerging Roles of the Membrane Potential: Action Beyond the Action Potential. Front. Physiol. 2018, 9, 1661. [Google Scholar] [CrossRef]
  90. Li, R.; Xiao, C.; Liu, H.; Huang, Y.; Dilger, J.P.; Lin, J. Effects of local anesthetics on breast cancer cell viability and migration. BMC Cancer 2018, 18, 666. [Google Scholar] [CrossRef]
  91. Haraguchi-Suzuki, K.; Kawabata-Iwakawa, R.; Suzuki, T.; Suto, T.; Takazawa, T.; Saito, S. Local anesthetic lidocaine induces growth suppression of HeLa cells by decreasing and changing the cellular localization of the proliferation marker Ki-67. Genes Cells 2022, 27, 675–684. [Google Scholar] [CrossRef]
  92. Piegeler, T.; Votta-Velis, E.G.; Liu, G.; Place, A.T.; Schwartz, D.E.; Beck-Schimmer, B.; Minshall, R.D.; Borgeat, A. Antimetastatic Potential of Amide-linked Local Anesthetics: Inhibition of Lung Adenocarcinoma Cell Migration and Inflammatory Src Signaling Independent of Sodium Channel Blockade. Anesthesiology 2012, 117, 548–559. [Google Scholar] [CrossRef]
  93. Le Gac, G.; Angenard, G.; Clément, B.; Laviolle, B.; Coulouarn, C.; Beloeil, H. Local Anesthetics Inhibit the Growth of Human Hepatocellular Carcinoma Cells. Anesth. Analg. 2017, 125, 1600–1609. [Google Scholar] [CrossRef]
  94. Xu, X.; Dai, Y.; Feng, L.; Zhang, H.; Hu, Y.; Xu, L.; Zhu, X.; Jiang, Y. Knockdown of Nav1.5 inhibits cell proliferation, migration and invasion via Wnt/-catenin signaling pathway in oral squamous cell carcinoma. Acta Biochim. Biophys. Sin. 2020, 52, 527–535. [Google Scholar] [CrossRef]
  95. Li, K.; Zhou, Z.Y.; Ji, P.P.; Luo, H.S. Knockdown of β-catenin by siRNA influences proliferation, apoptosis and invasion of the colon cancer cell line SW480. Oncol. Lett. 2016, 11, 3896–3900. [Google Scholar] [CrossRef]
  96. Iwai, S.; Yonekawa, A.; Harada, C.; Hamada, M.; Katagiri, W.; Nakazawa, M.; Yura, Y. Involvement of the Wnt-β-catenin pathway in invasion and migration of oral squamous carcinoma cells. Int. J. Oncol. 2010, 37, 1095–1103. [Google Scholar] [CrossRef] [PubMed]
  97. Zhang, Y.; Wang, X. Targeting the Wnt/β-catenin signaling pathway in cancer. J. Hematol. Oncol. 2020, 13, 165. [Google Scholar] [CrossRef] [PubMed]
  98. Wang, J.; Ou, S.W.; Wang, Y.J. Distribution and function of voltage-gated sodium channels in the nervous system. Channels 2017, 11, 534–554. [Google Scholar] [CrossRef] [PubMed]
  99. Xing, D.; Wang, J.; Ou, S.; Wang, Y.; Qiu, B.; Ding, D.; Guo, F.; Gao, Q. Expression of neonatal Nav1.5 in human brain astrocytoma and its effect on proliferation, invasion and apoptosis of astrocytoma cells. Oncol. Rep. 2014, 31, 2692–2700. [Google Scholar] [CrossRef] [PubMed]
  100. Gupta, G.P.; Massagué, J. Cancer metastasis: Building a framework. Cell 2006, 127, 679–695. [Google Scholar] [CrossRef]
  101. Mohamed, M.M.; Sloane, B.F. Cysteine cathepsins: Multifunctional enzymes in cancer. Nat. Rev. Cancer 2006, 6, 764–775. [Google Scholar] [CrossRef]
  102. Brisson, L.; Gillet, L.; Calaghan, S.; Besson, P.; Le Guennec, J.Y.; Roger, S.; Gore, J. NaV1.5 enhances breast cancer cell invasiveness by increasing NHE1-dependent H+ efflux in caveolae. Oncogene 2011, 30, 2070–2076. [Google Scholar] [CrossRef]
  103. Gatenby, R.A.; Smallbone, K.; Maini, P.K.; Rose, F.; Averill, J.; Nagle, R.B.; Worrall, L.; Gillies, R.J. Cellular adaptations to hypoxia and acidosis during somatic evolution of breast cancer. Br. J. Cancer 2007, 97, 646–653. [Google Scholar] [CrossRef]
  104. Brisson, L.; Driffort, V.; Benoist, L.; Poet, M.; Counillon, L.; Antelmi, E.; Rubino, R.; Besson, P.; Labbal, F.; Chevalier, S.; et al. NaV1.5 Na⁺ channels allosterically regulate the NHE-1 exchanger and promote the activity of breast cancer cell invadopodia. J. Cell Sci. 2013, 126, 4835–4842. [Google Scholar] [CrossRef]
  105. Roger, S.; Besson, P.; Le Guennec, J.Y. Influence of the whole-cell patch-clamp configuration on electrophysiological properties of the voltage-dependent sodium current expressed in MDA-MB-231 breast cancer cells. Eur. Biophys. J. 2004, 33, 274–279. [Google Scholar] [CrossRef]
  106. Wang, G.; Cao, R.; Wang, Y.; Qian, G.; Dan, H.C.; Jiang, W.; Ju, L.; Wu, M.; Xiao, Y.; Wang, X. Simvastatin induces cell cycle arrest and inhibits proliferation of bladder cancer cells via PPARγ signalling pathway. Sci. Rep. 2016, 6, 35783. [Google Scholar] [CrossRef] [PubMed]
  107. Eidizade, F.; Soukhtanloo, M.; Zhiani, R.; Mehrzad, J.; Mirzavi, F. Inhibition of glioblastoma proliferation, invasion, and migration by Urolithin B through inducing G0/G1 arrest and targeting MMP-2/-9 expression and activity. Biofactors 2022, 49, 379–389. [Google Scholar] [CrossRef] [PubMed]
  108. Loh, C.Y.; Chai, J.Y.; Tang, T.F.; Wong, W.F.; Sethi, G.; Shanmugam, M.K.; Chong, P.P.; Looi, C.Y. The E-Cadherin and N-Cadherin Switch in Epithelial-to-Mesenchymal Transition: Signaling, Therapeutic Implications, and Challenges. Cells 2019, 8, 1118. [Google Scholar] [CrossRef] [PubMed]
  109. Sun, J.; Li, L.; Yang, L.; Duan, G.; Ma, T.; Li, N.; Liu, Y.; Yao, J.; Liu, J.Y.; Zhang, X. Novel SCN9A missense mutations contribute to congenital insensitivity to pain: Unexpected correlation between electrophysiological characterization and clinical phenotype. Mol. Pain 2020, 16, 1744806920923881. [Google Scholar] [CrossRef]
  110. Marchi, M.; D’Amato, I.; Andelic, M.; Cartelli, D.; Salvi, E.; Lombardi, R.; Gumus, E.; Lauria, G. Congenital insensitivity to pain: A novel mutation affecting a U12-type intron causes multiple aberrant splicing of SCN9A. Pain 2022, 163, e882–e887. [Google Scholar] [CrossRef]
  111. Trombetti, G.A.; Mezzelani, A.; Orro, A. A Drug Discovery Approach for an Effective Pain Therapy through Selective Inhibition of Nav1.7. Int. J. Mol. Sci. 2022, 23, 6793. [Google Scholar] [CrossRef]
Figure 2. mRNA expression of NaV1.7 in neuroendocrine tumor cells. (A) The expression of NaV1.7 was conserved in MTC cell lines, MZ-CRC-1, and TT compared to pancreatic cancer cell line, BON, and lung cancer cell line H727. There was a significant difference in NaV1.5, NaV1.6, and NaV1.7 expression among NET cell lines, as determined by one-way ANOVA; NaV1.5 F(DFn, DFd), F(3, 6) = 19.3, p = 0.0017; MZ-CRC-1 (56.52 ± 7.90), TT (0.10 ± 0.00), BON (3.90 ± 0.24), H727 (1.00 ± 0.05), NaV1.6 F(DFn, DFd), and F(3, 7) = 116.3, p < 0.0001; MZ-CRC-1 (897.70 ± 15.25), TT (75.13 ± 15.71), BON (212.34 ± 36.40), H727 (206.79 ± 31.41), and NaV1.7 F(DFn, DFd), F(3, 7) = 151.5, p < 0.0001; MZ-CRC-1 (22,457.28 ± 2259.25), TT (9740.63 ± 501.42), BON (12.29 ± 3.74), and H727 (744.14 ± 93.56). (B) The normal thyroid cell lines, Nyth-ori3-1 and Htori-3; the papillary thyroid carcinoma cell line TPC-1; and the anaplastic thyroid carcinoma cell line Hth7 did not show detectable expression of NaV1.7, while MZ-CRC-1 (15.18 ± 1.59) showed high NaV1.7 expression, as determined by a one-way ANOVA F (DFn, DFd), F(4, 10) = 298.6, p < 0.0001. (C) The expression of NaV1.7 is significantly higher in metastatic MTC cell line, MZ-CRC-1 (1.05 ± 0.17), compared to TT cell line derived from primary tumor (0.40 ± 0.01), as determined by one-way ANOVA F(DFn, DFd), F(15, 32) = 201.1, p < 0.0001. MTC (cancerous) tissues showed higher expression of NaV1.7 than their normal counterparts, with significant difference; TH64 normal (0.0021 ± 0.0014) and TH64 tumor (0.5258 ± 0.0360), p = 0.0001; TH79 normal (0.0355 ± 0.0007), TH79 tumor (1) (1.4749 ± 0.0430), and TH79 tumor (2) (3.3186 ± 0.0346), p < 0.0001; TH46 normal (0.0112 ± 0.0017) and TH46 tumor (0.8688 ± 0.0694), p < 0.0001. Normal counterparts for MTC TH35, 59, 47, 42, 77, 89, and 86 were not available for comparison. Target gene expression was normalized to the housekeeping gene, ribosomal protein S27. * p < 0.05, ** p < 0.01, *** p < 0.001, **** p < 0.0001.
Cancers 15 02806 g002
Figure 3. Immunoblotting for NaV1.7 showed its overexpression in MTC cell lines and patient samples compared to normal cell lines and normal thyroid specimens. (A) NaV1.7 was detected in human MTC cell lines, MZ-CRC-1 and TT, and transgenic MTC mouse cell lines compared to normal human thyroid cell lines, Nthy-ori3-1 and Htori-3, which showed no detectable expression of NaV1.7. (B) Four out of six MTC patient tissues showed expression of NaV1.7, while it was not detected in normal thyroid tissue. (C) A comparison of SSTR2 expression (neuroendocrine cancer biomarker) with NaV1.7 expression in normal tissues and MTC patient tissues. SSTR2 expression exhibited matching trends, with Nav1.7 expression in 3 out of 4 MTC patient tissues that had NaV1.7 expression. The uncropped blots and molecular weight markers are shown in Supplementary Figures S7–S9.
Cancers 15 02806 g003
Figure 4. Tissue microarrays (TMA) and automated quantification of NaV1.7 expression in MTC patient tissues. (A) MZ-CRC-1 thyroid cancer cells are positive for NaV1.7, and Nthy-ori3-1 normal thyroid cells are negative for NaV1.7 expression. The cell pellets for NaV1.7 Ab validation were created for MTC patients’ tissue staining. (B) TMA consisted of paraffin-embedded cores of MTC from 9 patients positive for NaV1.7 (cores in triplicates) and 6 normal thyroid specimens negative for NaV1.7. (C) Automated quantification of NaV1.7 expression in MTC TMA cores with custom MATLAB code. TMA histology slides were scanned and manually segmented images for each region of interest. The tissues were evaluated in the hue, saturation, value (HSV) color space, and identified threshold values via saturation histogram to create saturation mask which best distinguishes positive staining compared to control. Morphological transformations were performed to remove the closing of open regions and small objects. Otsu’s thresholding method was utilized to distinguish between positive and negative regions including percent positive stain, intensity of stain, and number of cells. (D) Automated quantification with custom MATLAB code identified 70.73% of samples (n = 29/41) withrotary evaporator under vacuum to obtainrotary evaporator under vacuum to obtain ≥50% expression of NaV1.7; data are normally distributed, with mean at 60–70% expression of NaV1.7. (E) Percentage of NaV1.7 expression by mean in each TMA compared to normal thyroid tissue; the error bars show the standard error of the mean (SEM); N = number of cores; normal thyroid tissue 15.04 ± 4.45 (N = 10) and MTC TMA5 56.57 ± 5.53 (N = 18). TMA6A 47.29 ± 3.17 (N = 34), TMA6B 61.80 ± 2.12 (N = 30), and TMA7 54.42 ± 4.04 (N = 43). There was statistically significant difference between normal thyroid samples and MTC TMAs, as determined by one-way ANOVA F (DFn, DFd), F(4, 128) = 10.07, p < 0.0001. (F) TMA quantification from 133 tissue cores including normal thyroid, primary MTC, and metastatic MTC (MTC subjects, N = 41, and total no. of subjects, N total = 45). There was a statistically significant difference between normal thyroid samples: 15.04 ± 4.45 vs. primary MTC: 56.24 ± 2.82 and metastatic MTC: 52.28 ± 2.88, as determined by one-way ANOVA F (DFn, DFd), F(2, 130) = 15.37, p < 0.0001. However, the expression level of NaV1.7 in cancerous tissues in both primary and metastatic MTC showed no significant difference, p = 0.5754. *** p < 0.001, **** p < 0.0001.
Cancers 15 02806 g004
Figure 5. The effects of NaV1.5 inhibitors on the expression of NaV1.7 and related genes. (A) Chemical structures of NaV1.5 inhibitors used in the initial screening. (B) Cytotoxicity screening of the inhibitors using MZ-CRC-1 cells in an MTT assay; SV188 IC50 = 9.00 ± 1.92 µM, compound 4 IC50 = 14.53 ± 2.81 µM, and WJB-133 IC50 = 8.04 ± 0.47 µM. (C) mRNA expression of different genes of interest: NaV1.7 (SCN9A) and NHE1 (SLC9A) in MZ-CRC-1 cells after treatment with 5 μM of compound 4, SV188, and WJB-133 for 24 h. SV188 treatment significantly decreased the expression of NaV1.7 (p < 0.05, control: 1.01 ± 0.08, SV188: 0.18 ± 0.05), and NHE1 (p < 0.01, control: 1.09 ± 0.31, SV188: 0.15 ± 0.06). Target gene expression was normalized to the housekeeping gene, ribosomal protein S27. * p < 0.05, *** p < 0.001.
Cancers 15 02806 g005
Figure 6. mRNA expression of NaV1.5 (SCN5A), NaV1.6 (SCN8A), and NaV1.7 (SCN9A) in MZ-CRC-1 cells after treatment with 5 μM of SV188 for 48 h. SV188 treatment significantly decreased the expression of NaV1.7 (unpaired t-test, t (3) = 8.17, p = 0.0038) in control, 1.00 ± 0.03, SV188: 0.75 ± 0.01, and increased the expression of NaV1.5 (unpaired t-test, t (4) = 5.50, p = 0.0053) in control, 1.01 ± 0.11, SV188: 1.73 ± 0.06, with no significant effect on the expression of NaV1.6 (unpaired t-test, t (4) = 0.6467, p = 0.5530) in control, 1.06 ± 0.27, SV188: 1.26 ± 0.15. Target gene expression was normalized to GAPDH. ** p < 0.01.
Cancers 15 02806 g006
Scheme 1. Synthesis of compound SV188.
Cancers 15 02806 sch001
Scheme 2. Synthesis of compound WJB-133.
Cancers 15 02806 sch002
Figure 7. Dose-dependent blockade of NaV1.7 channels by SV188. (A) Representative recordings showing stationary blockade of NaV1.7 currents by increasing concentrations of SV188 in µM. Whole-cell patch-clamp recordings were made from NaV1.7 channels transiently expressed in an HEK-293 cell. Sodium currents (INa) were evoked by voltage steps to −10 mV from a holding potential (HP) of −120 mV applied every 10 s. Traces are the average of three consecutive recordings under the indicated experimental conditions. The black dotted line represents the zero-current level. (B) Time course of NaV1.7 current blockade by SV188. Data from the same cell shown in (A). Current recovery was incomplete in most cells; on average, 74 ± 3% of current was recovered after extensive wash out of SV188. (C) Dose–response relationship of the effect of SV188 on NaV1.7 channels. Fraction of the blocked current was calculated from peak current measurements from step voltages to −10 mV in the presence of several SV188 concentrations (n = 3–16 cells). Data points (mean ± SEM) were fitted using a Hill equation (smooth line); the corresponding IC50 and Hill slope (nH) parameters are shown in the graph. Pink points display the corresponding fraction of current blocked by 3 µM and 10 µM of SV188 when using an HP = −80 mV.
Cancers 15 02806 g007
Figure 8. Effects of SV188 on NaV1.7 channels’ gating. (A) Representative families of sodium currents obtained before (control), during, and after (recovery) exposure to 5 µM of SV188. Currents were recorded in response to 16-ms depolarizing pulses from −60 to +100 mV in 10-mV steps applied every 5 s from an HP of −120 mV. (B) Current–voltage relationships of NaV1.7 channels obtained under the indicated experimental conditions. Peak INa amplitudes were normalized to the Cm value of each cell, averaged, and plotted as a function of the depolarizing potential (Vm; n = 13 cells). Note that outward currents are practically absent in the presence of SV188. (C) Voltage-dependence of sodium conductance measured in the same cells as in (B). Smooth lines are fit to a Boltzmann function with the following parameters: control, V1/2 = −24.2 ± 1.3 mV and k = 8.0 ± 0.5 mV; SV188, V1/2 = −32.7 ± 1.0 mV and k = 5.9 ± 0.3 mV. Statistically different from control condition (p < 0.01). (D) Sodium currents evoked by test pulses to −10 mV after 200 ms prepulses to potentials from −120 to −50 mV in 5 mV steps. For comparison, the current recorded at −10 mV after −90 mV prepulse is colored in red for both experimental conditions. (E) Steady-state inactivation curves. Data points were obtained by plotting the normalized peak INa at −10 mV against the prepulse potential in each condition (n = 8 cells). Each data set was fit to a Boltzmann function (smooth lines) with the following parameters (V1/2 and k values): control, −84.0 ± 2.6 mV and 7.4 ± 0.9 mV; SV188, −91.0 ± 3.5 mV and 8.7 ± 0.9 mV. These parameters were not statistically different (p > 0.05, unpaired t-tests).
Cancers 15 02806 g008
Figure 9. Use-dependent blockade of NaV1.7 channels by SV188. NaV1.7 currents were activated at 10-s intervals by 16-ms voltage steps to −10 mV applied from an HP of −120 mV. After recording currents in control saline, the cell was superfused with 5 µM of SV188 (A) for 5 min or 25 nM TTX for 2.5 min (B) in the absence of voltage steps. Depolarizing steps were then resumed (p1) in the continued presence of the respective blockers, until the stationary blockade was reached (pn). Finally, the blockers were washed out from the recoding chamber with saline control. INa amplitudes are plotted against time. (C) The fraction of INa blocked by SV188 (blue bars) or TTX (red bars) recorded at the first pulse after resumption of step depolarizations (p1) and after stationary blockade was reached (pn) is plotted against control (black bars). n = 4 cells for each compound. (D) Time course plot of use-dependent blockade of NaV1.7 channels in the absence (black points) and the presence of 5 µM of SV188 (blue points). A train of 40 pulses to −10 mV at a frequency of 40 Hz was applied under each experimental condition. The peak of each pulse was normalized to the peak of the first pulse for each experimental condition, and the averaged values (n = 4 cells) were plotted against test pulse number (Episode). The blockade of NaV1.7 channels is increased by around 50% when the channel is activated at 40 Hz, in comparison to when the channels are activated every 10 s (0.1 Hz; Episode 1, blue points).
Cancers 15 02806 g009
Figure 10. Inhibition of viability, migration, and invasion of MTC cells by SV188 treatment. (A) Inhibition of cell viability of MTC cells was measured in a MTT assay: MZ-CRC-1 IC50 = 8.47 ± 0.75 μM, and TT IC50 = 9.32 ± 0.44 μM. (B) Treatment of SV188 reduced cells’ migration in both MZ-CRC-1 and TT cells. Cell migration/invasion effects were calculated based on the normalized fold-change migration from three experiments; each experiment was carried out in quadruplicate for each group. Effect on cell migration for MZ-CRC1 control: 1.00 ± 0.09, 3 μM SV188: mean ± SEM, 0.73 ± 0.02 (p < 0.05), and 6 μM SV188: mean ± SEM, 0.58 ± 0.06 (p < 0.001). (C) Effect on cell migration for TT control: 1.00 ± 0.12, 3 μM SV188: 0.43 ± 0.08 (p < 0.01), and 6 μM SV188: 0.47 ± 0.11 (p < 0.01). (D) Effect on cell invasion for MZ-CRC-1 control: 1.00 ± 0.08, 3 μM SV188: 0.65 ± 0.09 (p < 0.05), and 6 μM SV188: 0.48 ± 0.07 (p < 0.001). (E) Effect on cell invasion for TT showed no significant differences, p = 0.974 and 0.983 for treatment with 3 μM and 6 μM SV188, respectively. Microscope’s magnification 20×, each scale bar shows 50 µm. * p < 0.05, ** p < 0.01, *** p < 0.001.
Cancers 15 02806 g010
Figure 11. Cell cycle analysis. A significant increase in G0/G1 phase and a significant decrease in G2 phase was observed after treatments with SV188 up to 9 µM for 48 h. (A) Cell cycle analysis from a single experiment representing G0/G1 phase, S phase, and G2 phase; the data were indicated by percentage of cells on a scatter plot. (B) Quantification of cell cycle analysis in response to SV188 treatments at 3, 6, and 9 µM after 48 h from 3 experiments; G0/G1 phase: control (54.30 ± 3.33), 3 µM (64.17 ± 3.01, p = 0.0370), 6 µM (68.13 ± 2.18, p = 0.0024), and 9 µM (68.97 ± 2.84, p = 0.0013); S phase: control (7.33 ± 0.77), 3 µM (6.05 ± 0.14, p = 0.9814), 6 µM (5.24 ± 1.39, p = 0.9263), and 9 µM (4.63 ± 1.47, p = 0.8569); G2 phase: control (34.13 ± 4.63), 3 µM (26.17 ± 2.15, p = 0.1169), 6 µM (24.03 ± 1.03, p = 0.0318), and 9 µM (23.10 ± 2.10, p = 0.0171). The significant difference in each phase was determined by Tukey’s multiple comparisons test, with * p < 0.05 and ** p < 0.01 compared with corresponding controls.
Cancers 15 02806 g011
Disclaimer/Publisher’s Note: The statements, opinions and data contained in all publications are solely those of the individual author(s) and contributor(s) and not of MDPI and/or the editor(s). MDPI and/or the editor(s) disclaim responsibility for any injury to people or property resulting from any ideas, methods, instructions or products referred to in the content.

