Article

Genome-Wide Association Study of Breast Density among Women of African Ancestry

by
Shefali Setia Verma
1,
Lindsay Guare
1,
Sarah Ehsan
1,
Aimilia Gastounioti
2,
Gabrielle Scales
3,
Marylyn D. Ritchie
1,
Despina Kontos
1,
Anne Marie McCarthy
1,* and
Penn Medicine Biobank
1
Perelman School of Medicine, University of Pennsylvania, Philadelphia, PA 19104, USA
2
Washington University School of Medicine in St. Louis, St. Louis, MO 63130, USA
3
Spelman College, Atlanta, GA 30314, USA
*
Author to whom correspondence should be addressed.
Author list in supplementary materials ([email protected]).
Cancers 2023, 15(10), 2776; https://doi.org/10.3390/cancers15102776
Submission received: 14 March 2023 / Revised: 3 May 2023 / Accepted: 11 May 2023 / Published: 16 May 2023
(This article belongs to the Special Issue Breast Cancer Risk and Prevention)

Abstract

:

Simple Summary

In the US, Black women are disproportionately affected by higher breast cancer mortality rates and later-stage tumor diagnoses compared with White women. Breast density, the ratio of dense fibroglandular breast tissue to overall breast tissue area, has previously been identified as an important breast cancer risk factor. Most current genome-wide association studies for breast density have been performed in participants of European ancestry, which have yielded important insights into genetic etiology of breast density. However, little is known about the influence of common genetic variants on breast density in African ancestry populations. Our study aimed to determine genetic factors associated with breast density in African ancestry populations using a Genome-Wide Association Study (GWAS) and post-GWAS analyses on a cohort of genomic data available through the Penn Medicine BioBank. Results of this study elucidate potential genetic mechanisms associated with breast density, and thus cancer risk, among women of African ancestry.

Abstract

Breast density, the amount of fibroglandular versus fatty tissue in the breast, is a strong breast cancer risk factor. Understanding genetic factors associated with breast density may help in clarifying mechanisms by which breast density increases cancer risk. To date, 50 genetic loci have been associated with breast density, however, these studies were performed among predominantly European ancestry populations. We utilized a cohort of women aged 40–85 years who underwent screening mammography and had genetic information available from the Penn Medicine BioBank to conduct a Genome-Wide Association Study (GWAS) of breast density among 1323 women of African ancestry. For each mammogram, the publicly available “LIBRA” software was used to quantify dense area and area percent density. We identified 34 significant loci associated with dense area and area percent density, with the strongest signals in GACAT3, CTNNA3, HSD17B6, UGDH, TAAR8, ARHGAP10, BOD1L2, and NR3C2. There was significant overlap between previously identified breast cancer SNPs and SNPs identified as associated with breast density. Our results highlight the importance of breast density GWAS among diverse populations, including African ancestry populations. They may provide novel insights into genetic factors associated with breast density and help in elucidating mechanisms by which density increases breast cancer risk.

1. Introduction

Black women in the US have 40% higher breast cancer mortality than White women [1] and are more likely to be diagnosed with later stage tumors and with triple negative breast cancers, which have limited treatment options and poorer prognosis than hormone receptor positive tumors [2,3]. Given these disease patterns, early detection is vitally important for reducing racial disparities. Breast density, the relative amount of fibroglandular versus fatty breast tissue, is one of the strongest breast cancer risk factors, and increases breast cancer risk 3–5-fold [4,5]. Therefore, breast density is an important factor to consider in order to identify women at high risk who may benefit from intensified or supplemental screening. Black women have lower breast density on average than White women when assessed visually by the radiologist [6,7]. This is partly due to the fact that Black women tend to have higher body mass index (BMI) than White women [8], resulting in a greater relative amount of fatty breast tissue leading to radiologists’ lower assessments of density levels. Advances in breast imaging and quantitative image analysis are enabling the development of novel breast density metrics that are more precise and reproducible than the radiologist visual assessment of density [9,10,11]. Our group has developed novel computational methods to measure breast density from breast images [9,10], and our previously published work found that Black women had higher breast density on digital mammography (DM) than White women when breast density was measured quantitatively and adjusted for BMI [6].
The mechanisms that underlie the association of breast density with higher breast cancer risk are poorly understood. Breast density is highly heritable, with family-based studies estimating that 50–70% of the variance in breast density is explained by genetics [12,13]. To date, 50 genetic loci have been associated with breast density, however, these studies have been performed among predominantly European ancestry populations [12,14,15]. Understanding genetic factors associated with breast density, particularly among Black women, may help in identifying mechanisms by which breast density increases breast cancer risk as well as mechanisms that contribute to racial disparities in breast cancer. In the current study, we performed a Genome-Wide Association Study (GWAS) to identify SNPs associated with quantitative area-based measures of breast density among Black women.

2. Materials and Methods

2.1. Study Data

We utilized a cohort of women aged 40–85 years who underwent mammography screening (Selenia or Selenia Dimensions; Hologic Inc, Marlborough, MA, USA) at the Hospital of the University of Pennsylvania from 1 September 2010 through 31 December 2014 and did not have a known BRCA1/2 mutation (N = 32,213 screening exams). We excluded screening exams with uncertain outcomes (N = 13), screenings preceded by a breast cancer diagnosis (N = 74), and true positive and false negative screening exams (N = 153). We additionally excluded screenings where a breast implant was present (N = 429), screenings for which all four processed (i.e., ‘FOR PRESENTATION’) DM views were unavailable (N = 406), and screenings for which breast density evaluation software failed (N = 808). Then, we removed screenings for women who did not consent to participate in the Penn Medicine BioBank (PMBB), a research biorepository where patients provide a blood sample and broadly consent to allow their biospecimens to be used for research purposes (N = 22,627). We excluded screenings for women without a genetically-informed genotype (N = 3718), and women who did not self-identify as Black or have an African ancestry genotype (N = 1803). From this pool of screening exams, we selected the earliest exam per person, resulting in 1348 individuals.
Women completed a breast cancer risk factor questionnaire at the time of mammography, from which reproductive factors, age, height, and weight were pulled. Body mass index (BMI) was calculated from self-reported height and weight, supplemented with electronic health record (EHR) data by using the nearest available measurement within 1 year prior to and 6 months after the date of screening. Implausible BMI values (<12 kg/m2 or >82 kg/m2) [16] were set to missing. Women were considered as postmenopausal if their menstrual periods had stopped or if they were over the age of 55. Patients still missing data on BMI, menopausal status, or age after this were excluded from the analysis (N = 15), resulting in a final study population of 1333 women.

2.2. Breast Density

Breast Imaging Reporting and Data System (BI-RADS) 4th or 5th edition breast density was obtained from the mammography report. For each mammogram, the publicly available “LIBRA” software (v1.0.4) was used to automatically quantify breast density [10,17]. Briefly, LIBRA partitions the breast region into density clusters of similar gray-level intensity, which are then aggregated into the final dense tissue segmentation. Summing the area of dense pixels provides total absolute dense area (DA), and normalizing DA by the total breast area gives area percent density. We used the dense area and area percent density estimates obtained from all mammography views available for each woman. A per-woman value of each density measure was generated by averaging the corresponding density estimates from all breast views. Since each view is only a 2D cross section of the breast, none of the views independently capture the true volume of density in the breast. By averaging estimates across each view and across breasts for each woman, we produce a more robust estimate of the actual density in the breast. Distributions of breast area, dense area, and area percent density were visually inspected, and observations that fell greater than 3 standard deviations above the mean were excluded (3 for breast area, 19 for dense area, and 27 for area percent density out of 1333).

2.3. Genome-Wide Association Study in Penn Medicine BioBank

We performed a GWAS on our cohort of 1333 women using PLINK 2.0 [18], a tool that employs a generalized linear regression model approach to association testing. We applied the following filters to the imputed PMBB data of the individuals: Excluded 189 individuals to remove relatedness, kept variants with Hardy–Weinberg equilibrium value greater than or equal to 10−6, and only kept variants with minor allele frequency greater than 0.01 [19,20]. The covariates used in the model were BMI, age, two principal components of genetic ancestry [21,22], and menopausal status (binary). Principal component analysis (PCA) was conducted using fast PCA approximation in EIGENSOFT package by projecting PCS on 1000 Genome population [23]. Supplementary Figure S1 shows PCA plot for PC1 and PC2 and scree plot showing proportion of variance explained by first 10 PCS to identify significant PCs to use as covariates in this study. For all GWAS results with a p-value of 10−5 or less, we used Biofilter [24,25] to annotate the variants with their nearest genes. To identify significant and suggestive loci, we applied the clumping parameter in PLINK, which involved identifying the lead single nucleotide polymorphism (SNP) within a 100 kilobase (KB) window of SNPs with a linkage disequilibrium (LD) threshold of R2 ≥ 0.2, as the SNP that represented each locus.

2.4. Functional Mapping

We used polyfun [26] for functionally informed fine-mapping. To define functional variants, we used ENSEMBL sequence annotations and epigenetic annotations from EpiMap breast tissue samples [27]. We made the annotations disjoint to optimize regression stability, prioritizing smaller categories. Hapmap SNPs were selected for the regression weights for the L2-regularized h2 step. For the fine-mapping step, we set a p-value threshold of 10−4 and a maximum number of causal variants of 10. Then, we searched for any variants with a posterior probability of greater than or equal to 0.5 for further annotation.

2.5. Transcriptome-Wide Association Study (TWAS)

We performed summary-based TWAS for area percent density and breast dense area [28]. The S-PrediXcan best practices workflow was used to impute expression levels based on GTEx [29] models and to test association in breast mammary tissue only.

2.6. GWAS-Catalog Lookup

We performed a lookup of all nominally significant SNPs and genome-wide significant genes identified from GWAS as described in Section 2.3 in the EMBL-EBI GWAS catalog (summary statistics downloaded on 1 October 2022) [30] to identify the known associations of SNPs and genes from our study with other phenotypes. We filtered the catalog results to associations with a reported p-value of no more than 5 × 10⁻⁸.

2.7. Correlation Analyses

We performed estimation of SNP-based heritability and genetic correlation between breast density traits, age, BMI, and menopause status using GCTA’s Haseman–Elston’s regression approach [31,32]. Additionally, we compared effect sizes and MAF for significant variants from recently published breast density GWAS in European ancestry population [14] with estimates from GWAS in our study of African ancestry participants only.

3. Results

The characteristics of the study population (N = 1333) are displayed in Table 1 and compared with the total underlying cohort. The average age at screening was 56.7, most patients were postmenopausal (72.2%), and just over 12% had a family history of breast cancer. Based on radiologist-rated BI-RADS density, 18% had heterogeneously dense breasts and 0.5% had extremely dense breasts. The mean area percent density was 22.5% (SD 11.1%).

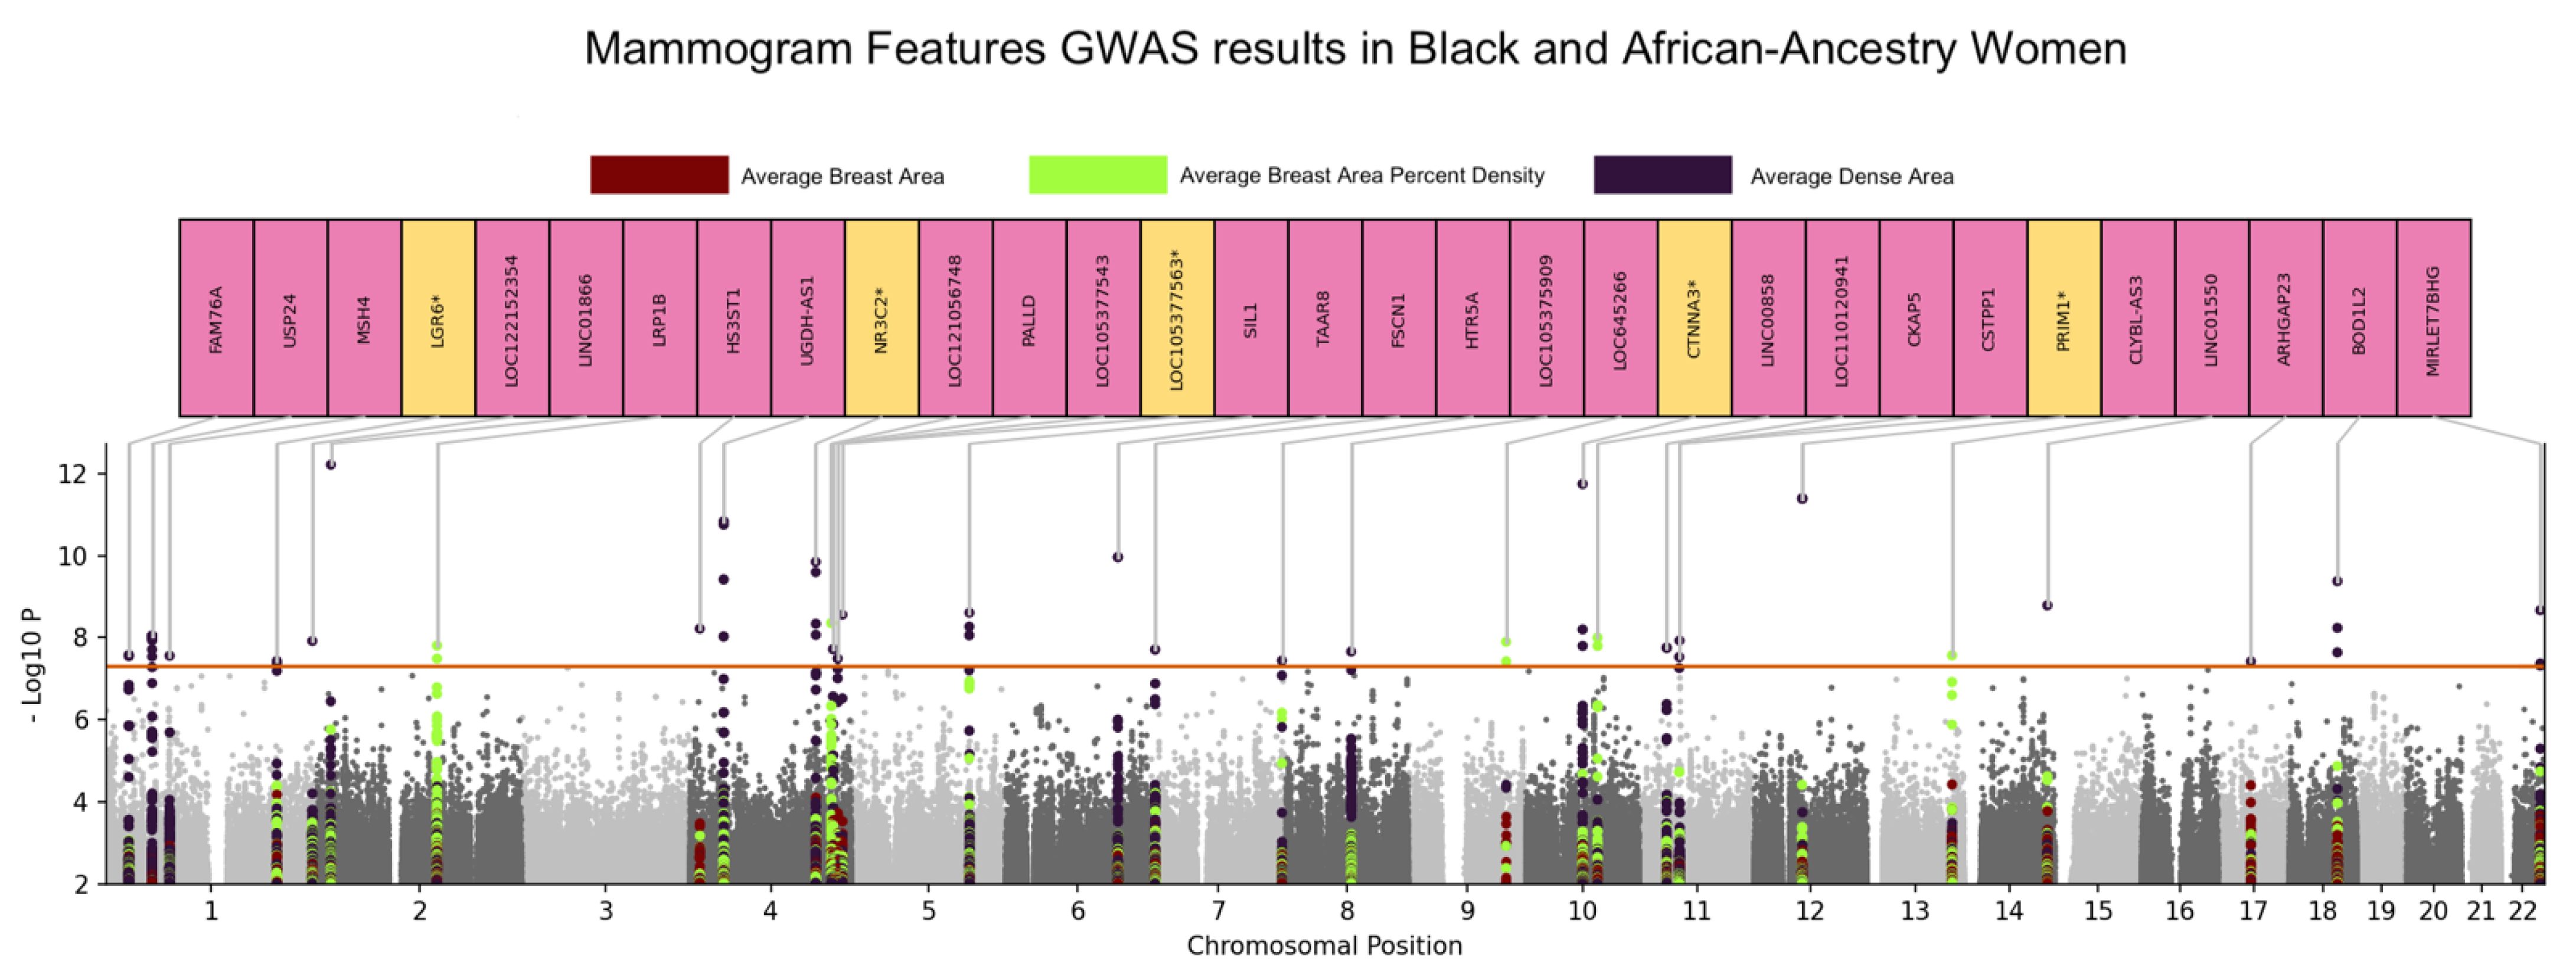
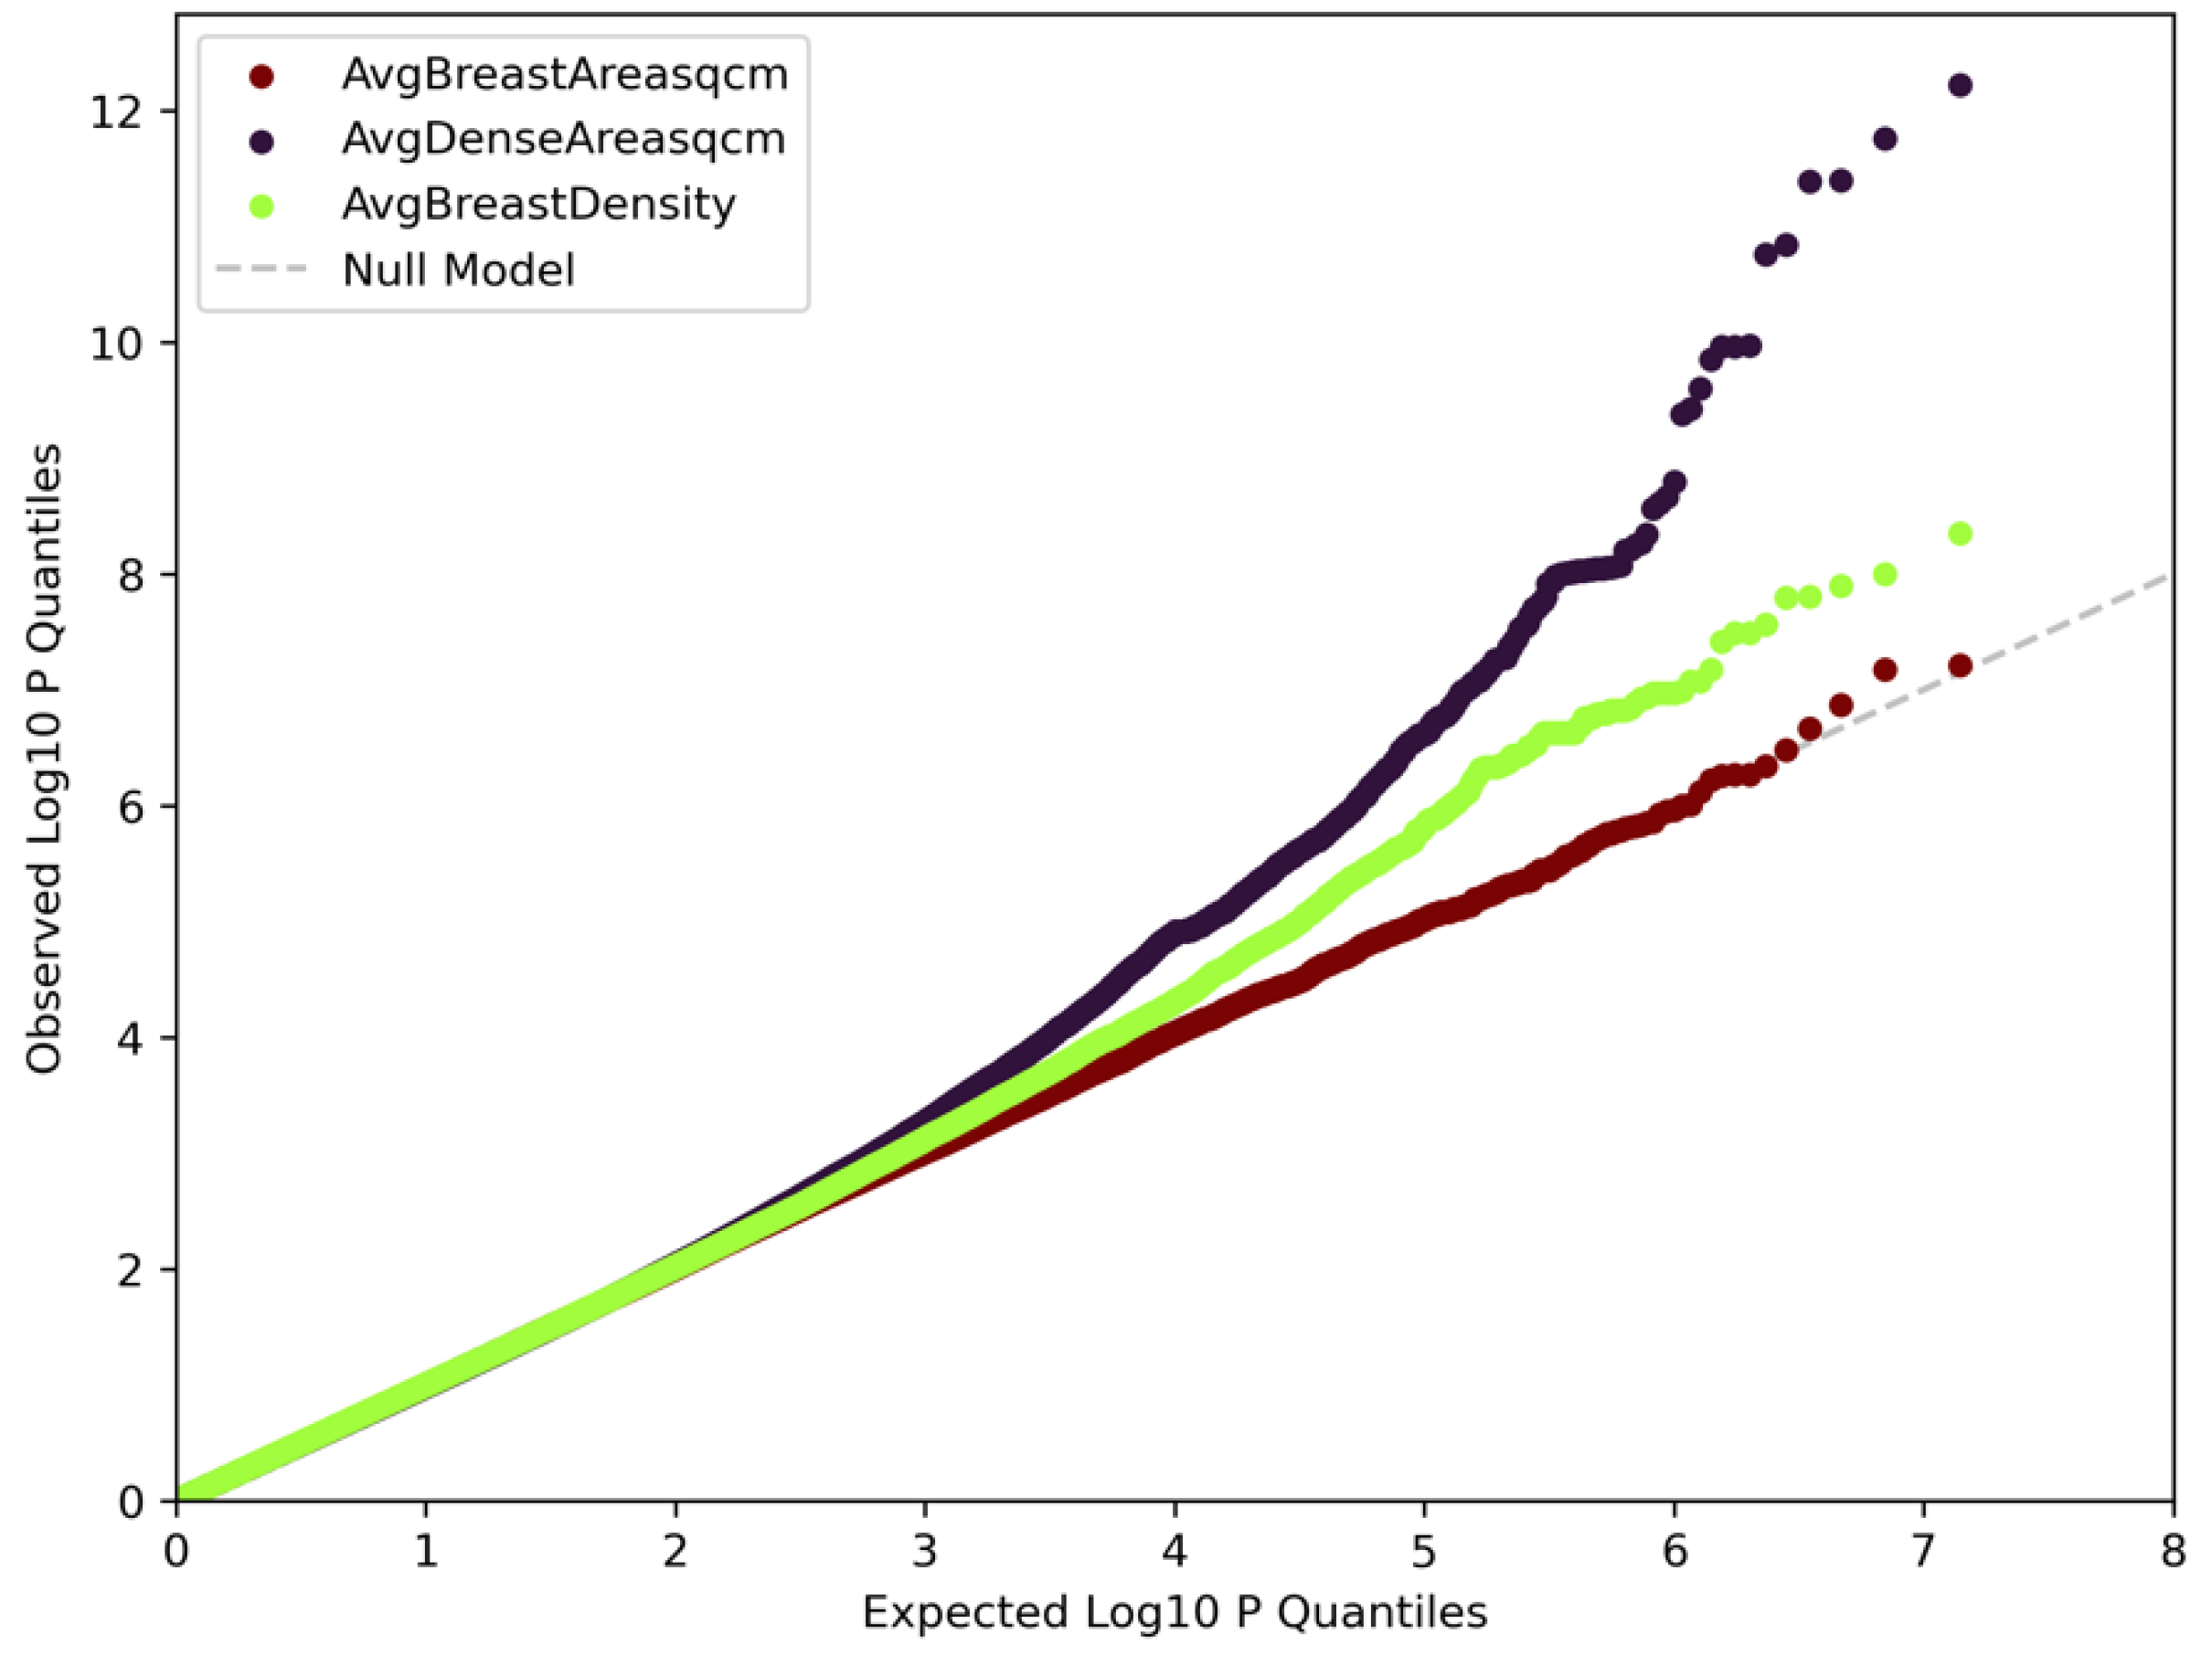
3.1. Genome-Wide Association Analyses

In our quantitative GWAS consisting of women of African ancestry and/or identifying as Black, we discovered sixty-five significant hits consisting of twenty-nine independent loci (p < 5 × 10⁻⁸) for dense area and nine significant SNPs consisting of five independent loci for area percent density, as shown in Table 2 and Figure 1. No genome-wide significant associations for breast area were identified.
The strongest signals were in genes GACAT3 (p = 6.06 × 10⁻¹³), CTNNA3 (p = 1.76 × 10⁻¹²), HSD17B6 (p = 4.02 × 10⁻¹²), UGDH (p-value = 1.45 × 10⁻¹¹), TAAR8 (p = 1.08 × 10⁻¹⁰), ARHGAP10 (p-value = 1.40 × 10⁻¹⁰), BOD1L2 (p = 4.17 × 10⁻¹⁰), and NR3C2 (p = 4.68 × 10⁻¹⁰). Two of these genes, CTNNA3 [33] and PRIM1 [34], have been previously associated with breast cancer. Variants in genes LRP1B (p = 1.56 × 10⁻⁸), TLL1/SPOCK3 (p = 4.41 × 10⁻⁹), DELEC1 (p = 3.84 × 10⁻⁸), LINC00858 (p = 1.01 × 10⁻⁸), CCSER2 (p = 1.59 × 10⁻⁸), and ZIC5 (p-value = 2.71 × 10⁻⁸) were associated with area percent density. We mapped all SNPs with p-value < 1 × 10⁻⁵ to the closest genes (Figure 1). This identified thirty-one unique genes, of which five have previously been associated with breast cancer (LGR6, NR3C2, LOC105377563, CTNNA3, PRIM1). None of these genes have been previously associated with breast density.
Complete summary statistics for all loci at suggestive p-value threshold of 1 × 10⁻⁵ are reported in Supplementary Table S1. Our results identified 60 unique loci that have been previously associated with breast cancer and replicated 13 genes that have been associated with breast density in other studies [12,14,15]. Quantile–quantile plots for area percent density, dense area, and breast area GWAS are displayed in Figure 2. The genomic inflation factor for area percent density was 1.01, dense area was 1.002, and breast area was 1.004, indicating little evidence of systematic error, such as population stratification.

3.2. Functional Mapping

Seventeen variants for breast density and eighteen variants for dense area are identified through fine-mapping at posterior probability >0.98. Among the fine-mapped results are the variants mapped to Enhancer regions on genes, such as KIFC3, CNGB1, and heterochromatin regions on genes PDE10A and KIFC3, as shown in Table 3.

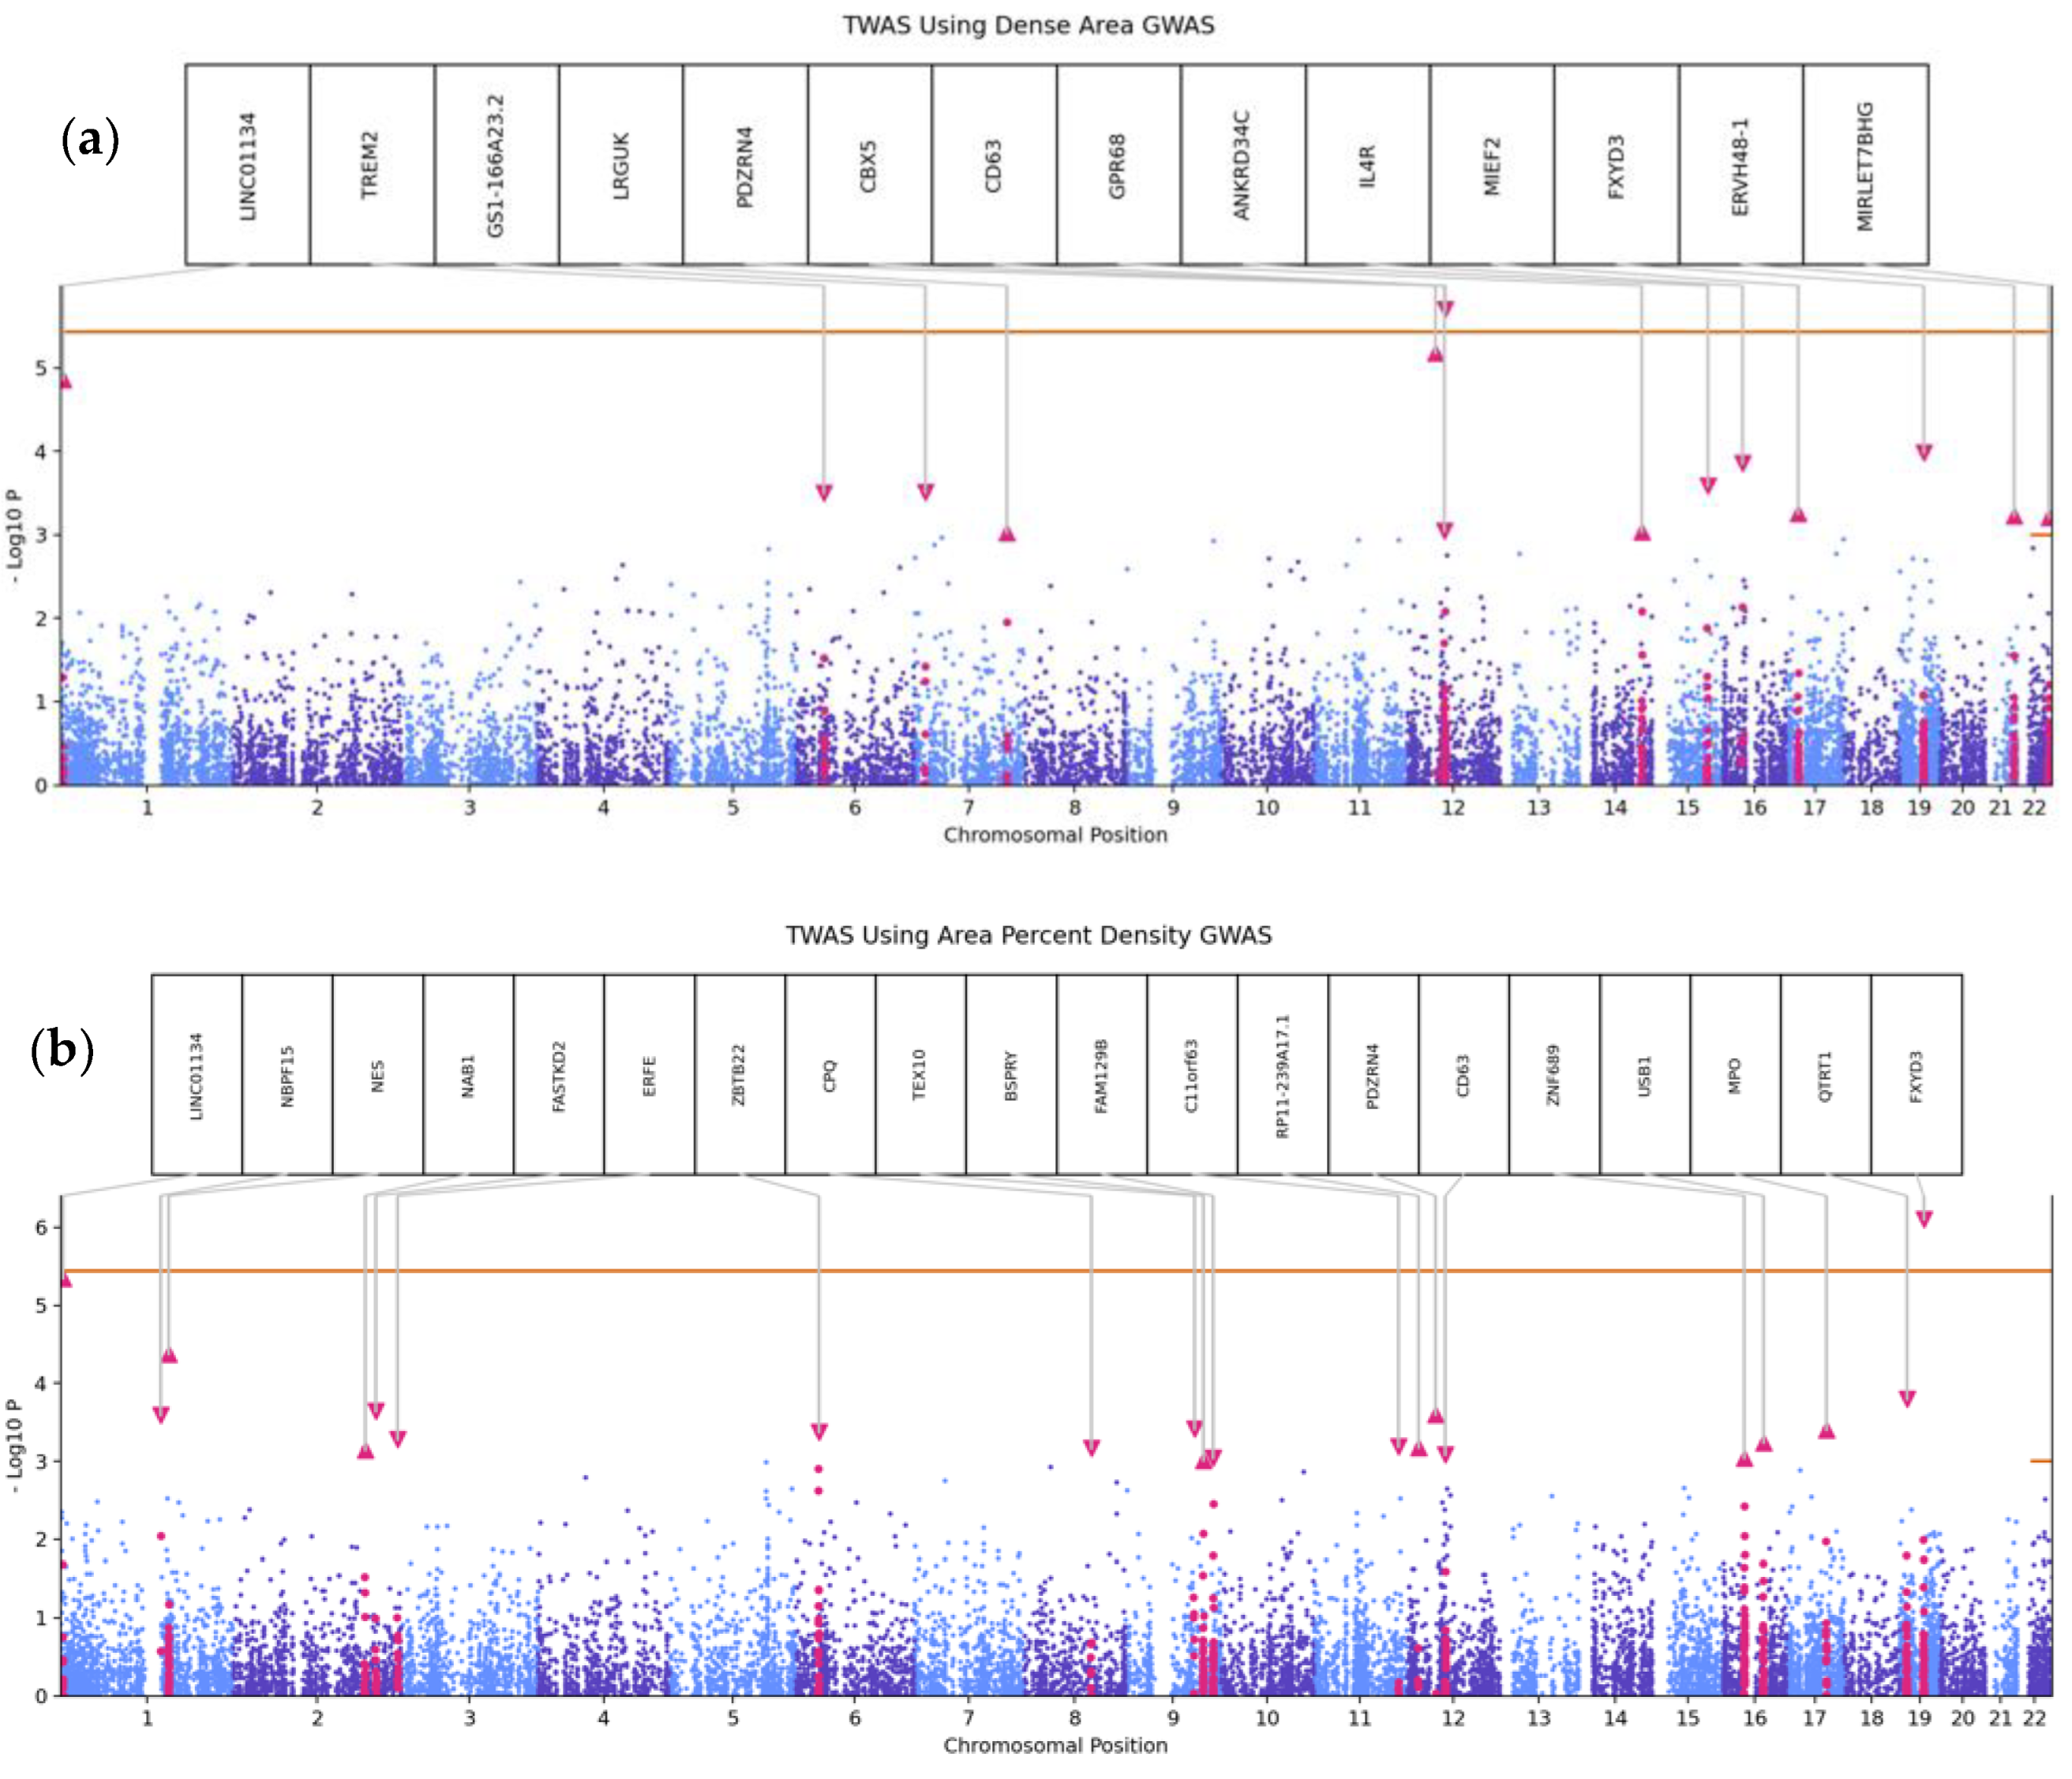
3.3. Transcriptome-Wide Association Analyses

For each breast tissue TWAS, 14k genes were tested; therefore, the corrected p-value threshold is 3.6 × 10⁻⁶. Genes with a p-value of less than or equal to 1 × 10⁻³ are highlighted in the TWAS plots (Figure 3). Supplementary Table S2 contains summary statistics from TWAS analyses. For dense area, one variant on chromosome 12 (rs1877183750) maps to PRIM1 gene in dense area GWAS and is associated with expression of CD63 (p = 1.9 × 10⁻⁶, Z = −4.75, Figure 3a). For area percent density, one variant on chromosome 19 (chr19:35115879) is associated with expression of FXYD3 (p = 7.8 × 10⁻⁷, Z = −4.93, Figure 3b). CD63 [35,36,37,38,39], PRIM1 [34], and FXYD3 [40,41] have been previously implicated in breast cancer.

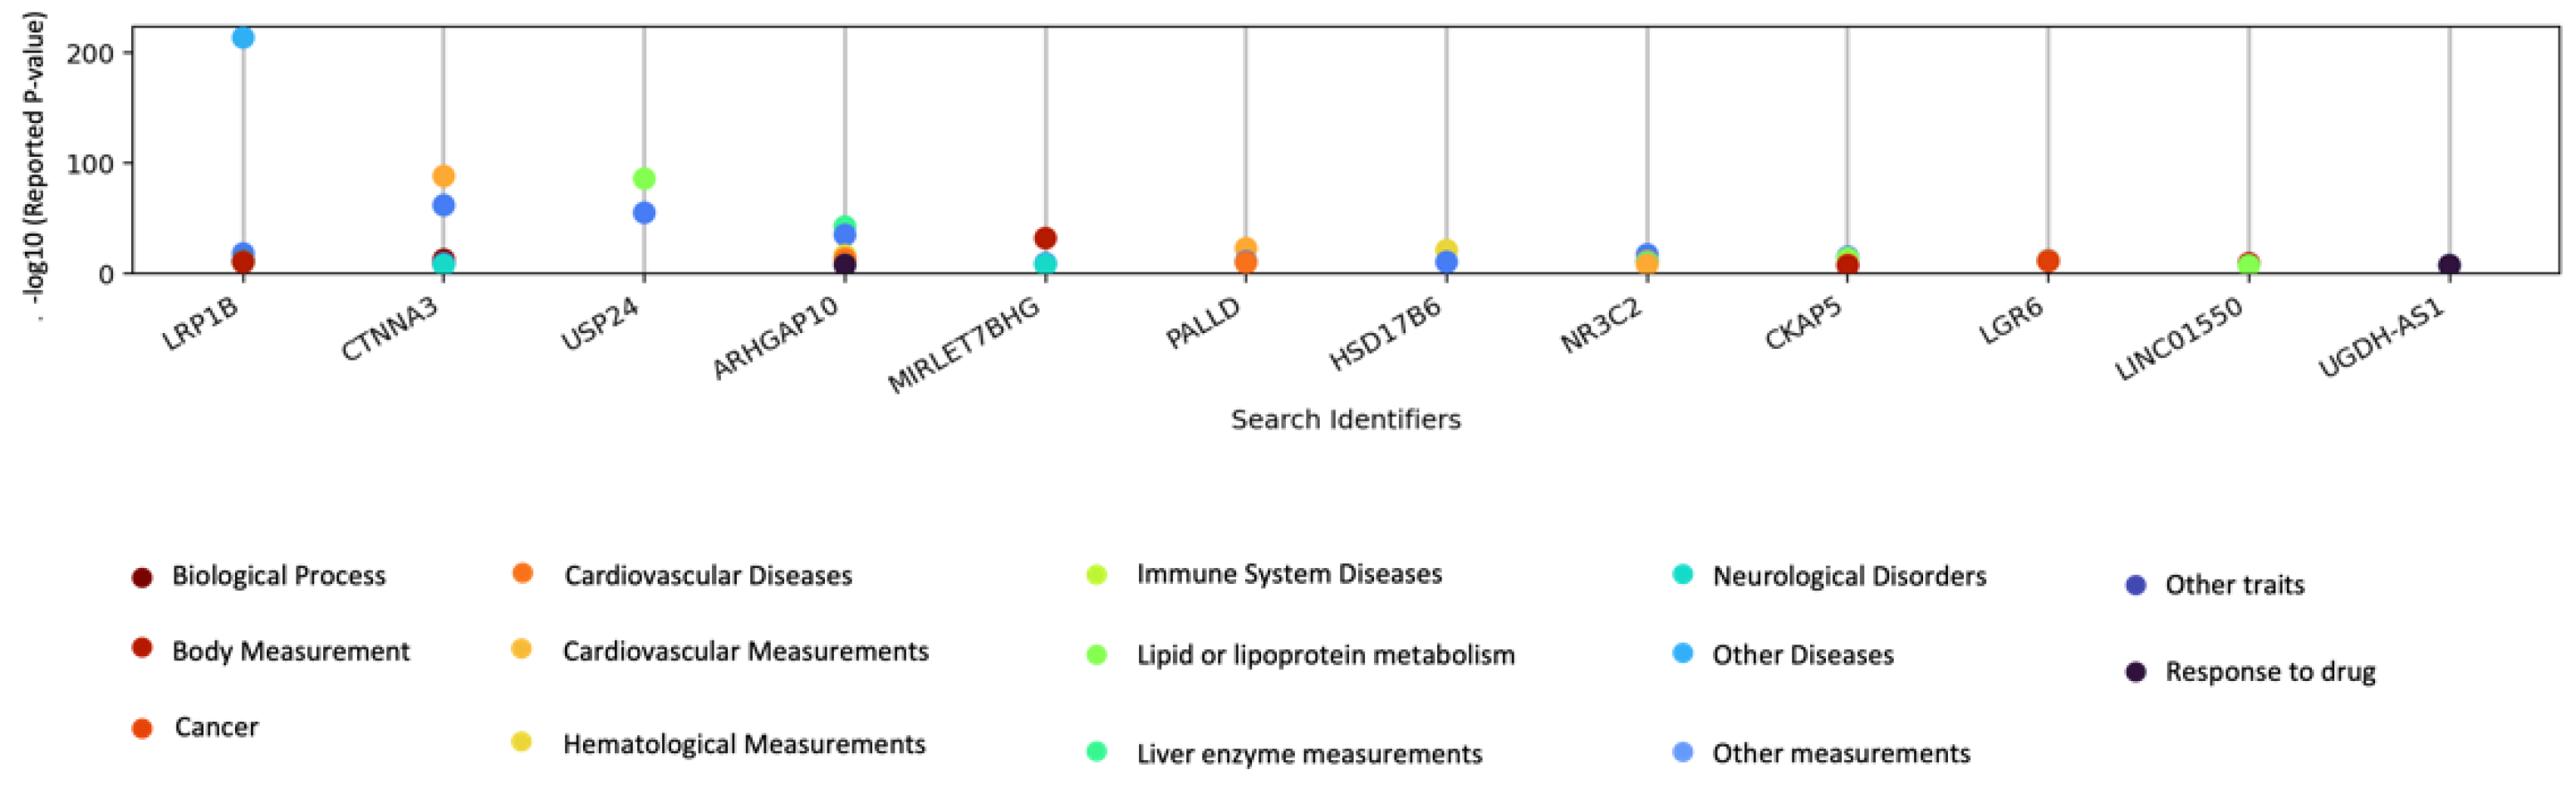
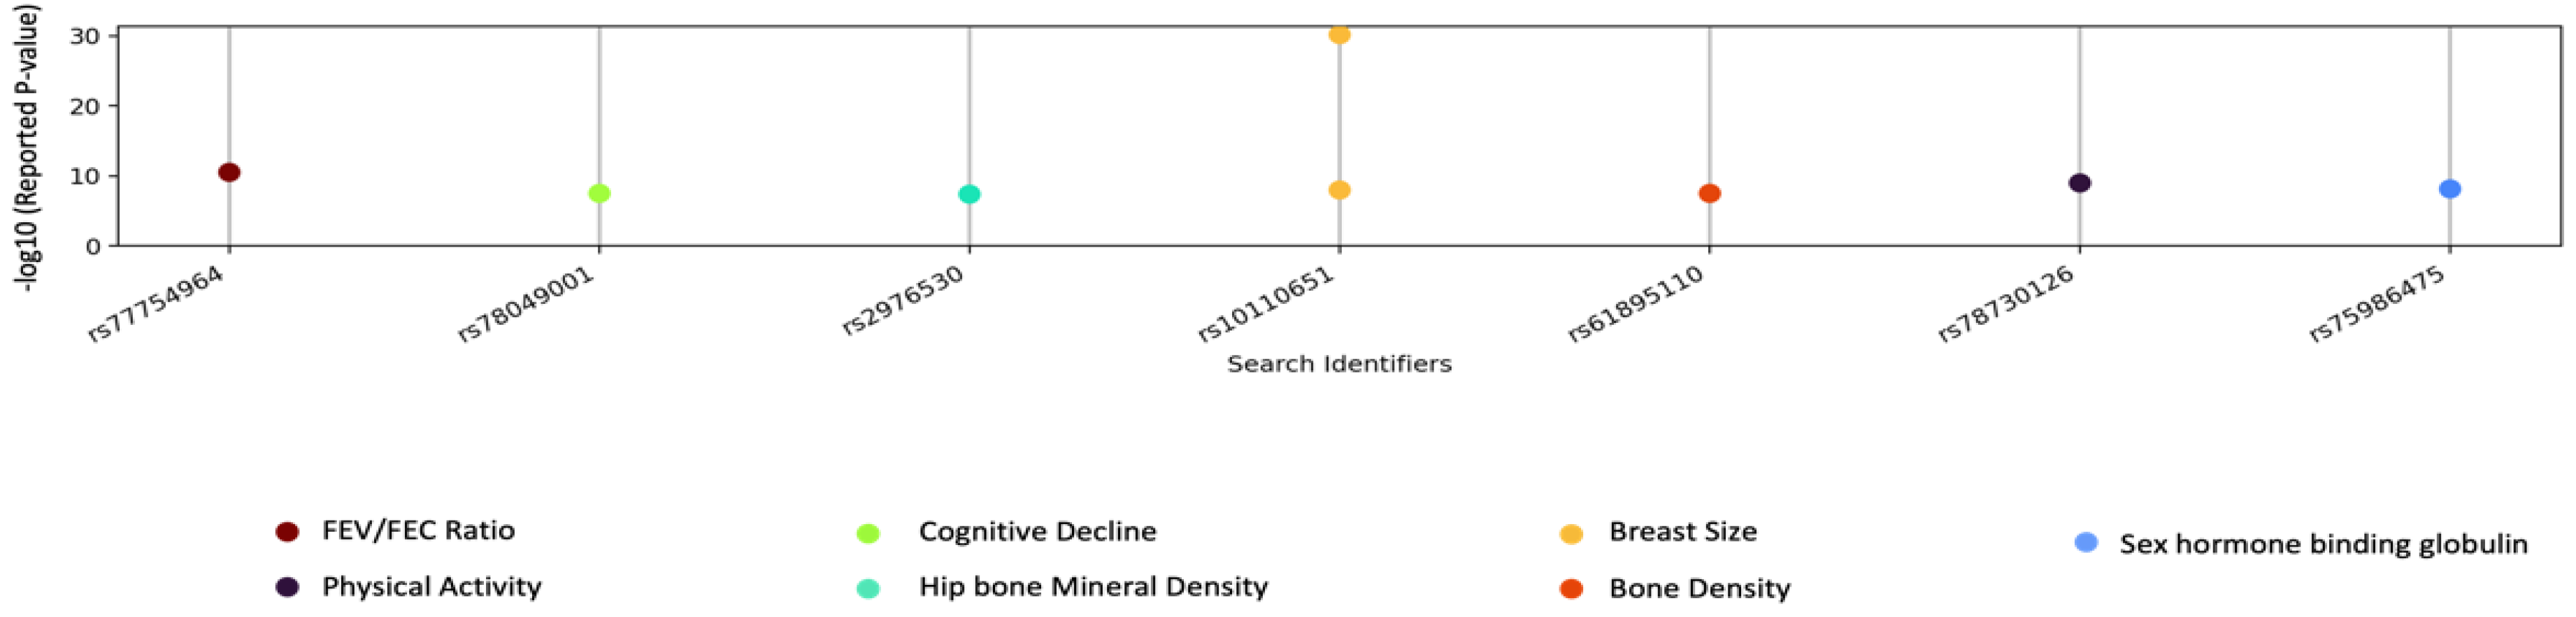
3.4. GWAS Catalog Lookups

In the EMBL-EBI GWAS catalog, we found many traits that had reported associations with the genes (Supplementary Table S3) that were found to be significantly associated with area percent density and dense area. Traits associated with three genes were cardiovascular diseases, lipid measurements, immune system diseases, body mass index, and response to drugs. All traits shown in Figure 4 were associated with at least two genes.
Our set of suggestive SNPs from all three GWAS (p < 1 × 10⁻⁵) was reduced to only eight SNPs when we looked for an overlap with reported associations in the GWAS catalog, as shown in Figure 5. One SNP was associated with breast size (rs10110651), rs61895110 was associated with bone density, and rs77754964 was associated with FEV/FEC ratio (measurement of forced expiratory volume). Other SNP-trait pairings are: rs78049001, cognitive decline; rs2976530, hip bone mineral density; rs75986475, physical activity; rs78730126, sex hormone binding globulin measurement.

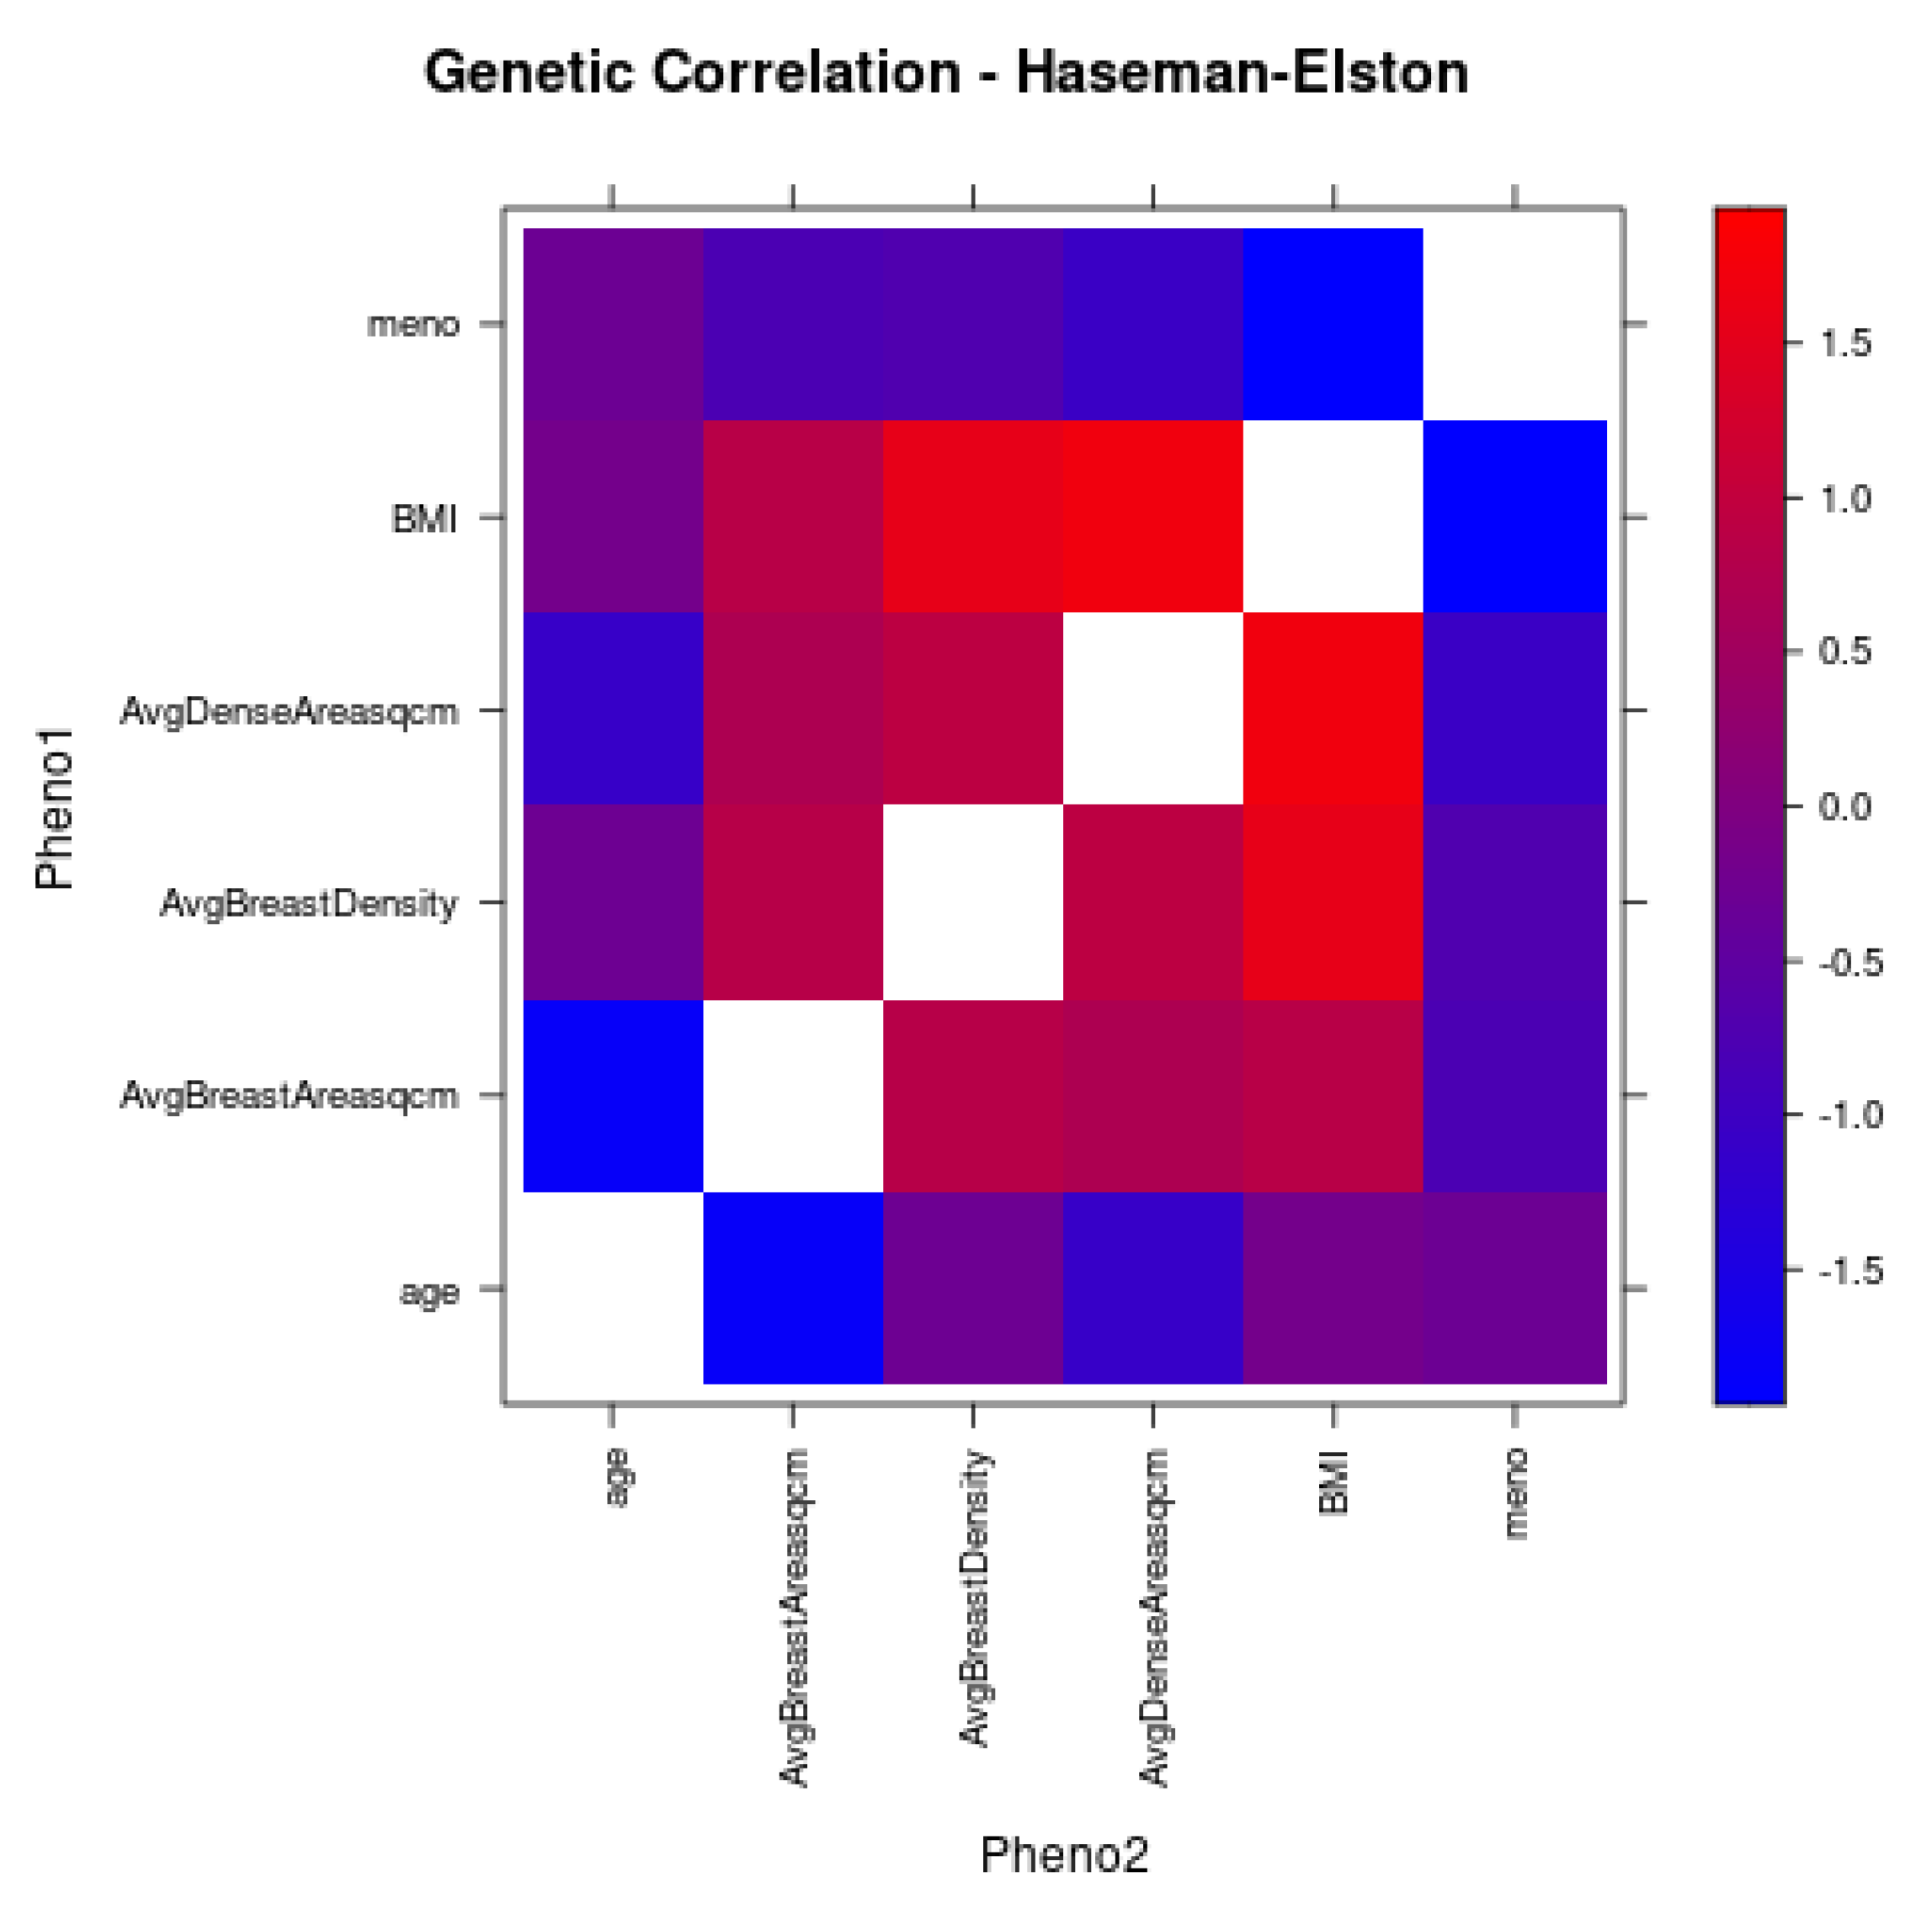
3.5. Correlation Analyses

Genetic correlation among the breast density traits evaluated in this study are shown in Figure 6. The results suggest positive correlation between all breast density traits. Positive correlation was also observed between BMI and the three breast density traits. However, a negative correlation is observed between BMI and menopause status. Genetic correlation between menopause status and breast density traits was close to 0.

3.6. Comparison among EUR and AFR Breast Density GWAS

We compared our results with effect estimates and significance reported in a recently published breast density GWAS for 27,900 European ancestry individuals [14] (Table 4). Two SNPs identified as genome-wide significant in EUR ancestry study were significant at p-value < 0.001 in our analyses (rs16885613 and rs10087804).

4. Discussion

To our knowledge, ours is the first GWAS of quantitative breast density measurements performed among women of African ancestry. Among 1333 women, we measured dense area and area percent density from digital mammograms using a validated software algorithm and found sixty-five variants in twenty-nine genes associated with dense area and nine variants in five genes associated with area percent density. Our results highlight the potential value of examining SNPs associated with breast density among women of African ancestry, emphasizing the need for diverse ancestry analyses to better understand the genetic underpinnings of breast density and its impact on breast cancer risk in underrepresented populations.
Of the loci identified in this study, 13 of these regions had been previously identified as associated with breast density in studies of European ancestry populations [12,14,15]. Fifty-seven loci had previously been identified as associated with breast cancer risk among European ancestry populations [42], and three had previously been associated with breast cancer risk among African ancestry populations [43].
Several of the identified SNPs and genes have potentially plausible mechanistic connections to breast density and breast cancer risk. Two SNPs were identified with genome-wide significance in CTNNA3, catenin alpha 3, which encodes a protein involved in cell–cell adhesion in muscle cells. CTNNA3 was previously identified in breast cancer GWAS [33]. Alpha and beta catenins have been implicated in cancer cell metastasis [44]. Additionally, prior African ancestry GWAS found CTNNA3 to be associated with metabolic syndrome. This is interesting given the observed differences in breast density by BMI levels [6]. In addition, we identified a variant within a gene encoding another alpha catenin, CTNNA1, which has recently been categorized as a predisposition gene for Hereditary Diffuse Gastric Cancer [45]. Furthermore, loss of function mutations have been identified among breast cancer patients undergoing multigene panel testing [46]. Together, these findings suggest further research on the role of alpha catenins in both breast density as well as breast cancer risk.
HSD17B6, hydroxysteroid 17-beta dehydrogenase 6, is involved in androgen catabolism and has been implicated in polycystic ovarian syndrome (PCOS) [47], including metabolic perturbations correlated with PCOS, including increased BMI, fasting insulin, and insulin resistance [48]. LRP1B encodes a member of the low density lipoprotein (LDL) receptor family, which has been implicated in both metabolic phenotypes [49] and several cancers [50]. GACAT3, gastric cancer associated transcript 3 is a long non-coding RNA that has been previously implicated in gastric and other cancers, with high expression observed in breast cancer tissue [51] and correlated with prognosis among breast cancer patients [52].
Fine-mapping results include the heterochromatin region of the phosphodiesterase 10A (PDE10A). PDEs have oncogenic effects, and several preclinical studies have shown that inhibition of PDEs has an anti-tumor effect [53]. A recent study demonstrated that inhibition of PDE10A decreased cell proliferation, induced cell cycle arrest, and increased apoptosis in ovarian cancer cells [53]. Kinesin family member C3 (KIFC3) encodes a member of the kinesin-14 family of microtubule motors. These motor proteins attach to microtubules and move along them to transport cellular cargo. Overexpression of KIFC3 was shown to be associated with resistance to docetaxel in breast cancer cell lines [54]. SH3GL3 has been implicated as a tumor suppressor in glioblastoma and lung cancer, as well as in cell migration and invasion in myeloma, and has been previously identified in colorectal cancer GWAS associated with colorectal cancer [55].
Exploratory TWAS identified two loci associated with dense area and percent density, CD63/PRIM1 and FXYD3. CD63 encodes a membrane protein of lysosomes [38] and glycosylation of this protein has been shown to affect breast carcinogenesis [35,36,37,38]. In addition, CD63 was identified when machine learning was applied to GWAS data with respect to radiation-associated contralateral breast cancer [39]. PRIM1, which encodes DNA primase polypeptide 1, has been found to be overexpressed in breast tumors [34]. The observed association with PRIM1 may also be explained by the fact that PRIM1 is associated with age at menopause, and breast density is known to decrease following menopause [56]. FXYD3, an mRNA also known as Mat-8 (Mammary tumor 8 kDa), is highly expressed in breast cancers [40] and has been shown to regulate breast cancer stem cells [41].
Despite the modest sample size, our study identified novel SNPs with plausible mechanistic connections to both breast density and breast cancer risk. Breast density was measured quantitatively using an automated algorithm with high accuracy. In addition, breast density is known to be highly heritable. In combination, the continuous quantitative trait and the high heritability may have resulted in the ability to detect moderate-to-large associations despite a relatively small sample size. However, the small sample size limits our ability to detect more modest associations. Therefore, replication in larger populations of African ancestry populations and meta-analyses are warranted to increase statistical power to detect additional SNPs with more modest associations with breast density.
Given that the biological underpinnings of breast density are poorly understood, further investigation of our findings may help in identifying pathways relevant for breast density development as well as the mechanistic relationship between breast density and breast cancer risk. In this study, we investigated the overlap between our top-associated variants and those reported in previous studies of breast cancer and other related traits. We believe that this integrative approach can help in shedding light on the underlying biology of breast density and its relationship to breast cancer risk. Future research is needed to validate our preliminary findings and further explore the functional implications of the identified genetic variants.
Our study highlights the value of exploring the genetic factors associated with breast density among African ancestry populations, providing proof-of-concept that additional SNPs relevant to breast density may be identified through expanding the diversity of GWAS studies. Furthermore, a strength of our study is its use of quantitative measures of breast density, which have been shown to be strongly correlated to breast cancer risk [9,10] and more objective and reproducible than radiologist-rated breast density [11]. Despite these strengths, our sample size was small, and therefore results will need validation in larger studies. Furthermore, novel fully volumetric methods derived from digital breast tomosynthesis, or 3D mammograms, may provide even more precise quantification of dense breast tissue enabling even greater power to detect associations with genetic factors.

5. Conclusions

We report the first GWAS of breast density among women of African ancestry, in which we identified novel SNPs associated with quantitative breast density measures, many of which had been previously identified as associated with breast cancer. Our results mark the beginning of the study of breast density among African ancestry populations and provide hypothesis generating findings that may help in clarifying the biology of both breast density and breast cancer.

Supplementary Materials

The following supporting information can be downloaded at: https://www.mdpi.com/article/10.3390/cancers15102776/s1. Penn Medicine Biobank Author list and contributions; Figure S1: Principal components analysis of ancestry informative markers; Table S1: GWAS results for p-value < 1 × 10⁻⁵.; Table S2: Transcriptome wide association study results for breast tissue at p-value < 1 × 10⁻³; Table S3: GWAS catalog lookup results.

Author Contributions

Conceptualization, A.M.M., S.S.V. and D.K.; methodology, A.M.M. and S.S.V.; software, D.K.; formal analysis, S.S.V. and L.G.; investigation, A.M.M., S.S.V., L.G., S.E., A.G., G.S., M.D.R. and D.K.; resources, D.K., M.D.R. and Penn Medicine Biobank; data curation, S.E., S.S.V., A.G., L.G., G.S. and Penn Medicine Biobank; writing—original draft preparation, A.M.M. and S.S.V.; writing—review and editing, L.G., S.E., A.G., G.S., D.K. and M.D.R.; visualization, L.G. and S.S.V.; supervision, A.M.M., S.S.V., D.K., M.D.R. and Penn Medicine Biobank; project administration, S.E. and Penn Medicine Biobank; funding acquisition, D.K., M.D.R., A.M.M., S.S.V. and Penn Medicine Biobank. All authors have read and agreed to the published version of the manuscript.

Funding

This research was funded by The Center for Global Genomics and Health Equity at the University of Pennsylvania, grant number GGHE-KP-2022-002. The PMBB is supported by Perelman School of Medicine at University of Pennsylvania, a gift from the Smilow family, and the National Center for Advancing Translational Sciences of the National Institutes of Health under CTSA, award number UL1TR001878. A.M.M. is supported by a grant from the American Cancer Society MSRG-17-144-01-CCE. D.K. and development of the density measurement methods were supported by NIH/NCI 5R01CA161749. The content is solely the responsibility of the authors and does not necessarily represent the official views of the NIH.

Institutional Review Board Statement

The study was conducted in accordance with the Declaration of Helsinki, and approved by the Institutional Review Board of the University of Pennsylvania (protocol code 842712 and date of approval 10 April 2020).

Informed Consent Statement

Informed consent for use of genetic information was obtained from all subjects involved in the study.

Data Availability Statement

The data presented in this study are available on request from the corresponding author. The data are not publicly available due to privacy considerations.

Acknowledgments

We thank the patient-participants of Penn Medicine who consented to participate in this research program. We acknowledge the efforts of the PMBB staff (a full list of contributors is provided in the supplement). We thank the outstanding Penn Medicine Corporate IS team (Jessica Chen, Christine Vanzandbergen, Jeffrey Landgraf, Colin Wollack, Ned Haubein) for its major efforts to implement e-consenting in the EHR as well as biospecimen acquisition and tracking. We thank the Regeneron Genetics Center for partnership in generating genetic variant data and for scientific interactions. We thank the Smilow family for their generous gift that made the launch of the PMBB possible.

Conflicts of Interest

The authors declare no conflict of interest.

References

  1. DeSantis, C.E.; Miller, K.D.; Goding Sauer, A.; Jemal, A.; Siegel, R.L. Cancer statistics for African Americans. CA Cancer J. Clin. 2019, 69, 211–233. [Google Scholar] [CrossRef] [PubMed]
  2. Howlader, N.; Altekruse, S.F.; Li, C.I.; Chen, V.W.; Clarke, C.A.; Ries, L.A.; Cronin, K.A. US incidence of breast cancer subtypes defined by joint hormone receptor and HER2 status. J. Natl. Cancer Inst. 2014, 106, dju055. [Google Scholar] [CrossRef] [PubMed]
  3. Kohler, B.A.; Sherman, R.L.; Howlader, N.; Jemal, A.; Ryerson, A.B.; Henry, K.A.; Boscoe, F.P.; Cronin, K.A.; Lake, A.; Noone, A.M.; et al. Annual Report to the Nation on the Status of Cancer, 1975–2011, Featuring Incidence of Breast Cancer Subtypes by Race/Ethnicity, Poverty, and State. J. Natl. Cancer Inst. 2015, 107, djv048. [Google Scholar] [CrossRef] [PubMed]
  4. Pettersson, A.; Graff, R.E.; Ursin, G.; Santos Silva, I.D.; McCormack, V.; Baglietto, L.; Vachon, C.; Bakker, M.F.; Giles, G.G.; Chia, K.S.; et al. Mammographic density phenotypes and risk of breast cancer: A meta-analysis. J. Natl. Cancer Inst. 2014, 106, dju078. [Google Scholar] [CrossRef] [PubMed]
  5. Bond-Smith, D.; Stone, J. Methodological Challenges and Updated Findings from a Meta-analysis of the Association between Mammographic Density and Breast Cancer. Cancer Epidemiol. Biomark. Prev. 2019, 28, 22–31. [Google Scholar] [CrossRef]
  6. McCarthy, A.M.; Keller, B.M.; Pantalone, L.M.; Hsieh, M.K.; Synnestvedt, M.; Conant, E.F.; Armstrong, K.; Kontos, D. Racial Differences in Quantitative Measures of Area and Volumetric Breast Density. J. Natl. Cancer Inst. 2016, 108, djw104. [Google Scholar] [CrossRef] [PubMed]
  7. Bissell, M.C.S.; Kerlikowske, K.; Sprague, B.L.; Tice, J.A.; Gard, C.C.; Tossas, K.Y.; Rauscher, G.H.; Trentham-Dietz, A.; Henderson, L.M.; Onega, T.; et al. Breast Cancer Population Attributable Risk Proportions Associated with Body Mass Index and Breast Density by Race/Ethnicity and Menopausal Status. Cancer Epidemiol. Biomark. Prev. 2020, 29, 2048–2056. [Google Scholar] [CrossRef] [PubMed]
  8. Li, M.; Gong, W.; Wang, S.; Li, Z. Trends in body mass index, overweight and obesity among adults in the USA, the NHANES from 2003 to 2018: A repeat cross-sectional survey. BMJ Open 2022, 12, e065425. [Google Scholar] [CrossRef]
  9. Gastounioti, A.; Kasi, C.D.; Scott, C.G.; Brandt, K.R.; Jensen, M.R.; Hruska, C.B.; Wu, F.F.; Norman, A.D.; Conant, E.F.; Winham, S.J.; et al. Evaluation of LIBRA Software for Fully Automated Mammographic Density Assessment in Breast Cancer Risk Prediction. Radiology 2020, 296, 24–31. [Google Scholar] [CrossRef]
  10. Keller, B.M.; Chen, J.; Daye, D.; Conant, E.F.; Kontos, D. Preliminary evaluation of the publicly available Laboratory for Breast Radiodensity Assessment (LIBRA) software tool: Comparison of fully automated area and volumetric density measures in a case-control study with digital mammography. Breast Cancer Res. 2015, 17, 117. [Google Scholar] [CrossRef]
  11. Sprague, B.L.; Conant, E.F.; Onega, T.; Garcia, M.P.; Beaber, E.F.; Herschorn, S.D.; Lehman, C.D.; Tosteson, A.N.; Lacson, R.; Schnall, M.D.; et al. Variation in Mammographic Breast Density Assessments Among Radiologists in Clinical Practice: A Multicenter Observational Study. Ann. Intern. Med. 2016, 165, 457–464. [Google Scholar] [CrossRef] [PubMed]
  12. Brand, J.S.; Humphreys, K.; Li, J.; Karlsson, R.; Hall, P.; Czene, K. Common genetic variation and novel loci associated with volumetric mammographic density. Breast Cancer Res. 2018, 20, 30. [Google Scholar] [CrossRef] [PubMed]
  13. Holowko, N.; Eriksson, M.; Kuja-Halkola, R.; Azam, S.; He, W.; Hall, P.; Czene, K. Heritability of Mammographic Breast Density, Density Change, Microcalcifications, and Masses. Cancer Res. 2020, 80, 1590–1600. [Google Scholar] [CrossRef]
  14. Chen, H.; Fan, S.; Stone, J.; Thompson, D.J.; Douglas, J.; Li, S.; Scott, C.; Bolla, M.K.; Wang, Q.; Dennis, J.; et al. Genome-wide and transcriptome-wide association studies of mammographic density phenotypes reveal novel loci. Breast Cancer Res. BCR 2022, 24, 27. [Google Scholar] [CrossRef] [PubMed]
  15. Sieh, W.; Rothstein, J.H.; Klein, R.J.; Alexeeff, S.E.; Sakoda, L.C.; Jorgenson, E.; McBride, R.B.; Graff, R.E.; McGuire, V.; Achacoso, N.; et al. Identification of 31 loci for mammographic density phenotypes and their associations with breast cancer risk. Nat. Commun. 2020, 11, 5116. [Google Scholar] [CrossRef] [PubMed]
  16. Centers for Disease Control and Prevention. National Health and Nutrition Examination Survey: 2011–2012 Data Documentation, Codebook, and Frequencies. U.S. Department of Health and Human Services, Centers for Disease Control and Prevention, 2013; Updated 2015. Available online: https://wwwn.cdc.gov/nchs/nhanes/search/datapage.aspx?Component=Examination&CycleBeginYear=2011 (accessed on 22 June 2021).
  17. Keller, B.M.; Nathan, D.L.; Wang, Y.; Zheng, Y.; Gee, J.C.; Conant, E.F.; Kontos, D. Estimation of breast percent density in raw and processed full field digital mammography images via adaptive fuzzy c-means clustering and support vector machine segmentation. Med. Phys. 2012, 39, 4903–4917. [Google Scholar] [CrossRef]
  18. Purcell, S.; Neale, B.; Todd-Brown, K.; Thomas, L.; Ferreira, M.A.; Bender, D.; Maller, J.; Sklar, P.; de Bakker, P.I.; Daly, M.J.; et al. PLINK: A tool set for whole-genome association and population-based linkage analyses. Am. J. Hum. Genet. 2007, 81, 559–575. [Google Scholar] [CrossRef]
  19. Wigginton, J.E.; Cutler, D.J.; Abecasis, G.R. A note on exact tests of Hardy-Weinberg equilibrium. Am. J. Hum. Genet. 2005, 76, 887–893. [Google Scholar] [CrossRef]
  20. Truong, V.Q.; Woerner, J.A.; Cherlin, T.A.; Bradford, Y.; Lucas, A.M.; Okeh, C.C.; Shivakumar, M.K.; Hui, D.H.; Kumar, R.; Pividori, M.; et al. Quality Control Procedures for Genome-Wide Association Studies. Curr. Protoc. 2022, 2, e603. [Google Scholar] [CrossRef]
  21. Southern, J.A.; Young, D.F.; Heaney, F.; Baumgartner, W.K.; Randall, R.E. Identification of an epitope on the P and V proteins of simian virus 5 that distinguishes between two isolates with different biological characteristics. J. Gen. Virol. 1991, 72, 1551–1557. [Google Scholar] [CrossRef]
  22. Price, A.L.; Patterson, N.J.; Plenge, R.M.; Weinblatt, M.E.; Shadick, N.A.; Reich, D. Principal components analysis corrects for stratification in genome-wide association studies. Nat. Genet. 2006, 38, 904–909. [Google Scholar] [CrossRef] [PubMed]
  23. Galinsky, K.J.; Bhatia, G.; Loh, P.R.; Georgiev, S.; Mukherjee, S.; Patterson, N.J.; Price, A.L. Fast Principal-Component Analysis Reveals Convergent Evolution of ADH1B in Europe and East Asia. Am. J. Hum. Genet. 2016, 98, 456–472. [Google Scholar] [CrossRef]
  24. Bush, W.S.; Dudek, S.M.; Ritchie, M.D. Biofilter: A knowledge-integration system for the multi-locus analysis of genome-wide association studies. Pac. Symp. Biocomput. 2009, 2009, 368–379. [Google Scholar]
  25. Pendergrass, S.A.; Frase, A.; Wallace, J.; Wolfe, D.; Katiyar, N.; Moore, C.; Ritchie, M.D. Genomic analyses with biofilter 2.0: Knowledge driven filtering, annotation, and model development. BioData Min. 2013, 6, 25. [Google Scholar] [CrossRef] [PubMed]
  26. Weissbrod, O.; Hormozdiari, F.; Benner, C.; Cui, R.; Ulirsch, J.; Gazal, S.; Schoech, A.P.; van de Geijn, B.; Reshef, Y.; Marquez-Luna, C.; et al. Functionally informed fine-mapping and polygenic localization of complex trait heritability. Nat. Genet. 2020, 52, 1355–1363. [Google Scholar] [CrossRef]
  27. Boix, C.A.; James, B.T.; Park, Y.P.; Meuleman, W.; Kellis, M. Regulatory genomic circuitry of human disease loci by integrative epigenomics. Nature 2021, 590, 300–307. [Google Scholar] [CrossRef]
  28. Barbeira, A.N.; Dickinson, S.P.; Bonazzola, R.; Zheng, J.; Wheeler, H.E.; Torres, J.M.; Torstenson, E.S.; Shah, K.P.; Garcia, T.; Edwards, T.L.; et al. Exploring the phenotypic consequences of tissue specific gene expression variation inferred from GWAS summary statistics. Nat. Commun. 2018, 9, 1825. [Google Scholar] [CrossRef]
  29. Consortium, G.T. The Genotype-Tissue Expression (GTEx) project. Nat. Genet. 2013, 45, 580–585. [Google Scholar]
  30. Sollis, E.; Mosaku, A.; Abid, A.; Buniello, A.; Cerezo, M.; Gil, L.; Groza, T.; Gunes, O.; Hall, P.; Hayhurst, J.; et al. The NHGRI-EBI GWAS Catalog: Knowledgebase and deposition resource. Nucleic. Acids Res. 2023, 51, D977–D985. [Google Scholar] [CrossRef]
  31. Yang, J.; Lee, S.H.; Goddard, M.E.; Visscher, P.M. GCTA: A tool for genome-wide complex trait analysis. Am. J. Hum. Genet. 2011, 88, 76–82. [Google Scholar] [CrossRef]
  32. Yang, J.; Zeng, J.; Goddard, M.E.; Wray, N.R.; Visscher, P.M. Concepts, estimation and interpretation of SNP-based heritability. Nat. Genet. 2017, 49, 1304–1310. [Google Scholar] [CrossRef] [PubMed]
  33. Michailidou, K.; Lindstrom, S.; Dennis, J.; Beesley, J.; Hui, S.; Kar, S.; Lemacon, A.; Soucy, P.; Glubb, D.; Rostamianfar, A.; et al. Association analysis identifies 65 new breast cancer risk loci. Nature 2017, 551, 92–94. [Google Scholar] [CrossRef] [PubMed]
  34. Lee, W.H.; Chen, L.C.; Lee, C.J.; Huang, C.C.; Ho, Y.S.; Yang, P.S.; Ho, C.T.; Chang, H.L.; Lin, I.H.; Chang, H.W.; et al. DNA primase polypeptide 1 (PRIM1) involves in estrogen-induced breast cancer formation through activation of the G2/M cell cycle checkpoint. Int. J. Cancer 2019, 144, 615–630. [Google Scholar] [CrossRef]
  35. Tominaga, N.; Hagiwara, K.; Kosaka, N.; Honma, K.; Nakagama, H.; Ochiya, T. RPN2-mediated glycosylation of tetraspanin CD63 regulates breast cancer cell malignancy. Mol. Cancer 2014, 13, 134. [Google Scholar] [CrossRef]
  36. Justo, B.L.; Jasiulionis, M.G. Characteristics of TIMP1, CD63, and beta1-Integrin and the Functional Impact of Their Interaction in Cancer. Int. J. Mol. Sci. 2021, 22, 9319. [Google Scholar] [CrossRef] [PubMed]
  37. Terävä, J.; Verhassel, A.; Botti, O.; Islam, M.K.; Leivo, J.; Wittfooth, S.; Härkönen, P.; Pettersson, K.; Gidwani, K. Primary breast cancer biomarkers based on glycosylation and extracellular vesicles detected from human serum. Cancer Rep. 2022, 5, e1540. [Google Scholar] [CrossRef] [PubMed]
  38. Song, Z.; Mao, J.; Barrero, R.A.; Wang, P.; Zhang, F.; Wang, T. Development of a CD63 Aptamer for Efficient Cancer Immunochemistry and Immunoaffinity-Based Exosome Isolation. Molecules 2020, 25, 5585. [Google Scholar] [CrossRef]
  39. Lee, S.; Liang, X.; Woods, M.; Reiner, A.S.; Concannon, P.; Bernstein, L.; Lynch, C.F.; Boice, J.D.; Deasy, J.O.; Bernstein, J.L.; et al. Machine learning on genome-wide association studies to predict the risk of radiation-associated contralateral breast cancer in the WECARE Study. PLoS ONE 2020, 15, e0226157. [Google Scholar] [CrossRef]
  40. Yamamoto, H.; Okumura, K.; Toshima, S.; Mukaisho, K.; Sugihara, H.; Hattori, T.; Kato, M.; Asano, S. FXYD3 protein involved in tumor cell proliferation is overproduced in human breast cancer tissues. Biol. Pharm. Bull. 2009, 32, 1148–1154. [Google Scholar] [CrossRef]
  41. Xue, Y.; Lai, L.; Lian, W.; Tu, X.; Zhou, J.; Dong, P.; Su, D.; Wang, X.; Cao, X.; Chen, Y.; et al. SOX9/FXYD3/Src Axis Is Critical for ER(+) Breast Cancer Stem Cell Function. Mol. Cancer Res. 2019, 17, 238–249. [Google Scholar] [CrossRef]
  42. Mavaddat, N.; Pharoah, P.D.; Michailidou, K.; Tyrer, J.; Brook, M.N.; Bolla, M.K.; Wang, Q.; Dennis, J.; Dunning, A.M.; Shah, M.; et al. Prediction of breast cancer risk based on profiling with common genetic variants. J. Natl. Cancer Inst. 2015, 107, djv036. [Google Scholar] [CrossRef] [PubMed]
  43. Adedokun, B.; Du, Z.; Gao, G.; Ahearn, T.U.; Lunetta, K.L.; Zirpoli, G.; Figueroa, J.; John, E.M.; Bernstein, L.; Zheng, W.; et al. Cross-ancestry GWAS meta-analysis identifies six breast cancer loci in African and European ancestry women. Nat. Commun. 2021, 12, 4198. [Google Scholar] [CrossRef] [PubMed]
  44. Zou, W.; Hu, C.H.; Zhou, J.P. Relationship between the expression of E-cadherin-catenins and alpha-, beta-, gamma-catenin and the metastasis and prognosis of breast cancer. Hunan Yi Ke Da Xue Xue Bao 2002, 27, 499–502. [Google Scholar] [PubMed]
  45. Lobo, S.; Benusiglio, P.R.; Coulet, F.; Boussemart, L.; Golmard, L.; Spier, I.; Huneburg, R.; Aretz, S.; Colas, C.; Oliveira, C. Cancer predisposition and germline CTNNA1 variants. Eur. J. Med. Genet. 2021, 64, 104316. [Google Scholar] [CrossRef]
  46. Clark, D.F.; Michalski, S.T.; Tondon, R.; Nehoray, B.; Ebrahimzadeh, J.; Hughes, S.K.; Soper, E.R.; Domchek, S.M.; Rustgi, A.K.; Pineda-Alvarez, D.; et al. Loss-of-function variants in CTNNA1 detected on multigene panel testing in individuals with gastric or breast cancer. Genet. Med. 2020, 22, 840–846. [Google Scholar] [CrossRef]
  47. Ju, R.; Wu, W.; Fei, J.; Qin, Y.; Tang, Q.; Wu, D.; Xia, Y.; Wu, J.; Wang, X. Association analysis between the polymorphisms of HSD17B5 and HSD17B6 and risk of polycystic ovary syndrome in Chinese population. Eur. J. Endocrinol. 2015, 172, 227–233. [Google Scholar] [CrossRef]
  48. Jones, M.R.; Mathur, R.; Cui, J.; Guo, X.; Azziz, R.; Goodarzi, M.O. Independent confirmation of association between metabolic phenotypes of polycystic ovary syndrome and variation in the type 6 17beta-hydroxysteroid dehydrogenase gene. J. Clin. Endocrinol. Metab. 2009, 94, 5034–5038. [Google Scholar] [CrossRef]
  49. Burgdorf, K.S.; Gjesing, A.P.; Grarup, N.; Justesen, J.M.; Sandholt, C.H.; Witte, D.R.; Jorgensen, T.; Madsbad, S.; Hansen, T.; Pedersen, O. Association studies of novel obesity-related gene variants with quantitative metabolic phenotypes in a population-based sample of 6,039 Danish individuals. Diabetologia 2012, 55, 105–113. [Google Scholar] [CrossRef]
  50. Principe, C.; Dionisio de Sousa, I.J.; Prazeres, H.; Soares, P.; Lima, R.T. LRP1B: A Giant Lost in Cancer Translation. Pharmaceuticals 2021, 14, 836. [Google Scholar] [CrossRef]
  51. Hu, H.; Wang, Y.; Zhang, T.; Zhang, C.; Liu, Y.; Li, G.; Zhou, D.; Lu, S. Association of LncRNA-GACAT3 with MRI features of breast cancer and its molecular mechanism. J. BUON 2019, 24, 2377–2384. [Google Scholar]
  52. Zhong, H.; Yang, J.; Zhang, B.; Wang, X.; Pei, L.; Zhang, L.; Lin, Z.; Wang, Y.; Wang, C. LncRNA GACAT3 predicts poor prognosis and promotes cell proliferation in breast cancer through regulation of miR-497/CCND2. Cancer Biomark. 2018, 22, 787–797. [Google Scholar] [CrossRef] [PubMed]
  53. Borneman, R.M.; Gavin, E.; Musiyenko, A.; Richter, W.; Lee, K.J.; Crossman, D.K.; Andrews, J.F.; Wilhite, A.M.; McClellan, S.; Aragon, I.; et al. Phosphodiesterase 10A (PDE10A) as a novel target to suppress beta-catenin and RAS signaling in epithelial ovarian cancer. J. Ovarian Res. 2022, 15, 120. [Google Scholar] [CrossRef] [PubMed]
  54. De, S.; Cipriano, R.; Jackson, M.W.; Stark, G.R. Overexpression of kinesins mediates docetaxel resistance in breast cancer cells. Cancer Res. 2009, 69, 8035–8042. [Google Scholar] [CrossRef]
  55. Fang, W.J.; Zheng, Y.; Wu, L.M.; Ke, Q.H.; Shen, H.; Yuan, Y.; Zheng, S.S. Genome-wide analysis of aberrant DNA methylation for identification of potential biomarkers in colorectal cancer patients. Asian Pac. J. Cancer Prev. 2012, 13, 1917–1921. [Google Scholar] [CrossRef] [PubMed]
  56. Homer, M.V.; Charo, L.M.; Natarajan, L.; Haunschild, C.; Chung, K.; Mao, J.J.; DeMichele, A.M.; Su, H.I. Genetic variants of age at menopause arhe not related to timing of ovarian failure in breast cancer survivors. Menopause 2017, 24, 663–668. [Google Scholar] [CrossRef]
Figure 1. A composite Manhattan plot for area percent density, dense area, and breast area GWAS. X-axis shows chromosome position and y-axis represents the −log10 (p-values), the colors of all annotated loci are demonstrating the breast density phenotype tested. The SNPs mapping to closest genes are annotated in the plot where p-value < 1 × 10⁻⁵. Yellow background color and asterisk next to the gene name refers to previously known associations with breast density or breast cancer and pink background color refers to novel associations. For each gene, lowest p-value on SNP mapping to the respective gene is reported in the annotations in pink and yellow.
Cancers 15 02776 g001
Figure 2. Quantile–quantile plots for area percent density, dense area, and breast area GWAS. Composite QQ plots for area percent density (green), dense area (dark purple), and breast area (dark red) GWAS. Genomic inflation factor for area percent density is 1.01, dense area is 1.002, and breast area is 1.004.
Cancers 15 02776 g002
Figure 3. Transcriptome-wide association study analyses results for dense area (a) and area percent density (b). Scatterplots representing chromosome positions of all tested SNPs on x-axis and −log10 (p-value) from TWAS analyses using breast tissues on y-axis. Genes at p-value < 1 × 10⁻³ are annotated. The point of the pink triangles represents direction of effect.
Cancers 15 02776 g003
Figure 4. PheWAS of significant genes from mammogram trait GWAS. Scatter plot representing gene names on x-axis and −log10 (p-value) from GWAS catalog on y-axis. Each colored point corresponds to a different disease/disease category from GWAS catalog.
Cancers 15 02776 g004
Figure 5. Suggestive SNPs from mammogram trait GWAS. GWAS catalog lookup results for suggestive SNPs on x-axis and −log10 (p-value) from GWAS catalog on y-axis. Each colored point corresponds to a different disease/trait.
Cancers 15 02776 g005
Figure 6. Heatmap showing genetic correlation between breast density traits, age, BMI, and menopause status (meno). The blue color corresponds to negative correlation and red corresponds to positive correlation.
Cancers 15 02776 g006
Table 1. Characteristics of Mammography Screening Population. The characteristics of the screening population were compared with the total cohort. The average screening age was 56.7, most patients were postmenopausal, and about 12% had a family history of breast cancer.
CharacteristicAll Self-Reported Black or African American Women, N = 10,090 1Study Cohort, N = 1333
Breast Area (cm2), Mean (SD)206.71 (81.80)217.63 (85.08)
Area Percent Density (%), Mean (SD)13.89 (11.40)11.52 (6.65)
Dense Area (cm2), Mean (SD)26.30 (28.28)22.52 (11.06)
Age, Mean (SD)56.45 (10.57)56.65 (9.80)
Atypical Hyperplasia, n (%)26 (0.26)4 (0.3)
Body Mass Index (Kg/m2), Mean (SD)32.44 (7.40)33.87 (7.85)
Menopausal Status, n (%)
Postmenopausal6926 (68.64)963 (72.2)
Premenopausal3164 (31.36)370 (27.8)
Breast Density BI-RADS Categories, n (%)
Almost entirely fat1810 (17.94)269 (20.2)
Scattered fibroglandular tissue6053 (59.99)814 (61.2)
Heterogeneously dense2111 (20.92)240 (18.0)
Extremely dense91 (0.90)7 (0.5)
Missing/Unknown25 (0.25)3 (0.2)
Cancer Diagnosis After Screening, n (%)171 (1.69)33 (2.5)
Number of Biopsies, n (%)
None8206 (81.33)1053 (79.0)
One1489 (14.76)217 (16.3)
Two or more395 (3.91)63 (4.7)
Age at Menarche, n (%)
<12 years2129 (21.10)318 (23.9)
12–13 years4358 (43.19)550 (41.3)
14+ years2239 (22.19)306 (23.0)
Unknown1364 (13.52)159 (11.9)
Age at First Live Birth, n (%)
No Births1495 (14.82)187 (14.0)
<203536 (35.04)524 (39.3)
20–242504 (24.82)354 (26.6)
25–291272 (12.61)145 (10.9)
30+650 (6.44)72 (5.4)
Birth age missing633 (6.27)51 (3.8)
Family History of Breast Cancer, n (%)
None8788 (87.10)1171 (87.8)
One relative1147 (11.37)145 (10.9)
Two or more relatives155 (1.54)17 (1.3)
1 Mean (SD); n (%).
Table 2. Significant Loci in Genome-Wide Association Analyses. In sixty-five hits consisting of twenty-nine independent loci from genome-wide significant results of area percent density and five loci associated with dense area were discovered. #SNPs in loci refer to count of SNPs, which are in column SNP2.
SnpidVariant_IDTraitAdditional #SNPS in LociSNP2Genep-Value
RS75413938chr1:55151613:T:GDense Area291:55066599(1),1:55069787(1),1:55078520(1),1:55079038(1),1:55079364(1),1:55091687(1),1:55096857(1),1:55099538(1),1:55103811(1),1:55108626(1),1:55120773(1),1:55126542(1),1:55128390(1),1:55128925(1),1:55128926(1),1:55134044(1),1:55155440(1),1:55161852(1),1:55167712(1),1:55177218(1),1:55183862(1),1:55189932(1),1:55193134(1),1:55194898(1),1:55195273(1),1:55195399(1),1:55203473(1),1:55217682(1),1:55226938(1)USP248.92 × 10−9
RS79314581chr1:244097544:G:CDense Area0NONELOC122152354/
RN7SL148P
1.22 × 10⁻⁸
RS190395094chr1:27735235:C:TDense Area81:27646562(1),1:27649415(1),1:27657130(1),1:27674922(1),1:27694043(1),1:27725469(1),1:27820501(1),1:27823924(1)FAM76A2.64 × 10−8
RS60005977chr1:75838225:C:TDense Area0NONEMSH42.77 × 10−8
RS78168242chr1:202232716:C:TDense Area21:202217643(1),1:202220169(1)LGR63.73 × 10−8
RS142447005chr2:16941818:G:TDense Area0NONELINC018666.06 × 10−13
RS139721819chr4:39529250:C:GDense Area64:39487863(1),4:39494788(1),4:39497063(1),4:39523173(1),4:39528094(1),4:39608882(1)UGDH-AS11.45 × 10−11
RS191367039chr4:148052195:G:ADense Area44:148066298(1),4:148070999(1),4:148125334(1),4:148134899(1)ARHGAP101.40 × 10−10
RS147570646chr4:179504076:C:TDense Area14:179560038(1)LOC105377563/
LOC124900818
2.73 × 10⁻⁹
RS58470658chr4:148160004:C:TDense Area14:148166598(1)NR3C24.57 × 10−9
RS116045382chr4:11398948:C:TDense Area0NONEHS3ST16.09 × 10−9
RS143507397chr4:168554153:G:ADense Area0NONEPALLD1.89 × 10−8
RS186021694chr4:173988596:A:GDense Area34:173962614(1),4:173969459(1),4:173982430(1)LOC1053775433.22 × 10−8
RS113187843chr5:138964719:T:ADense Area0NONESIL12.46 × 10−9
RS112818595chr5:138863360:C:TDense Area25:138813316(1),5:138850667(1)CTNNA15.39 × 10−9
RS6912620chr6:132552803:G:ADense Area66:132460453(1),6:132479524(1),6:132480587(1),6:132551032(1),6:132551150(1),6:132592333(1)TAAR81.08 × 10−10
RS59162058chr7:5603217:C:TDense Area27:5644533(1),7:5651116(1)FSCN11.97 × 10−8
RS1657248chr7:155112424:G:ADense Area27:155112360(1),7:155113278(1)HTR5A3.64 × 10−8
RS114517045chr8:77390103:T:GDense Area58:77439758(1),8:77447273(1),8:77460647(1),8:77474685(1),8:77485921(1)LOC1053759092.20 × 10−8
RS189070945chr10:66699780:C:TDense Area1110:66669847(1),10:66681835(1),10:66694622(1),10:66716457(1),10:66717173(1),10:66720546(1),10:66721909(1),10:66733490(1),10:66739808(1),10:66742213(1),10:66745040(1)CTNNA31.76 × 10−12
RS59522962chr10:66806298:T:CDense Area110:66790114(1)CTNNA31.58 × 10−8
RS79232684chr11:47150163:G:ADense Area0NONECSTPP11.18 × 10−8
RS114694584chr11:31973064:A:GDense Area611:31930445(1),11:31935750(1),11:31939541(1),11:31948997(1),11:31955129(1),11:31986978(1)LOC110120941/
LOC107984420
1.72 × 10⁻⁸
RS75439556chr11:46775991:C:ADense Area111:46802307(1)CKAP52.95 × 10−8
RS184938993chr12:56780836:G:ADense Area112:56780646(1)HSD17B64.02 × 10−12
RS150208861chr14:97883545:C:TDense Area0NONELINC015501.61 × 10−9
RS150796751chr17:38494521:G:ADense Area0NONEARHGAP233.82 × 10−8
RS143065709chr18:57155409:C:TDense Area218:57148687(1),18:57168501(1)BOD1L2/LINC025654.17 × 10−10
RS73886707chr22:46112492:C:TDense Area322:46105565(1),22:46109178(1),22:46109365(1)MIRLET7BHG2.15 × 10−9
RS148811443chr2:142145550:G:APercent Density72:142055838(1),2:142158131(1),2:142161710(1),2:142167799(1),2:142215347(1),2:142218937(1),2:142242824(1)LRP1B1.56 × 10−8
RS79331071chr4:166343624:C:TPercent Density264:166296011(1),4:166296276(1),4:166296612(1),4:166308772(1),4:166311509(1),4:166322829(1),4:166331896(1),4:166337499(1),4:166340457(1),4:166342254(1),4:166343104(1),4:166343888(1),4:166344382(1),4:166345601(1),4:166345825(1),4:166349179(1),4:166350417(1),4:166350715(1),4:166351544(1),4:166351573(1),4:166352076(1),4:166353507(1),4:166355475(1),4:166376134(1),4:166409358(1),4:166415758(1)LOC121056748/
LOC121056749
4.41 × 10⁻⁹
RS138783664chr9:114879160:C:TPercent Density19:114917870(1)LOC645266/
LOC124310630
1.27 × 10⁻⁸
RS143877555chr10:84298935:C:TPercent Density510:84294546(1),10:84344702(1),10:84348787(1),10:84352282(1),10:84366026(1)LINC00858/CCSER21.01 × 10−8
RS145826214chr13:99921286:C:TPercent Density313:99908944(1),13:99916943(1),13:99920000(1)CLYBL-AS32.71 × 10−8
Table 3. Fine-mapping results with PIP ≥ 0.98. Epigenetic annotations: Repr = repressor, TssFlnkD = downstream flanking region to transcription start site, TssFlnkU = upstream flanking region to transcription start site, Het = heterochromatin.
TraitGeneAnnotationSNPIDPIP
Dense AreaPDE10AHetrs4802680.98738
PDE10AHetrs69075880.98244
PDE10AHetrs5768530.99956
PDE10AHetrs4817011
LOC101927404rs99671571
LOC101927404rs7169611
LOC101927404/LOC105372168rs342175311
LOC101927404/LOC105372168rs13068711
LOC105372168rs99540121
LOC105372168ncRNA_geners6117501
LOC105372310Hetrs104120421
LOC105372310Hetrs124628021
LOC105372310Hetrs72538431
LOC105372310Hetrs42774581
LOC100129265/BNIP3P19Hetrs284932831
BNIP3P19/BNIP3P20Hetrs104266111
BNIP3P20/BNIP3P21pseudogeners99897301
BNIP3P20/BNIP3P21pseudogeners287861951
Percent DensitySH3GL3ncRNA_geners109069741
SH3GL3ncRNA_geners3018471
SH3GL3ncRNA_geners66029741
SH3GL3lnc_RNArs556415681
SH3GL3lnc_RNArs118536761
SH3GL3lnc_RNArs73507621
SH3GL3lnc_RNArs129059641
KIFC3mRNArs15825941
KIFC3mRNArs29671391
KIFC3EnhA1rs47848641
KIFC3EnhA1rs29113481
KIFC3EnhA2rs29671371
KIFC3EnhA2rs593502941
KIFC3mRNArs1402346661
KIFC3Hetrs99380480.99999
KIFC3/CNGB1EnhA1rs8385831
CNGB1mRNArs6916561
Table 4. Comparison of results with effect estimates and significance reported in a recently published breast density GWAS for 27,900 European ancestry individuals. Summary statistics comparison with SNPs found to be significant from Chen et al. manuscript. MAFs refer to minor allele frequency from this study.
Breast AreaPercent DensityDense Area
A1_FREQBETApA1_FREQBETApA1_FREQBETAp
rs112053030.078−0.0470.4470.077−0.0530.4810.077−0.0830.310
rs18689920.4120.0580.1600.4130.0300.5470.4120.0480.370
rs176258450.0690.1540.0190.0680.0550.4860.0680.1030.229
rs68517330.093−0.0380.4960.0950.0180.7860.094−0.0160.824
rs4134720.2660.0570.1230.266−0.0450.3110.266−0.0280.557
rs3351890.167−0.0040.9270.1670.0320.5330.1680.0930.093
rs117452300.4020.0210.5210.401−0.0160.6960.4020.0080.859
rs21126700.171−0.0350.4100.171−0.0260.6120.171−0.0540.327
rs20422390.154−0.0130.7660.152−0.0740.1680.154−0.0610.289
rs38194050.460−0.0030.9360.456−0.1250.0020.456−0.1060.015
rs48971070.159−0.0490.2570.160−0.0550.2870.160−0.1530.007
rs93974360.0690.0430.4900.068−0.0480.5240.0680.0770.344
rs168856130.356−0.1150.0010.3560.1978.07 × 10−70.3570.1170.007
rs100878040.296−0.1130.0010.2960.2099.17 × 10−70.2970.1460.002
rs588475410.290−0.0090.7920.288−0.0360.3840.290−0.0170.700
rs21385550.315−0.0320.3550.318−0.0340.4160.318−0.0470.295
rs109951870.071−0.0180.7730.070−0.0120.8760.0700.0140.864
rs49803830.274−0.0020.9560.2750.0550.1940.2750.0200.671
rs118361640.2210.0260.5100.221−0.0030.9530.2210.0110.835
rs72970510.141−0.0040.9290.1410.0100.8520.1420.0140.802
rs619380930.2090.1320.0010.211−0.1070.0220.210−0.0380.451
rs44991900.150−0.0700.1370.151−0.0500.3770.151−0.0890.145
rs116467150.166−0.0510.2340.1680.0290.5730.168−0.0050.931
rs124621110.1690.0630.1390.169−0.0220.6580.1690.0330.549
rs12312810.2630.0380.3060.2630.0250.5800.2630.0400.412
rs177896290.040−0.0390.6390.0410.1320.1850.040−0.0220.836
rs340660500.209−0.0180.6610.2080.0120.7990.2090.0370.476
rs731690970.056−0.1040.1320.057−0.0160.8430.057−0.0450.615
Bolded rows are statitsically signficant at p < 0.001.
Disclaimer/Publisher’s Note: The statements, opinions and data contained in all publications are solely those of the individual author(s) and contributor(s) and not of MDPI and/or the editor(s). MDPI and/or the editor(s) disclaim responsibility for any injury to people or property resulting from any ideas, methods, instructions or products referred to in the content.

