
IGF2BP1 Promotes Proliferation of Neuroendocrine Neoplasms by Post-Transcriptional Enhancement of EZH2

 , , and
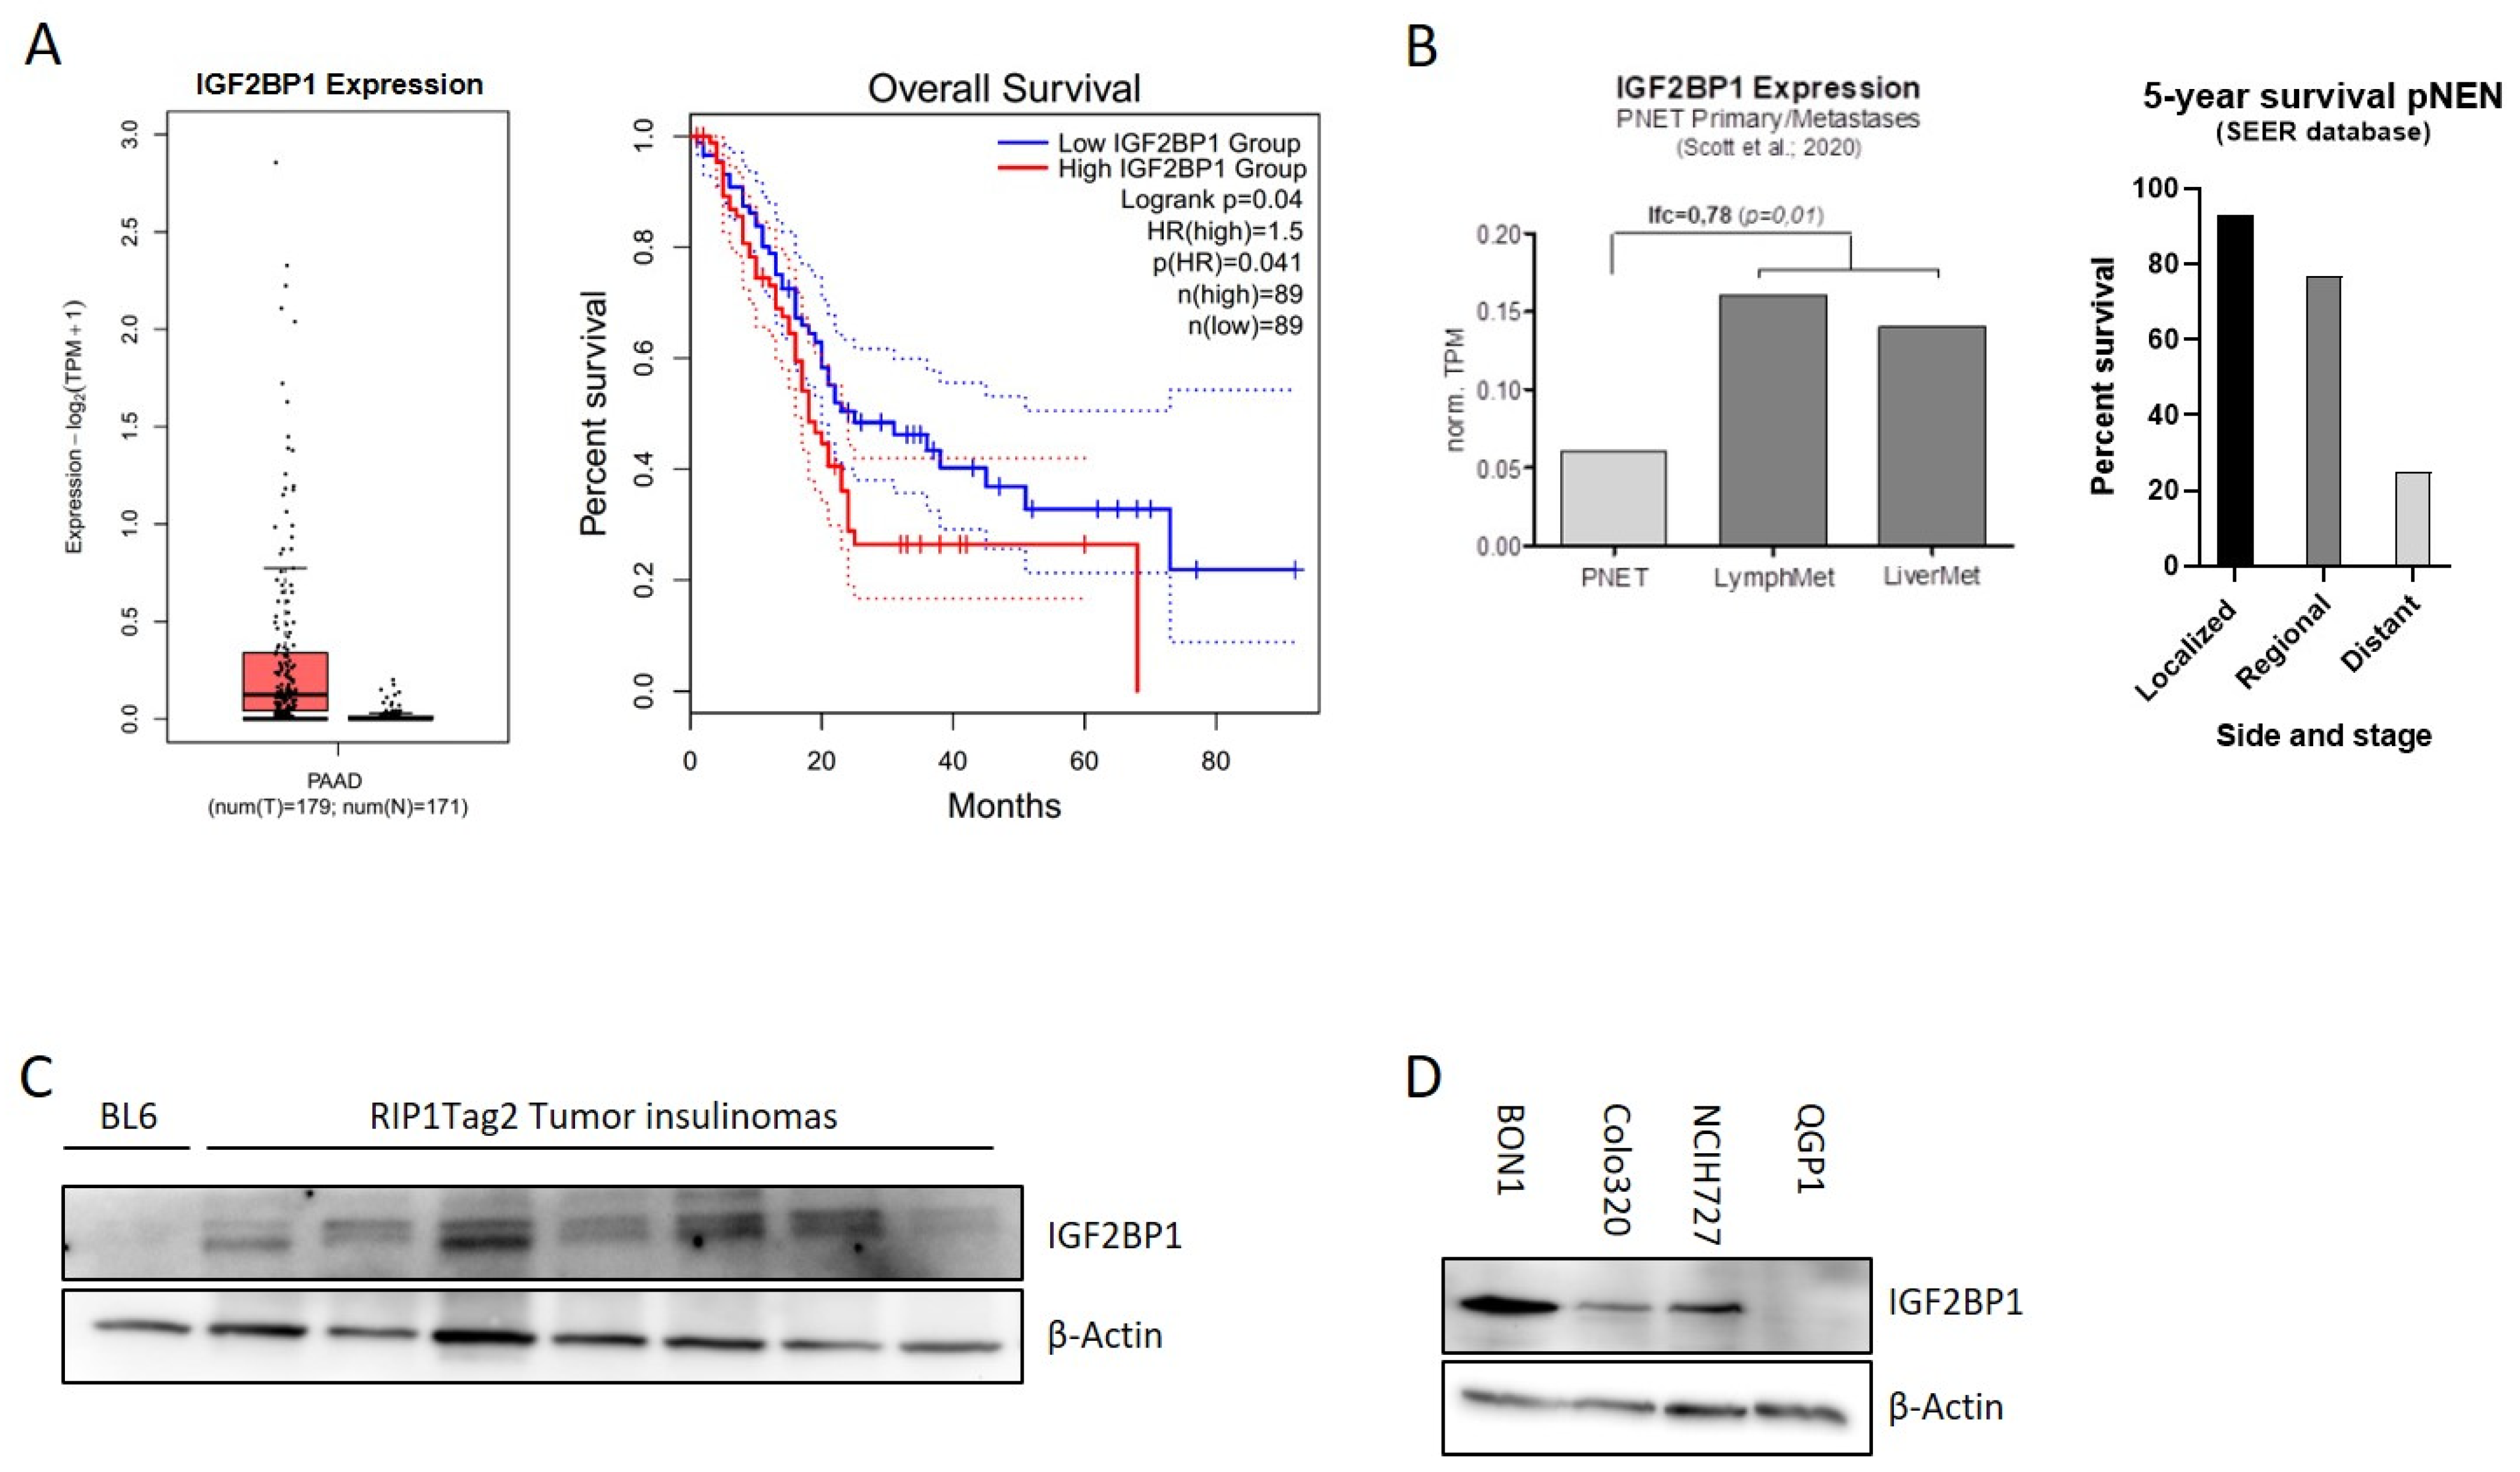
Abstract
:Simple Summary
Abstract
1. Introduction
2. Materials and Methods
2.1. Reagents
2.2. Cell Cultures and Growth Conditions
2.3. Transfection of siRNAs
2.4. Cell Proliferation and Viability Assays
2.5. Flow Cytometry Analysis of Cell Cycle and Apoptosis
2.6. RNA Sequencing and Differential Gene Expression
2.7. Actinomycin D Treatment
2.8. RNA Immunoprecipitation
2.9. Quantitative Real-Time PCR (qRT-PCR)
2.10. Western Blotting
2.11. Transgenic Mouse Model
2.12. Statistical Analyses
3. Results
3.1. IGF2BP1 Is Differentially Expressed in Neuroendocrine Tumor Cells
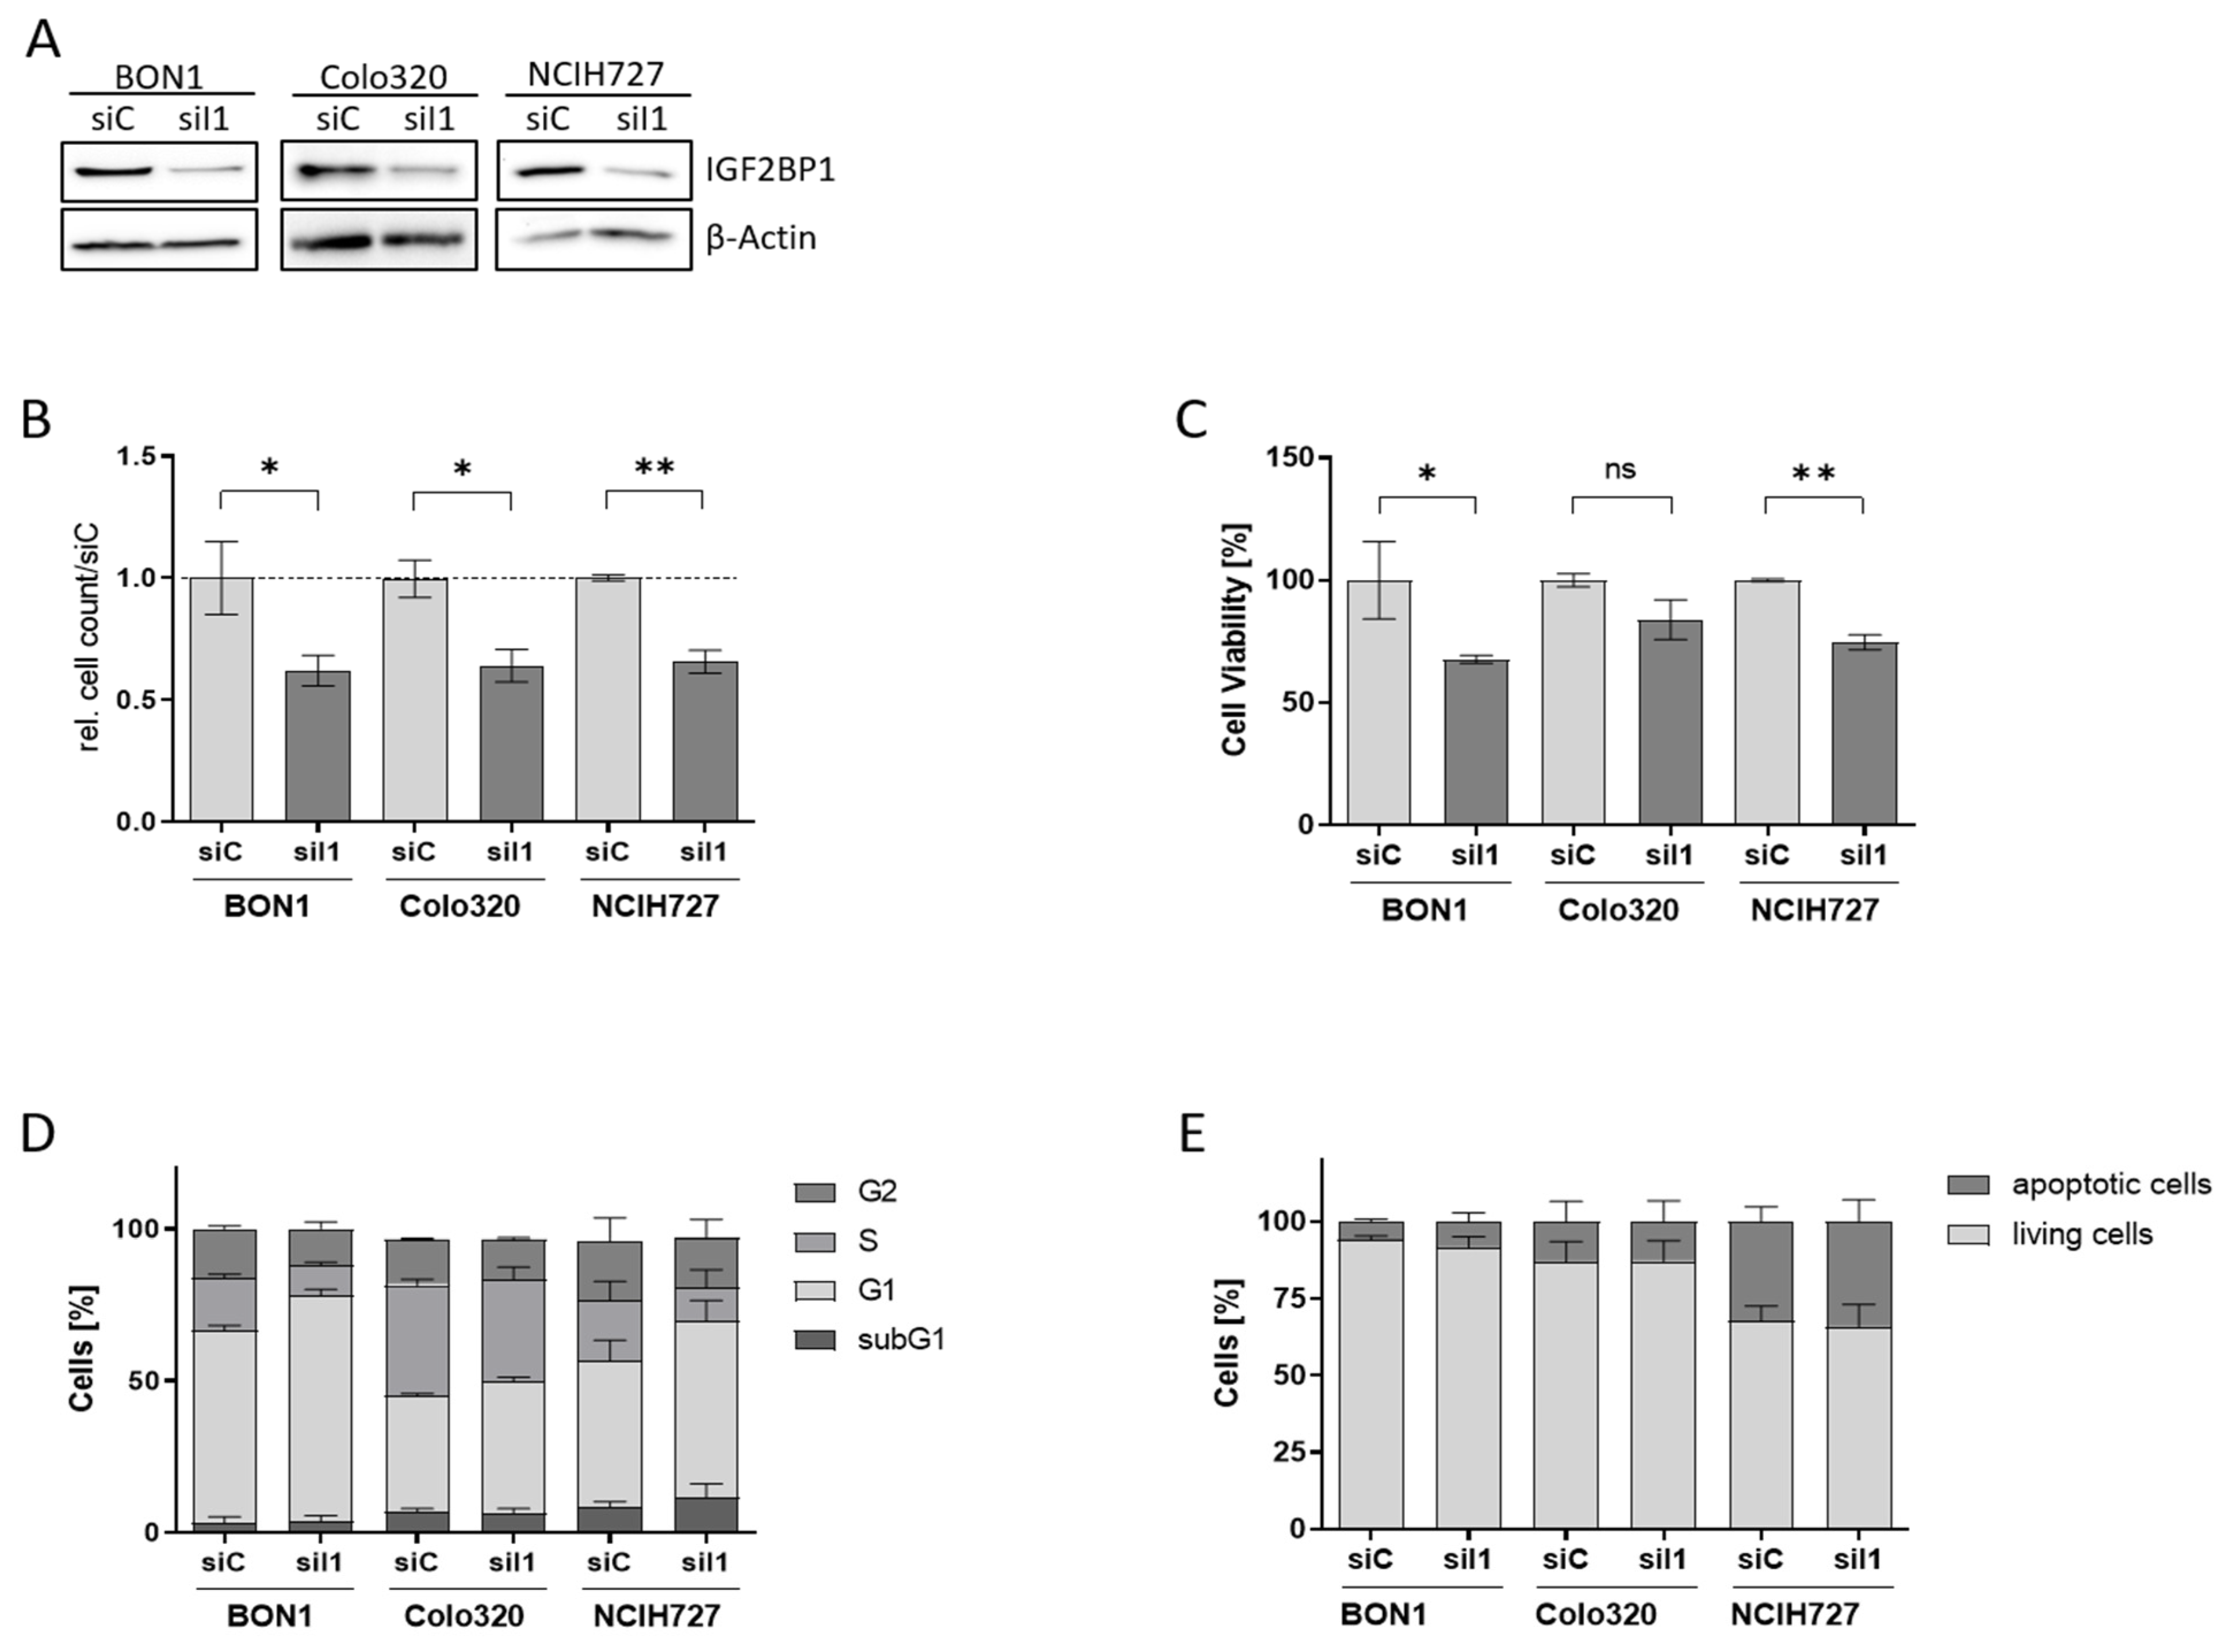
3.2. IGF2BP1 Knockdown Impairs Proliferation and Viability of NEN Cells
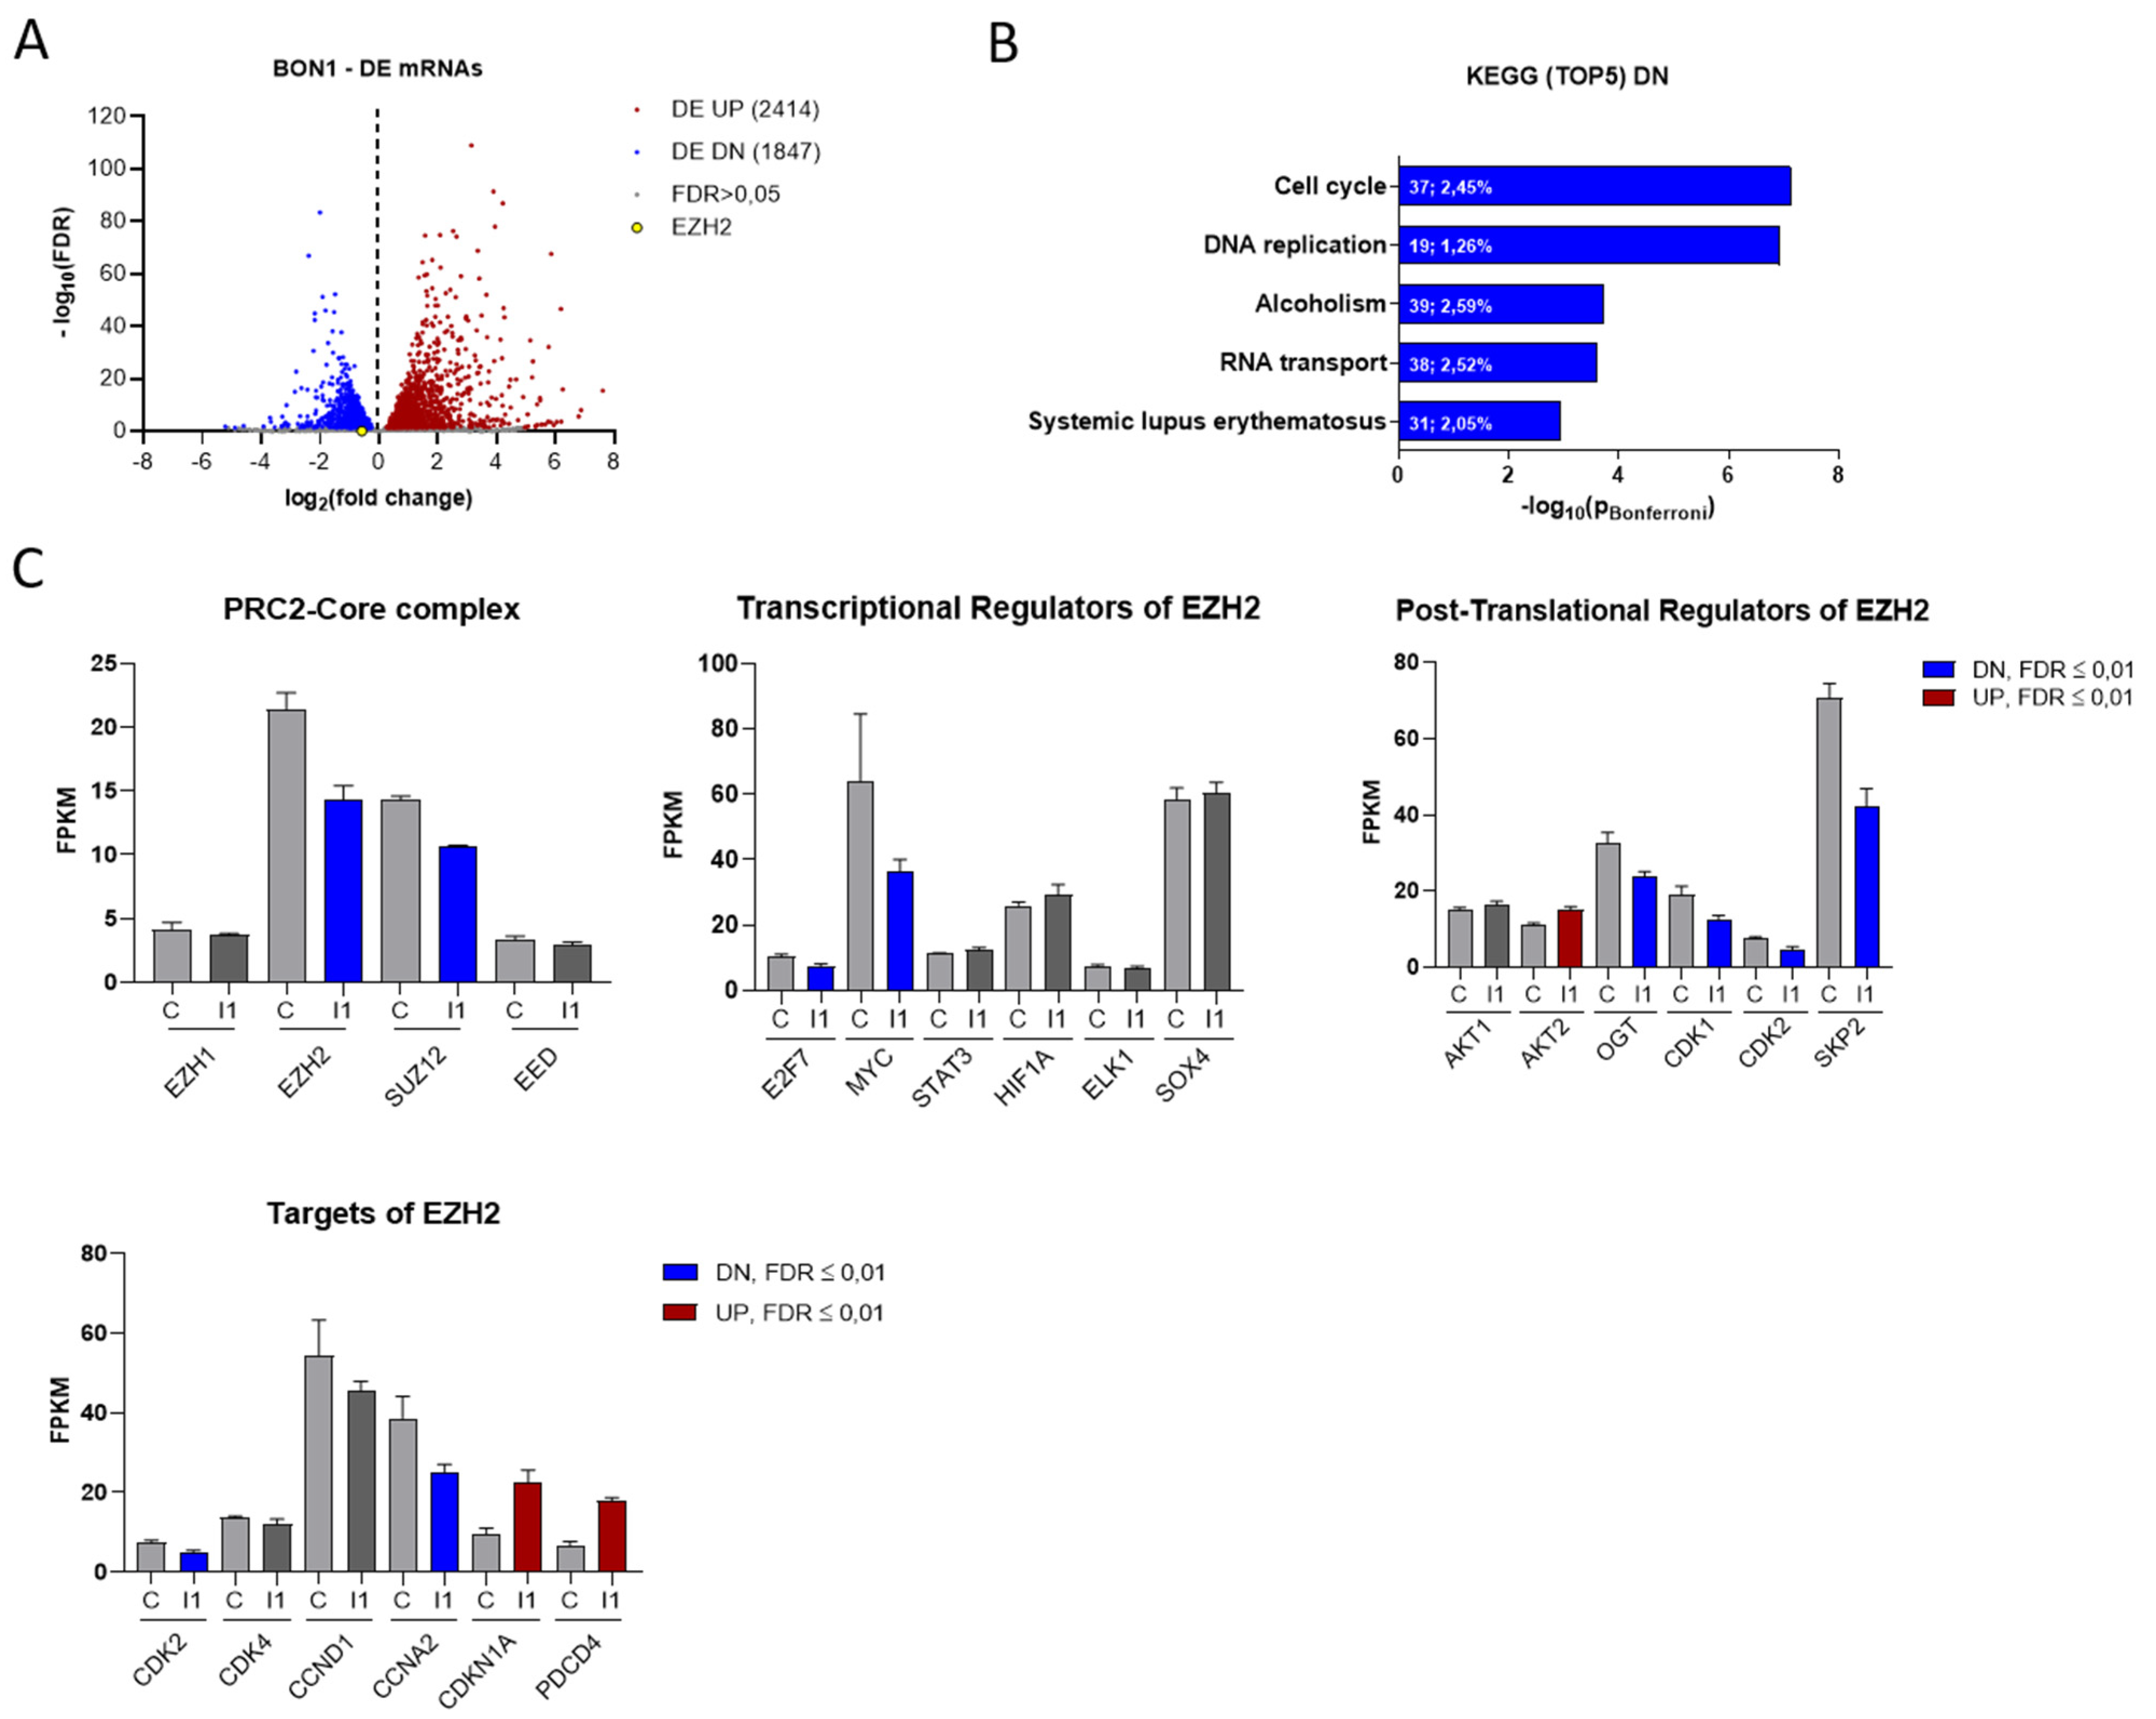
3.3. IGF2BP1 Influences the RNA Landscape of NEN Cells
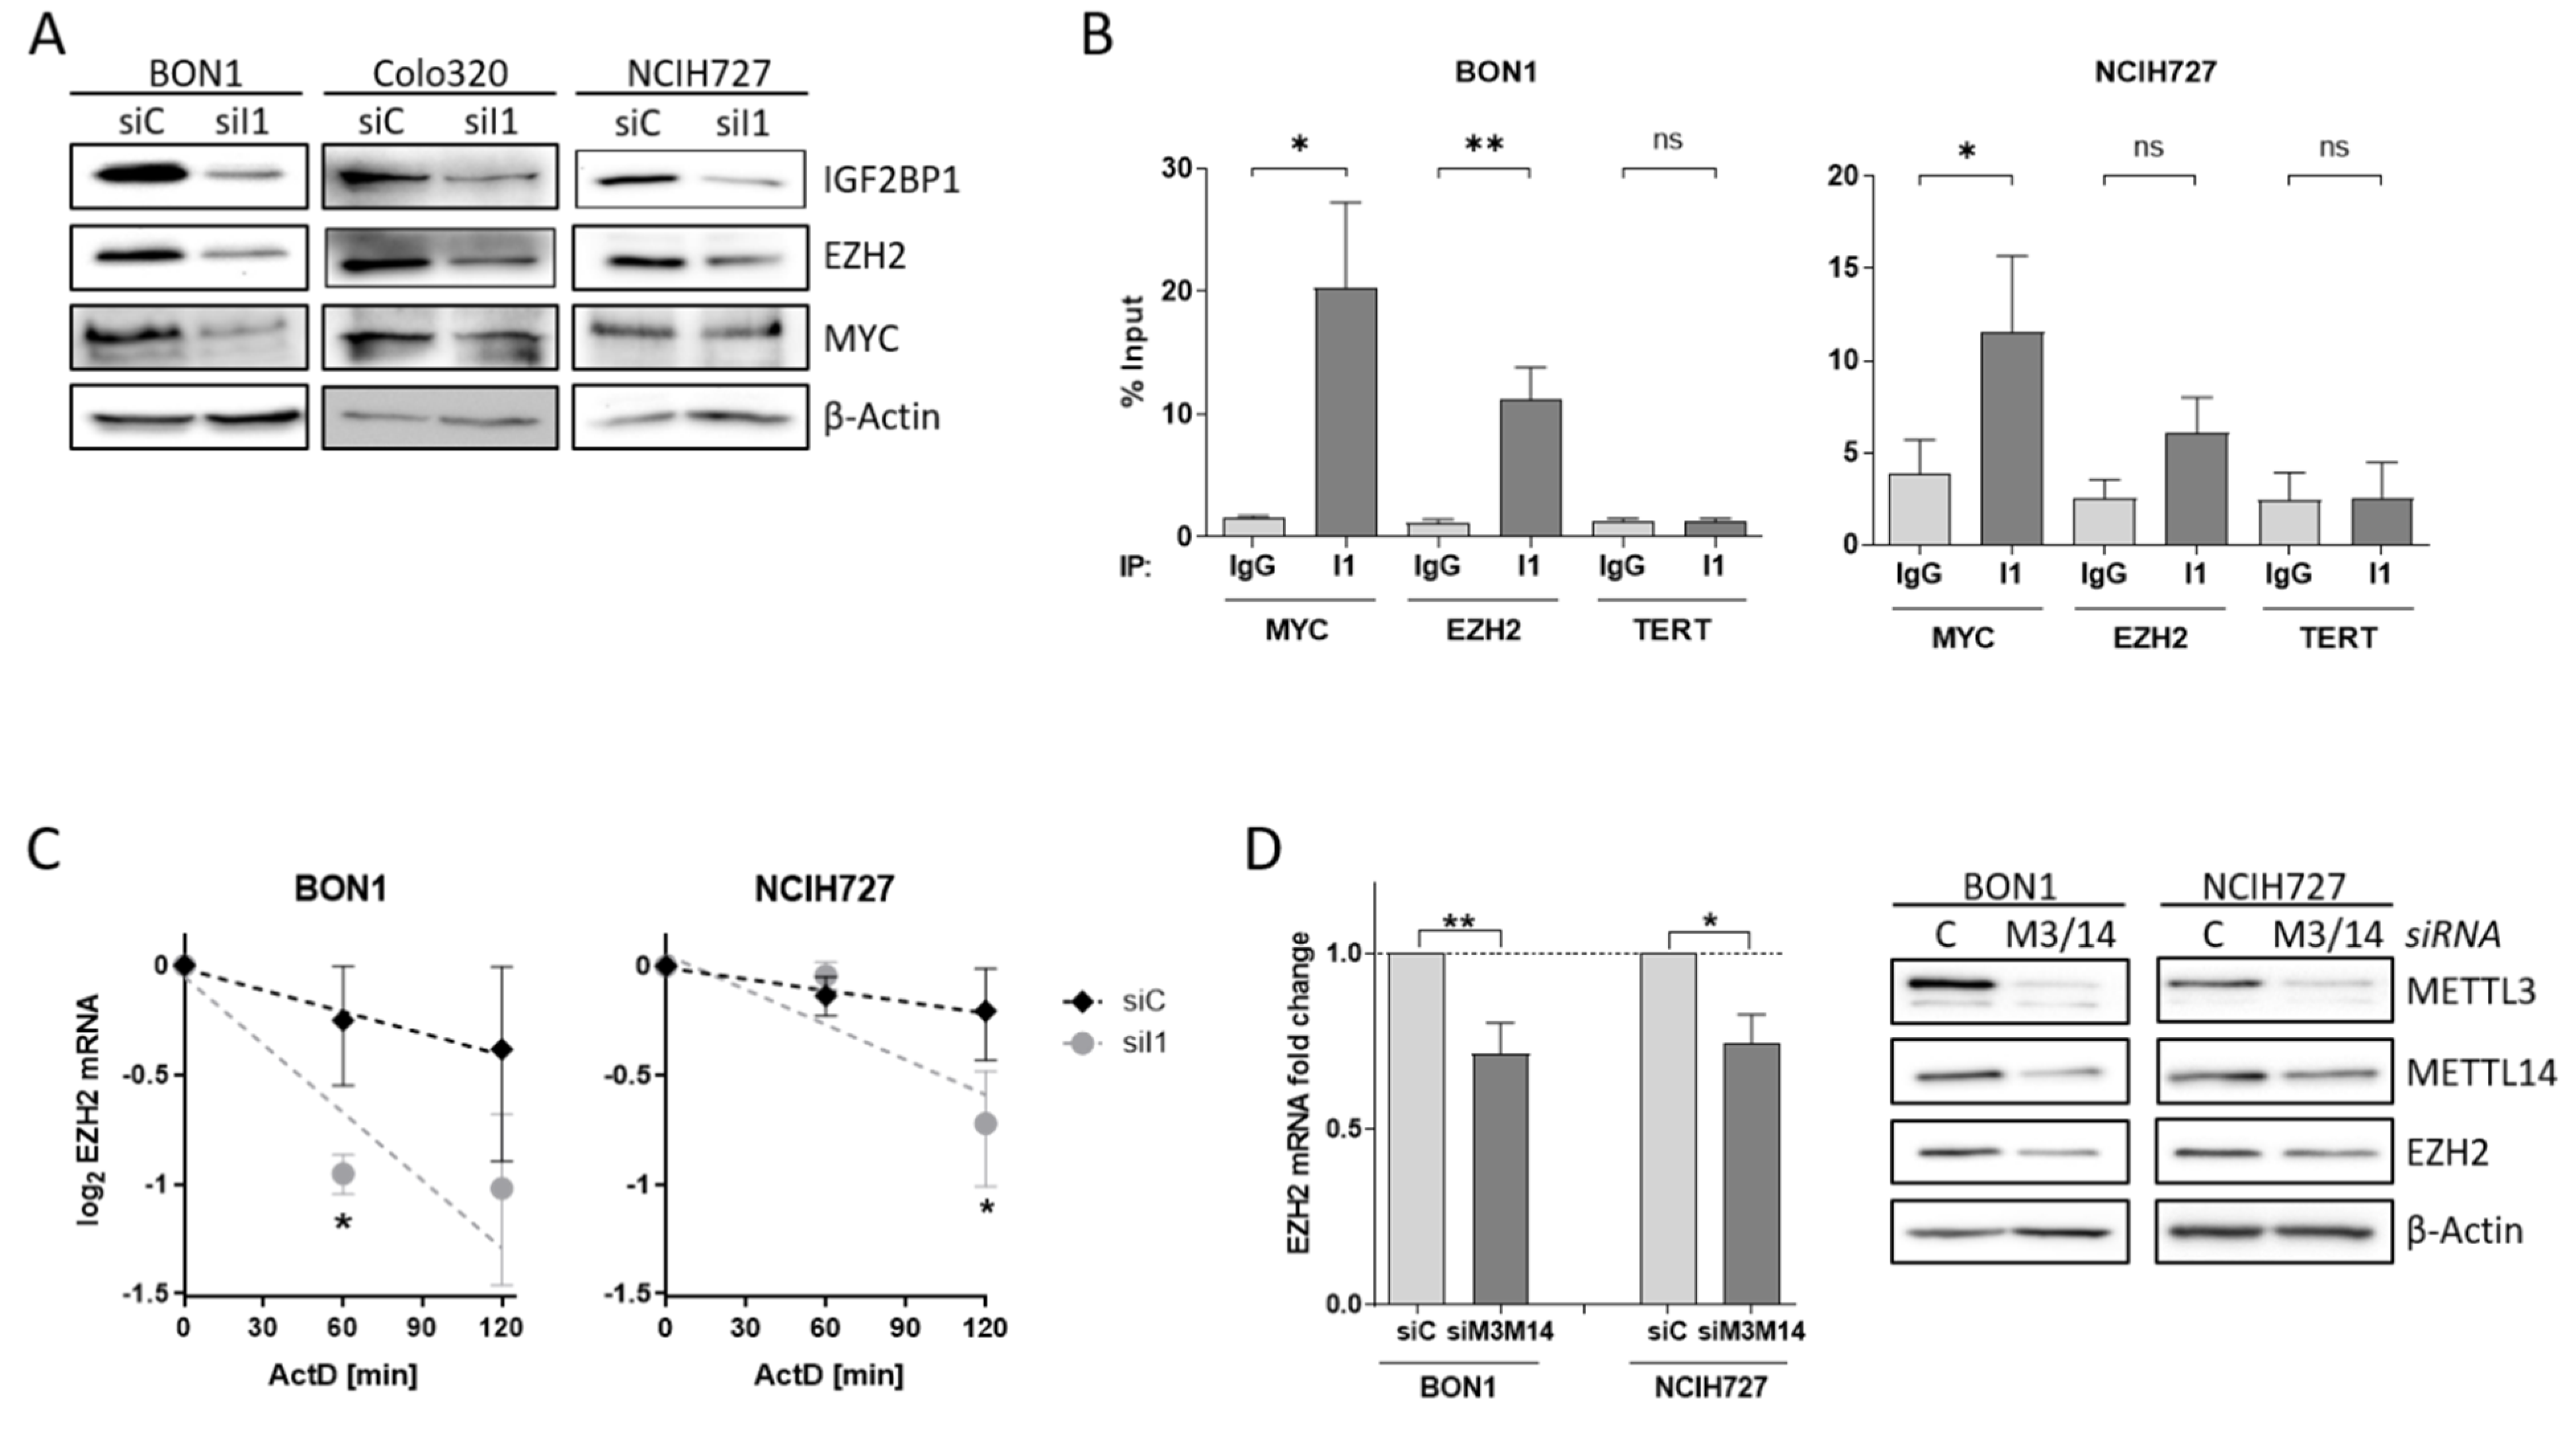
3.4. EZH2 Is Regulated by IGF2BP1 in NEN Cells
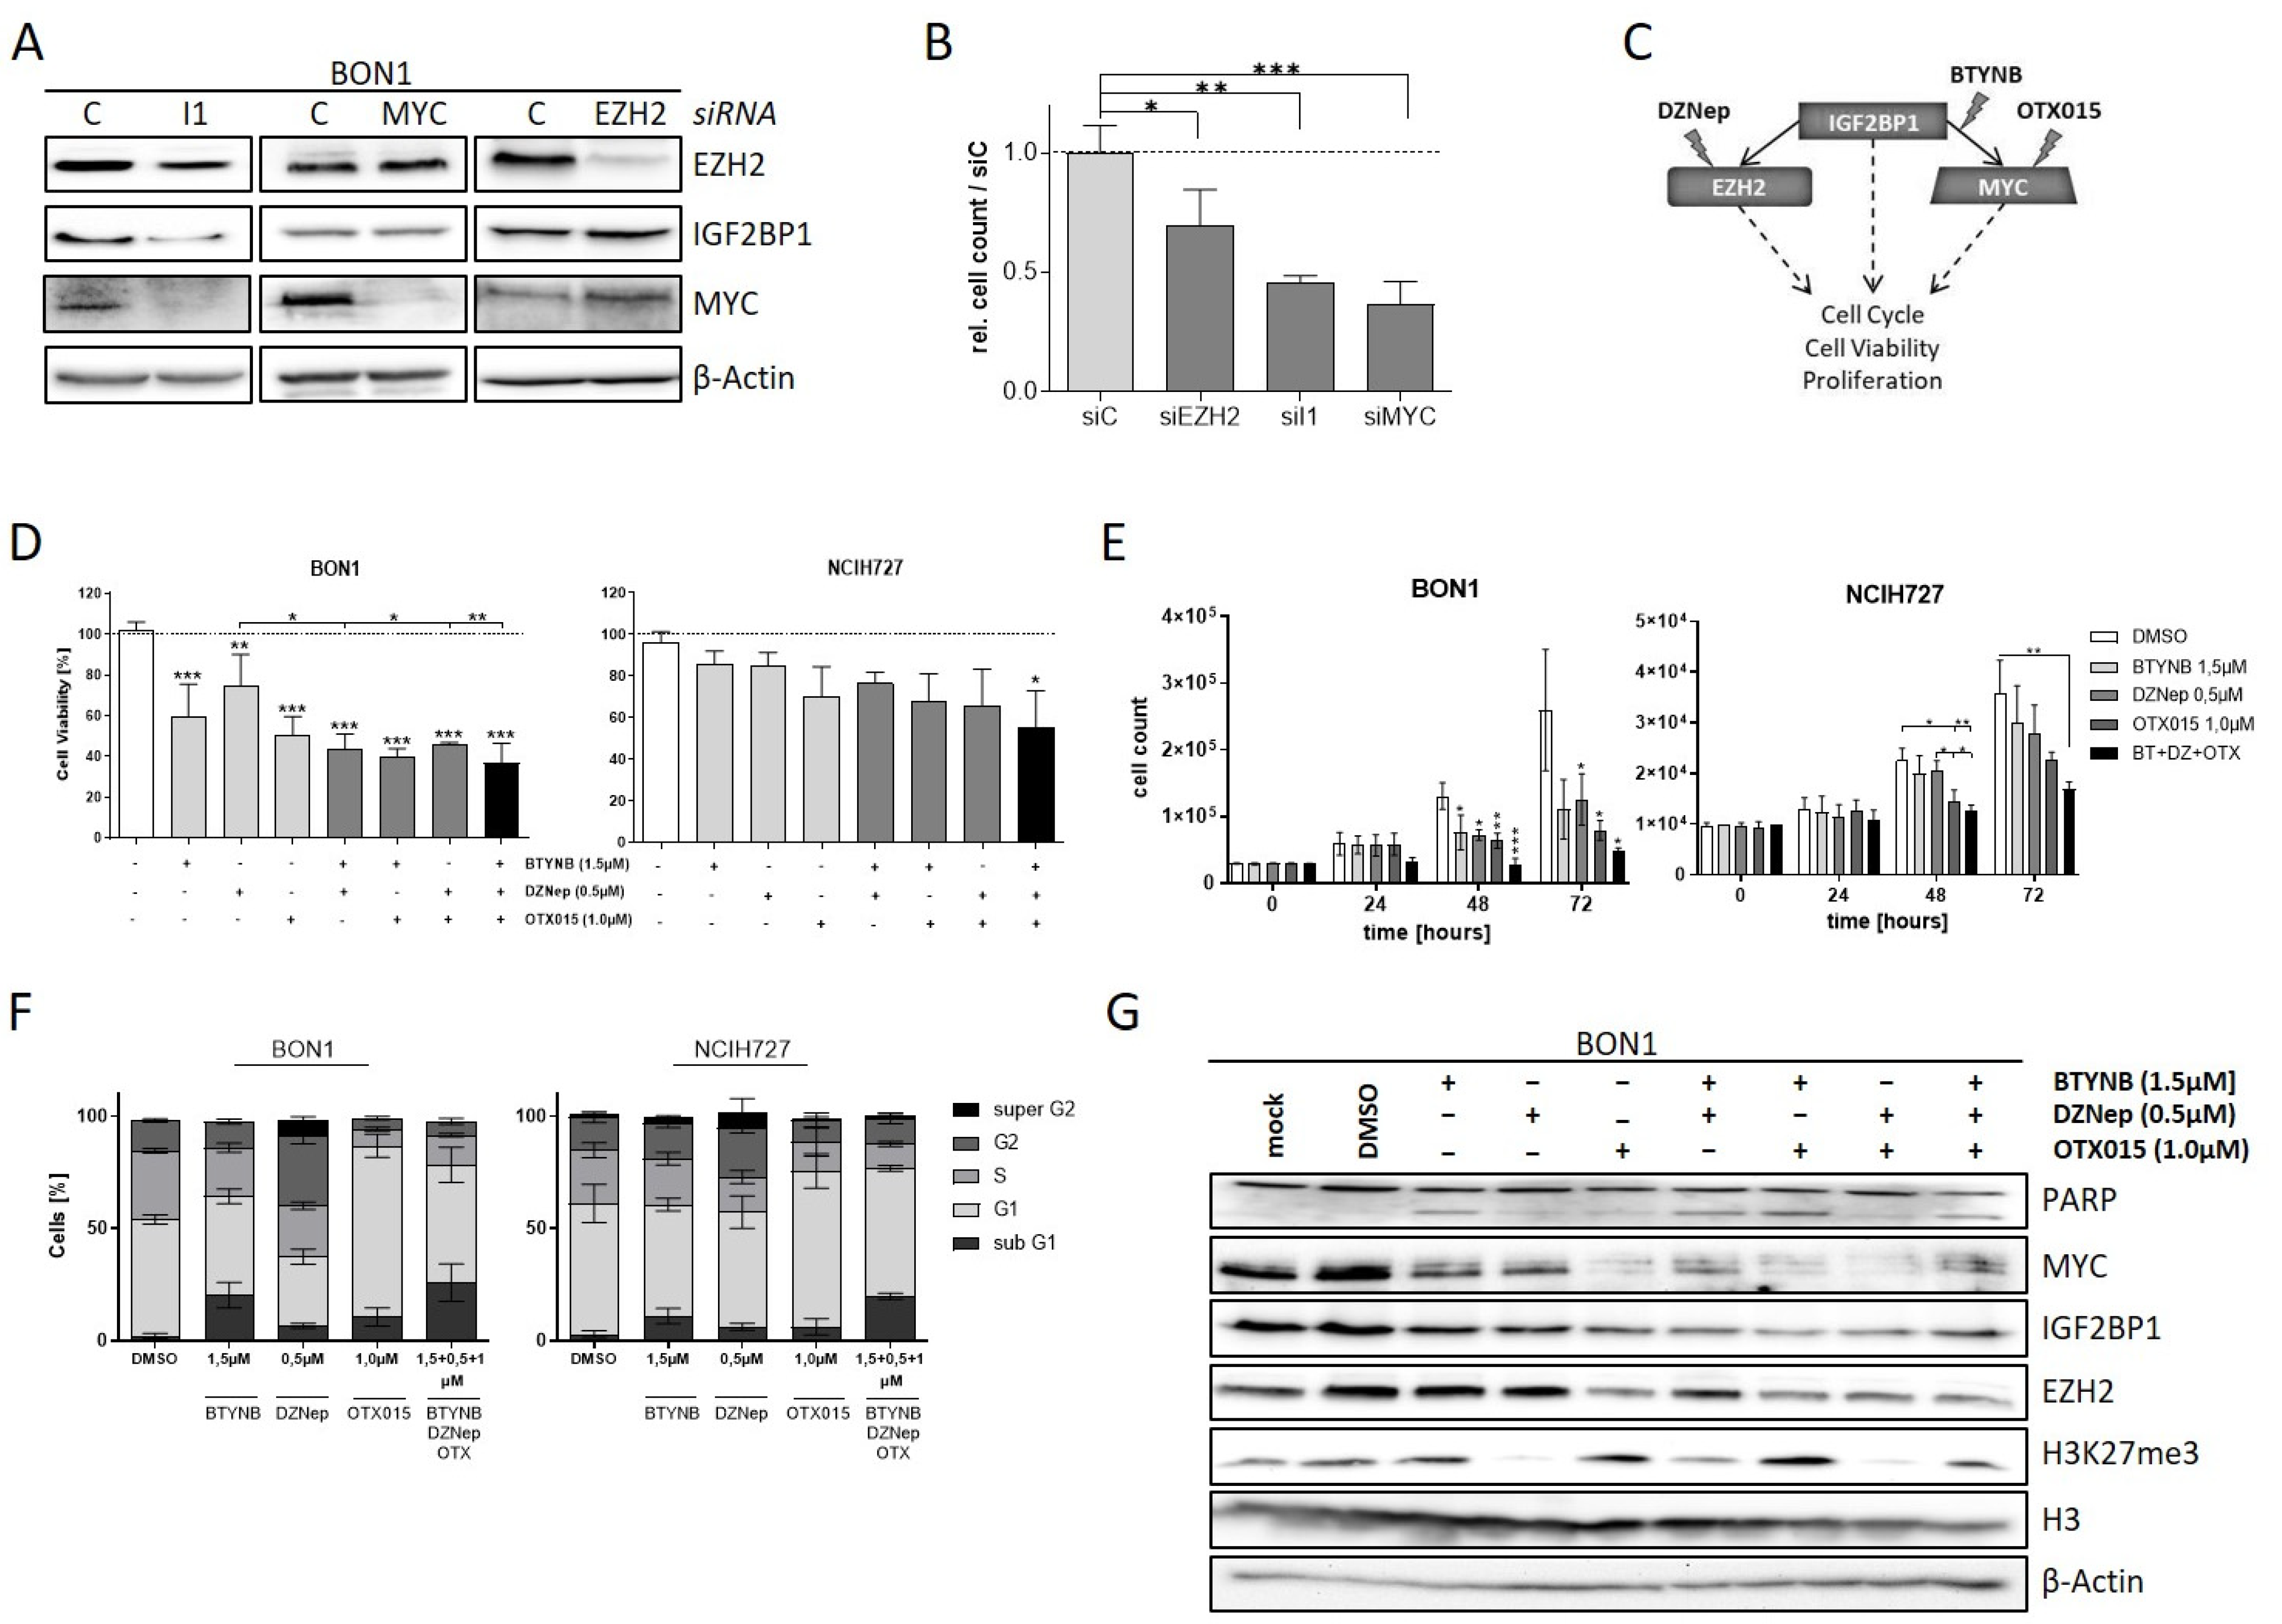
3.5. The IGF2BP1-MYC-EZH2 Network Is a Promising Therapeutic Target in NEN Cells
4. Discussion
5. Conclusions
Supplementary Materials
Author Contributions
Funding
Institutional Review Board Statement
Informed Consent Statement
Data Availability Statement
Acknowledgments
Conflicts of Interest
References
- Dasari, A.; Shen, C.; Halperin, D.; Zhao, B.; Zhou, S.; Xu, Y.; Shih, T.; Yao, J.C. Trends in the Incidence, Prevalence, and Survival Outcomes in Patients With Neuroendocrine Tumors in the United States. JAMA Oncol. 2017, 3, 1335–1342. [Google Scholar] [CrossRef] [PubMed]
- Oronsky, B.; Ma, P.C.; Morgensztern, D.; Carter, C.A. Nothing But NET: A Review of Neuroendocrine Tumors and Carcinomas. Neoplasia 2017, 19, 991–1002. [Google Scholar] [CrossRef] [PubMed]
- Bosman, F.T.; Carneiro, F.; Hruban, R.H.; Theise, N.D. WHO Classification of Tumours of the Digestive System, 4th ed.; International Agency for Research on Cancer: Lyon, France, 2010; Volume 3, pp. 1–417. [Google Scholar]
- Asamura, H.; Kameya, T.; Matsuno, Y.; Noguchi, M.; Tada, H.; Ishikawa, Y.; Yokose, T.; Jiang, S.X.; Inoue, T.; Nakagawa, K.; et al. Neuroendocrine neoplasms of the lung: A prognostic spectrum. J. Clin. Oncol. 2006, 24, 70–76. [Google Scholar] [CrossRef] [PubMed]
- Lewis, M.A.; Hobday, T.J. Treatment of neuroendocrine tumor liver metastases. Int. J. Hepatol. 2012, 2012, 973946. [Google Scholar] [CrossRef] [Green Version]
- Alexandraki, K.I.; Karapanagioti, A.; Karoumpalis, I.; Boutzios, G.; Kaltsas, G.A. Advances and Current Concepts in the Medical Management of Gastroenteropancreatic Neuroendocrine Neoplasms. BioMed Res. Int. 2017, 2017, 9856140. [Google Scholar] [CrossRef] [Green Version]
- Funakoshi, S.; Hashiguchi, A.; Teramoto, K.; Miyata, N.; Kurita, S.; Adachi, M.; Hamamoto, Y.; Higuchi, H.; Takaishi, H.; Hibi, T. Second-line chemotherapy for refractory small cell neuroendocrine carcinoma of the esophagus that relapsed after complete remission with irinotecan plus cisplatin therapy: Case report and review of the literature. Oncol. Lett. 2013, 5, 117–122. [Google Scholar] [CrossRef] [Green Version]
- Mafficini, A.; Scarpa, A. Genomic landscape of pancreatic neuroendocrine tumours: The International Cancer Genome Consortium. J. Endocrinol. 2018, 236, R161–R167. [Google Scholar] [CrossRef]
- Jiao, Y.; Shi, C.; Edil, B.H.; de Wilde, R.F.; Klimstra, D.S.; Maitra, A.; Schulick, R.D.; Tang, L.H.; Wolfgang, C.L.; Choti, M.A.; et al. DAXX/ATRX, MEN1, and mTOR pathway genes are frequently altered in pancreatic neuroendocrine tumors. Science 2011, 331, 1199–1203. [Google Scholar] [CrossRef] [Green Version]
- Scarpa, A.; Chang, D.K.; Nones, K.; Corbo, V.; Patch, A.-M.; Bailey, P.; Lawlor, R.T.; Johns, A.L.; Miller, D.K.; Mafficini, A.; et al. Whole-genome landscape of pancreatic neuroendocrine tumours. Nature 2017, 543, 65–71. [Google Scholar] [CrossRef]
- Di Domenico, A.; Wiedmer, T.; Marinoni, I.; Perren, A. Genetic and epigenetic drivers of neuroendocrine tumours (NET). Endocr.-Relat. Cancer 2017, 24, R315–R334. [Google Scholar] [CrossRef] [Green Version]
- Lin, W.; Watanabe, H.; Peng, S.; Francis, J.M.; Kaplan, N.; Pedamallu, C.S.; Ramachandran, A.; Agoston, A.; Bass, A.J.; Meyerson, M. Dynamic epigenetic regulation by menin during pancreatic islet tumor formation. Mol. Cancer Res. 2015, 13, 689–698. [Google Scholar] [CrossRef] [PubMed] [Green Version]
- Mafficini, A.; Scarpa, A. Genetics and Epigenetics of Gastroenteropancreatic Neuroendocrine Neoplasms. Endocr. Rev. 2019, 40, 506–536. [Google Scholar] [CrossRef] [PubMed]
- Muller, S.; Bley, N.; Busch, B.; Glass, M.; Lederer, M.; Misiak, C.; Fuchs, T.; Wedler, A.; Haase, J.; Bertoldo, J.B.; et al. The oncofetal RNA-binding protein IGF2BP1 is a druggable, post-transcriptional super-enhancer of E2F-driven gene expression in cancer. Nucleic Acids Res. 2020, 48, 8576–8590. [Google Scholar] [CrossRef] [PubMed]
- Bell, J.L.; Wächter, K.; Mühleck, B.; Pazaitis, N.; Köhn, M.; Lederer, M.; Hüttelmaier, S. Insulin-like growth factor 2 mRNA-binding proteins (IGF2BPs): Post-transcriptional drivers of cancer progression? Cell. Mol. Life Sci. CMLS 2013, 70, 2657–2675. [Google Scholar] [CrossRef] [Green Version]
- Lederer, M.; Bley, N.; Schleifer, C.; Hüttelmaier, S. The role of the oncofetal IGF2 mRNA-binding protein 3 (IGF2BP3) in cancer. Semin. Cancer Biol. 2014, 29, 3–12. [Google Scholar] [CrossRef] [Green Version]
- Muller, S.; Bley, N.; Glass, M.; Busch, B.; Rousseau, V.; Misiak, D.; Fuchs, T.; Lederer, M.; Huttelmaier, S. IGF2BP1 enhances an aggressive tumor cell phenotype by impairing miRNA-directed downregulation of oncogenic factors. Nucleic Acids Res. 2018, 46, 6285–6303. [Google Scholar] [CrossRef]
- Bell, J.L.; Turlapati, R.; Liu, T.; Schulte, J.H.; Hüttelmaier, S. IGF2BP1 harbors prognostic significance by gene gain and diverse expression in neuroblastoma. J. Clin. Oncol. Off. J. Am. Soc. Clin. Oncol. 2015, 33, 1285–1293. [Google Scholar] [CrossRef] [Green Version]
- Gutschner, T.; Hammerle, M.; Pazaitis, N.; Bley, N.; Fiskin, E.; Uckelmann, H.; Heim, A.; Grobeta, M.; Hofmann, N.; Geffers, R.; et al. Insulin-like growth factor 2 mRNA-binding protein 1 (IGF2BP1) is an important protumorigenic factor in hepatocellular carcinoma. Hepatology 2014, 59, 1900–1911. [Google Scholar] [CrossRef]
- Ghoshal, A.; Rodrigues, L.C.; Gowda, C.P.; Elcheva, I.A.; Liu, Z.; Abraham, T.; Spiegelman, V.S. Extracellular vesicle-dependent effect of RNA-binding protein IGF2BP1 on melanoma metastasis. Oncogene 2019, 38, 4182–4196. [Google Scholar] [CrossRef]
- Zirkel, A.; Lederer, M.; Stohr, N.; Pazaitis, N.; Huttelmaier, S. IGF2BP1 promotes mesenchymal cell properties and migration of tumor-derived cells by enhancing the expression of LEF1 and SNAI2 (SLUG). Nucleic Acids Res. 2013, 41, 6618–6636. [Google Scholar] [CrossRef] [Green Version]
- Elcheva, I.A.; Wood, T.; Chiarolanzio, K.; Chim, B.; Wong, M.; Singh, V.; Gowda, C.P.; Lu, Q.; Hafner, M.; Dovat, S.; et al. RNA-binding protein IGF2BP1 maintains leukemia stem cell properties by regulating HOXB4, MYB, and ALDH1A1. Leukemia 2020, 34, 1354–1363. [Google Scholar] [CrossRef] [PubMed]
- Muller, S.; Glass, M.; Singh, A.K.; Haase, J.; Bley, N.; Fuchs, T.; Lederer, M.; Dahl, A.; Huang, H.; Chen, J.; et al. IGF2BP1 promotes SRF-dependent transcription in cancer in a m6A- and miRNA-dependent manner. Nucleic Acids Res. 2019, 47, 375–390. [Google Scholar] [CrossRef] [PubMed]
- Faye, M.D.; Beug, S.T.; Graber, T.E.; Earl, N.; Xiang, X.; Wild, B.; Langlois, S.; Michaud, J.; Cowan, K.N.; Korneluk, R.G.; et al. IGF2BP1 controls cell death and drug resistance in rhabdomyosarcomas by regulating translation of cIAP1. Oncogene 2015, 34, 1532–1541. [Google Scholar] [CrossRef] [PubMed]
- Weidensdorfer, D.; Stöhr, N.; Baude, A.; Lederer, M.; Köhn, M.; Schierhorn, A.; Buchmeier, S.; Wahle, E.; Hüttelmaier, S. Control of c-myc mRNA stability by IGF2BP1-associated cytoplasmic RNPs. RNA 2009, 15, 104–115. [Google Scholar] [CrossRef] [Green Version]
- Rickman, D.S.; Schulte, J.H.; Eilers, M. The Expanding World of N-MYC-Driven Tumors. Cancer Discov. 2018, 8, 150–163. [Google Scholar] [CrossRef] [Green Version]
- Huang, H.; Weng, H.; Sun, W.; Qin, X.; Shi, H.; Wu, H.; Zhao, B.S.; Mesquita, A.; Liu, C.; Yuan, C.L.; et al. Recognition of RNA N(6)-methyladenosine by IGF2BP proteins enhances mRNA stability and translation. Nat. Cell Biol. 2018, 20, 285–295. [Google Scholar] [CrossRef]
- Berthon, C.; Raffoux, E.; Thomas, X.; Vey, N.; Gomez-Roca, C.; Yee, K.; Taussig, D.C.; Rezai, K.; Roumier, C.; Herait, P.; et al. Bromodomain inhibitor OTX015 in patients with acute leukaemia: A dose-escalation, phase 1 study. Lancet Haematol. 2016, 3, e186–e195. [Google Scholar] [CrossRef]
- Doroshow, D.B.; Eder, J.P.; LoRusso, P.M. BET inhibitors: A novel epigenetic approach. Ann. Oncol. 2017, 28, 1776–1787. [Google Scholar] [CrossRef]
- Sparanese, D.; Lee, C.H. CRD-BP shields c-myc and MDR-1 RNA from endonucleolytic attack by a mammalian endoribonuclease. Nucleic Acids Res. 2007, 35, 1209–1221. [Google Scholar] [CrossRef] [Green Version]
- Busch, B.; Bley, N.; Muller, S.; Glass, M.; Misiak, D.; Lederer, M.; Vetter, M.; Strauss, H.G.; Thomssen, C.; Huttelmaier, S. The oncogenic triangle of HMGA2, LIN28B and IGF2BP1 antagonizes tumor-suppressive actions of the let-7 family. Nucleic Acids Res. 2016, 44, 3845–3864. [Google Scholar] [CrossRef]
- Keller, M.P.; Choi, Y.; Wang, P.; Davis, D.B.; Rabaglia, M.E.; Oler, A.T.; Stapleton, D.S.; Argmann, C.; Schueler, K.L.; Edwards, S.; et al. A gene expression network model of type 2 diabetes links cell cycle regulation in islets with diabetes susceptibility. Genome Res. 2008, 18, 706–716. [Google Scholar] [CrossRef] [PubMed] [Green Version]
- Drexler, H.G.; Uphoff, C.C. Mycoplasma contamination of cell cultures: Incidence, sources, effects, detection, elimination, prevention. Cytotechnology 2002, 39, 75–90. [Google Scholar] [CrossRef] [PubMed]
- Hanahan, D. Heritable formation of pancreatic ß-cell tumours in transgenic mice expressing recombinant insulin/simian virus 40 oncogenes. Nature 1985, 315, 115–122. [Google Scholar] [CrossRef] [PubMed]
- Scott, A.T.; Weitz, M.; Breheny, P.J.; Ear, P.H.; Darbro, B.; Brown, B.J.; Braun, T.A.; Li, G.; Umesalma, S.; Kaemmer, C.A.; et al. Gene Expression Signatures Identify Novel Therapeutics for Metastatic Pancreatic Neuroendocrine Tumors. Clin. Cancer Res. 2020, 26, 2011–2021. [Google Scholar] [CrossRef]
- Garcia-Gutierrez, L.; Bretones, G.; Molina, E.; Arechaga, I.; Symonds, C.; Acosta, J.C.; Blanco, R.; Fernandez, A.; Alonso, L.; Sicinski, P.; et al. Myc stimulates cell cycle progression through the activation of Cdk1 and phosphorylation of p27. Sci Rep. 2019, 9, 18693. [Google Scholar] [CrossRef] [Green Version]
- Comet, I.; Riising, E.M.; Leblanc, B.; Helin, K. Maintaining cell identity: PRC2-mediated regulation of transcription and cancer. Nat. Rev. Cancer 2016, 16, 803–810. [Google Scholar] [CrossRef]
- Koh, C.M.; Iwata, T.; Zheng, Q.; Bethel, C.; Yegnasubramanian, S.; De Marzo, A.M. Myc enforces overexpression of EZH2 in early prostatic neoplasia via transcriptional and post-transcriptional mechanisms. Oncotarget 2011, 2, 669–683. [Google Scholar] [CrossRef] [Green Version]
- Yang, R.; Wang, M.; Zhang, G.; Bao, Y.; Wu, Y.; Li, X.; Yang, W.; Cui, H. E2F7-EZH2 axis regulates PTEN/AKT/mTOR signalling and glioblastoma progression. Br. J. Cancer 2020, 123, 1445–1455. [Google Scholar] [CrossRef]
- Yamaguchi, H.; Hung, M.C. Regulation and Role of EZH2 in Cancer. Cancer Res. Treat. 2014, 46, 209–222. [Google Scholar] [CrossRef]
- Lu, W.; Liu, S.; Li, B.; Xie, Y.; Izban, M.G.; Ballard, B.R.; Sathyanarayana, S.A.; Adunyah, S.E.; Matusik, R.J.; Chen, Z. SKP2 loss destabilizes EZH2 by promoting TRAF6-mediated ubiquitination to suppress prostate cancer. Oncogene 2017, 36, 1364–1373. [Google Scholar] [CrossRef] [Green Version]
- Chu, C.S.; Lo, P.W.; Yeh, Y.H.; Hsu, P.H.; Peng, S.H.; Teng, Y.C.; Kang, M.L.; Wong, C.H.; Juan, L.J. O-GlcNAcylation regulates EZH2 protein stability and function. Proc. Natl. Acad. Sci. USA 2014, 111, 1355–1360. [Google Scholar] [CrossRef] [PubMed] [Green Version]
- Xu, J.H.; Hu, S.L.; Shen, G.D.; Shen, G. Tumor suppressor genes and their underlying interactions in paclitaxel resistance in cancer therapy. Cancer Cell Int. 2016, 16, 13. [Google Scholar] [CrossRef] [PubMed] [Green Version]
- Benetatos, L.; Vartholomatos, G.; Hatzimichael, E. Polycomb group proteins and MYC: The cancer connection. Cell. Mol. Life Sci. 2014, 71, 257–269. [Google Scholar] [CrossRef]
- Salvatori, B.; Iosue, I.; Djodji Damas, N.; Mangiavacchi, A.; Chiaretti, S.; Messina, M.; Padula, F.; Guarini, A.; Bozzoni, I.; Fazi, F.; et al. Critical Role of c-Myc in Acute Myeloid Leukemia Involving Direct Regulation of miR-26a and Histone Methyltransferase EZH2. Genes Cancer 2011, 2, 585–592. [Google Scholar] [CrossRef] [PubMed] [Green Version]
- Neri, F.; Zippo, A.; Krepelova, A.; Cherubini, A.; Rocchigiani, M.; Oliviero, S. Myc regulates the transcription of the PRC2 gene to control the expression of developmental genes in embryonic stem cells. Mol. Cell. Biol. 2012, 32, 840–851. [Google Scholar] [CrossRef] [PubMed] [Green Version]
- Lemm, I.; Ross, J. Regulation of c-myc mRNA decay by translational pausing in a coding region instability determinant. Mol. Cell. Biol. 2002, 22, 3959–3969. [Google Scholar] [CrossRef] [Green Version]
- Fan, T.; Jiang, S.; Chung, N.; Alikhan, A.; Ni, C.; Lee, C.C.; Hornyak, T.J. EZH2-dependent suppression of a cellular senescence phenotype in melanoma cells by inhibition of p21/CDKN1A expression. Mol. Cancer Res. 2011, 9, 418–429. [Google Scholar] [CrossRef] [Green Version]
- Ougolkov, A.V.; Bilim, V.N.; Billadeau, D.D. Regulation of pancreatic tumor cell proliferation and chemoresistance by the histone methyltransferase enhancer of zeste homologue 2. Clin. Cancer Res. 2008, 14, 6790–6796. [Google Scholar] [CrossRef] [Green Version]
- Ito, T.; Teo, Y.V.; Evans, S.A.; Neretti, N.; Sedivy, J.M. Regulation of Cellular Senescence by Polycomb Chromatin Modifiers through Distinct DNA Damage- and Histone Methylation-Dependent Pathways. Cell Rep. 2018, 22, 3480–3492. [Google Scholar] [CrossRef] [Green Version]
- Mahapatra, L.; Andruska, N.; Mao, C.; Le, J.; Shapiro, D.J. A Novel IMP1 Inhibitor, BTYNB, Targets c-Myc and Inhibits Melanoma and Ovarian Cancer Cell Proliferation. Transl. Oncol. 2017, 10, 818–827. [Google Scholar] [CrossRef]
- Coude, M.M.; Braun, T.; Berrou, J.; Dupont, M.; Bertrand, S.; Masse, A.; Raffoux, E.; Itzykson, R.; Delord, M.; Riveiro, M.E.; et al. BET inhibitor OTX015 targets BRD2 and BRD4 and decreases c-MYC in acute leukemia cells. Oncotarget 2015, 6, 17698–17712. [Google Scholar] [CrossRef] [PubMed] [Green Version]
- Puppe, J.; Drost, R.; Liu, X.; Joosse, S.A.; Evers, B.; Cornelissen-Steijger, P.; Nederlof, P.; Yu, Q.; Jonkers, J.; van Lohuizen, M.; et al. BRCA1-deficient mammary tumor cells are dependent on EZH2 expression and sensitive to Polycomb Repressive Complex 2-inhibitor 3-deazaneplanocin A. Breast Cancer Res. 2009, 11, R63. [Google Scholar] [CrossRef] [PubMed] [Green Version]
- Tan, J.; Yang, X.; Zhuang, L.; Jiang, X.; Chen, W.; Lee, P.L.; Karuturi, R.K.; Tan, P.B.; Liu, E.T.; Yu, Q. Pharmacologic disruption of Polycomb-repressive complex 2-mediated gene repression selectively induces apoptosis in cancer cells. Genes Dev. 2007, 21, 1050–1063. [Google Scholar] [CrossRef] [PubMed] [Green Version]
- Noubissi, F.K.; Nikiforov, M.A.; Colburn, N.; Spiegelman, V.S. Transcriptional Regulation of CRD-BP by c-myc: Implications for c-myc Functions. Genes Cancer 2010, 1, 1074–1082. [Google Scholar] [CrossRef] [PubMed]
- Bracken, A.P.; Pasini, D.; Capra, M.; Prosperini, E.; Colli, E.; Helin, K. EZH2 is downstream of the pRB-E2F pathway, essential for proliferation and amplified in cancer. EMBO J. 2003, 22, 5323–5335. [Google Scholar] [CrossRef] [PubMed] [Green Version]
- Kalashnikova, E.V.; Revenko, A.S.; Gemo, A.T.; Andrews, N.P.; Tepper, C.G.; Zou, J.X.; Cardiff, R.D.; Borowsky, A.D.; Chen, H.W. ANCCA/ATAD2 overexpression identifies breast cancer patients with poor prognosis, acting to drive proliferation and survival of triple-negative cells through control of B-Myb and EZH2. Cancer Res. 2010, 70, 9402–9412. [Google Scholar] [CrossRef] [Green Version]
- Duan, Z.; Zou, J.X.; Yang, P.; Wang, Y.; Borowsky, A.D.; Gao, A.C.; Chen, H.W. Developmental and androgenic regulation of chromatin regulators EZH2 and ANCCA/ATAD2 in the prostate Via MLL histone methylase complex. Prostate 2013, 73, 455–466. [Google Scholar] [CrossRef]
- Zhao, Y.; Shi, Y.; Shen, H.; Xie, W. m(6)A-binding proteins: The emerging crucial performers in epigenetics. J. Hematol. Oncol. 2020, 13, 35. [Google Scholar] [CrossRef] [Green Version]
- Köbel, M.; Weidensdorfer, D.; Reinke, C.; Lederer, M.; Schmitt, W.D.; Zeng, K.; Thomssen, C.; Hauptmann, S.; Hüttelmaier, S. Expression of the RNA-binding protein IMP1 correlates with poor prognosis in ovarian carcinoma. Oncogene 2007, 26, 7584–7589. [Google Scholar] [CrossRef] [Green Version]
- Elcheva, I.; Goswami, S.; Noubissi, F.K.; Spiegelman, V.S. CRD-BP protects the coding region of betaTrCP1 mRNA from miR-183-mediated degradation. Mol. Cell 2009, 35, 240–246. [Google Scholar] [CrossRef] [Green Version]
- Jonson, L.; Christiansen, J.; Hansen, T.V.O.; Vikesa, J.; Yamamoto, Y.; Nielsen, F.C. IMP3 RNP safe houses prevent miRNA-directed HMGA2 mRNA decay in cancer and development. Cell Rep. 2014, 7, 539–551. [Google Scholar] [CrossRef] [PubMed] [Green Version]
- Gan, L.; Yang, Y.; Li, Q.; Feng, Y.; Liu, T.; Guo, W. Epigenetic regulation of cancer progression by EZH2: From biological insights to therapeutic potential. Biomark. Res. 2018, 6, 10. [Google Scholar] [CrossRef] [PubMed]
- Pasini, D.; Di Croce, L. Emerging roles for Polycomb proteins in cancer. Curr. Opin. Genet. Dev. 2016, 36, 50–58. [Google Scholar] [CrossRef] [PubMed]
- Yamagishi, M.; Uchimaru, K. Targeting EZH2 in cancer therapy. Curr. Opin. Oncol. 2017, 29, 375–381. [Google Scholar] [CrossRef] [PubMed]
- Faviana, P.; Marconcini, R.; Ricci, S.; Galli, L.; Lippolis, P.; Farci, F.; Castagna, M.; Boldrini, L. EZH2 Expression in Intestinal Neuroendocrine Tumors. Appl. Immunohistochem. Mol. Morphol. 2019, 27, 689–693. [Google Scholar] [CrossRef]
- Barazeghi, E.; Hellman, P.; Norlen, O.; Westin, G.; Stalberg, P. EZH2 presents a therapeutic target for neuroendocrine tumors of the small intestine. Sci. Rep. 2021, 11, 22733. [Google Scholar] [CrossRef]
- Sparmann, A.; van Lohuizen, M. Polycomb silencers control cell fate, development and cancer. Nat. Rev. Cancer 2006, 6, 846–856. [Google Scholar] [CrossRef]
- Varambally, S.; Dhanasekaran, S.M.; Zhou, M.; Barrette, T.R.; Kumar-Sinha, C.; Sanda, M.G.; Ghosh, D.; Pienta, K.J.; Sewalt, R.G.; Otte, A.P.; et al. The polycomb group protein EZH2 is involved in progression of prostate cancer. Nature 2002, 419, 624–629. [Google Scholar] [CrossRef]
- Yao, Y.; Hu, H.; Yang, Y.; Zhou, G.; Shang, Z.; Yang, X.; Sun, K.; Zhan, S.; Yu, Z.; Li, P.; et al. Downregulation of Enhancer of Zeste Homolog 2 (EZH2) is essential for the Induction of Autophagy and Apoptosis in Colorectal Cancer Cells. Genes 2016, 7, 83. [Google Scholar] [CrossRef]
- Zingg, D.; Debbache, J.; Schaefer, S.M.; Tuncer, E.; Frommel, S.C.; Cheng, P.; Arenas-Ramirez, N.; Haeusel, J.; Zhang, Y.; Bonalli, M.; et al. The epigenetic modifier EZH2 controls melanoma growth and metastasis through silencing of distinct tumour suppressors. Nat. Commun. 2015, 6, 6051. [Google Scholar] [CrossRef] [Green Version]
- Mahara, S.; Lee, P.L.; Feng, M.; Tergaonkar, V.; Chng, W.J.; Yu, Q. HIFI-alpha activation underlies a functional switch in the paradoxical role of Ezh2/PRC2 in breast cancer. Proc. Natl. Acad. Sci. USA 2016, 113, E3735–E3744. [Google Scholar] [CrossRef] [PubMed] [Green Version]
- Zoabi, M.; Sadeh, R.; de Bie, P.; Marquez, V.E.; Ciechanover, A. PRAJA1 is a ubiquitin ligase for the polycomb repressive complex 2 proteins. Biochem. Biophys. Res. Commun. 2011, 408, 393–398. [Google Scholar] [CrossRef] [PubMed]
- April-Monn, S.L.; Andreasi, V.; Schiavo Lena, M.; Sadowski, M.C.; Kim-Fuchs, C.; Buri, M.C.; Ketkar, A.; Maire, R.; Di Domenico, A.; Schrader, J.; et al. EZH2 Inhibition as New Epigenetic Treatment Option for Pancreatic Neuroendocrine Neoplasms (PanNENs). Cancers 2021, 13, 5014. [Google Scholar] [CrossRef] [PubMed]


Publisher’s Note: MDPI stays neutral with regard to jurisdictional claims in published maps and institutional affiliations. |
© 2022 by the authors. Licensee MDPI, Basel, Switzerland. This article is an open access article distributed under the terms and conditions of the Creative Commons Attribution (CC BY) license (https://creativecommons.org/licenses/by/4.0/).
Share and Cite
Sperling, F.; Misiak, D.; Hüttelmaier, S.; Michl, P.; Griesmann, H. IGF2BP1 Promotes Proliferation of Neuroendocrine Neoplasms by Post-Transcriptional Enhancement of EZH2. Cancers 2022, 14, 2121. https://doi.org/10.3390/cancers14092121
Sperling F, Misiak D, Hüttelmaier S, Michl P, Griesmann H. IGF2BP1 Promotes Proliferation of Neuroendocrine Neoplasms by Post-Transcriptional Enhancement of EZH2. Cancers. 2022; 14(9):2121. https://doi.org/10.3390/cancers14092121
Chicago/Turabian StyleSperling, Florian, Danny Misiak, Stefan Hüttelmaier, Patrick Michl, and Heidi Griesmann. 2022. "IGF2BP1 Promotes Proliferation of Neuroendocrine Neoplasms by Post-Transcriptional Enhancement of EZH2" Cancers 14, no. 9: 2121. https://doi.org/10.3390/cancers14092121
APA StyleSperling, F., Misiak, D., Hüttelmaier, S., Michl, P., & Griesmann, H. (2022). IGF2BP1 Promotes Proliferation of Neuroendocrine Neoplasms by Post-Transcriptional Enhancement of EZH2. Cancers, 14(9), 2121. https://doi.org/10.3390/cancers14092121