
Change of Computed Tomography-Based Body Composition after Adrenalectomy in Patients with Pheochromocytoma


Abstract
:Simple Summary
Abstract
1. Introduction
2. Materials and Methods
2.1. Study Participants
2.2. Laboratory Measurements
2.3. CT Image Acquisition
2.4. Analysis of CT Images and BoAdy Composition
2.5. Definition of Visceral Obesity and Sarcopenia
2.6. Statistical Analysis
3. Results
4. Discussion
5. Conclusions
Author Contributions
Funding
Institutional Review Board Statement
Informed Consent Statement
Data Availability Statement
Conflicts of Interest
References
- Kim, J.H.; Moon, H.; Noh, J.; Lee, J.; Kim, S.G. Epidemiology and Prognosis of Pheochromocytoma/Paraganglioma in Korea: A Nationwide Study Based on the National Health Insurance Service. Endocrinol. Metab. 2020, 35, 157–164. [Google Scholar] [CrossRef] [PubMed]
- Ku, E.J.; Kim, K.J.; Kim, J.H.; Kim, M.K.; Ahn, C.H.; Lee, K.A.; Lee, S.H.; Lee, Y.-B.; Park, K.H.; Choi, Y.M.; et al. Diagnosis for Pheochromocytoma and Paraganglioma: A Joint Position Statement of the Korean Pheochromocytoma and Paraganglioma Task Force. Endocrinol. Metab. 2021, 36, 322–338. [Google Scholar] [CrossRef] [PubMed]
- Good, M.L.; Malekzadeh, P.; Ruff, S.M.; Gupta, S.; Copeland, A.; Pacak, K.; Nilubol, N.; Kebebew, E.; Patel, D. Surgical Resection of Pheochromocytomas and Paragangliomas is Associated with Lower Cholesterol Levels. World J. Surg. 2020, 44, 552–560. [Google Scholar] [CrossRef] [PubMed]
- Kim, B.-J.; Lee, S.H.; Koh, J.-M. Bone Health in Adrenal Disorders. Endocrinol. Metab. 2018, 33, 1–8. [Google Scholar] [CrossRef] [PubMed]
- Kim, B.-J.; Kwak, M.K.; Ahn, S.H.; Kim, H.; Lee, S.H.; Song, K.-H.; Suh, S.; Kim, J.H.; Koh, J.-M. Lower Bone Mass and Higher Bone Resorption in Pheochromocytoma: Importance of Sympathetic Activity on Human Bone. J. Clin. Endocrinol. Metab. 2017, 102, 2711–2718. [Google Scholar] [CrossRef] [Green Version]
- Roh, E.; Choi, K.M. Health Consequences of Sarcopenic Obesity: A Narrative Review. Front. Endocrinol. 2020, 11, 332. [Google Scholar] [CrossRef] [PubMed]
- Dao, T.; Green, A.E.; Kim, Y.A.; Bae, S.-J.; Ha, K.-T.; Gariani, K.; Lee, M.-R.; Menzies, K.J.; Ryu, D. Sarcopenia and Muscle Aging: A Brief Overview. Endocrinol. Metab. 2020, 35, 716–732. [Google Scholar] [CrossRef] [PubMed]
- Yoo, J.-I.; Lee, K.-H.; Choi, Y.; Lee, J.; Park, Y.-G. Poor Dietary Protein Intake in Elderly Population with Sarcopenia and Osteosar-copenia: A Nationwide Population-Based Study. J. Bone. Metab. 2020, 27, 301–310. [Google Scholar] [CrossRef]
- Kim, Y.S.; Sainz, R.D.; Molenaar, P.; Summers, R.J. Characterization of beta 1- and beta 2-adrenoceptors in rat skeletal muscles. Biochem. Pharmacol. 1991, 42, 1783–1789. [Google Scholar] [CrossRef]
- Lynch, G.S.; Ryall, J.G. Role of beta-adrenoceptor signaling in skeletal muscle: Implications for muscle wasting and disease. Physiol. Rev. 2008, 88, 729–767. [Google Scholar] [CrossRef] [Green Version]
- Barbe, P.; Millet, L.; Galitzky, J.; Lafontan, M.; Berlan, M. In situ assessment of the role of the beta 1-, beta 2- and beta 3-adrenoceptors in the control of lipolysis and nutritive blood flow in human subcutaneous adipose tissue. Br. J. Pharmacol. 1996, 117, 907–913. [Google Scholar] [CrossRef] [PubMed]
- Jocken, J.W.; Blaak, E.E. Catecholamine-induced lipolysis in adipose tissue and skeletal muscle in obesity. Physiol. Behav. 2008, 94, 219–230. [Google Scholar] [CrossRef] [PubMed]
- McElligott, M.A.; Barreto, A.; Lee-Yuh, C. Effect of continuous and intermittent clenbuterol feeding on rat growth rate and muscle. Comp. Biochem. Physiol. Part C Comp. Pharmacol. 1989, 92, 135–138. [Google Scholar] [CrossRef]
- Navegantes, L.C.C.; Resano, N.M.Z.; Migliorini, R.H.; Kettelhut, Í.C. Role of adrenoceptors and cAMP on the catecholamine-induced inhibition of proteolysis in rat skeletal muscle. Am. J. Physiol. Metab. 2000, 279, E663–E668. [Google Scholar] [CrossRef] [PubMed]
- Bahler, L.; Molenaars, R.; Verberne, H.; Holleman, F. Role of the autonomic nervous system in activation of human brown adipose tissue: A review of the literature. Diabetes Metab. 2015, 41, 437–445. [Google Scholar] [CrossRef] [PubMed]
- Wang, Q.; Zhang, M.; Ning, G.; Gu, W.; Su, T.; Xu, M.; Li, B.; Wang, W. Brown Adipose Tissue in Humans Is Activated by Elevated Plasma Catecholamines Levels and Is Inversely Related to Central Obesity. PLoS ONE 2011, 6, e21006. [Google Scholar] [CrossRef] [PubMed] [Green Version]
- Lee, S.H.; Kwak, M.K.; Ahn, S.H.; Kim, H.; Cho, Y.Y.; Suh, S.; Song, K.-H.; Koh, J.-M.; Kim, J.H.; Kim, B.-J. Change of skeletal muscle mass in patients with pheochromocytoma. J. Bone Miner. Metab. 2018, 37, 694–702. [Google Scholar] [CrossRef]
- Okamura, T.; Nakajima, Y.; Satoh, T.; Hashimoto, K.; Sapkota, S.; Yamada, E.; Okada, S.; Fukuda, J.; Higuchi, T.; Tsushima, Y.; et al. Changes in visceral and subcutaneous fat mass in patients with pheochromocytoma. Metabolism 2015, 64, 706–712. [Google Scholar] [CrossRef]
- Petrák, O.; Haluzíková, D.; Kaválková, P.; Štrauch, B.; Rosa, J.; Holaj, R.; Brabcová, V.A.; Michalsky, D.; Haluzík, M.; Zelinka, T.; et al. Changes in energy metabolism in pheochromocytoma. J. Clin. Endocrinol. Metab. 2013, 98, 1651–1658. [Google Scholar] [CrossRef] [Green Version]
- Jones, K.I.; Doleman, B.; Scott, S.; Lund, J.; Williams, J.P. Simple psoas cross-sectional area measurement is a quick and easy method to assess sarcopenia and predicts major surgical complications. Color. Dis. 2015, 17, O20–O26. [Google Scholar] [CrossRef] [Green Version]
- Mourtzakis, M.; Prado, C.M.; Lieffers, J.R.; Reiman, T.; McCargar, L.J.; Baracos, V.E. A practical and precise approach to quantification of body composition in cancer patients using computed tomography images acquired during routine care. Appl. Physiol. Nutr. Metab. 2008, 33, 997–1006. [Google Scholar] [CrossRef] [PubMed]
- Shuster, A.; Patlas, M.; Pinthus, J.H.; Mourtzakis, M. The clinical importance of visceral adiposity: A critical review of methods for visceral adipose tissue analysis. Br. J. Radiol. 2012, 85, 1–10. [Google Scholar] [CrossRef] [PubMed] [Green Version]
- Park, H.J.; Shin, Y.; Park, J.; Kim, H.; Lee, I.S.; Seo, D.-W.; Huh, J.; Lee, T.Y.; Park, T.; Lee, J.; et al. Development and Validation of a Deep Learning System for Segmentation of Abdominal Muscle and Fat on Computed Tomography. Korean J. Radiol. 2020, 21, 88–100. [Google Scholar] [CrossRef] [PubMed]
- Ha, J.; Park, T.; Kim, H.-K.; Shin, Y.; Ko, Y.; Kim, D.W.; Sung, Y.S.; Lee, J.; Ham, S.J.; Khang, S.; et al. Development of a fully automatic deep learning system for L3 selection and body composition assessment on computed tomography. Sci. Rep. 2021, 11, 21656. [Google Scholar] [CrossRef] [PubMed]
- Kim, D.W.; Kim, K.W.; Ko, Y.; Park, T.; Khang, S.; Jeong, H.; Koo, K.; Lee, J.; Kim, H.-K.; Ha, J.; et al. Assessment of Myosteatosis on Computed Tomography by Automatic Generation of a Muscle Quality Map Using a Web-Based Toolkit: Feasibility Study. JMIR Med. Inform. 2020, 8, e23049. [Google Scholar] [CrossRef]
- Examination Committee of Criteria for ‘Obesity Disease’ in Japan; Japan Society for the Study of Obesity. New criteria for ’obesity disease’ in Japan. Circ. J. 2002, 66, 987–992. [Google Scholar] [CrossRef] [Green Version]
- Kim, E.H.; Kim, K.W.; Shin, Y.; Lee, J.; Ko, Y.; Kim, Y.-J.; Lee, M.J.; Bae, S.-J.; Park, S.W.; Choe, J.; et al. Reference Data and T-Scores of Lumbar Skeletal Muscle Area and Its Skeletal Muscle Indices Measured by CT Scan in a Healthy Korean Population. J. Gerontol. Ser. A 2021, 76, 265–271. [Google Scholar] [CrossRef]
- Wiesner, T.D.; Blüher, M.; Windgassen, M.; Paschke, R. Improvement of Insulin Sensitivity after Adrenalectomy in Patients with Pheochromocytoma. J. Clin. Endocrinol. Metab. 2003, 88, 3632–3636. [Google Scholar] [CrossRef] [PubMed]
- Resmini, E.; Minuto, F.; Colao, A.; Ferone, D. Secondary diabetes associated with principal endocrinopathies: The impact of new treatment modalities. Geol. Rundsch. 2009, 46, 85–95. [Google Scholar] [CrossRef]
- Steinberg, D.; Huttunen, J.K. The role of cyclic AMP in activation of hormone-sensitive lipase of adipose tissue. Adv. Cycl. Nucleotide Res. 1972, 1, 47–62. [Google Scholar]
- Langin, D.; Dicker, A.; Tavernier, G.; Hoffstedt, J.; Mairal, A.; Rydén, M.; Arner, E.; Sicard, A.; Jenkins, C.M.; Viguerie, N.; et al. Adipocyte Lipases and Defect of Lipolysis in Human Obesity. Diabetes 2005, 54, 3190–3197. [Google Scholar] [CrossRef] [PubMed] [Green Version]
- Rydén, M.; Jocken, J.; van Harmelen, V.; Dicker, A.; Hoffstedt, J.; Wirén, M.; Blomqvist, L.; Mairal, A.; Langin, D.; Blaak, E.; et al. Comparative studies of the role of hormone-sensitive lipase and adipose triglyceride lipase in human fat cell lipolysis. Am. J. Physiol. Metab. 2007, 292, E1847–E1855. [Google Scholar] [CrossRef] [PubMed] [Green Version]
- Cannon, B.; Nedergaard, J. Brown Adipose Tissue: Function and Physiological Significance. Physiol. Rev. 2004, 84, 277–359. [Google Scholar] [CrossRef]
- Morimoto, C.; Tsujita, T.; Okuda, H. Norepinephrine-induced lipolysis in rat fat cells from visceral and subcutaneous sites: Role of hormone-sensitive lipase and lipid droplets. J. Lipid Res. 1997, 38, 132–138. [Google Scholar] [CrossRef]
- Reynisdottir, S.; Wahrenberg, H.; Carlström, K.; Rössner, S.; Arner, P. Catecholamine resistance in fat cells of women with up-per-body obesity due to decreased expression of beta 2-adrenoceptors. Diabetologia 1994, 37, 428–435. [Google Scholar] [CrossRef]
- Hoffstedt, J.; Arner, P.; Hellers, G.; Lönnqvist, F. Variation in adrenergic regulation of lipolysis between omental and subcutaneous adipocytes from obese and non-obese men. J. Lipid Res. 1997, 38, 795–804. [Google Scholar] [CrossRef]
- Kline, W.O.; Panaro, F.J.; Yang, H.; Bodine, S.C. Rapamycin inhibits the growth and muscle-sparing effects of clenbuterol. J. Appl. Physiol. 2007, 102, 740–747. [Google Scholar] [CrossRef] [Green Version]
- Bacurau, A.V.N.; Jardim, M.A.; Ferreira, J.C.B.; Bechara, L.R.G.; Bueno, C.R.; Alba-Loureiro, T.C.; Negrao, C.E.; Casarini, D.E.; Curi, R.; Ramires, P.R.; et al. Sympathetic hyperactivity differentially affects skeletal muscle mass in developing heart failure: Role of exercise training. J. Appl. Physiol. 2009, 106, 1631–1640. [Google Scholar] [CrossRef] [Green Version]


| Variables | Participants (n = 313) | Variables | Participants (n = 313) |
|---|---|---|---|
| Age (years) | 50.6 ± 13.6 | Systolic BP (mmHg) | 127.4 ± 19.2 |
| Women, n (%) | 171 (54.6) | Diastolic BP (mmHg) | 79.0 ± 11.9 |
| Height (cm) | 162.2 ± 8.4 | Calcium (mg/dL) | 9.1 ± 0.5 |
| Weight (kg) | 63.4 ± 11.4 | Phosphorus (mg/dL) | 3.8 ± 0.7 |
| Body mass index (kg/m2) | 24.0 ± 3.5 | Glucose (mg/dL) | 118.5 ± 36.5 |
| Genetic mutations, n (%) | 20 (6.4) | HbA1c (%) | 6.1 ± 0.9 |
| Metastatic or bilateral lesion, n (%) | 29 (9.3) | Creatinine (mg/dL) | 0.79 ± 0.19 |
| Type of operation, n (%) | Total cholesterol (mg/dL) | 184.0 ± 37.3 | |
| Laparoscopic | 215 (68.7) | AST (IU/L) | 21.9 ± 8.1 |
| Open | 98 (31.3) | ALT (IU/L) | 22.3 ± 14.2 |
| Variables | Before ADX | After ADX | p |
|---|---|---|---|
| Catecholamine metabolites | |||
| Plasma metanephrine (nmol/L), median (IQR) | 0.44 (0.18–2.26) | 0.10 (0.08–0.13) | <0.001 |
| Plasma normetanephrine (nmol/L), median (IQR) | 3.64 (1.56–9.46) | 0.50 (0.37–0.63) | <0.001 |
| Urine metanephrine (μg/day), median (IQR) | 355.5 (110.5–1456.2) | 45.5 (29.5–70.8) | <0.001 |
| Urine normetanephrine (μg/day), median (IQR) | 1180.4 (564.2–2673.6) | 178.7 (128.2–232.0) | <0.001 |
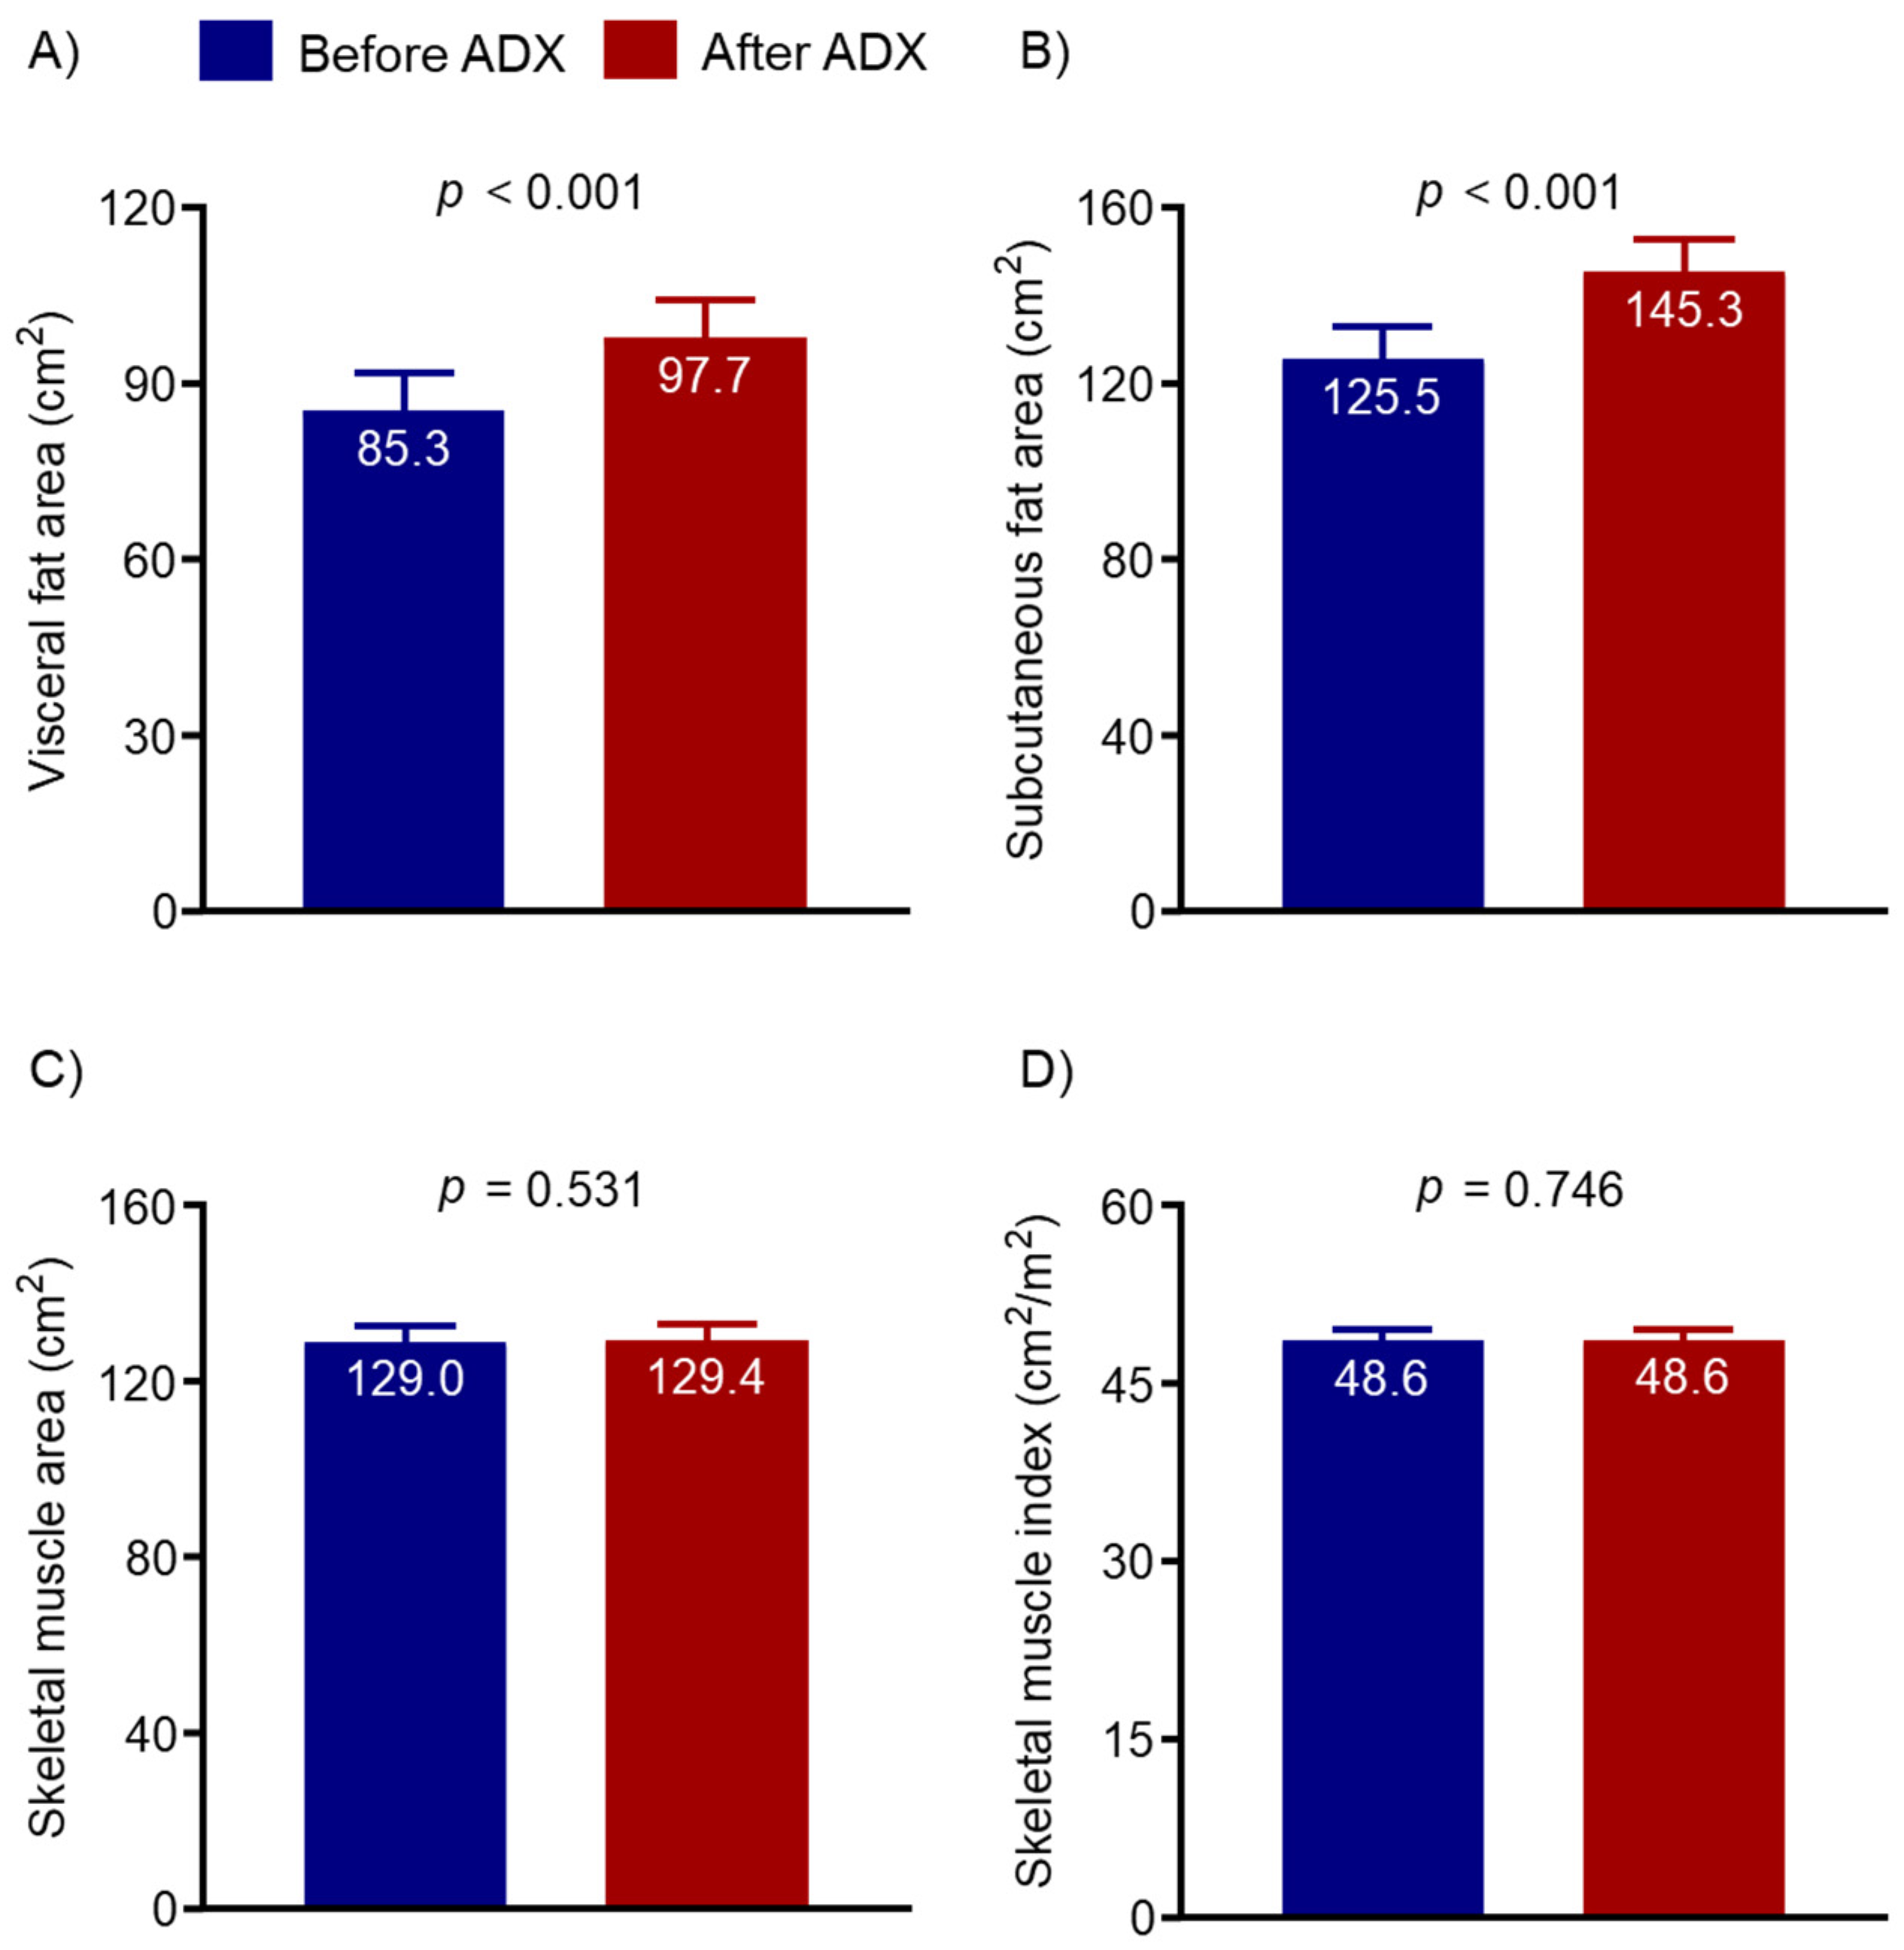
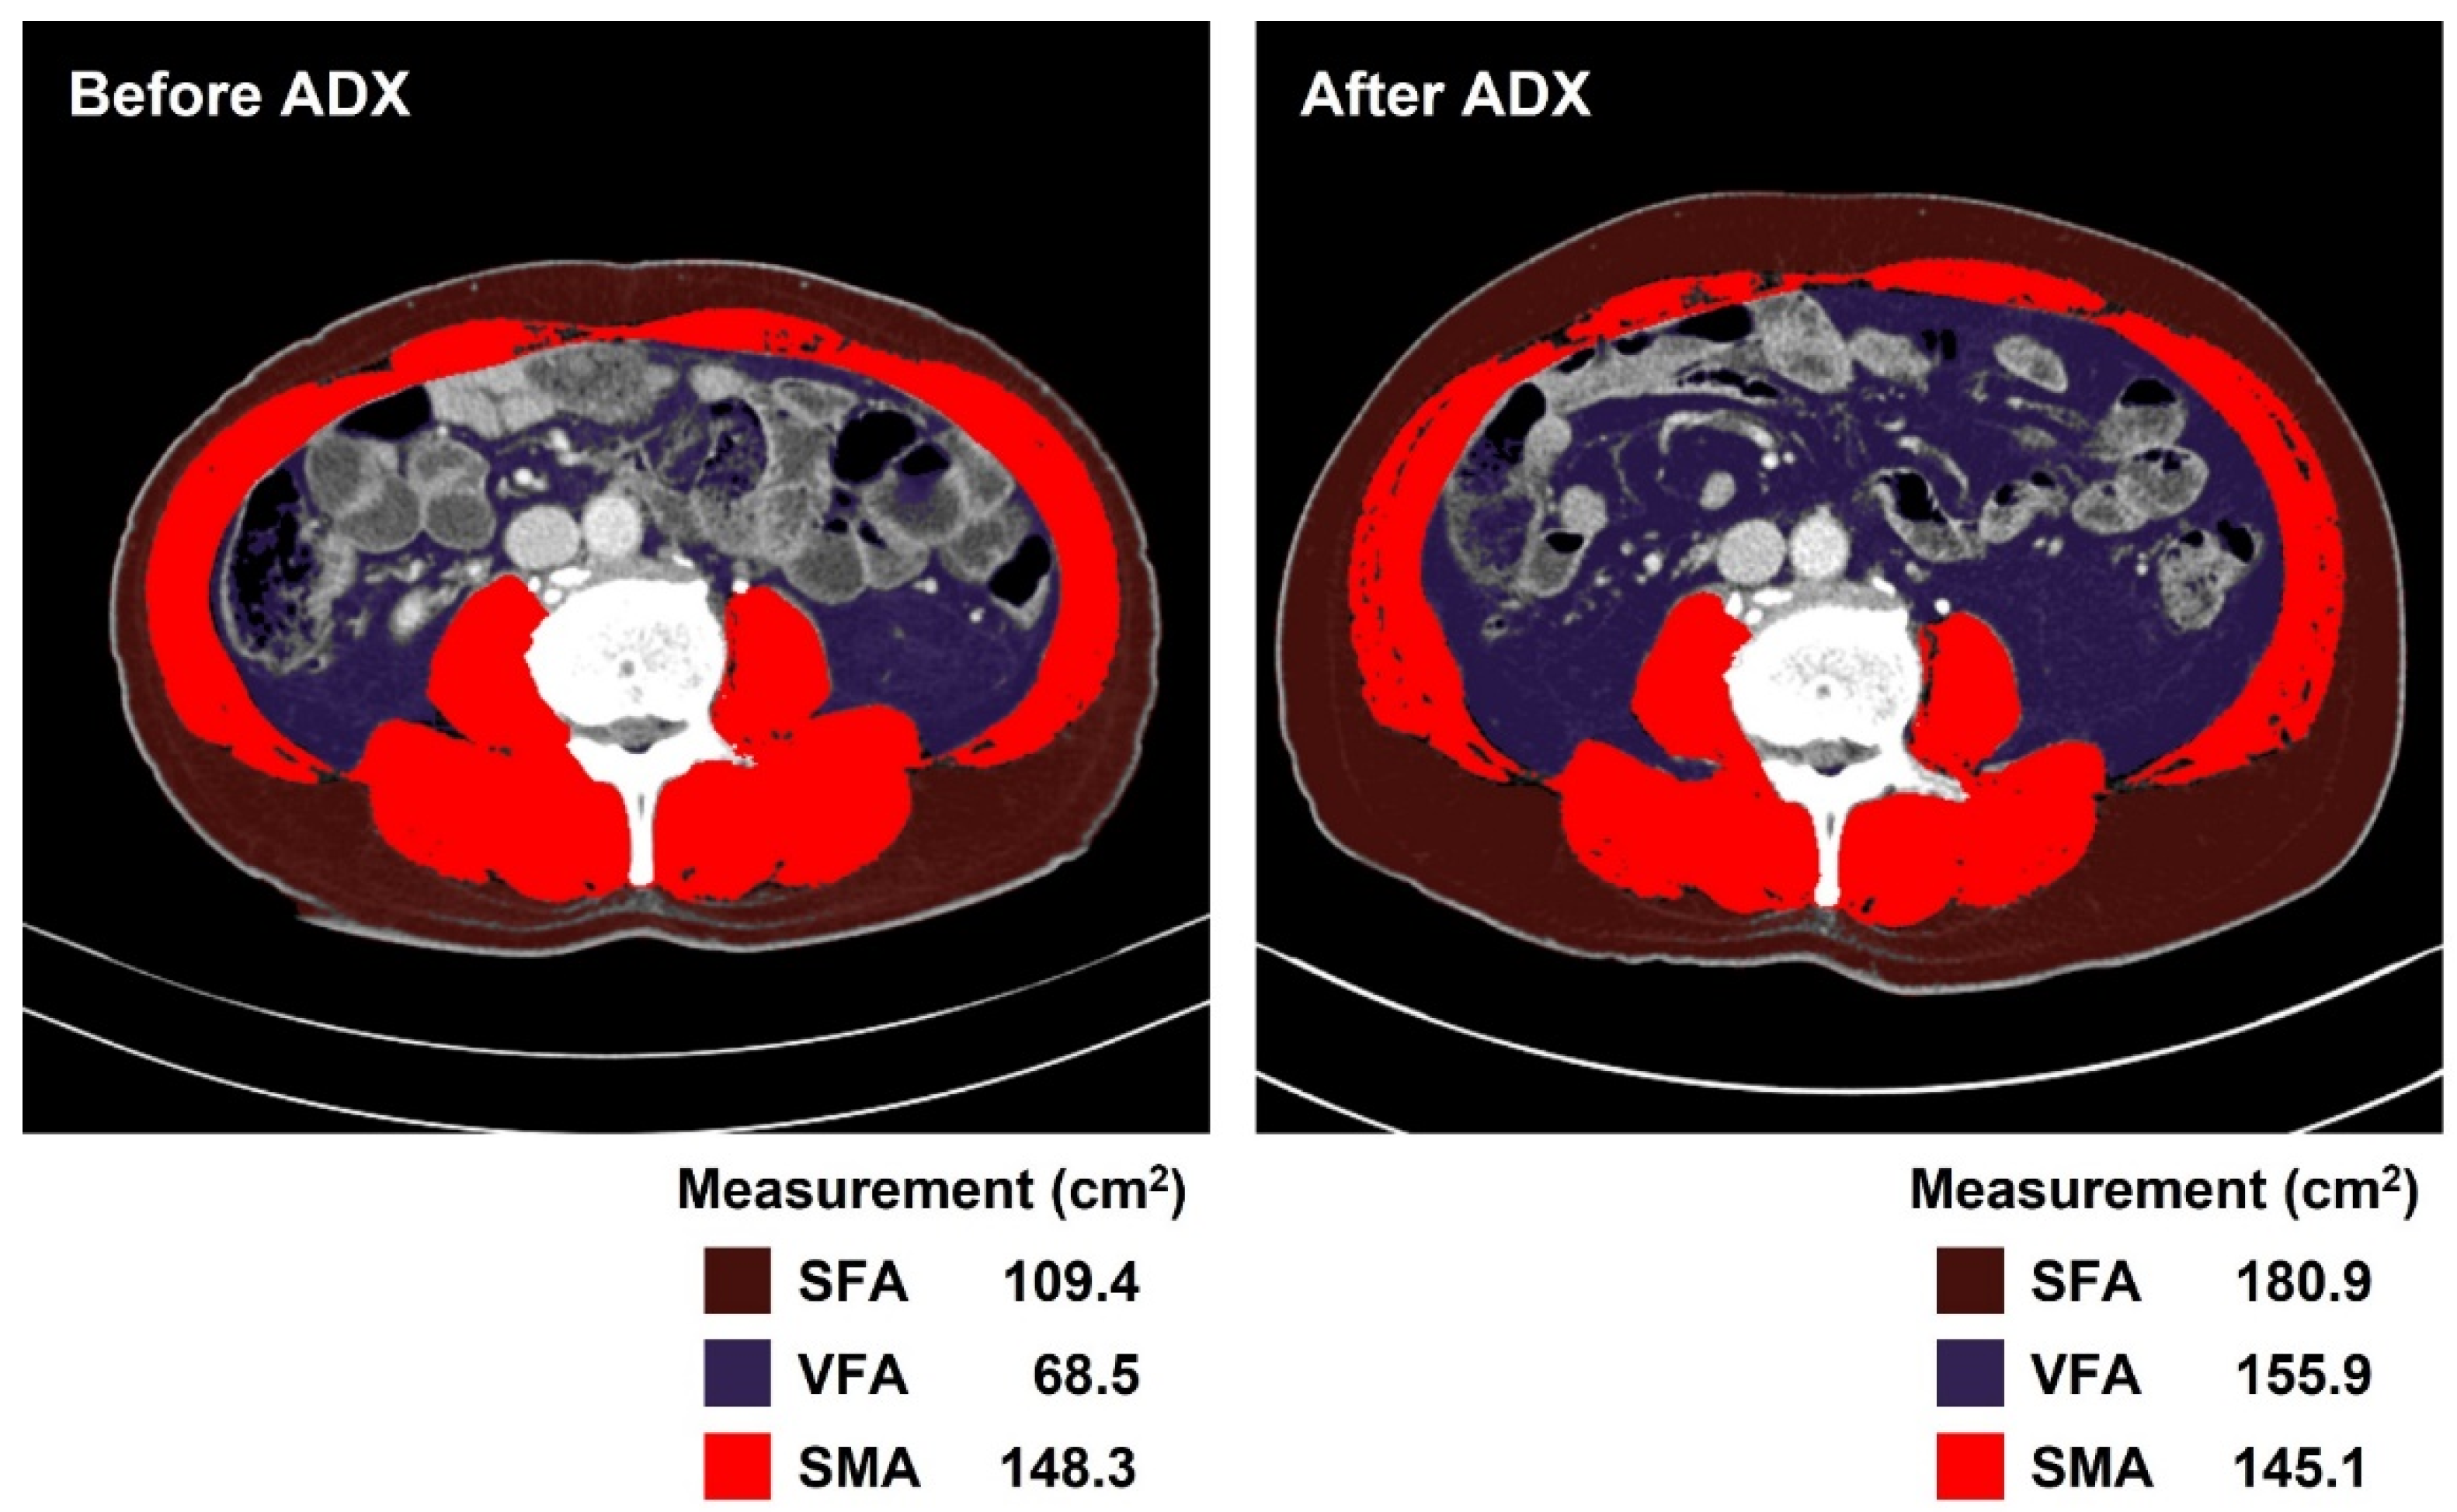
| VFA (cm2) | 85.3 ± 57.4 | 97.7 ± 59.4 | <0.001 |
| SFA (cm2) | 125.5 ± 67.1 | 145.3 ± 65.9 | <0.001 |
| SMA (cm2) | 129.0 ± 31.6 | 129.4 ± 31.5 | 0.531 |
| SMI (cm2/m2) | 48.6 ± 9.1 | 48.6 ± 8.9 | 0.746 |
| Independent Variable: Plasma Metanephrine | ||||||
|---|---|---|---|---|---|---|
| Change (Baseline to Follow-Up) | Unadjusted | Age and Sex-Adjusted | Multivariable-Adjusted | |||
| β (95% CI) | p | β (95% CI) | p | β (95% CIs | p | |
| ΔVFA (cm2) | 0.699 (−0.364 to 1.761) | 0.196 | 0.714 (−0.351 to 1.780) | 0.188 | 0.641 (−0.414 to 1.697) | 0.232 |
| ΔSFA (cm2) | 1.339 (0.121 to 2.558) | 0.031 | 1.471 (0.217 to 2.726) | 0.022 | 1.364 (0.134 to 2.594) | 0.030 |
| ΔSMA (cm2) | −0.070 (−0.398 to 0.259) | 0.677 | −0.057 (−0.395 to −0.281) | 0.738 | −0.084 (−0.418 to 0.250) | 0.619 |
| ΔSMI (cm2/m2) | −0.014 (−0.133 to 0.105) | 0.822 | −0.015 (−0.137 to 0.108) | 0.813 | −0.023 (−0.145 to 0.100) | 0.716 |
| Independent Variable: Plasma Normetanephrine | ||||||
| Change (Baseline to Follow-Up) | Unadjusted | Age and Sex-Adjusted | Multivariable-Adjusted | |||
| β (95% CI) | p | β (95% CI) | p | β (95% CI) | p | |
| ΔVFA (cm2) | 0.278 (−0.124 to 0.680) | 0.175 | 0.307 (−0.087 to 0.701) | 0.126 | 0.266 (−0.124 to 0.656) | 0.180 |
| ΔSFA (cm2) | 0.406 (−0.057 to 0.870) | 0.085 | 0.407 (−0.060 to 0.875) | 0.087 | 0.347 (−0.111 to 0.805) | 0.137 |
| ΔSMA (cm2) | 0.114 (−0.009 to 0.237) | 0.069 | 0.116 (−0.008 to 0.240) | 0.067 | 0.103 (−0.020 to 0.225) | 0.100 |
| ΔSMI (cm2/m2) | 0.047 (0.002 to 0.091) | 0.040 | 0.048 (0.003 to 0.093) | 0.036 | 0.044 (−0.001 to 0.089) | 0.052 |
| Independent Variable: Urine Metanephrine | ||||||
| Change (Baseline to Follow-Up) | Unadjusted | Age and Sex-Adjusted | Multivariable-Adjusted | |||
| β (95% CI) | p | β (95% CI) | p | β (95% CI) | p | |
| ΔVFA (cm2) | 0.046 (−0.092 to 0.184) | 0.516 | 0.041 (−0.095 to 0.176) | 0.556 | 0.041 (−0.092 to 0.175) | 0.543 |
| ΔSFA (cm2) | 0.084 (−0.070 to 0.237) | 0.282 | 0.087 (−0.069 to 0.242) | 0.274 | 0.083 (−0.070 to 0.236) | 0.284 |
| ΔSMA (cm2) | −0.021 (−0.065 to 0.023) | 0.355 | −0.019 (−0.063 to 0.025) | 0.401 | −0.021 (−0.064 to 0.022) | 0.328 |
| ΔSMI (cm2/m2) | −0.006 (−0.022 to 0.010) | 0.463 | −0.006 (−0.022 to 0.010) | 0.494 | −0.007 (−0.022 to 0.009) | 0.414 |
| Independent Variable: Urine Normetanephrine | ||||||
| Change (Baseline to Follow-Up) | Unadjusted | Age and Sex-Adjusted | Multivariable-Adjusted | |||
| β (95% CI) | p | β (95% CI) | p | β (95% CI) | p | |
| ΔVFA (cm2) | 0.148 (−0.001 to 0.297) | 0.052 | 0.143 (−0.006 to 0.292) | 0.059 | 0.122 (−0.026 to 0.271) | 0.106 |
| ΔSFA (cm2) | 0.290 (0.128 to 0.453) | 0.001 | 0.300 (0.132 to 0.467) | 0.001 | 0.291 (0.125 to 0.458) | 0.001 |
| ΔSMA (cm2) | 0.047 (−0.001 to 0.095) | 0.053 | 0.040 (−0.009 to 0.088) | 0.106 | 0.041 (−0.007 to 0.089) | 0.091 |
| ΔSMI (cm2/m2) | 0.019 (0.001 to 0.036) | 0.035 | 0.017 (−0.001 to 0.034) | 0.063 | 0.017 (0 to 0.035) | 0.050 |
| Independent Variable: ΔPlasma Metanephrine (Baseline to Follow-Up) | ||||||
|---|---|---|---|---|---|---|
| Change (Baseline to Follow-Up) | Unadjusted | Age and Sex-Adjusted | Multivariable-Adjusted | |||
| β (95% CI) | p | β (95% CI) | p | β (95% CI) | p | |
| ΔVFA (cm2) | −0.740 (−1.832 to 0.353) | 0.183 | −0.766 (−1.871 to 0.340) | 0.173 | −0.658 (−1.755 to 0.440) | 0.238 |
| ΔSFA (cm2) | −1.352 (−2.614 to −0.090) | 0.036 | −1.498 (−2.805 to −0.190) | 0.025 | −1.343 (−2.626 to −0.060) | 0.040 |
| ΔSMA (cm2) | 0.072 (−0.265 to 0.409) | 0.675 | 0.062 (−0.287 to 0.411) | 0.726 | 0.098 (−0.247 to 0.443) | 0.575 |
| ΔSMI (cm2/m2) | 0.017 (−0.105 to 0.139) | 0.788 | 0.019 (−0.107 to 0.146) | 0.763 | 0.030 (−0.095 to 0.156) | 0.633 |
| Independent Variable: ΔPlasma Normetanephrine (Baseline to Follow-up) | ||||||
| Change (Baseline to Follow-Up) | Unadjusted | Age and Sex-Adjusted | Multivariable-Adjusted | |||
| β (95% CI) | p | β (95% CI) | p | β (95% CI) | p | |
| ΔVFA (cm2) | −0.302 (−0.716 to 0.113) | 0.152 | −0.322 (−0.729 to 0.085) | 0.120 | −0.276 (−0.680 to 0.129) | 0.180 |
| ΔSFA (cm2) | −0.433 (−0.914 to 0.048) | 0.077 | −0.431 (−0.917 to 0.054) | 0.081 | −0.361 (−0.837 to 0.115) | 0.136 |
| ΔSMA (cm2) | −0.112 (−0.238 to 0.015) | 0.084 | −0.112 (−0.240 to 0.015) | 0.084 | −0.097 (−0.224 to 0.029) | 0.131 |
| ΔSMI (cm2/m2) | −0.044 (−0.090 to 0.001) | 0.058 | −0.045 (−0.091 to 0.001) | 0.054 | −0.041 (−0.087 to 0.005) | 0.081 |
| Independent Variable: ΔUrine Metanephrine (Baseline to Follow-Up) | ||||||
| Change (Baseline to Follow-Up) | Unadjusted | Age and Sex-Adjusted | Multivariable-Adjusted | |||
| β (95% CI) | p | β (95% CI) | p | β (95% CI) | p | |
| ΔVFA (cm2) | 0.006 (−0.150 to 0.162) | 0.941 | 0.0004 (−0.154 to 0.155) | 0.995 | −0.005 (−0.157 to 0.148) | 0.953 |
| ΔSFA (cm2) | −0.026 (−0.204 to 0.152) | 0.773 | −0.027 (−0.207 to 0.153) | 0.767 | −0.031 (−0.207 to 0.145) | 0.727 |
| ΔSMA (cm2) | 0.027 (−0.024 to 0.078) | 0.296 | 0.024 (−0.026 to 0.075) | 0.347 | 0.024 (−0.025 to 0.074) | 0.337 |
| ΔSMI (cm2/m2) | 0.008 (−0.010 to 0.027) | 0.383 | 0.007 (−0.011 to 0.026) | 0.435 | 0.007 (−0.011 to 0.025) | 0.423 |
| Independent Variable: ΔUrine Normetanephrine (Baseline to Follow-Up) | ||||||
| Change (Baseline to Follow-Up) | Unadjusted | Age and Sex-Adjusted | Multivariable-Adjusted | |||
| β (95% CI) | p | β (95% CI) | p | β (95% CI) | p | |
| ΔVFA (cm2) | −0.128 (−0.287 to 0.031) | 0.113 | −0.124 (−0.285 to 0.038) | 0.132 | −0.108 (−0.270 to 0.053) | 0.187 |
| ΔSFA (cm2) | −0.311 (−0.488 to −0.134) | 0.001 | −0.327 (−0.509 to −0.145) | 0.001 | −0.319 (−0.499 to −0.139) | 0.001 |
| ΔSMA (cm2) | −0.052 (−0.104 to 0.001) | 0.053 | −0.047 (−0.100 to 0.006) | 0.080 | −0.047 (−0.100 to 0.005) | 0.075 |
| ΔSMI (cm2/m2) | −0.021 (−0.040 to −0.002) | 0.034 | −0.019 (−0.039 to −0.0002) | 0.048 | −0.020 (−0.039 to −0.001) | 0.042 |
Publisher’s Note: MDPI stays neutral with regard to jurisdictional claims in published maps and institutional affiliations. |
© 2022 by the authors. Licensee MDPI, Basel, Switzerland. This article is an open access article distributed under the terms and conditions of the Creative Commons Attribution (CC BY) license (https://creativecommons.org/licenses/by/4.0/).
Share and Cite
Ko, Y.; Jeong, H.; Khang, S.; Lee, J.; Kim, K.W.; Kim, B.-J. Change of Computed Tomography-Based Body Composition after Adrenalectomy in Patients with Pheochromocytoma. Cancers 2022, 14, 1967. https://doi.org/10.3390/cancers14081967
Ko Y, Jeong H, Khang S, Lee J, Kim KW, Kim B-J. Change of Computed Tomography-Based Body Composition after Adrenalectomy in Patients with Pheochromocytoma. Cancers. 2022; 14(8):1967. https://doi.org/10.3390/cancers14081967
Chicago/Turabian StyleKo, Yousun, Heeryoel Jeong, Seungwoo Khang, Jeongjin Lee, Kyung Won Kim, and Beom-Jun Kim. 2022. "Change of Computed Tomography-Based Body Composition after Adrenalectomy in Patients with Pheochromocytoma" Cancers 14, no. 8: 1967. https://doi.org/10.3390/cancers14081967
APA StyleKo, Y., Jeong, H., Khang, S., Lee, J., Kim, K. W., & Kim, B.-J. (2022). Change of Computed Tomography-Based Body Composition after Adrenalectomy in Patients with Pheochromocytoma. Cancers, 14(8), 1967. https://doi.org/10.3390/cancers14081967