
Expression of CD39 Identifies Activated Intratumoral CD8+ T Cells in Mismatch Repair Deficient Endometrial Cancer

 , , ,
, , , 
Abstract
:Simple Summary
Abstract
1. Introduction
2. Materials and Methods
2.1. Tumor Tissue
2.2. Isolation of Peripheral Blood Mononuclear Cells
2.3. In Vitro CD8+ T Cell Stimulation
2.4. Fluorescence-Activated Cell Sorting
2.5. mRNA Sequencing
2.6. Analysis of mRNA Sequencing Data
2.7. Artificial Anti-CD3 scFv-Presenting Cancer Cell Lines
2.8. T Cell: Cancer Cell Co-Cultures
2.9. CellTrace Violet
2.10. Flow Cytometry
2.11. Statistical Analyses
3. Results
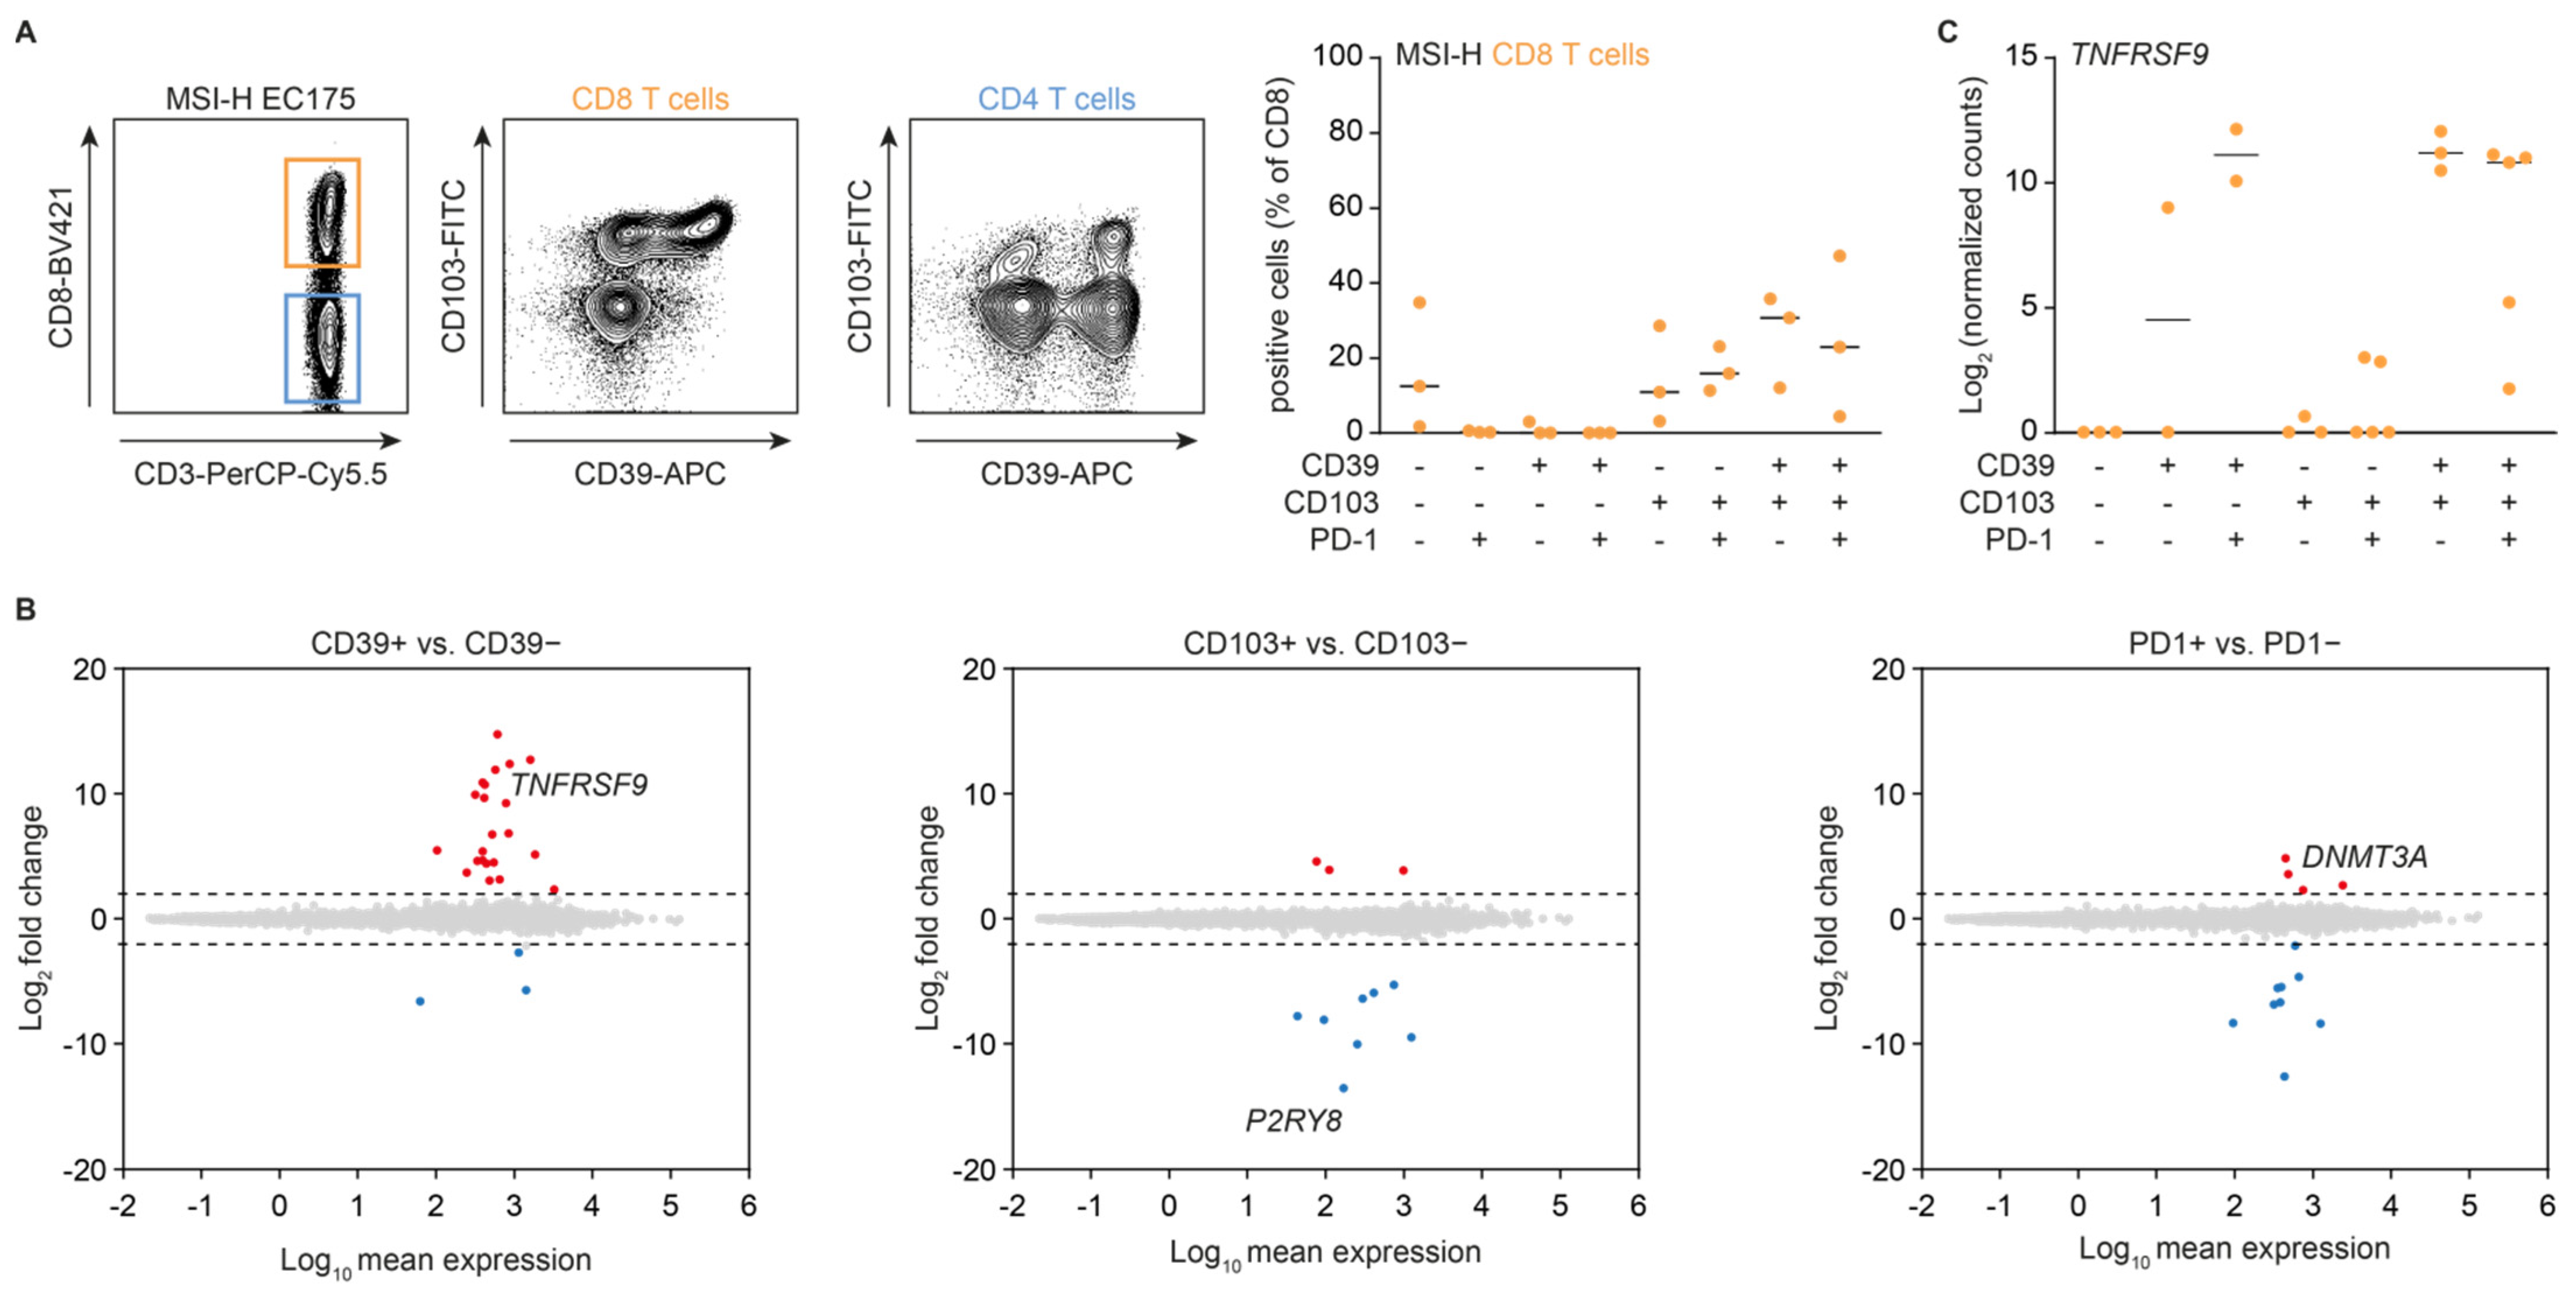
3.1. Cell Surface Expression of CD39 Is Independently Associated with CD8+ T Cell Activation in MSI-H Endometrial Cancer
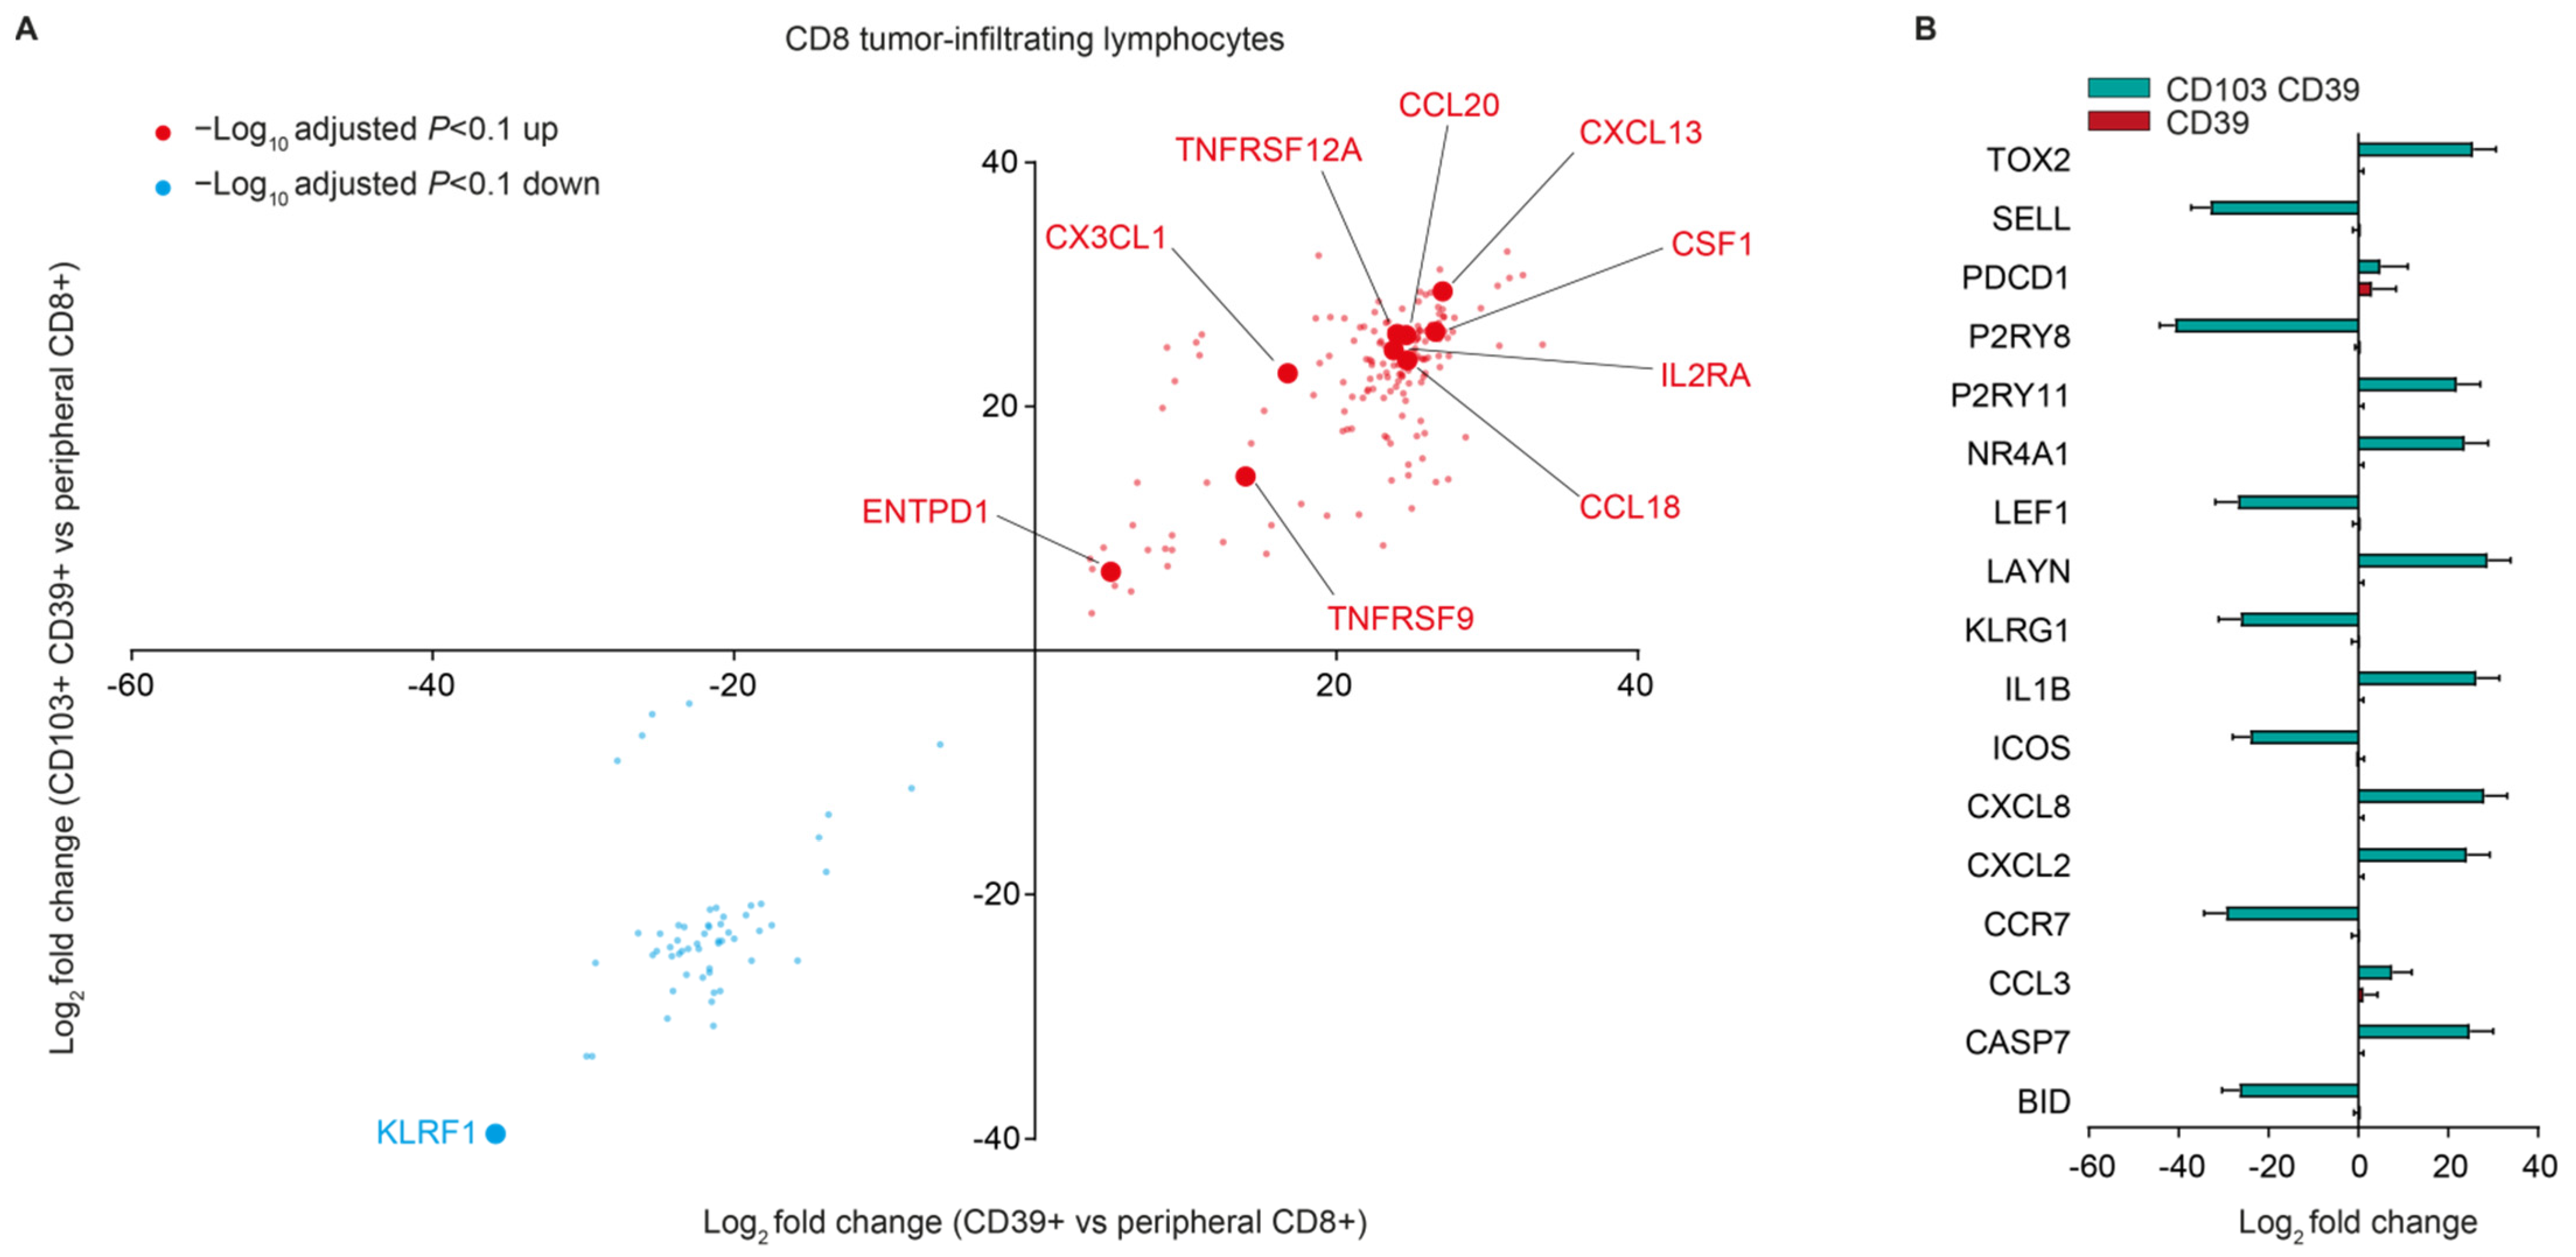
3.2. CD103− CD39+ CD8+ T Cells in MSI-H Endometrial Tumors Are a Recently Activated, Naïve-Like Subset
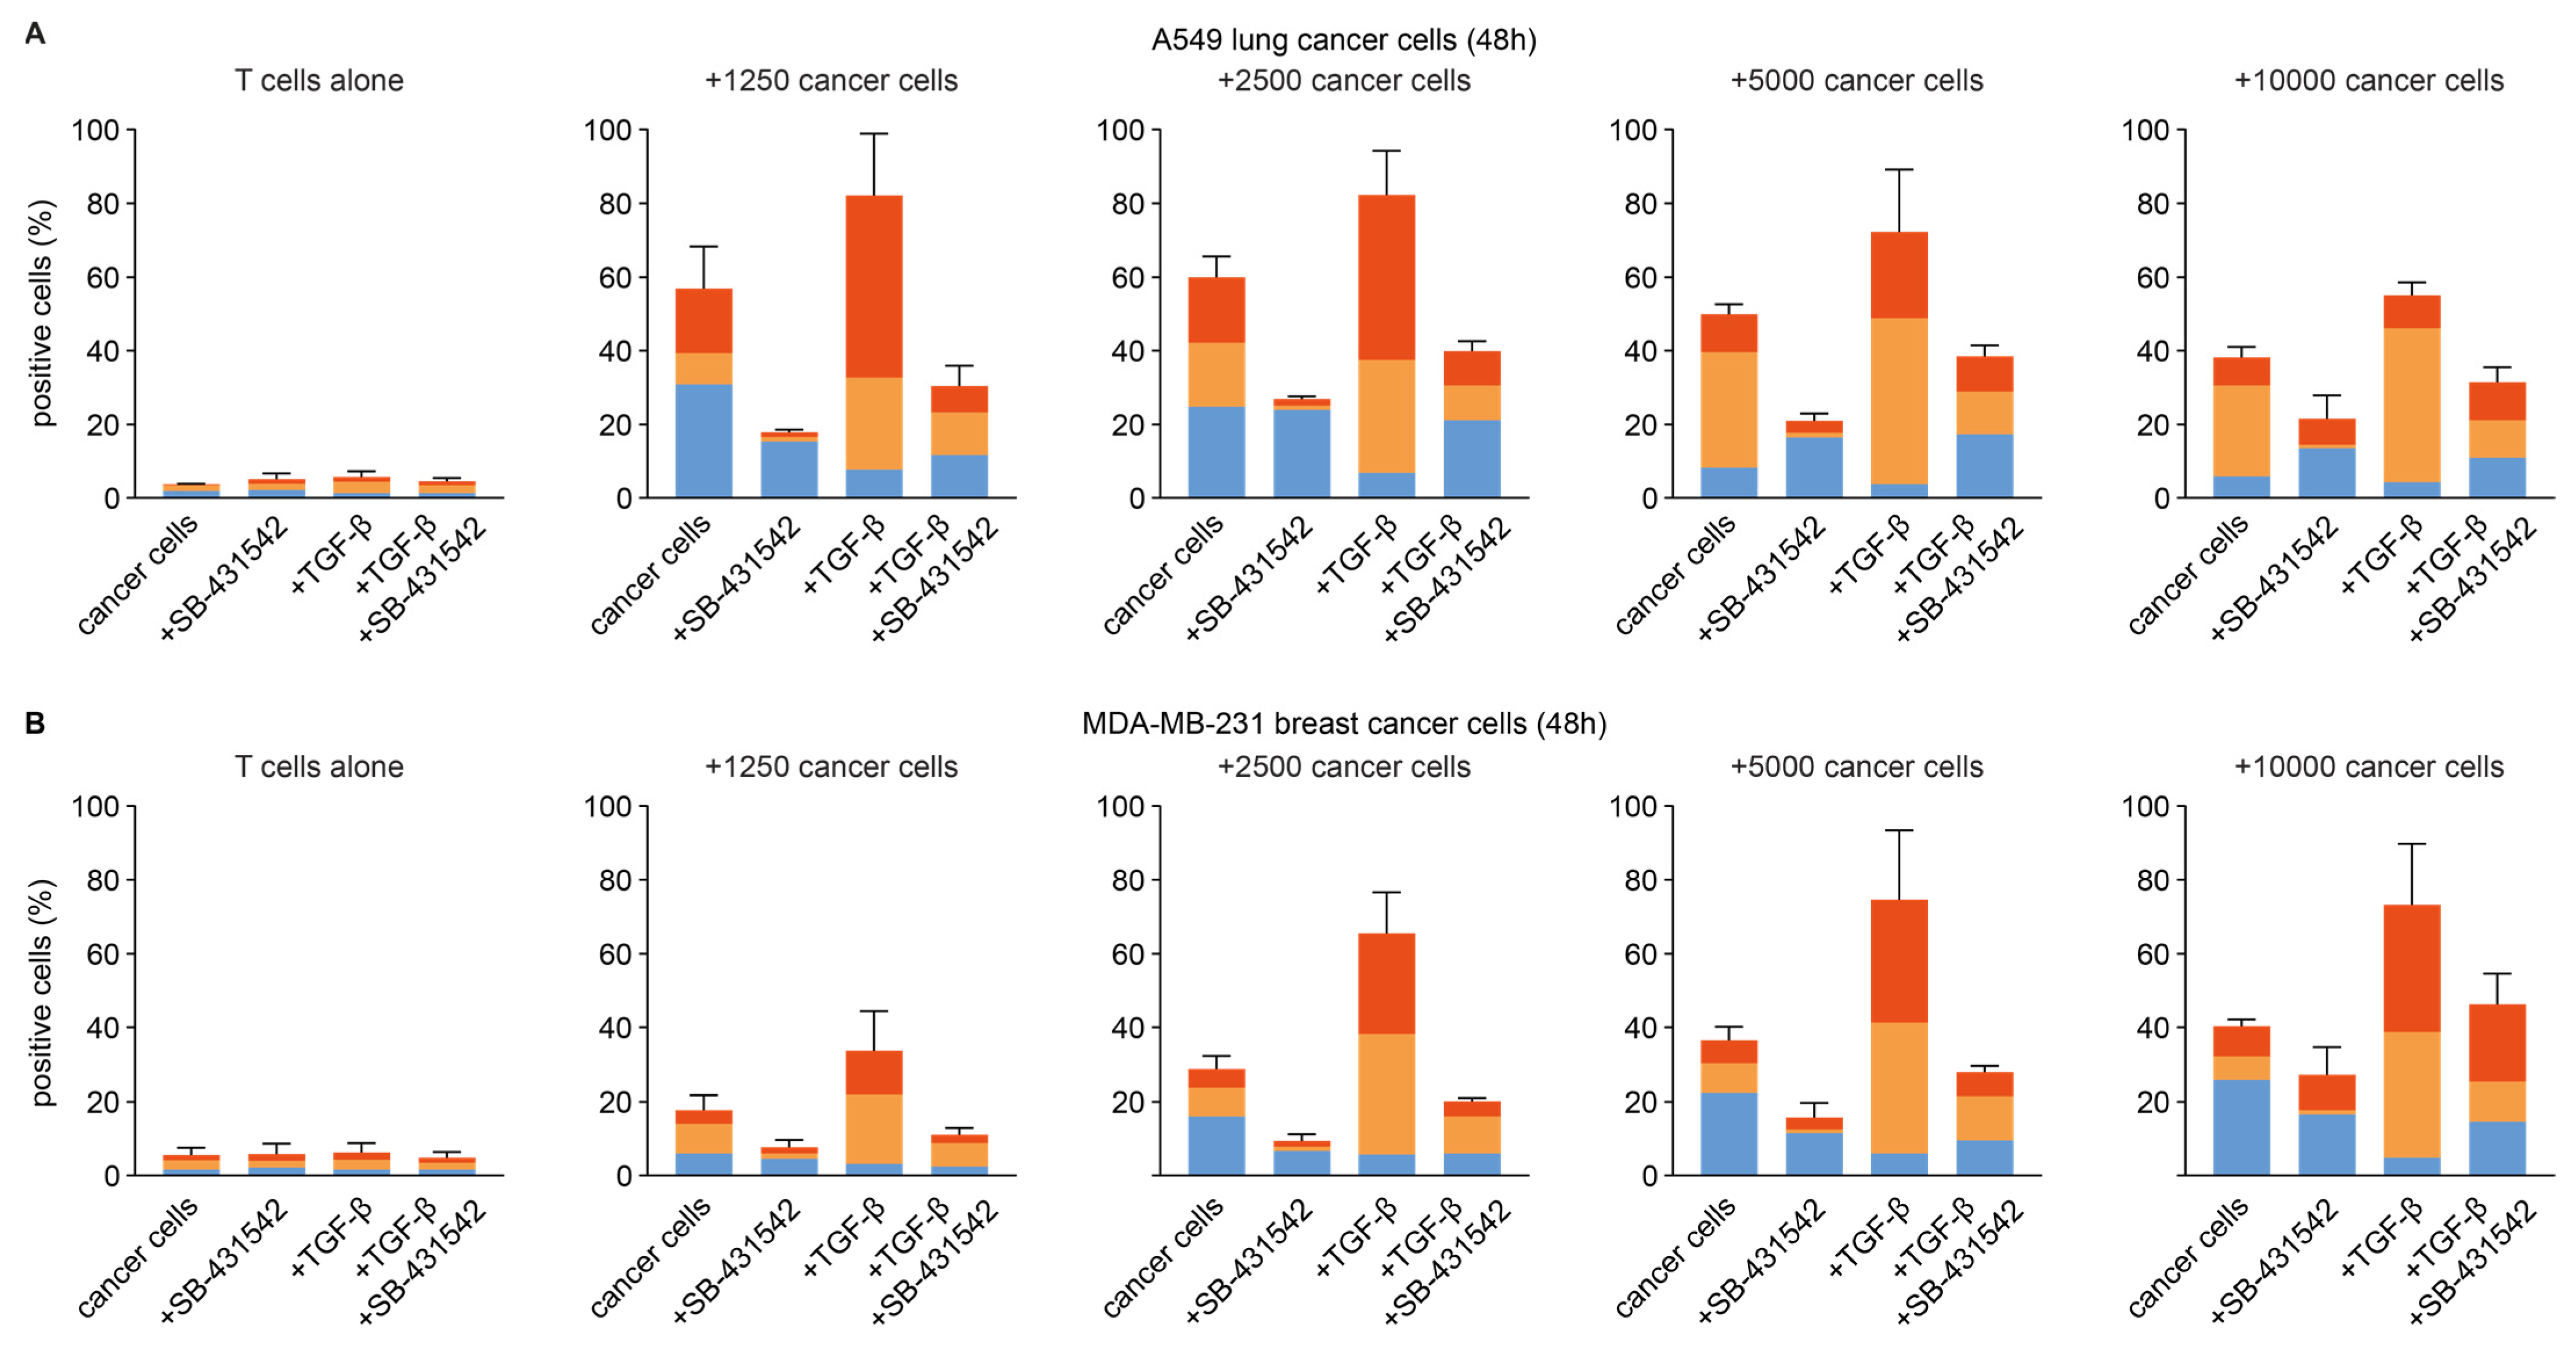
3.3. Effect of TGF-β on CD103− CD39+ CD8+ T Cell Formation
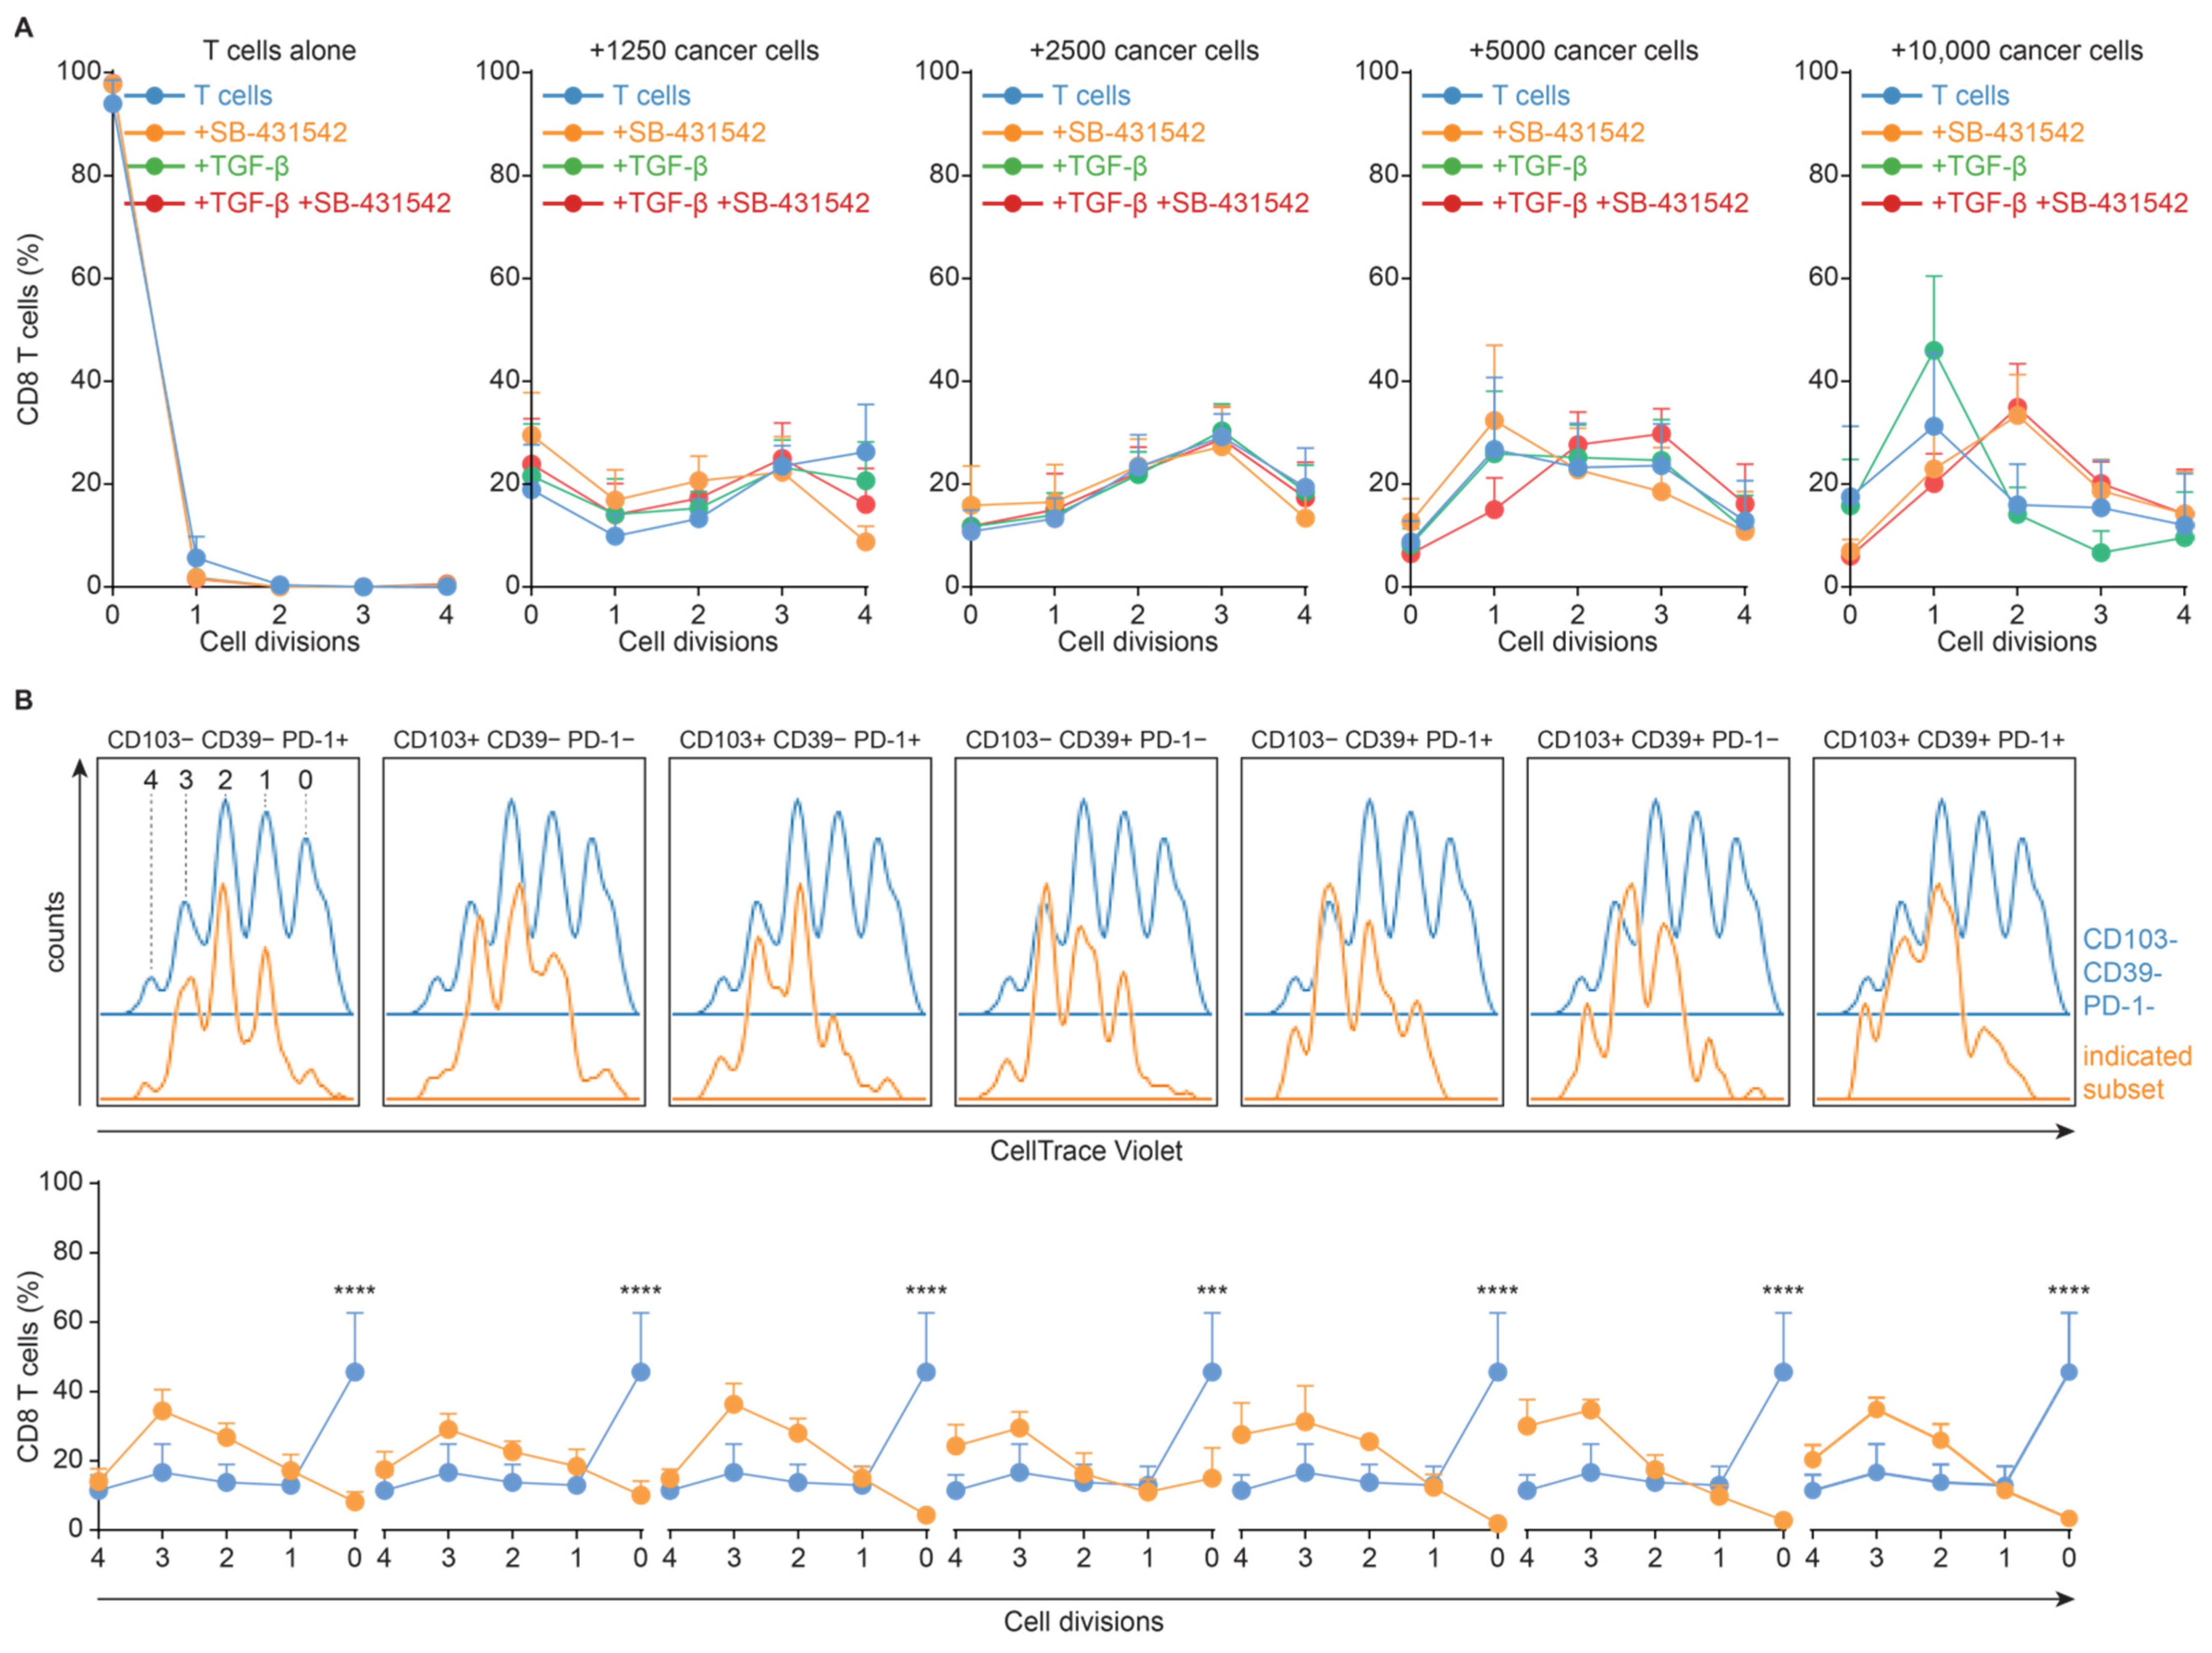
3.4. TGF-β-Induced Loss of CD103− CD39+ CD8+ T Cells Is Independent of Proliferation
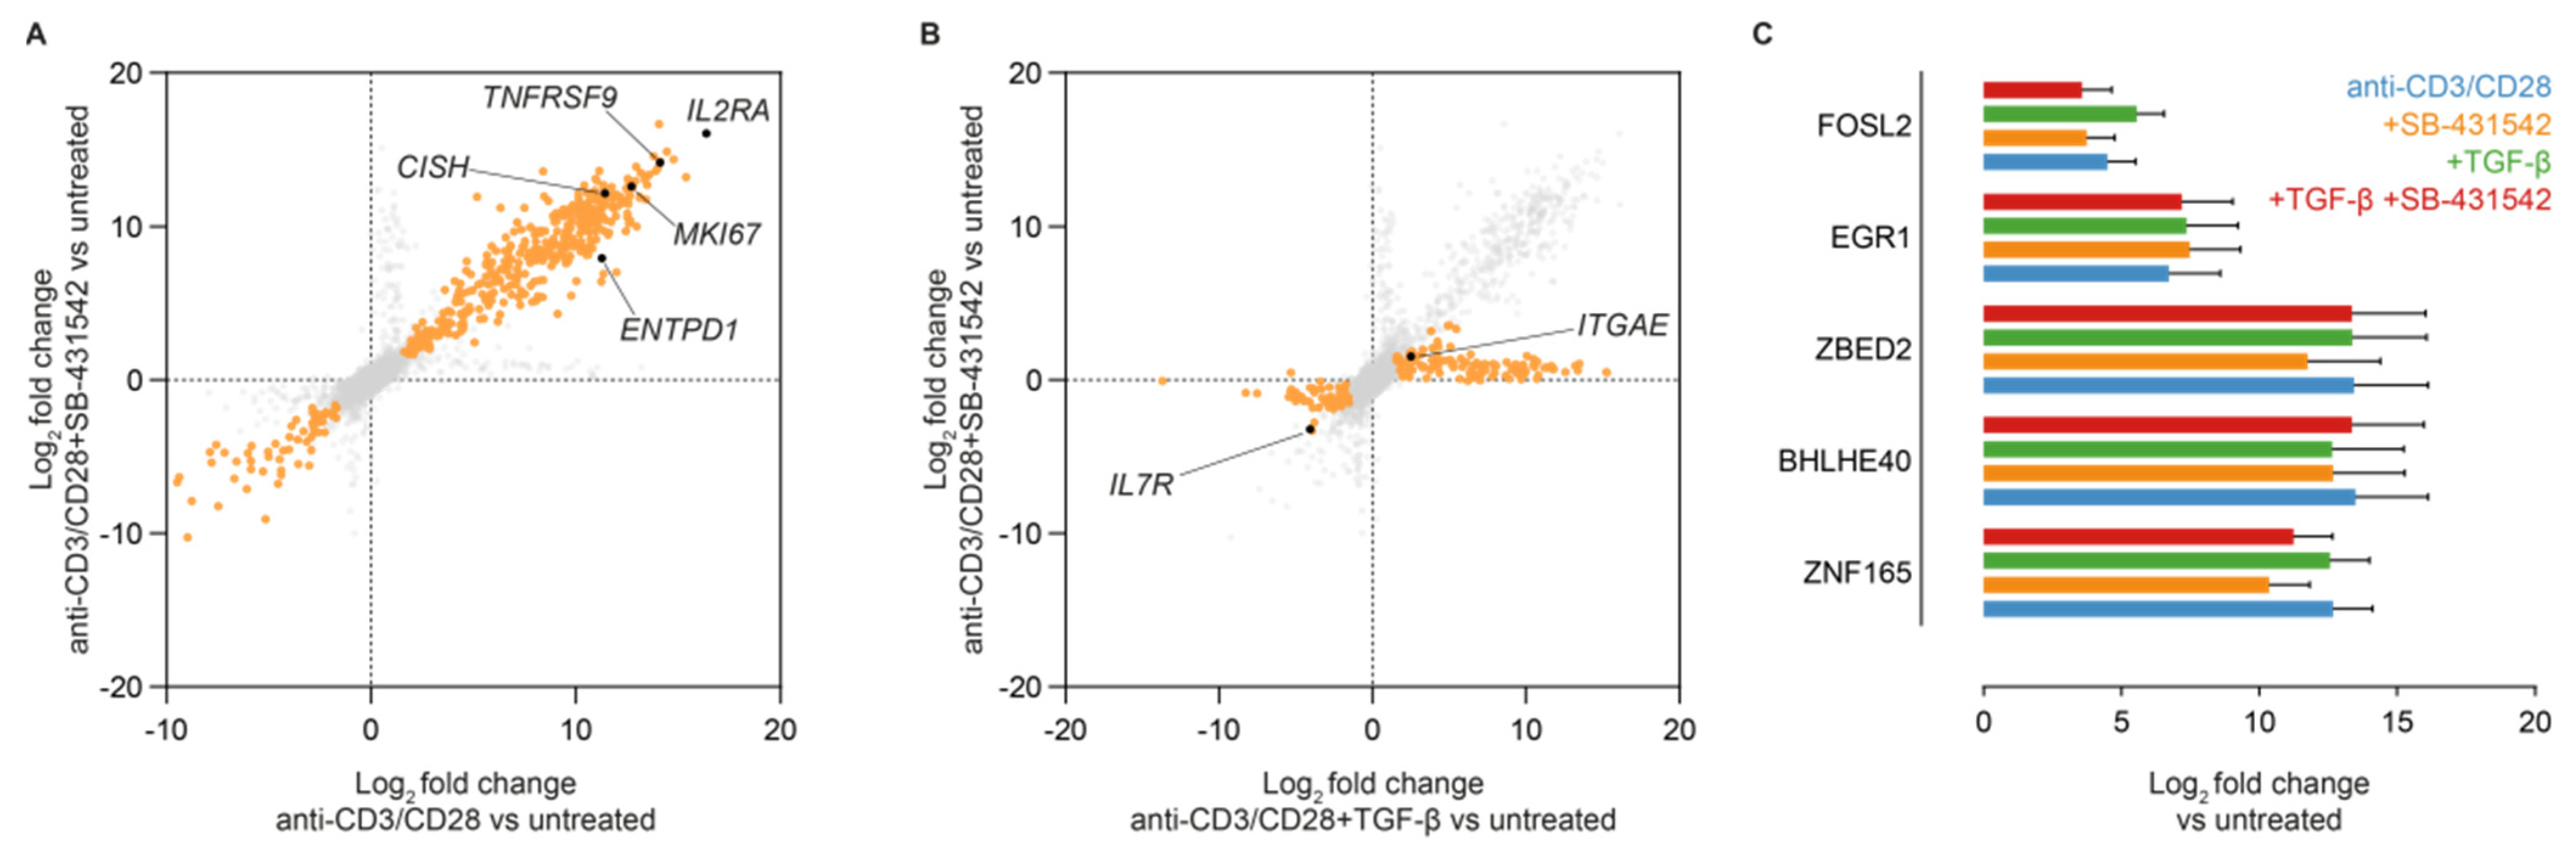
3.5. Induction of CD39 Is Associated with Upregulation of TGF-β Signal Regulating Transcription Factors
4. Discussion
5. Conclusions
Supplementary Materials
Author Contributions
Funding
Institutional Review Board Statement
Informed Consent Statement
Data Availability Statement
Conflicts of Interest
References
- Ansell, S.M.; Lesokhin, A.M.; Borrello, I.; Halwani, A.; Scott, E.C.; Gutierrez, M.; Schuster, S.J.; Millenson, M.M.; Cattry, D.; Freeman, G.J.; et al. PD-1 blockade with nivolumab in relapsed or refractory Hodgkin’s lymphoma. N. Engl. J. Med. 2015, 372, 311–319. [Google Scholar] [CrossRef] [PubMed] [Green Version]
- Hamid, O.; Robert, C.; Daud, A.; Hodi, F.S.; Hwu, W.J.; Kefford, R.; Wolchok, J.D.; Hersey, P.; Joseph, R.W.; Weber, J.S.; et al. Safety and tumor responses with lambrolizumab (anti-PD-1) in melanoma. N. Engl. J. Med. 2013, 369, 134–144. [Google Scholar] [CrossRef] [PubMed] [Green Version]
- Borghaei, H.; Paz-Ares, L.; Horn, L.; Spigel, D.R.; Steins, M.; Ready, N.E.; Chow, L.Q.; Vokes, E.E.; Felip, E.; Holgado, E.; et al. Nivolumab versus docetaxel in advanced nonsquamous non-small-cell lung cancer. N. Engl. J. Med. 2015, 373, 1627–1639. [Google Scholar] [CrossRef] [PubMed]
- Pardoll, D.M. The blockade of immune checkpoints in cancer immunotherapy. Nat. Rev. Cancer 2012, 12, 252–264. [Google Scholar] [CrossRef] [PubMed] [Green Version]
- Thommen, D.S.; Koelzer, V.H.; Herzig, P.; Roller, A.; Trefny, M.; Dimeloe, S.; Kiialainen, A.; Hanhart, J.; Schill, C.; Hess, C.; et al. A transcriptionally and functionally distinct pd-1 + cd8 + t cell pool with predictive potential in non-small-cell lung cancer treated with pd-1 blockade. Nat. Med. 2018, 24, 994–1004. [Google Scholar] [CrossRef] [PubMed] [Green Version]
- Duhen, T.; Duhen, R.; Montler, R.; Moses, J.; Moudgil, T.; De Miranda, N.F.; Goodall, C.P.; Blair, T.C.; Fox, B.A.; McDermott, J.E.; et al. Co-expression of CD39 and CD103 identifies tumor-reactive CD8 T cells in human solid tumors. Nat. Commun. 2018, 9, 2724. [Google Scholar] [CrossRef] [PubMed] [Green Version]
- Webb, J.R.; Milne, K.; Nelson, B.H. PD-1 and CD103 are widely coexpressed on prognostically favorable intraepithelial CD8 T cells in human ovarian cancer. Cancer Immunol. Res. 2015, 3, 926–935. [Google Scholar] [CrossRef] [PubMed] [Green Version]
- Gros, A.; Yang, J.C.; Rosenberg, S.A.; Gros, A.; Robbins, P.F.; Yao, X.; Li, Y.F.; Turcotte, S.; Tran, E.; Wunderlich, J.R.; et al. PD-1 identifies the patient-specific CD8+ tumor-reactive repertoire infiltrating human tumors. J. Clin. Investig. 2014, 124, 2246–2259. [Google Scholar] [CrossRef] [PubMed]
- Inozume, T.; Hanada, K.I.; Wang, Q.J.; Ahmadzadeh, M.; Wunderlich, J.R.; Rosenberg, S.A.; Yang, J.C. Selection of CD8+PD-1+ lymphocytes in fresh human melanomas enriches for tumor-reactive T-cells. J. Immunother. 2010, 33, 956–964. [Google Scholar] [CrossRef] [PubMed] [Green Version]
- Ahmadzadeh, M.; Johnson, L.A.; Heemskerk, B.; Wunderlich, J.R.; Dudley, M.E.; White, D.E.; Rosenberg, S.A. Tumor antigen-specific CD8 T cells infiltrating the tumor express high levels of PD-1 and are functionally impaired. Blood 2009, 114, 1537–1544. [Google Scholar] [CrossRef] [PubMed]
- Dieu-Nosjean, M.C.; Giraldo, N.A.; Kaplon, H.; Germain, C.; Fridman, W.H.; Sautès-Fridman, C. Tertiary lymphoid structures, drivers of the anti-tumor responses in human cancers. Immunol. Rev. 2016, 271, 260–275. [Google Scholar] [CrossRef] [PubMed]
- Sautès-Fridman, C.; Lawand, M.; Giraldo, N.A.; Kaplon, H.; Germain, C.; Fridman, W.H.; Dieu-Nosjean, M.C. Tertiary lymphoid structures in cancers: Prognostic value, regulation, and manipulation for therapeutic intervention. Front. Immunol. 2016, 7, 407. [Google Scholar] [CrossRef] [PubMed] [Green Version]
- Gupta, P.K.; Godec, J.; Wolski, D.; Adland, E.; Yates, K.; Pauken, K.E.; Cosgrove, C.; Ledderose, C.; Junger, W.G.; Robson, S.C.; et al. CD39 Expression Identifies Terminally Exhausted CD8+ T Cells. PLoS Pathog. 2015, 11, e1005177. [Google Scholar] [CrossRef] [PubMed] [Green Version]
- Djenidi, F.; Adam, J.; Goubar, A.; Durgeau, A.; Meurice, G.; de Montpréville, V.; Validire, P.; Besse, B.; Mami-Chouaib, F. CD8 + CD103 + Tumor–Infiltrating Lymphocytes Are Tumor-Specific Tissue-Resident Memory T Cells and a Prognostic Factor for Survival in Lung Cancer Patients. J. Immunol. 2015, 194, 3475–3486. [Google Scholar] [CrossRef] [PubMed] [Green Version]
- Picelli, S.; Faridani, O.R.; Björklund, Å.K.; Winberg, G.; Sagasser, S.; Sandberg, R. Full-length RNA-seq from single cells using Smart-seq2. Nat. Protoc. 2014, 9, 171–181. [Google Scholar] [CrossRef] [PubMed]
- Workel, H.H.; Lubbers, J.M.; Arnold, R.; Prins, T.M.; van der Vlies, P.; de Lange, K.; Bosse, T.; van Gool, I.C.; Eggink, F.A.; Wouters, M.C.A.; et al. A Transcriptionally Distinct CXCL13þCD103þCD8þ T-cell Population Is Associated with B-cell Recruitment and Neoantigen Load in Human Cancer. Cancer Immunol. Res. 2019, 7, 784–796. [Google Scholar] [CrossRef] [PubMed] [Green Version]
- Morsut, L.; Roybal, K.T.; Xiong, X.; Gordley, R.M.; Coyle, S.M.; Thomson, M.; Lim, W.A. Engineering Customized Cell Sensing and Response Behaviors Using Synthetic Notch Receptors. Cell 2016, 164, 780–791. [Google Scholar] [CrossRef] [PubMed] [Green Version]
- De Bruyn, M.; Wei, Y.; Wiersma, V.R.; Samplonius, D.F.; Klip, H.G.; Van Der Zee, A.G.J.; Yang, B.; Helfrich, W.; Bremer, E. Cell surface delivery of TRAIL strongly augments the tumoricidal activity of T cells. Clin. Cancer Res. 2011, 17, 5626–5637. [Google Scholar] [CrossRef] [PubMed] [Green Version]
- Gibson, D.G.; Young, L.; Chuang, R.Y.; Venter, J.C.; Hutchison, C.A.; Smith, H.O. Enzymatic assembly of DNA molecules up to several hundred kilobases. Nat. Methods 2009, 6, 343–345. [Google Scholar] [CrossRef] [PubMed]

Publisher’s Note: MDPI stays neutral with regard to jurisdictional claims in published maps and institutional affiliations. |
© 2022 by the authors. Licensee MDPI, Basel, Switzerland. This article is an open access article distributed under the terms and conditions of the Creative Commons Attribution (CC BY) license (https://creativecommons.org/licenses/by/4.0/).
Share and Cite
Lubbers, J.M.; Ważyńska, M.A.; van Rooij, N.; Kol, A.; Workel, H.H.; Plat, A.; Paijens, S.T.; Vlaming, M.R.; Spierings, D.C.J.; Elsinga, P.H.; et al. Expression of CD39 Identifies Activated Intratumoral CD8+ T Cells in Mismatch Repair Deficient Endometrial Cancer. Cancers 2022, 14, 1924. https://doi.org/10.3390/cancers14081924
Lubbers JM, Ważyńska MA, van Rooij N, Kol A, Workel HH, Plat A, Paijens ST, Vlaming MR, Spierings DCJ, Elsinga PH, et al. Expression of CD39 Identifies Activated Intratumoral CD8+ T Cells in Mismatch Repair Deficient Endometrial Cancer. Cancers. 2022; 14(8):1924. https://doi.org/10.3390/cancers14081924
Chicago/Turabian StyleLubbers, Joyce M., Marta A. Ważyńska, Nienke van Rooij, Arjan Kol, Hagma H. Workel, Annechien Plat, Sterre T. Paijens, Martijn R. Vlaming, Diana C. J. Spierings, Philip H. Elsinga, and et al. 2022. "Expression of CD39 Identifies Activated Intratumoral CD8+ T Cells in Mismatch Repair Deficient Endometrial Cancer" Cancers 14, no. 8: 1924. https://doi.org/10.3390/cancers14081924
APA StyleLubbers, J. M., Ważyńska, M. A., van Rooij, N., Kol, A., Workel, H. H., Plat, A., Paijens, S. T., Vlaming, M. R., Spierings, D. C. J., Elsinga, P. H., Bremer, E., Nijman, H. W., & de Bruyn, M. (2022). Expression of CD39 Identifies Activated Intratumoral CD8+ T Cells in Mismatch Repair Deficient Endometrial Cancer. Cancers, 14(8), 1924. https://doi.org/10.3390/cancers14081924