Simple Summary
Ovarian cancer remains a clinical challenge with considerable mortality. Circulating tumor DNA (ctDNA) has been suggested as a prognostic biomarker and enables the longitudinal evaluation of a patient’s disease and response to treatment. However, the role of ctDNA in treatment monitoring and for guiding treatment decisions in ovarian cancer remains unclear. We aimed to examine a gene methylation biomarker in the plasma of patients suffering a relapse of ovarian cancer in order to investigate prognostic potential and identify patients most likely to benefit from treatment, measured by overall survival. In the study, the methylated gene HOXA9 was found to be significantly related to poor survival, with the potential to observe the progression of the disease at an early stage and spare patients from ineffective treatment. Monitoring ctDNA during treatment is clinically feasible, further efforts are, however, required for standardization and for demonstrating improvement in treatment management.
Abstract
Methylated Homeobox A9 circulating tumor DNA (meth-HOXA9) has been suggested as a blood-based biomarker in epithelial ovarian cancer (EOC), although its prognostic significance remains unproven. The aim of the present study was to investigate the prognostic impact of meth-HOXA9 in patients with recurrent EOC. DNA was purified from 4 mL plasma and, following bilsulfite conversion, meth-HOXA9 was analyzed using a methylation-specific droplet digital PCR. Detection of meth-HOXA9 was reported as a percentage of total DNA and as a binary variable (detectable and undetectable). Meth-HOXA9 status and its dynamics during palliative treatment were correlated with overall survival (OS) as the primary endpoint. At baseline, meth-HOXA9 was detected in 65.9% (83/126) of the patients. The median OS was 8.9 and 17.9 months in patients with detectable and undetectable meth-HOXA9 at baseline (hazard ratio: 2.04, p = 0.002), which remained significant in the multivariate analysis. Median OS in patients with an increase in meth-HOXA9 after one treatment cycle was 5.3 months compared to 33 months in patients with undetectable meth-HOXA9 (p < 0.001). Meth-HOXA9 was significantly related to poor survival and may serve as a prognostic marker in patients with recurrent EOC. The longitudinal monitoring of meth-HOXA9 is clinically feasible with the perspective of aiding clinical decision making.
Keywords:
ovarian cancer; liquid biopsy; circulating tumor DNA; Homeobox A9; methylation; biomarker; prognosis; relapse 1. Introduction
Recurrent epithelial ovarian cancer (EOC) remains a clinical challenge with considerable mortality. In contrast to first-line chemotherapy, treatment of recurrent EOC is less standardized [1,2], and there are numerous chemotherapeutic agents to offer these patients. Although response rates to treatment are low (10–25%) [3], and short progression-free survival is a characteristic of recurrent EOC, most patients have a wish for further palliative treatment. Hence, the early prediction of response or resistance to chemotherapy could have important implications for clinical management and quality of life.
Patients differ concerning response to chemotherapy, progression-free survival, and overall survival; identifying the subset of patients who will benefit from treatment would be a step towards an individualized treatment strategy. An applicable biomarker to support such treatment decisions is lacking. Currently, response to treatment and the pertaining clinical decisions are based on the Response Evaluation Criteria in Solid Tumours (RECIST) and cancer antigen 125 (CA125), but these measures are inadequate. Inter-reader variability and peritoneal carcinomatosis make evaluation by imaging difficult, and since imaging is performed after several treatment cycles, months of ineffective treatment may be the result. The lack of expression of CA125 in a proportion of patients [4,5], combined with the challenges of monitoring platinum-resistant EOC [6,7], makes CA125 an inappropriate evaluation marker.
Although BRCA 1/2 and TP53 mutations are frequent in EOC, one consistent mutation is lacking, mainly due to the molecular heterogeneity and low mutational load in EOC [8,9,10]. Moreover, tumor subclones may arise during disease progression and alter the pattern and proportion of aberrations between the primary tumor and metastases [11]. Analysis of circulating tumor-specific DNA (ctDNA) bypasses these issues because it is anticipated to be released from multiple tumor regions, and reflects both intratumoral heterogeneity and evolution, with the perspective of repeated measurement for the evaluation of disease progression and treatment response. The use of assays assessing genomic variants of ctDNA in EOC is increasing [12,13], but the potential of ctDNA assays for monitoring treatment response in patients with EOC has only been sparsely examined [14].
Aberrant methylation patterns are detectable in the majority of malignant tumor cells and methylated ctDNA has, to some extent, been examined in EOC. For individual genes, however, the diversity of methylation profiles and frequency of methylation detection vary greatly between studies [15], and the reported changes remain unverified by independent studies. Methylation of the Homeobox A9 gene (HOXA9) has especially been associated with EOC [16,17,18], but its role in treatment decisions and monitoring is unexplored.
The HOXA genes coordinate the patterns of the Müllerian system during embryogenesis, with HOXA9 normally expressed in the fallopian tubes [19] and was selected as the methylation marker of interest based on the previous findings [16,17,18] and small studies from our group [20,21].
In this study, we monitored methylated HOXA9 ctDNA (meth-HOXA9) in patients with recurrent EOC during chemotherapy. We included all histopathological subtypes despite heterogeneity of disease, as we wanted to investigate meth-HOXA9 ctDNA as a general, consistent marker of EOC. The aim was to identify patients who will benefit from chemotherapy as measured by overall survival and progression-free survival.
We found that meth-HOXA9 could be used as a universal prognostic biomarker in recurrent EOC, with the potential to stop ineffective treatment earlier—an increase in meth-HOXA9 after one treatment cycle is highly prognostic of outcome. The results of this study could represent a useful tool to support clinical decision making in recurrent EOC patients.
2. Materials and Methods
The reporting of this study follows the REMARK guidelines (REporting recommendations for tumor MARKer prognostic studies) [22] as recommended by the National Cancer Institute [23].
The study was approved by the Regional Committee on Health Research Ethics for Southern Denmark (S-20160049) and the Danish Data Protection Agency (16/28860). All participating patients provided written informed consent at inclusion.
2.1. Patient Eligibility
The study cohort consisted of 126 consecutively enrolled patients with recurrent EOC, who were offered palliative chemotherapy according to institutional and national guidelines at the Department of Oncology, Lillebaelt Hospital, Vejle, Denmark, between December 2016 and April 2021. Blood samples were prospectively collected for analysis of overall survival as the primary endpoint and progression-free survival and treatment response as the secondary endpoints.
The main inclusion criteria were recurrence of histologically verified epithelial EOC, evaluable disease by RECIST [24] and/or by the Gynecological Cancer Intergroup (GCIG) CA125 criteria [25], age >18 years, performance status ≤2, and life expectancy >3 months.
2.2. Analysis of Meth-HOXA9
Blood samples were collected before treatment initiation and at every treatment cycle until progression or the stopping of treatment for other reasons.
Details on DNA isolation and meth-HOXA9 analysis have been described previously [26,27] and are available in the Supplementary Materials [28,29], with details on primers and probes described in Table S1. In short, ctDNA was extracted from 4 mL plasma, and bisulfite converted following droplet digital PCR (ddPCR) analysis using an in-house designed methylation-specific assay (HOXA9) and a control assay (Albumin) described in the reference [29].
Plasma from 100 self-reported healthy donors was used to establish the limit of blank and cut-off for a positive sample (meth-HOXA9 detectable). Results were reported as number of droplets containing meth-HOXA9 accepting a <5% false positive rate [30], which resulted in a cut-off of ≥5 meth-HOXA9-containing droplets equaling a positive test, whereas samples with lower values were considered undetectable.
After determination of the cut-off for a positive sample, meth-HOXA9 was reported as a percentage of total DNA ((meth-HOXA9 copies/albumin copies) × 100) including a 95% confidence interval (CI) derived from the Poisson distribution and as detectable/undetectable (dichotomized). Meth-HOXA9 was considered undetectable if the lower 95% CI included 0.
The dynamics of meth-HOXA9 during treatment were evaluated using the percentage of meth-HOXA9 and considered stable if the 95% CI of the meth-HOXA9 measurement was within the 95% CI of the previous measurement, decreasing if the measurement was below the 95% CI of the previous measurement but still detectable, and increasing if the 95% CI of the measurement was above the 95% CI of the previous measurement.
Analysis of meth-HOXA9 was performed as blinded to the clinical endpoints.
2.3. Treatment Efficacy
Response to treatment was evaluated by Computed Tomography (CT) scans and CA125. At the time of enrollment, a CT scan was performed for the evaluation of disease according to the RECIST criteria. CT scans were repeated after every three treatment cycles (every 8–12 weeks). Patients receiving at least three treatment cycles were hence eligible for CT response evaluation unless progression had occurred before the planned assessment date. CA125 was analyzed at baseline and within five days before each treatment cycle with response defined according to the GCIG CA125 criteria. Treatment continued until progression, intolerable side effects, or the patient requesting discontinuation.
2.4. Statistical Analysis
Progression-free survival and overall survival was calculated from the start of each treatment cycle (first, second or third) to date of progression and/or death of any cause. Follow-up was censored at the time of data workup (July 2021). Kaplan-Meier curves illustrated survival, and log-rank statistics were used for comparison of survival plots. Multivariate survival analysis was performed using the Cox regression model with the proportional hazard assumption tested. The parameters entered in the multivariate Cox regression analysis were variables with a p-value < 0.1 in the univariate Cox regression analysis.
Categorical and continuous variables are presented as frequencies and means, respectively. Comparisons between groups were made with Wilcoxon rank-sum test for numeric non-parametric variables and Student’s t-test for numeric parametric data. Fischer’s exact test and chi-squared test were used for binary parametric data to compare two unpaired groups. Spearman correlation was used to consider correlations between meth-HOXA9 and age and CA125 levels, respectively. All statistical analyses were performed using Stata/IC version 16® (Stata-Corp LLC, College Station, TX, USA).
3. Results
3.1. Patient Characteristics
The majority of the 126 patients had high-grade serous carcinoma (n = 108, 85.7%). Half of the patients had received only one line of chemotherapy at enrollment, of which 25 patients (39.7%) had platinum-resistant disease and 38 patients (60.3%) had platinum-sensitive disease. The majority of patients were considered platinum resistant (n = 77, 61.1%). Baseline patient characteristics and the relation to meth-HOXA9 status are outlined in Table 1. The mean time between initial diagnosis of EOC and first treatment in the present study was 40 months (median = 26.5 (range 2–210)) and the mean number of treatment cycles was 4.4 (median = 5 (range 1–24)). The treatment regimen stated in Table 1 was the primary treatment, as 25 patients (19.8%) received maintenance therapy with Bevacizumab (n = 16) or PARP inhibitors (n = 9) after the specified chemotherapy regimen.

Table 1.
Patient characteristics and status of meth-HOXA9 at baseline.
3.2. Meth-HOXA9
At baseline, meth-HOXA9 was detected in 65.9% (83/126) of the patients. A difference in age, CA125 and treatment regimen was found between patients with and without detectable meth-HOXA9 (Table 1). Applying Spearman rank correlation coefficient, however, no correlation between meth-HOXA9 and CA125 or age was found (rho = 0.279 and 0.196). After one treatment cycle, 64% (73/114) of the patients had detectable meth-HOXA9, which dropped to 60% (60/100) after three treatment cycles.
3.3. Prognostic Role of Meth-HOXA9 in Recurrent OC
The prognostic value of meth-HOXA9 was analyzed at baseline (n = 126), at the second treatment cycle (n = 114) and after three cycles of treatment (n = 100). The 34 patients still alive at the time of analysis (July 2021) had a median follow-up of 16.3 months [range 2.4–47.2].
The median overall survival in patients with detectable and undetectable meth-HOXA9 at baseline was 8.9 and 17.9 months (logrank p = 0.002, Hazard ratio (HR) = 2.04, 95% CI: 1.29–3.23, Figure 1). At the second treatment cycle (3–4 weeks after baseline), the difference was even more pronounced (8.5 vs. 29 months, logrank p < 0.001, HR = 3.3, 95% CI: 1.95–5.5). This also applied to progression-free survival with a median of 4.2 and 7.6 months at baseline (p < 0.001) in patients with detectable and undetectable meth-HOXA9, respectively, and 3.5 and 7.2 months at the second treatment cycle (p < 0.001).
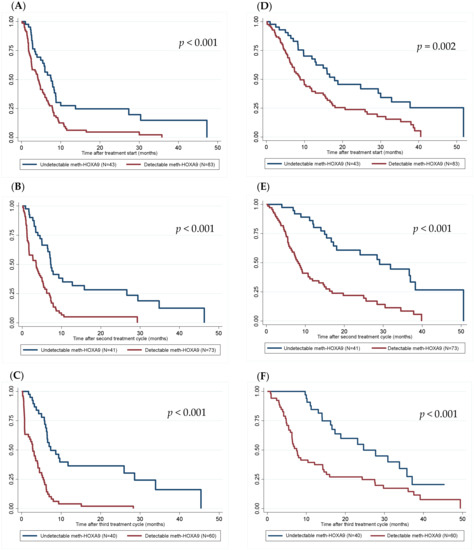
Figure 1.
Kaplan-Meier plots for detectable vs. undetectable meth-HOXA9 at baseline ((A)—PFS at baseline, (D)—OS at baseline), at second treatment cycle ((B)—PFS at second treatment cycle, (E)—OS at second treatment cycle), and at first evaluation after three treatment cycles ((C)—PFS after three treatment cycles, (F)—OS after three treatment cycles) for progression-free survival (A–C) and overall survival (D–F) (months).
At the first evaluation after three treatment cycles, the difference in overall survival remained significant with a median overall survival of 7.5 and 24.7 months in patients with detectable and undetectable meth-HOXA9, respectively (logrank p < 0.001, HR = 2.54, 95% CI: 1.48–4.36).
In addition to meth-HOXA9 status performance status, platinum sensitivity, previous lines of chemotherapy, and CA125 > 500 kUI/L were correlated with overall survival in the univariate analysis (Supplementary Materials, Table S2) and included in the multivariate analysis, in which meth-HOXA9 remained prognostic of outcome at baseline (HR: 1.89, p = 0.008), at second treatment cycle (HR: 3.06, p < 0.001), and at status after three treatment cycles (HR: 2.17, p = 0.013, Table 2).
Table 2.
Multivariate Cox regression analyses.
The univariate and multivariate Cox regression analyses were repeated in the subgroup of patients with high-grade serous carcinomas, in which meth-HOXA9 remained significant of outcome (Supplementary Materials, Tables S3 and S4).
3.4. Meth-HOXA9 Dynamics during Treatment
Meth-HOXA9 dynamics were evaluated after the first, second and third treatment cycle. Of the 114 patients evaluable after the first treatment cycle, 17 (14.9%) had an increase in meth-HOXA9 (above the 95% CI of the baseline level), 38 (33.3%) had stable meth-HOXA9, 34 (29.8%) had undetectable meth-HOXA9 of which the status changed from detectable to undetectable in 6, and 25 patients (21.9%) had a decrease in meth-HOXA9 (below the 95% CI of the baseline level) (Table 3). Since only four and six patients had a decrease in meth-HOXA9 after the second and third treatment cycle, this group was merged with the “stable” group in the survival analysis.
Table 3.
Dynamics of meth-HOXA9 during treatment and the correlation with overall survival.
Patients with an increase in meth-HOXA9 after one treatment cycle had a median overall survival of 5.3 months, compared to 11.9 months in patients with stable or decreasing meth-HOXA9 and 33 months in patients with undetectable meth-HOXA9 (p < 0.001). An increase after the second and third treatment cycle continued to be prognostic with an overall survival of 5.5 months, while undetectable meth-HOXA9 remained favorable (overall survival = 29.1 and 24.7 months, respectively, p < 0.001 and p = 0.050).
If patients with stable, decreasing and undetectable meth-HOXA9 were grouped (n = 97) and compared to patients with an increase in meth-HOXA9 (n = 17) after one treatment cycle, an overall survival of 16 and 5.3 months, respectively, was found (p < 0.001, Figure 2).
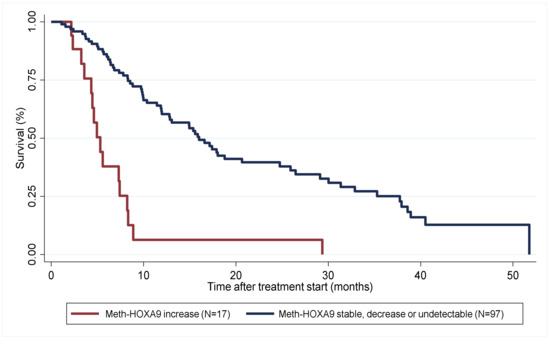
Figure 2.
Kaplan-Meier plot illustrating overall survival for patients with an increase in meth-HOXA9 (red, n = 17) vs. patients with stable, decreasing or undetectable meth-HOXA9 (blue, n = 97) after one treatment cycle (months).
3.5. Meth-HOXA9 and Platinum-Resistant Disease
At baseline, meth-HOXA9 was detected in 68.8% (53/77) of the patients with platinum-resistant disease. The median overall survival in platinum-resistant patients with detectable and undetectable meth-HOXA9 at baseline was 6.7 and 12.8 months (p = 0.0274). At the second treatment cycle, the fraction of patients with detectable meth-HOXA9 was 71.6% (48/67), in which the median overall survival was 6.4 months compared to 18 months in patients with undetectable meth-HOXA9 at the second treatment cycle (p = 0.0012).
This also applied to progression-free survival with a median of 2.6 and 4.9 months at baseline (p = 0.007) in patients with detectable and undetectable meth-HOXA9, respectively. At the second treatment cycle, the difference in progression-free survival was even more pronounced in the subgroup of patients with platinum-resistant disease (1.7 vs. 6.4 months, logrank p < 0.001, HR = 3.06, 95% CI: 1.64–5.71).
Of 67 patients with platinum-resistant disease and evaluable meth-HOXA9 dynamics after the first treatment cycle, 14 patients (20.9%) had an increase in meth-HOXA9 compared to three patients (6.4%) in the subgroup of patients with platinum-sensitive disease.
An increase in meth-HOXA9 after one treatment cycle in patients with platinum-resistant disease was significantly related to poor survival with a median overall survival of 5 months, compared to 8.6 months in patients with stable or decreasing meth-HOXA9, and 18.8 months in patients with undetectable meth-HOXA9 (p < 0.001).
3.6. Treatment Efficacy
Of 97 patients with evaluable imaging after three treatment cycles, 37 (38.1%) had partial response, 39 (40.2%) had stable disease and 21 (21.6%) had progression. Twenty-four patients (19.0%) had progression before evaluable imaging after three treatment cycles, out of which nine cases were confirmed by imaging. Due to the withdrawal of consent and poor general condition, five patients were non-evaluable by imaging after three cycles. Of the 77 patients with platinum-resistant disease, 52 (67.5%) were evaluable after three cycles of treatment, of which 10 (19.2%) had partial response.
Forty-three patients (34.1%) were non-evaluable by CA125, i.e., CA125 < 70 kUI/L throughout the treatment course (n = 29), or the number of measurements was ≤2 (n = 14). Applying Cox regression overall survival was not related to response by CA125 (HR = 1.30, p = 0.150).
Baseline meth-HOXA9 and its dynamics from baseline to the second treatment cycle are correlated to response by imaging and CA125 in Supplementary Materials, Table S5.
4. Discussion
This translational study was initiated to examine meth-HOXA9 as a prognostic biomarker. Meth-HOXA9 was found to be significantly correlated to clinical outcomes in patients undergoing treatment for recurrent EOC. Patients with detectable meth-HOXA9 at baseline had significantly poorer overall survival after one and after three treatment cycles compared to those with undetectable meth-HOXA9. Furthermore, patients with an increase in meth-HOXA9 after one treatment cycle had significantly reduced overall survival compared to patients having stable, decreasing, or undetectable meth-HOXA9. The findings applied both platinum-sensitive and platinum-resistant patients, though patients with platinum-resistant disease and detectable meth-HOXA9 at baseline or at second treatment cycle had a remarkably short progression-free survival (2.6 and 1.7 months).
Mainly for diagnostic purposes, methylated HOXA9 has previously been investigated in tissue [16,17] and in plasma/serum [18,31], and a recent study examined its presence in ascites [32] of patients with EOC. To our knowledge, no other studies than the small ones from our group [20,21] have explored the correlation of meth-HOXA9 with prognosis.
A considerable number of studies, including ongoing clinical trials, examine ctDNA in relation to monitoring treatment response in EOC [12,33]; however, to date, no ctDNA-related test has been approved and evidence for using ctDNA to guide clinical decision making is weak [34]. In a study by Oikkonen et al., response to therapy using two or three consecutive ctDNA samples during treatment of EOC was examined, with the possibility of the rapid discovery of resistant cell populations and the early detection of recurrence [35]. The study applied a ctDNA workflow detecting >500 cancer-related genes, but included only 12 patients all with high-grade serous adenocarcinomas. This proof-of-principle study highlights, however, the potential to identify poor-responding patients after first cycles of chemotherapy using longitudinal ctDNA samples.
Recurrent EOC represents a heterogeneous group of patients with varying prognoses and unpredictable response to further treatment, for which the identification of poor-responders will be of great importance. EOC that relapse within 6 months of platinum treatment represents an extraordinary clinical challenge with low response rates to therapy and no predictive tests or signature to identify patients who will respond to specific drugs.
In the present study, an increase in meth-HOXA9 after one cycle of treatment indicated a significantly reduced overall survival compared to undetectable meth-HOXA9, throughout histopathology and platinum status. The stable or decreasing parameter was not as favorable as the undetectable one. These findings emphasize that ctDNA dynamics can provide real-time therapeutic guidance, predict prognosis, and evaluate treatment resistance ahead of imaging, with the possibility to stop an inefficient treatment earlier for improved outcome and quality of life.
In the recurrent setting, a patient may be better served with the best supportive care rather than active anti-cancer treatment, which is justified only if there is a reasonable chance of benefit. Despite the heterogeneous group of patients in our study, meth-HOXA9 could serve as a prognostic marker across types of treatment and platinum sensitivity with the potential to observe progression at an early stage and reduce the number of chemotherapy cycles without affecting survival.
As only a minor subgroup of patients with recurrent EOC, and especially platinum-resistance, will benefit from treatment [3], there is an obvious need for a new marker to select these patients. The fact that 34.1% of the patients (n = 43) in our study were non-evaluable by CA125, and since CT scanning has several limitations such as carcinomatosis, costs, inter-operator and/or inter-reader variability, underlines the need for a new biomarker to support treatment decisions.
Even though the plasma samples were prospectively collected with the purpose of biomarker analysis, the primary limitation of this study is its retrospective nature. The samples were stored for up to four years, which could have affected the amount of DNA [36]. In addition, the quantitative measurements of ctDNA represent a technical challenge, as the amount of circulating DNA might fluctuate over time and be susceptible to chemotherapy and albumin status. Quantification of meth-HOXA9, however, was performed in a single laboratory. This strength secures uniformity, reproducibility, and provides the proper validation of analytical variation using only one methylation marker applied to a large proportion of patients.
One of the major issues of incorporating ctDNA in the monitoring of treatment efficacy is that despite the evidence of clinical validity, there is no evidence of clinical utility [34]. Moreover, there is currently no consensus on how to evaluate and report ctDNA during treatment, and several different definitions have been reported, e.g., ‘relative change from baseline’, ‘x-fold reduction/increase’ and statistical calculations, with comparisons and validation of the definitions still lacking [21,37,38,39].
Further efforts are required for the standardization of the ctDNA analysis and for demonstrating improvement in treatment management with the use of the assay compared to not using it. To secure clinical validity, the data need to be validated in prospective, ideally randomized trials powered specifically for meth-HOXA9 as a biomarker [23], and with patient management guided by meth-HOXA9 analysis.
5. Conclusions
In conclusion, patients with detectable meth-HOXA9 at treatment initiation had a significantly shorter progression-free survival and overall survival than those with undetectable meth-HOXA9. Outlining a high-risk population using meth-HOXA9 prior to treatment initiation or after just one cycle of treatment is an attainable method of screening, with the potential to spare patients of ineffective treatment.
Although meth-HOXA9 is in its infancy and awaiting validation in randomized controlled trials, it seems to be a marker of clinical response that could facilitate a personalized treatment approach.
Supplementary Materials
The following supporting information can be downloaded at: https://www.mdpi.com/article/10.3390/cancers14071766/s1, Supplementary Materials; Table S1: Details on primers and probes; Table S2: Univariate Cox regression analyses; Table S3: Univariate Cox regression analyses in patients with high-grade serous carcinomas; Table S4: Multivariate Cox regression analyses in patients with high-grade serous carcinomas; Table S5: Correlation of meth-HOXA9 dynamics after one cycle of treatment and meth-HOXA9 status at baseline with Response Evaluation Criteria in Solid Tumours (RECIST) (A) and CA125 response (B). References [28,29] are cited in the Supplementary Materials.
Author Contributions
Conceptualization, L.F., A.J. and K.D.S.; methodology, R.F.A.; validation, R.F.A., M.W.; formal analysis and investigation, L.F.; resources, R.F.A., M.W., J.R.H. and P.A.; data curation, J.R.H. and L.F.; writing—original draft preparation, L.F.; writing—review and editing, all authors; supervision, project administration, and funding acquisition, A.J., K.D.S. All authors have read and agreed to the published version of the manuscript.
Funding
This research was funded by the Department of Oncology, Lillebaelt Hospital (Vejle)—University Hospital of Southern Denmark, The Region of Southern Denmark (19/15008), and the NEYE Foundation, Denmark.
Institutional Review Board Statement
The study was conducted in accordance with the Declaration of Helsinki, and approved by the Regional Committee on Health Research Ethics for Southern Denmark (S-20160049) and the Danish Data Protection Agency (16/28860).
Informed Consent Statement
Informed consent was obtained from all subjects involved in the study.
Data Availability Statement
The data presented in this study are available on request from the corresponding author. The data are not publicly available due to privacy (General Data Protection Regulation, GDPR) and ethical restrictions.
Acknowledgments
The authors would like to thank Yvette Schandorf Sørensen for collecting data, Pia Nielsen, Lone Hartman Hansen, and Tina Brandt Christensen for their work in the laboratory, and Karin Larsen for linguistic editing of the manuscript.
Conflicts of Interest
The authors declare no conflict of interest.
References
- Francis, J.A.; Coakley, N.; Elit, L.; Mackay, H. Systemic therapy for recurrent epithelial ovarian cancer: A clinical practice guideline. Curr. Oncol. 2017, 24, e540–e546. [Google Scholar] [CrossRef] [PubMed] [Green Version]
- Ledermann, J.A.; Raja, F.A.; Fotopoulou, C.; Gonzalez-Martin, A.; Colombo, N.; Sessa, C. Newly diagnosed and relapsed epithelial ovarian carcinoma: ESMO clinical practice guidelines for diagnosis, treatment and follow-up. Ann. Oncol. 2013, 24, vi24–vi32. [Google Scholar] [CrossRef] [PubMed]
- Corrado, G.; Salutari, V.; Palluzzi, E.; Distefano, M.G.; Scambia, G.; Ferrandina, G. Optimizing treatment in recurrent epithelial ovarian cancer. Expert Rev. Anticancer Ther. 2017, 17, 1147–1158. [Google Scholar] [CrossRef]
- Moss, E.L.; Hollingworth, J.; Reynolds, T.M. The role of CA125 in clinical practice. J. Clin. Pathol. 2005, 58, 308–312. [Google Scholar] [CrossRef] [PubMed] [Green Version]
- Yang, W.-L.; Lu, Z.; Bast Jr, R.C.; Moss, E.L.; Hollingworth, J.; Reynolds, T.M. The role of biomarkers in the management of epithelial ovarian cancer. J. Clin. Pathol. 2017, 58, 577–591. [Google Scholar] [CrossRef]
- Rustin, G.J.S.; Hall, M.R. Is CA125 useful in monitoring patients with platinum-resistant ovarian cancer? Ann. Oncol. 2016, 27, 1365–1366. [Google Scholar] [CrossRef] [PubMed]
- Lindemann, K.; Kristensen, G.; Mirza, M.R.; Davies, L.; Hilpert, F.; Romero, I.; Ayhan, A.; Burges, A.; Rubio, M.J.; Raspagliesi, F.; et al. Poor concordance between CA-125 and RECIST at the time of disease progression in patients with platinum-resistant ovarian cancer: Analysis of the AURELIA trial. Ann. Oncol. 2016, 27, 1505–1510. [Google Scholar] [CrossRef] [PubMed]
- Alexandrov, L.B.; Nik-Zainal, S.; Wedge, D.C.; Aparicio, S.A.J.R.; Behjati, S.; Biankin, A.V.; Bignell, G.R.; Bolli, N.; Borg, A.; Børresen-Dale, A.L.; et al. Signatures of mutational processes in human cancer. Nature 2013, 500, 415–421. [Google Scholar] [CrossRef] [Green Version]
- Bell, D.; Berchuck, A.; Birrer, M.; Chien, J.; Cramer, D.W.; Dao, F.; Dhir, R.; Disaia, P.; Gabra, H.; Glenn, P.; et al. Integrated genomic analyses of ovarian carcinoma. Nature 2011, 474, 609–615. [Google Scholar] [CrossRef]
- Vogelstein, B.; Papadopoulos, N.; Velculescu, V.E.; Zhou, S.; Diaz, L.A.J.; Kinzler, K.W. Cancer Genome Landscapes. Science 2013, 339, 1546–1558. [Google Scholar] [CrossRef]
- Yang, M.; Forbes, M.E.; Bitting, R.L.; O’Neill, S.S.; Chou, P.C.; Topaloglu, U.; Miller, L.D.; Hawkins, G.A.; Grant, S.C.; DeYoung, B.R.; et al. Incorporating blood-based liquid biopsy information into cancer staging: Time for a TNMB system? Ann. Oncol. 2018, 29, 311–323. [Google Scholar] [CrossRef] [PubMed] [Green Version]
- Asante, D.B.; Calapre, L.; Ziman, M.; Meniawy, T.M.; Gray, E.S. Liquid biopsy in ovarian cancer using circulating tumor DNA and cells: Ready for prime time? Cancer Lett. 2020, 468, 59–71. [Google Scholar] [CrossRef] [PubMed]
- Bhardwaj, B.K.; Thankachan, S.; Venkatesh, T.; Suresh, P.S. Liquid biopsy in ovarian cancer. Clin. Chim. Acta 2020, 510, 28–34. [Google Scholar] [CrossRef] [PubMed]
- Jakobsen, A.; Andersen, R.F.; Hansen, T.F.; Jensen, L.H.; Faaborg, L.; Steffensen, K.D.; Thomsen, C.B.; Wen, S.W.C. Early ctDNA response to chemotherapy. A potential surrogate marker for overall survival. Eur. J. Cancer 2021, 149, 128–133. [Google Scholar] [CrossRef]
- Barton, C.A.; Hacker, N.F.; Clark, S.J.; O’Brien, P.M. DNA methylation changes in ovarian cancer: Implications for early diagnosis, prognosis and treatment. Gynecol. Oncol. 2008, 109, 129–139. [Google Scholar] [CrossRef]
- Wu, Q.; Lothe, R.A.; Ahlquist, T.; Silins, I.; Tropé, C.G.; Micci, F.; Nesland, J.M.; Suo, Z.; Lind, G.E. DNA methylation profiling of ovarian carcinomas and their in vitro models identifies HOXA9, HOXB5, SCGB3A1, and CRABP1 as novel targets. Mol. Cancer 2007, 6, 45. [Google Scholar] [CrossRef] [Green Version]
- Montavon, C.; Gloss, B.S.; Warton, K.; Barton, C.A.; Statham, A.L.; Scurry, J.P.; Tabor, B.; Nguyen, T.V.; Qu, W.; Samimi, G.; et al. Prognostic and diagnostic significance of DNA methylation patterns in high grade serous ovarian cancer. Gynecol. Oncol. 2012, 124, 582–588. [Google Scholar] [CrossRef]
- Singh, A.; Gupta, S.; Badarukhiya, J.A.; Sachan, M. Detection of aberrant methylation of HOXA9 and HIC1 through multiplex MethyLight assay in serum DNA for the early detection of epithelial ovarian cancer. Int. J. Cancer 2020, 147, 1740–1752. [Google Scholar] [CrossRef]
- Bhatlekar, S.; Fields, J.Z.; Boman, B.M. HOX genes and their role in the development of human cancers. J. Mol. Med. 2014, 92, 811–823. [Google Scholar] [CrossRef]
- Rusan, M.; Andersen, R.F.; Jakobsen, A.; Steffensen, K.D. Circulating HOXA9-methylated tumour DNA: A novel biomarker of response to poly (ADP-ribose) polymerase inhibition in BRCA-mutated epithelial ovarian cancer. Eur. J. Cancer 2020, 125, 121–129. [Google Scholar] [CrossRef]
- Thomsen, C.B.; Andersen, R.F.; Steffensen, K.D.; Adimi, P.; Jakobsen, A. Delta tocotrienol in recurrent ovarian cancer. A phase II trial. Pharmacol. Res. 2019, 141, 392–396. [Google Scholar] [CrossRef]
- McShane, L.M.; Altman, D.G.; Sauerbrei, W.; Taube, S.E.; Gion, M.; Clark, G.M. REporting recommendations for tumour MARKer prognostic studies (REMARK). Eur. J. Cancer 2005, 41, 1690–1696. [Google Scholar] [CrossRef] [PubMed] [Green Version]
- Simon, R.M.; Paik, S.; Hayes, D.F. Use of archived specimens in evaluation of prognostic and predictive biomarkers. J. Natl. Cancer Inst. 2009, 101, 1446–1452. [Google Scholar] [CrossRef] [PubMed] [Green Version]
- Eisenhauer, E.A.; Therasse, P.; Bogaerts, J.; Schwartz, L.H.; Sargent, D.; Ford, R.; Dancey, J.; Arbuck, S.; Gwyther, S.; Mooney, M.; et al. New response evaluation criteria in solid tumours: Revised RECIST guideline (version 1.1). Eur. J. Cancer 2009, 45, 228–247. [Google Scholar] [CrossRef] [PubMed]
- Rustin, G.J.S.; Vergote, I.; Eisenhauer, E.; Pujade-Lauraine, E.; Quinn, M.; Thigpen, T.; du Bois, A.; Kristensen, G.; Jakobsen, A.; Sagae, S.; et al. Definitions for Response and Progression in Ovarian Cancer Clinical Trials Incorporating RECIST 1.1 and CA 125 Agreed by the Gynecological Cancer Intergroup (GCIG). Int. J. Gynecol. Cancer 2011, 21, 419–423. [Google Scholar] [CrossRef]
- Wen, S.W.C.; Andersen, R.F.; Hansen, T.F.; Nyhus, C.H.; Hager, H.; Hilberg, O.; Jakobsen, A. The prognostic impact of circulating homeobox A9 methylated DNA in advanced non-small cell lung cancer. Transl. Lung Cancer Res. 2021, 10, 855–865. [Google Scholar] [CrossRef]
- Wen, S.W.C.; Andersen, R.F.; Petersen, L.M.S.; Hager, H.; Hilberg, O.; Jakobsen, A.; Hansen, T.F. Comparison of mutated kras and methylated HOXA9 tumor-specific dna in advanced lung adenocarcinoma. Cancers 2020, 12, 3728. [Google Scholar] [CrossRef]
- Pallisgaard, N.; Spindler, K.L.G.; Andersen, R.F.; Brandslund, I.; Jakobsen, A. Controls to validate plasma samples for cell free DNA quantification. Clin. Chim. Acta 2015, 446, 141–146. [Google Scholar] [CrossRef]
- Roperch, J.P.; Incitti, R.; Forbin, S.; Bard, F.; Mansour, H.; Mesli, F.; Baumgaertner, I.; Brunetti, F.; Sobhani, I. Aberrant methylation of NPY, PENK, and WIF1 as a promising marker for blood-based diagnosis of colorectal cancer. BMC Cancer 2013, 13, 566. [Google Scholar] [CrossRef] [Green Version]
- Clinical and Laboratory Standards Institute. Evaluation of Detection Capability for Clinical Laboratory Measurement Procedures; Approved Guideline-Second Edition, CLSI Document EP17-A2; Clinical and Laboratory Standards Institute: Wayne, PA, USA, 2012. [Google Scholar]
- Faaborg, L.; Fredslund Andersen, R.; Waldstrøm, M.; Høgdall, E.; Høgdall, C.; Adimi, P.; Jakobsen, A.; Dahl Steffensen, K. Analysis of HOXA9 methylated ctDNA in ovarian cancer using sense-antisense measurement. Clin. Chim. Acta 2021, 522, 152–157. [Google Scholar] [CrossRef]
- Werner, B.; Yuwono, N.; Duggan, J.; Liu, D.; David, C.; Srirangan, S.; Provan, P.; DeFazio, A.; Arora, V.; Farrell, R.; et al. Cell-free DNA is abundant in ascites and represents a liquid biopsy of ovarian cancer. Gynecol. Oncol. 2021, 162, 720–727. [Google Scholar] [CrossRef] [PubMed]
- Sharbatoghli, M.; Vafaei, S.; Aboulkheyr Es, H.; Asadi-Lari, M.; Totonchi, M.; Madjd, Z. Prediction of the treatment response in ovarian cancer: A ctDNA approach. J. Ovarian Res. 2020, 13, 124. [Google Scholar] [CrossRef] [PubMed]
- Merker, J.D.; Oxnard, G.R.; Compton, C.; Diehn, M.; Hurley, P.; Lazar, A.J.; Lindeman, N.; Lockwood, C.M.; Rai, A.J.; Schilsky, R.L.; et al. Circulating tumor DNA analysis in patients with cancer: American society of clinical oncology and college of American pathologists joint review. J. Clin. Oncol. 2018, 36, 1631–1641. [Google Scholar] [CrossRef] [PubMed]
- Oikkonen, J.; Zhang, K.; Salminen, L.; Schulman, I.; Lavikka, K.; Andersson, N.; Ojanperä, E.; Hietanen, S.; Grénman, S.; Lehtonen, R.; et al. Prospective Longitudinal ctDNA Workflow Reveals Clinically Actionable Alterations in Ovarian Cancer. JCO Precis. Oncol. 2019, 3, 1–12. [Google Scholar] [CrossRef] [PubMed]
- Sozzi, G.; Roz, L.; Conte, D.; Mariani, L.; Andriani, F.; Verderio, P.; Pastorino, U. Effects of prolonged storage of whole plasma or isolated plasma DNA on the results of circulating DNA quantification assays. J. Natl. Cancer Inst. 2005, 97, 1848–1850. [Google Scholar] [CrossRef] [Green Version]
- Thompson, J.C.; Carpenter, E.L.; Silva, B.A.; Rosenstein, J.; Chien, A.L.; Quinn, K.; Espenschied, C.R.; Mak, A.; Kiedrowski, L.A.; Lefterova, M.; et al. Serial Monitoring of Circulating Tumor DNA by Next-Generation Gene Sequencing as a Biomarker of Response and Survival in Patients With Advanced NSCLC Receiving Pembrolizumab-Based Therapy. JCO Precis. Oncol. 2021, 5, 510–524. [Google Scholar] [CrossRef]
- Jia, N.; Sun, Z.; Gao, X.; Cheng, Y.; Zhou, Y.; Shen, C.; Chen, W.; Wang, X.; Shi, R.; Li, N.; et al. Serial monitoring of circulating tumor DNA in patients with metastatic colorectal cancer to predict the therapeutic response. Front. Genet. 2019, 10, 470. [Google Scholar] [CrossRef] [Green Version]
- Provencio, M.; Serna-Blasco, R.; Franco, F.; Calvo, V.; Royuela, A.; Auglytė, M.; Sánchez-Hernández, A.; de Julián Campayo, M.; García-Girón, C.; Dómine, M.; et al. Analysis of circulating tumour DNA to identify patients with epidermal growth factor receptor–positive non-small cell lung cancer who might benefit from sequential tyrosine kinase inhibitor treatment. Eur. J. Cancer 2021, 149, 61–72. [Google Scholar] [CrossRef]
Publisher’s Note: MDPI stays neutral with regard to jurisdictional claims in published maps and institutional affiliations. |
© 2022 by the authors. Licensee MDPI, Basel, Switzerland. This article is an open access article distributed under the terms and conditions of the Creative Commons Attribution (CC BY) license (https://creativecommons.org/licenses/by/4.0/).