
Sphingosine 1-Phosphate Receptor 5 (S1P5) Deficiency Promotes Proliferation and Immortalization of Mouse Embryonic Fibroblasts

 ,
,  , and
, and 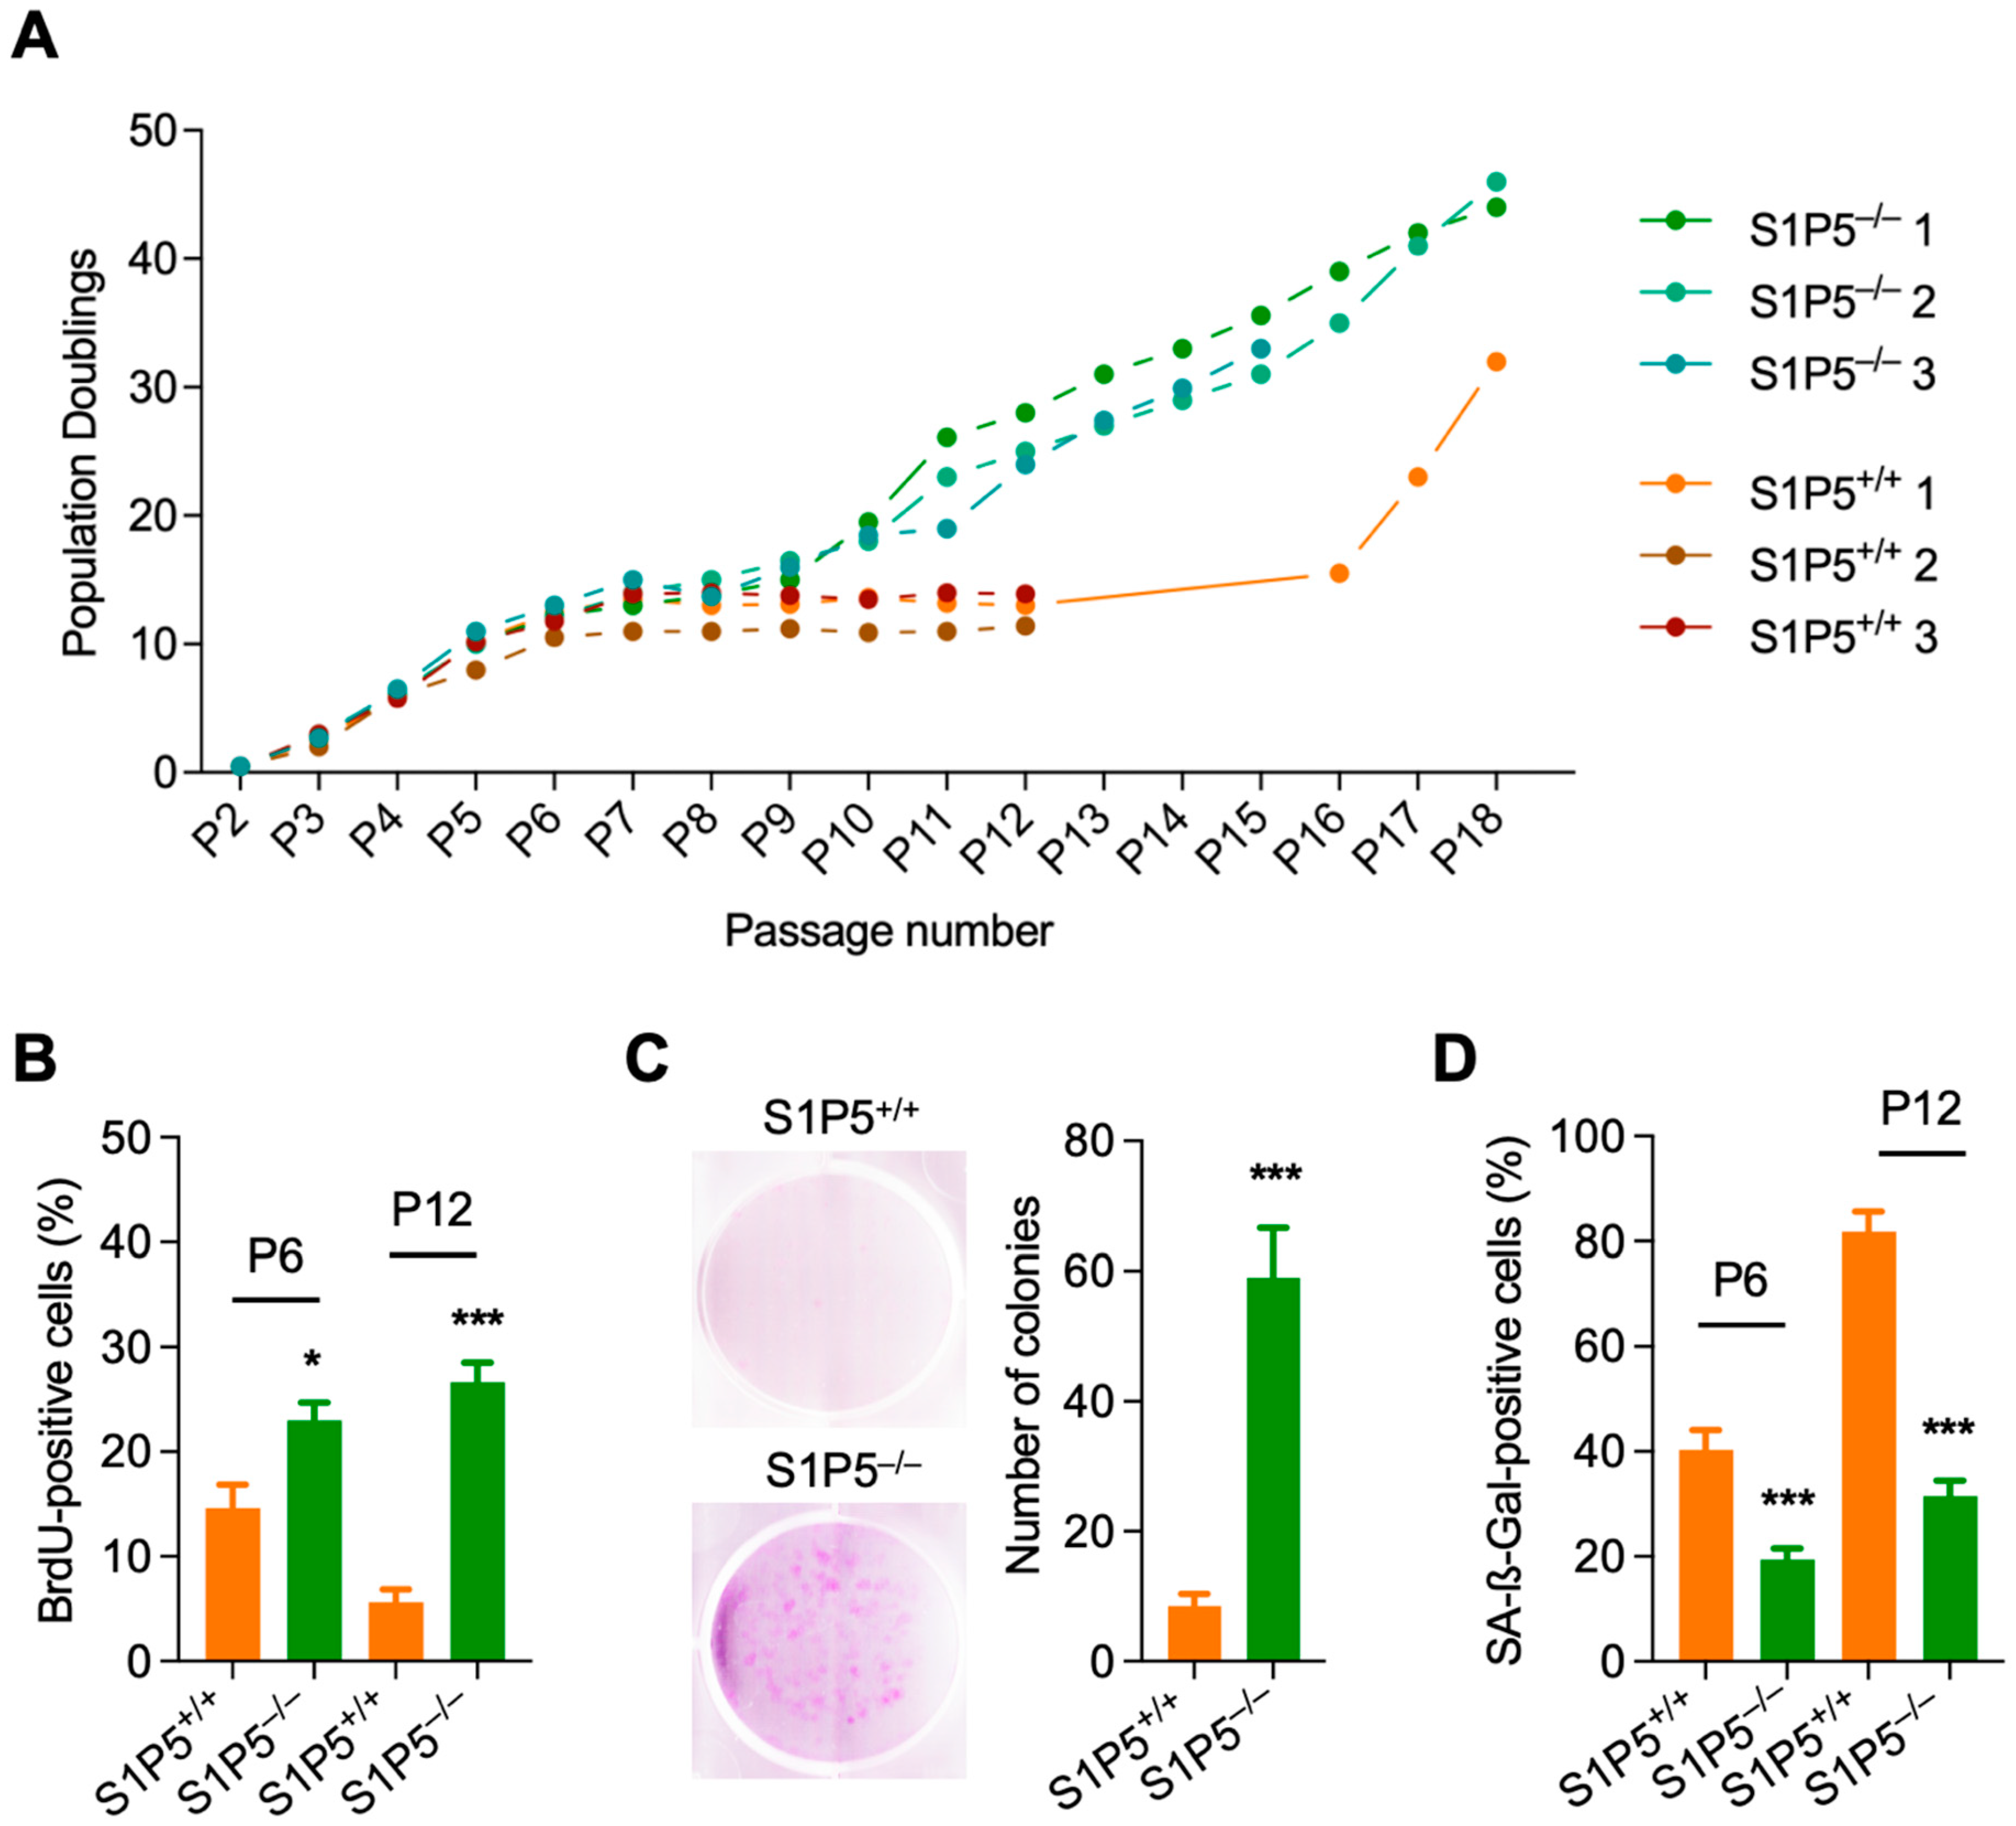
Abstract
Simple Summary
Abstract
1. Introduction
2. Materials and Methods
2.1. Cell Culture and Transfections
2.2. Plasmids, Reagents and Antibodies
2.3. [0S] GTPγS Binding Assay
2.4. Cell Proliferation and Survival Assays
2.5. BrdU Incorporation
2.6. Colony Formation Assay
2.7. Cell Senescence Assay
2.8. Cell Spreading Assay
2.9. Cell Adhesion Assay
2.10. Transwell Migration Assay
2.11. Immunocytochemistry
2.12. Immunoblotting
2.13. Data and Statistical Analyses
3. Results
3.1. S1P5 Deficiency Confers Resistance to Cellular Senescence and Promotes MEFs Immortalization
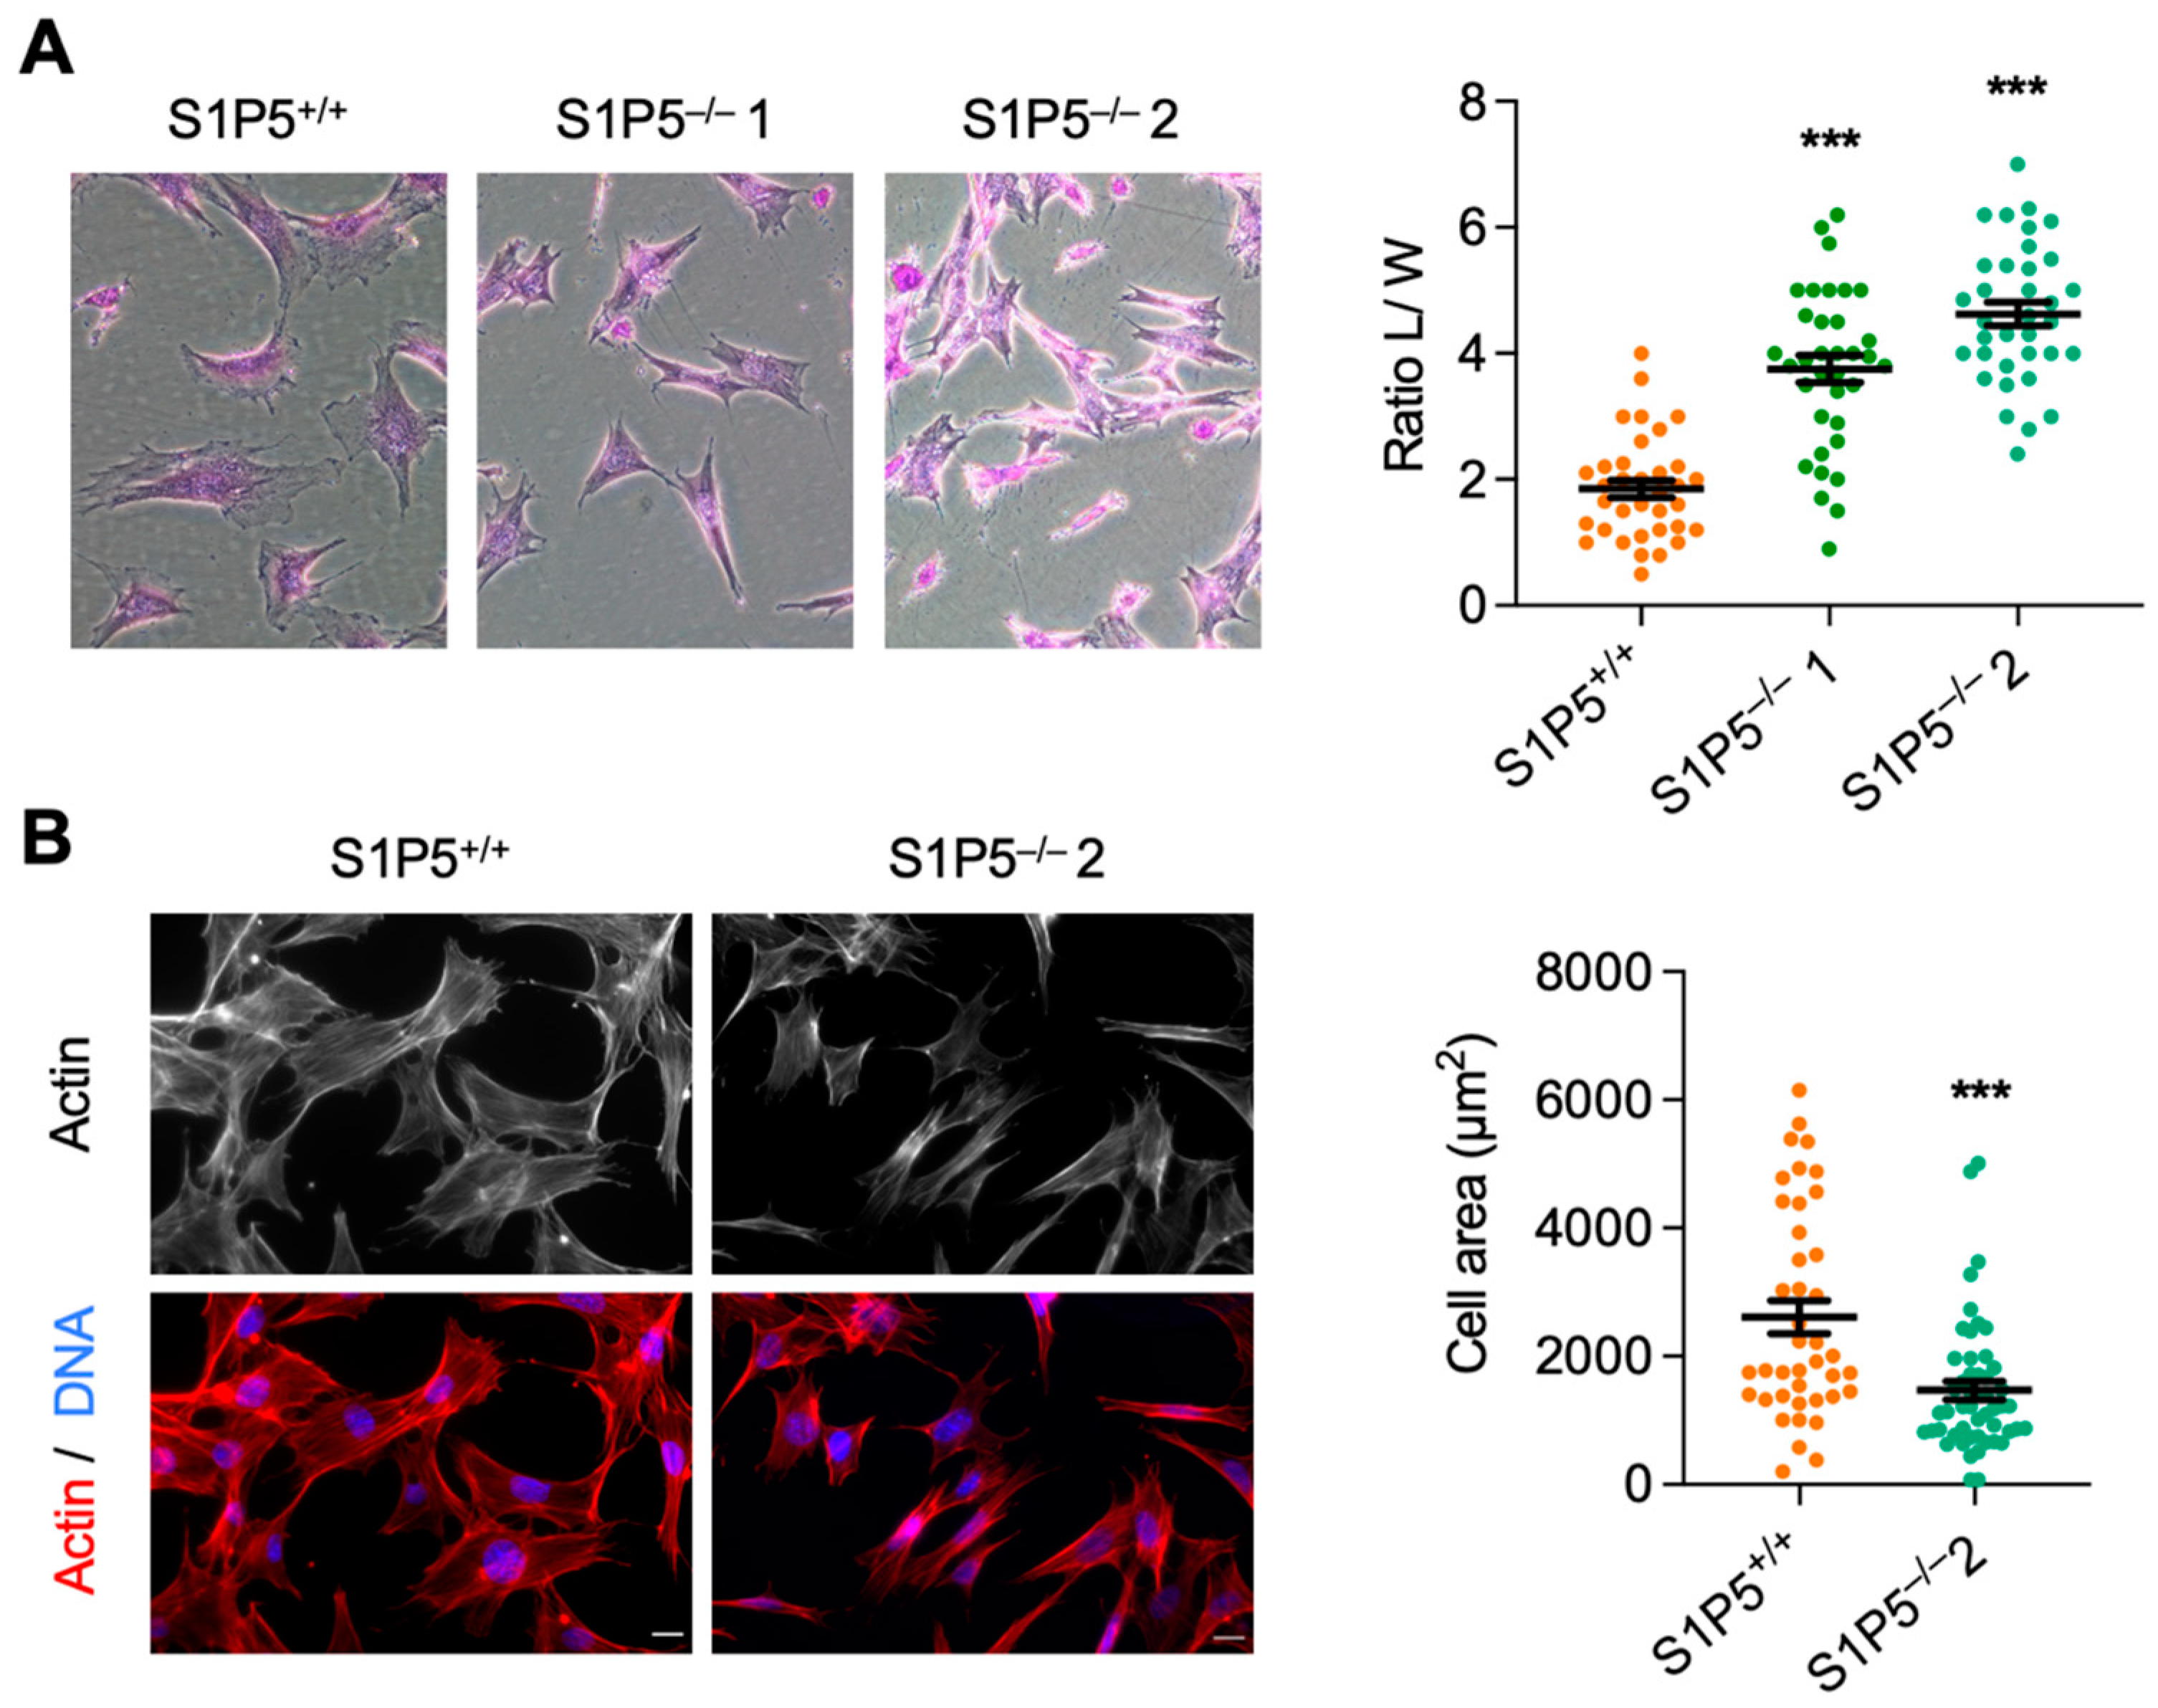
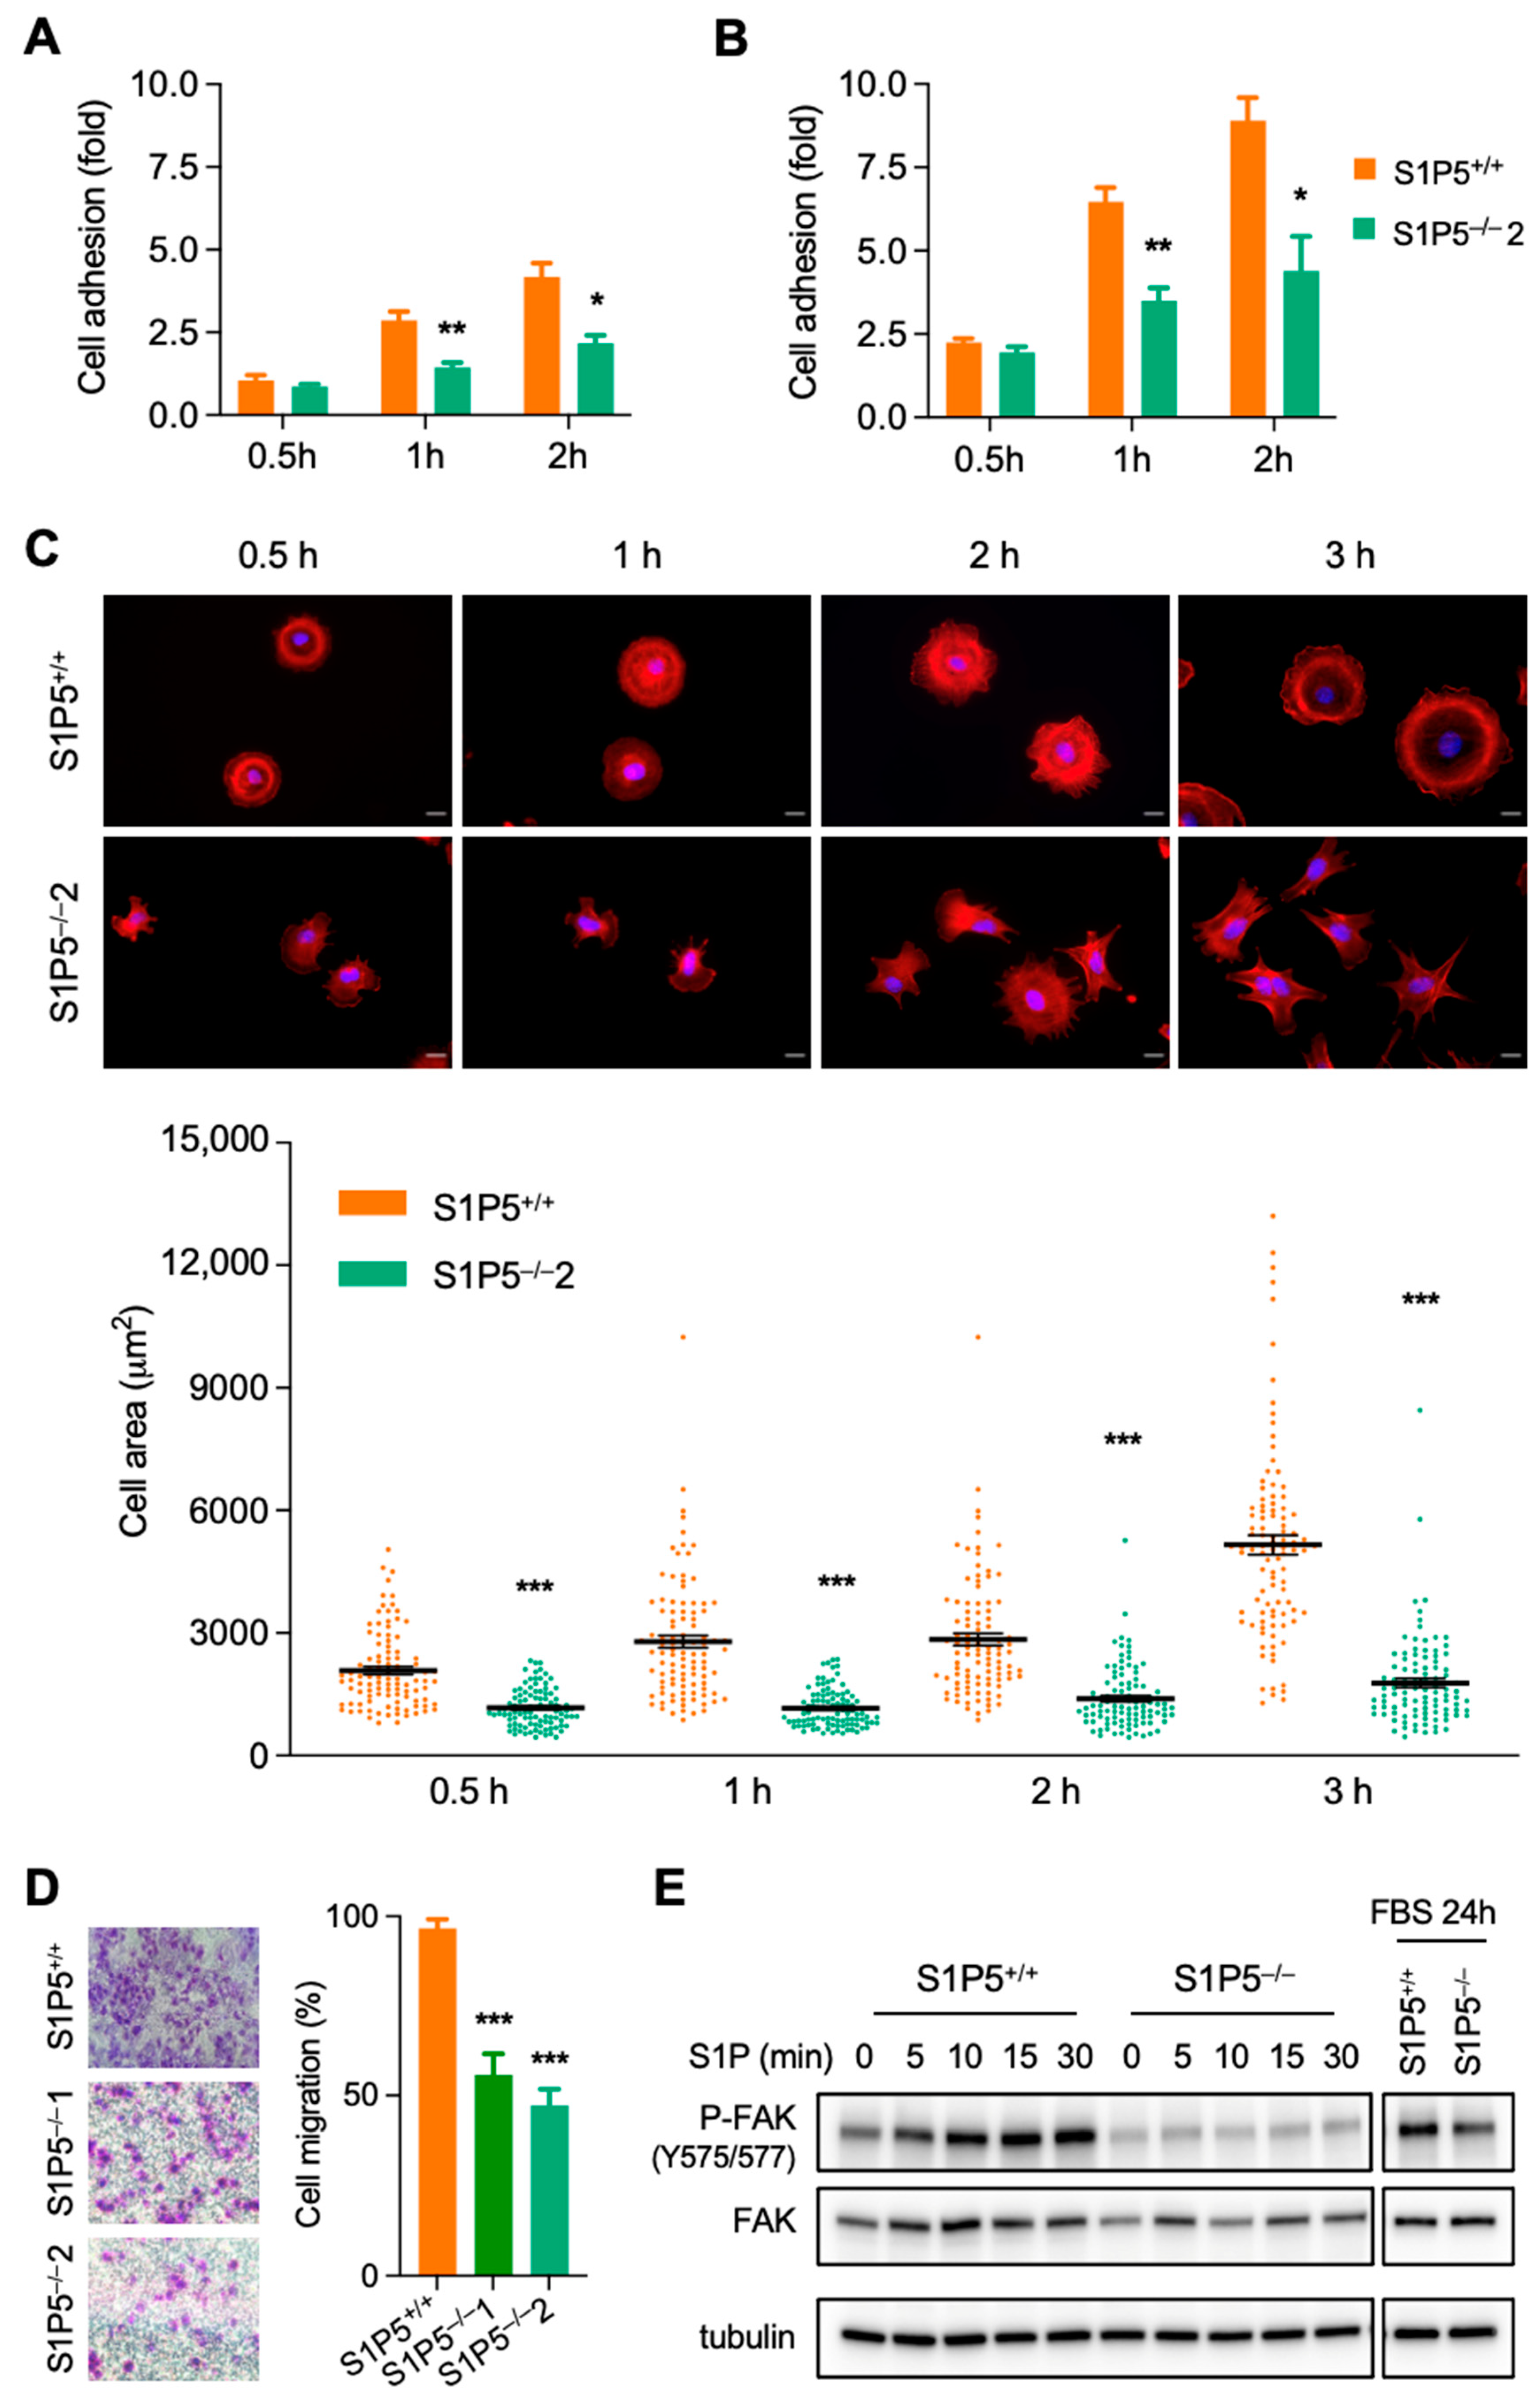
3.2. S1P5 Loss Results in Cell Elongation and Impaired Adhesion, Spreading and Migration
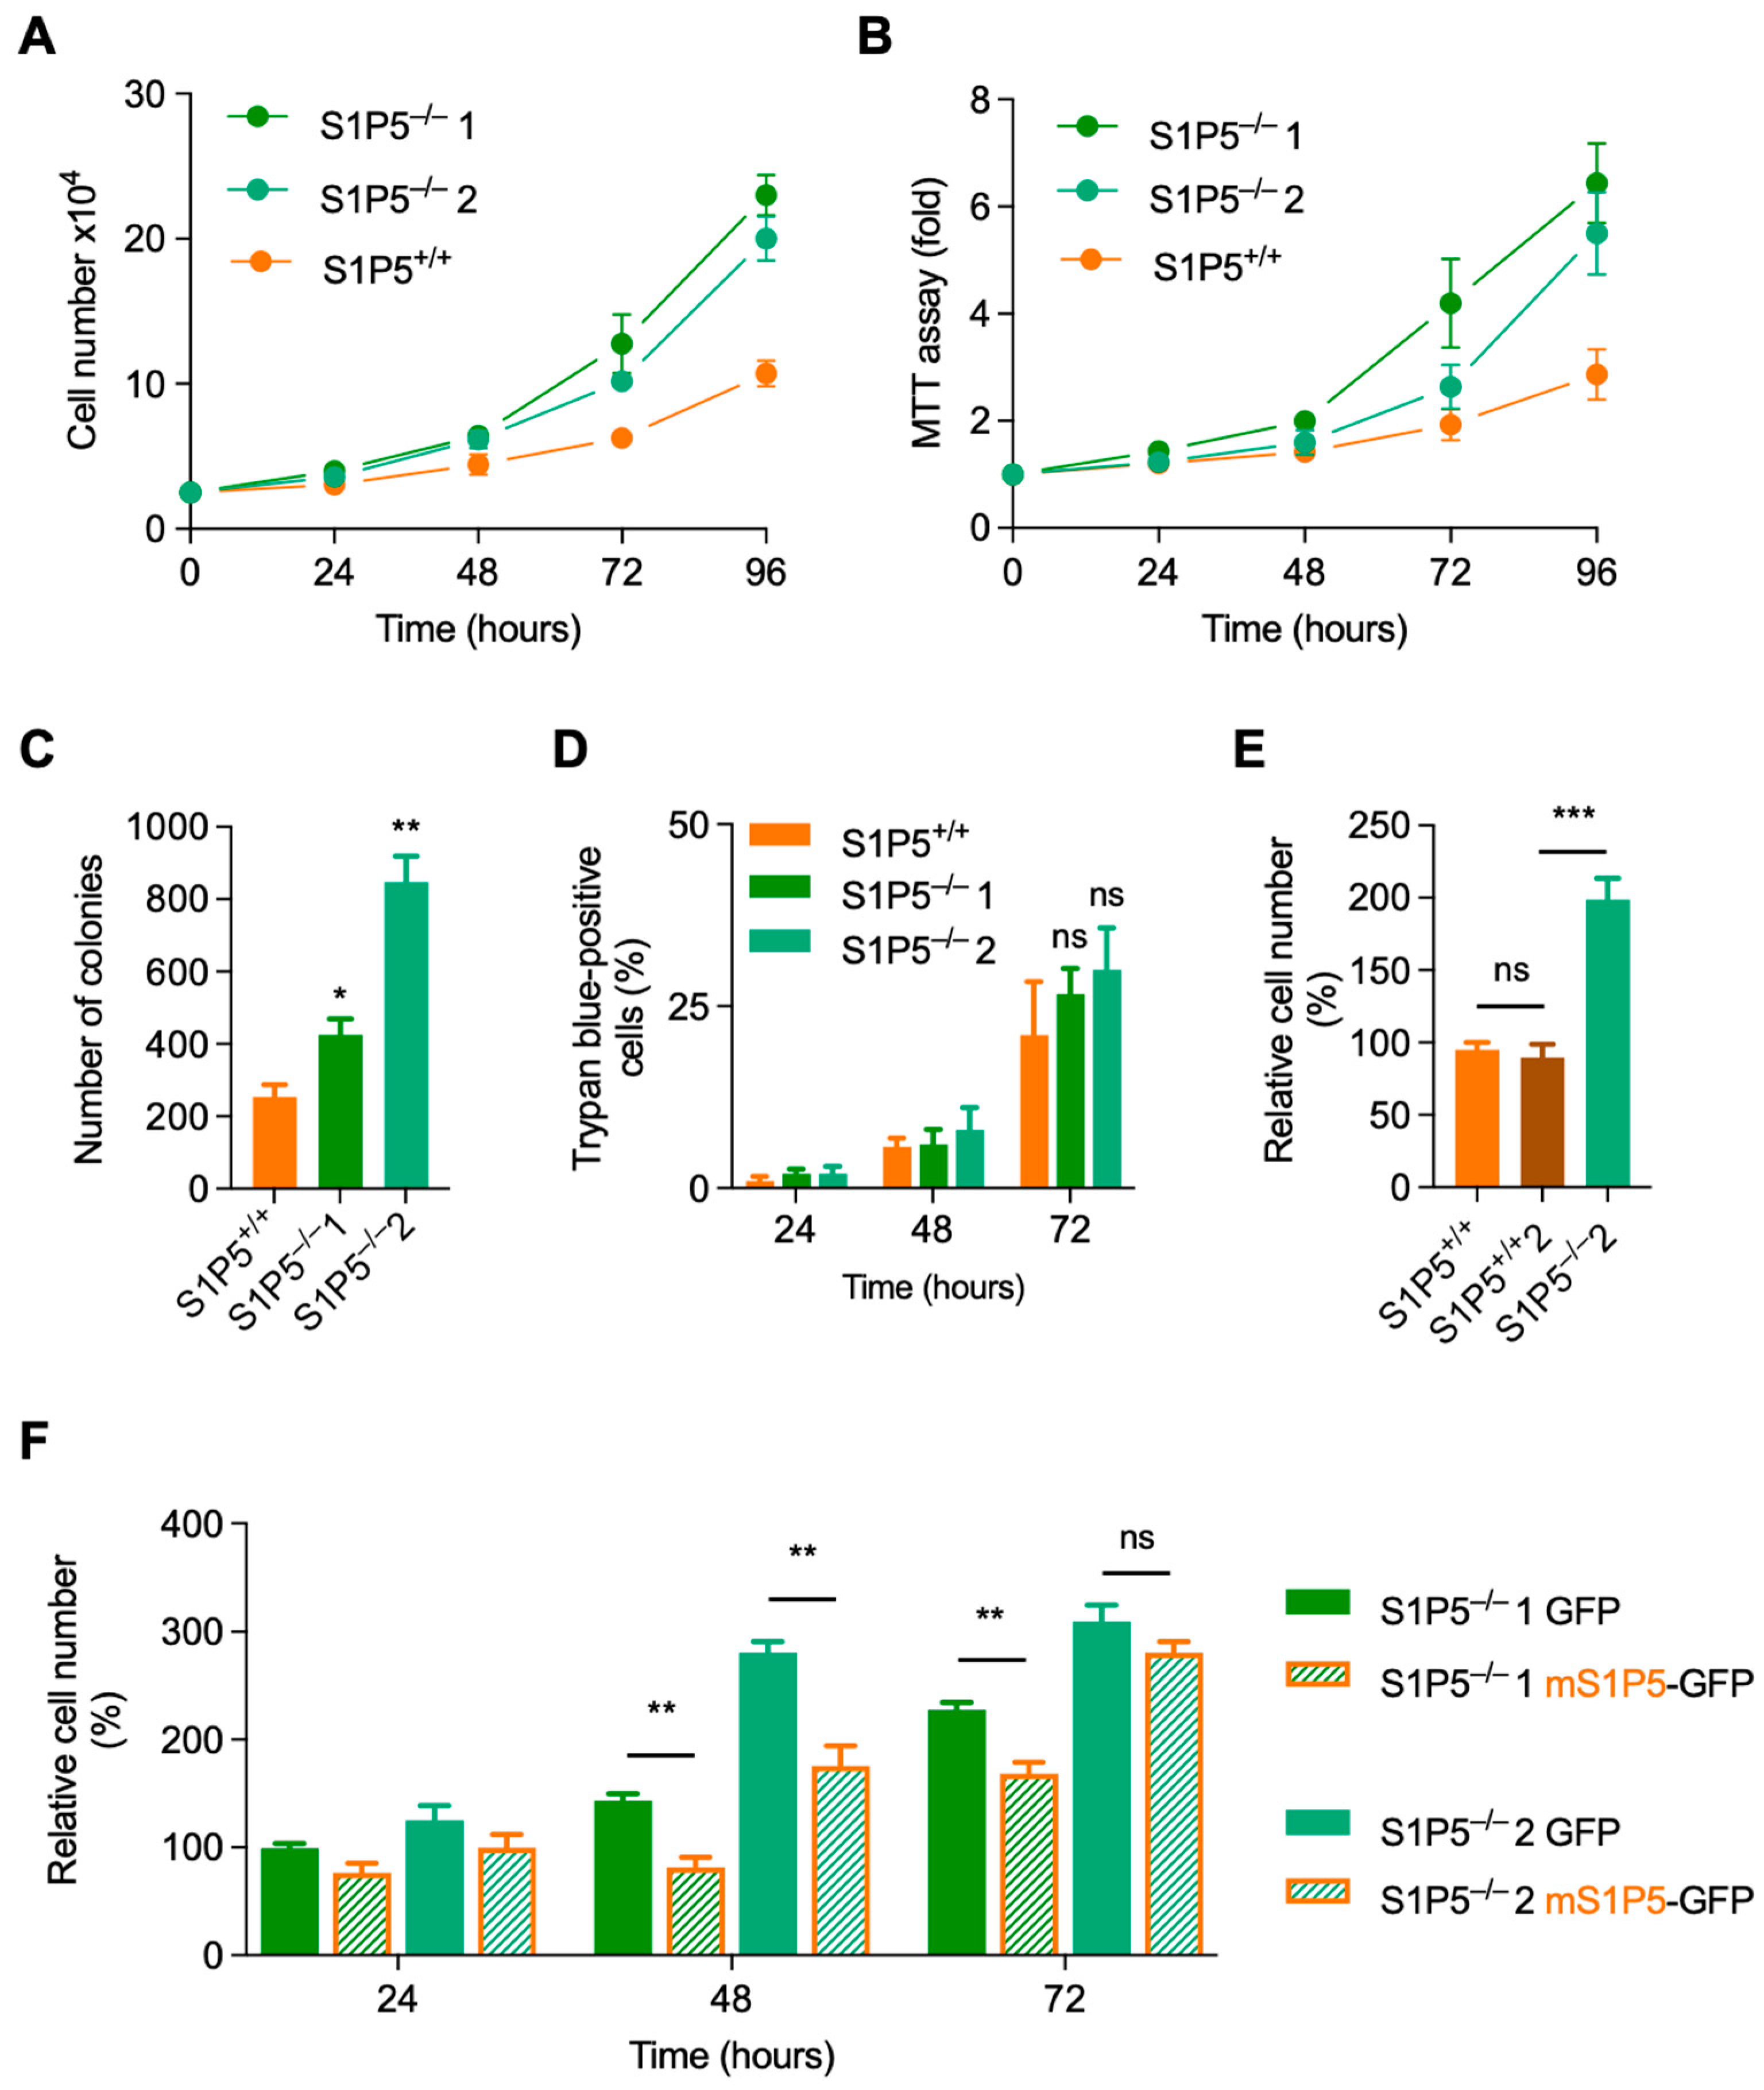
3.3. Loss of S1P5 Promotes Cell Proliferation
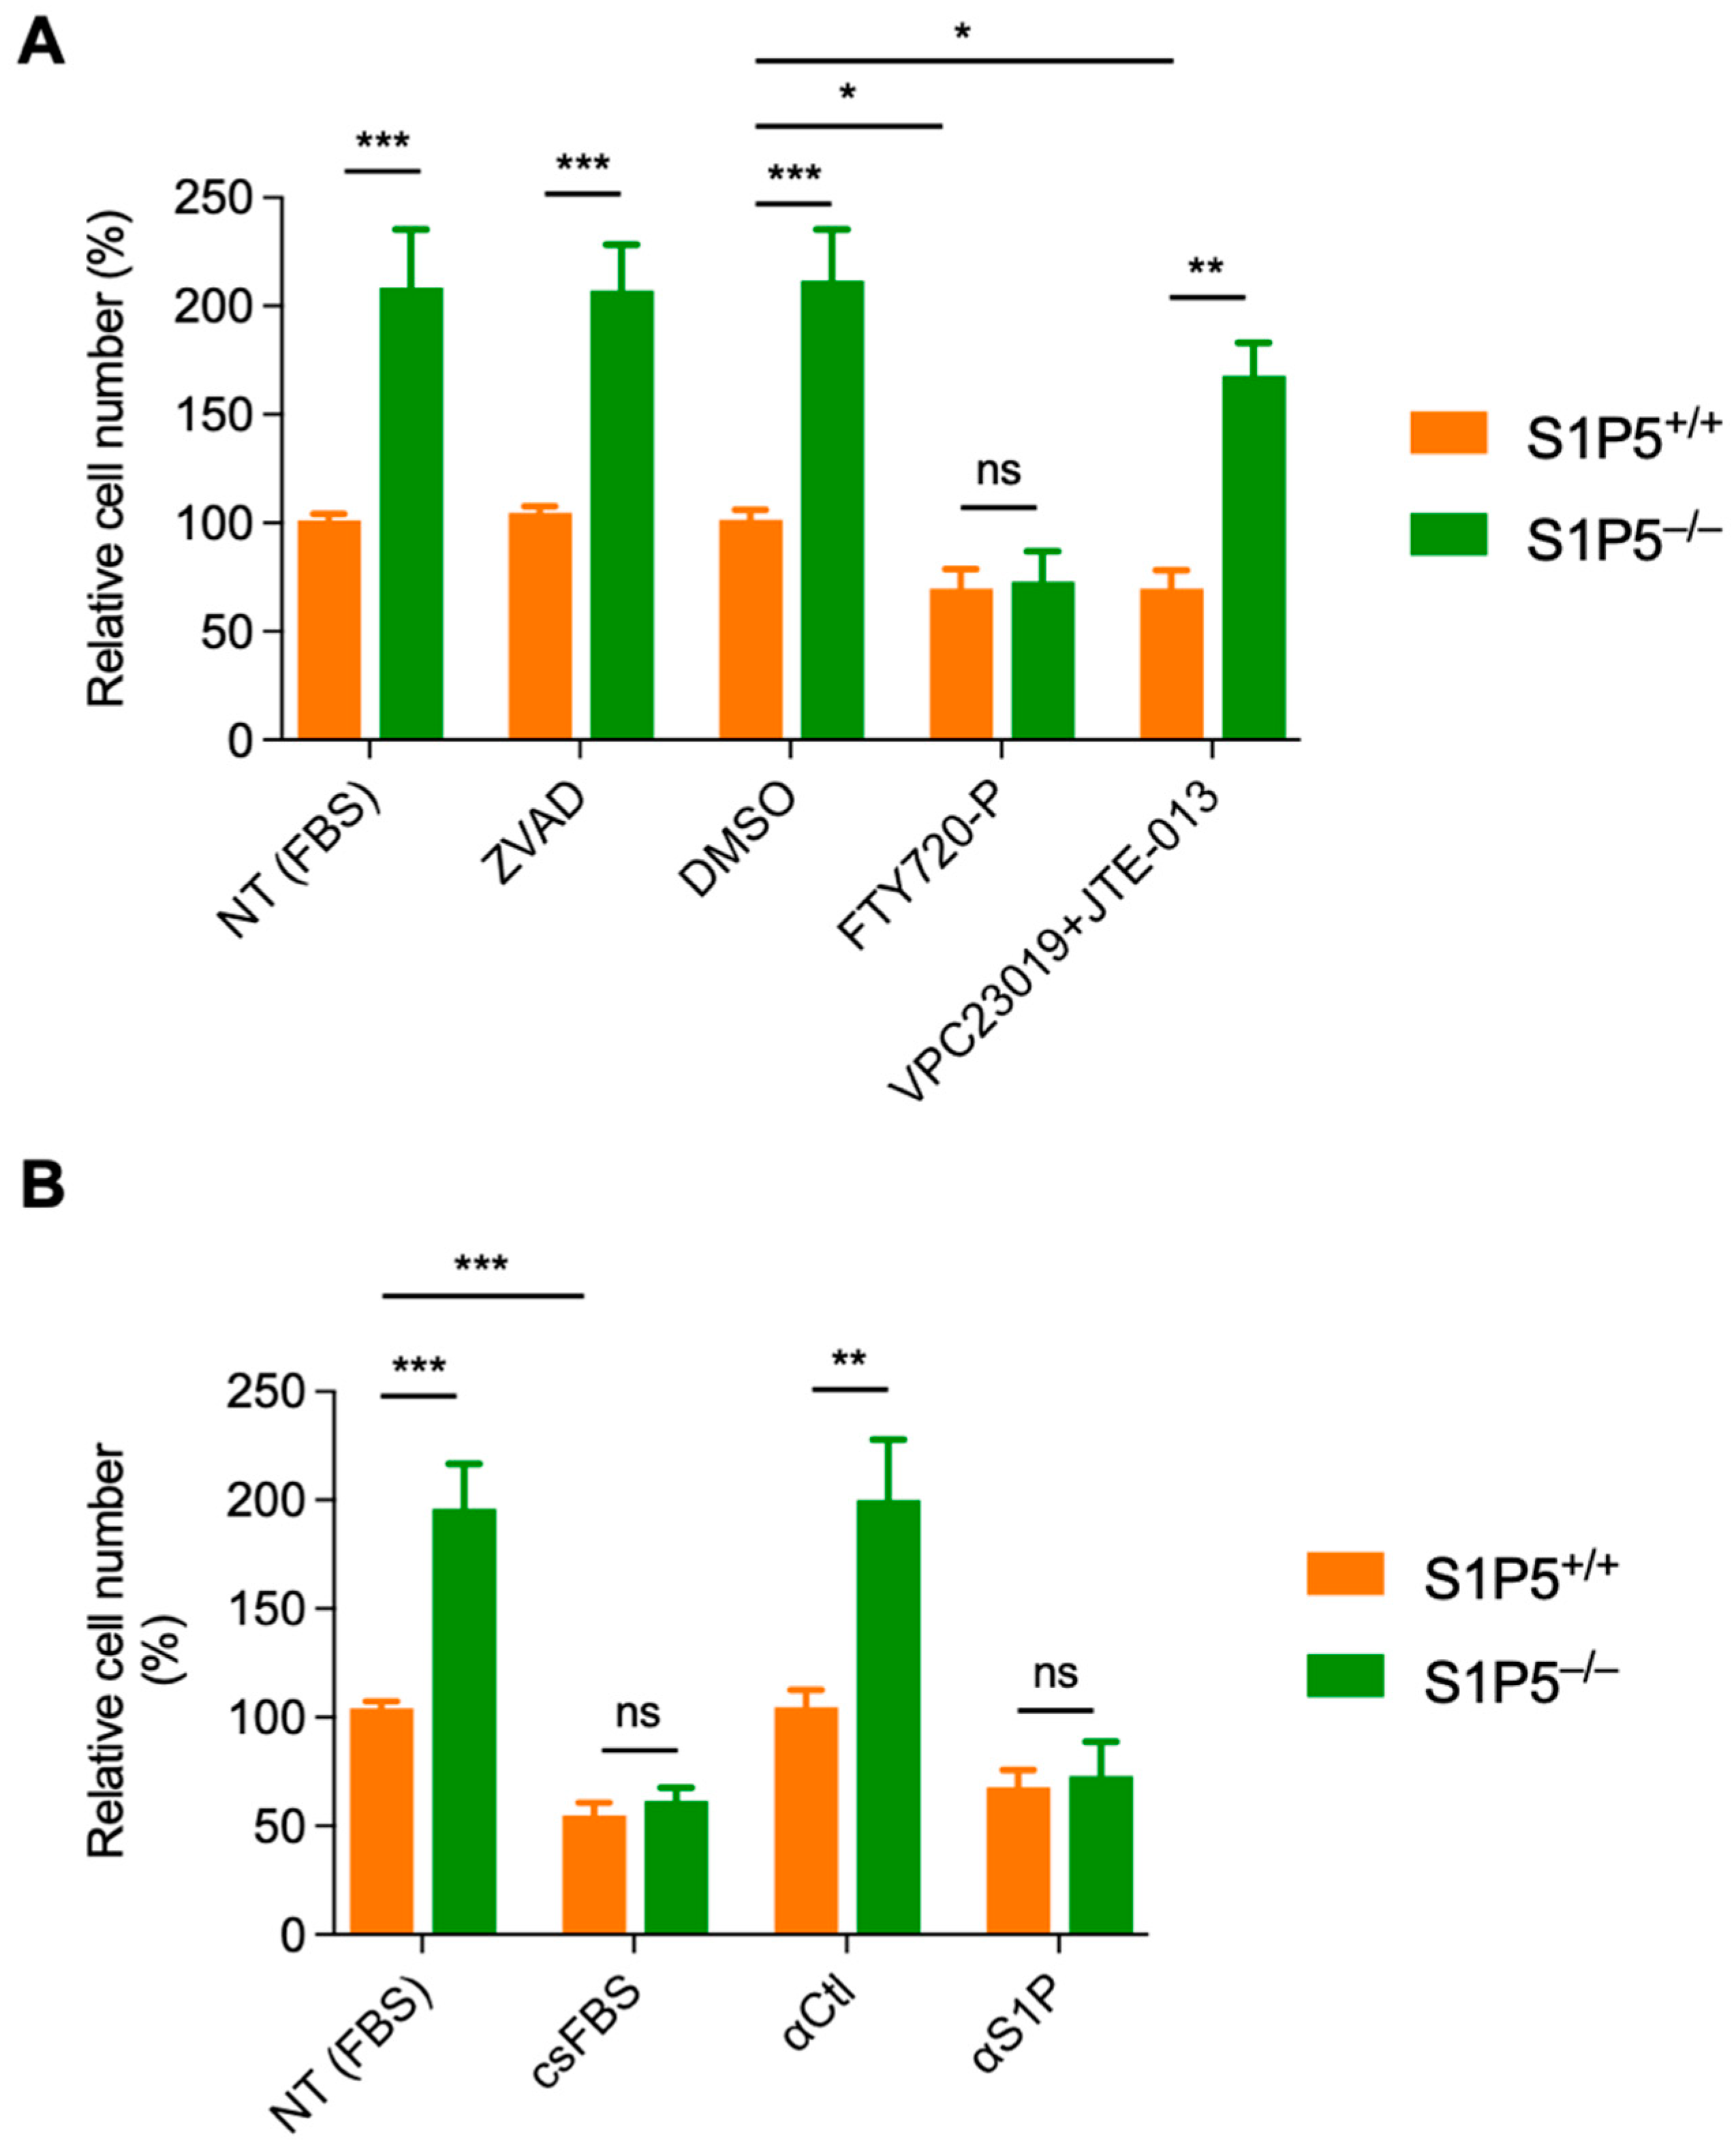
3.4. S1P5 Decreases Cell Proliferation in a Ligand Dependent Manner
3.5. The S1P/S1P5 Axis Negatively Regulates MEF Proliferation
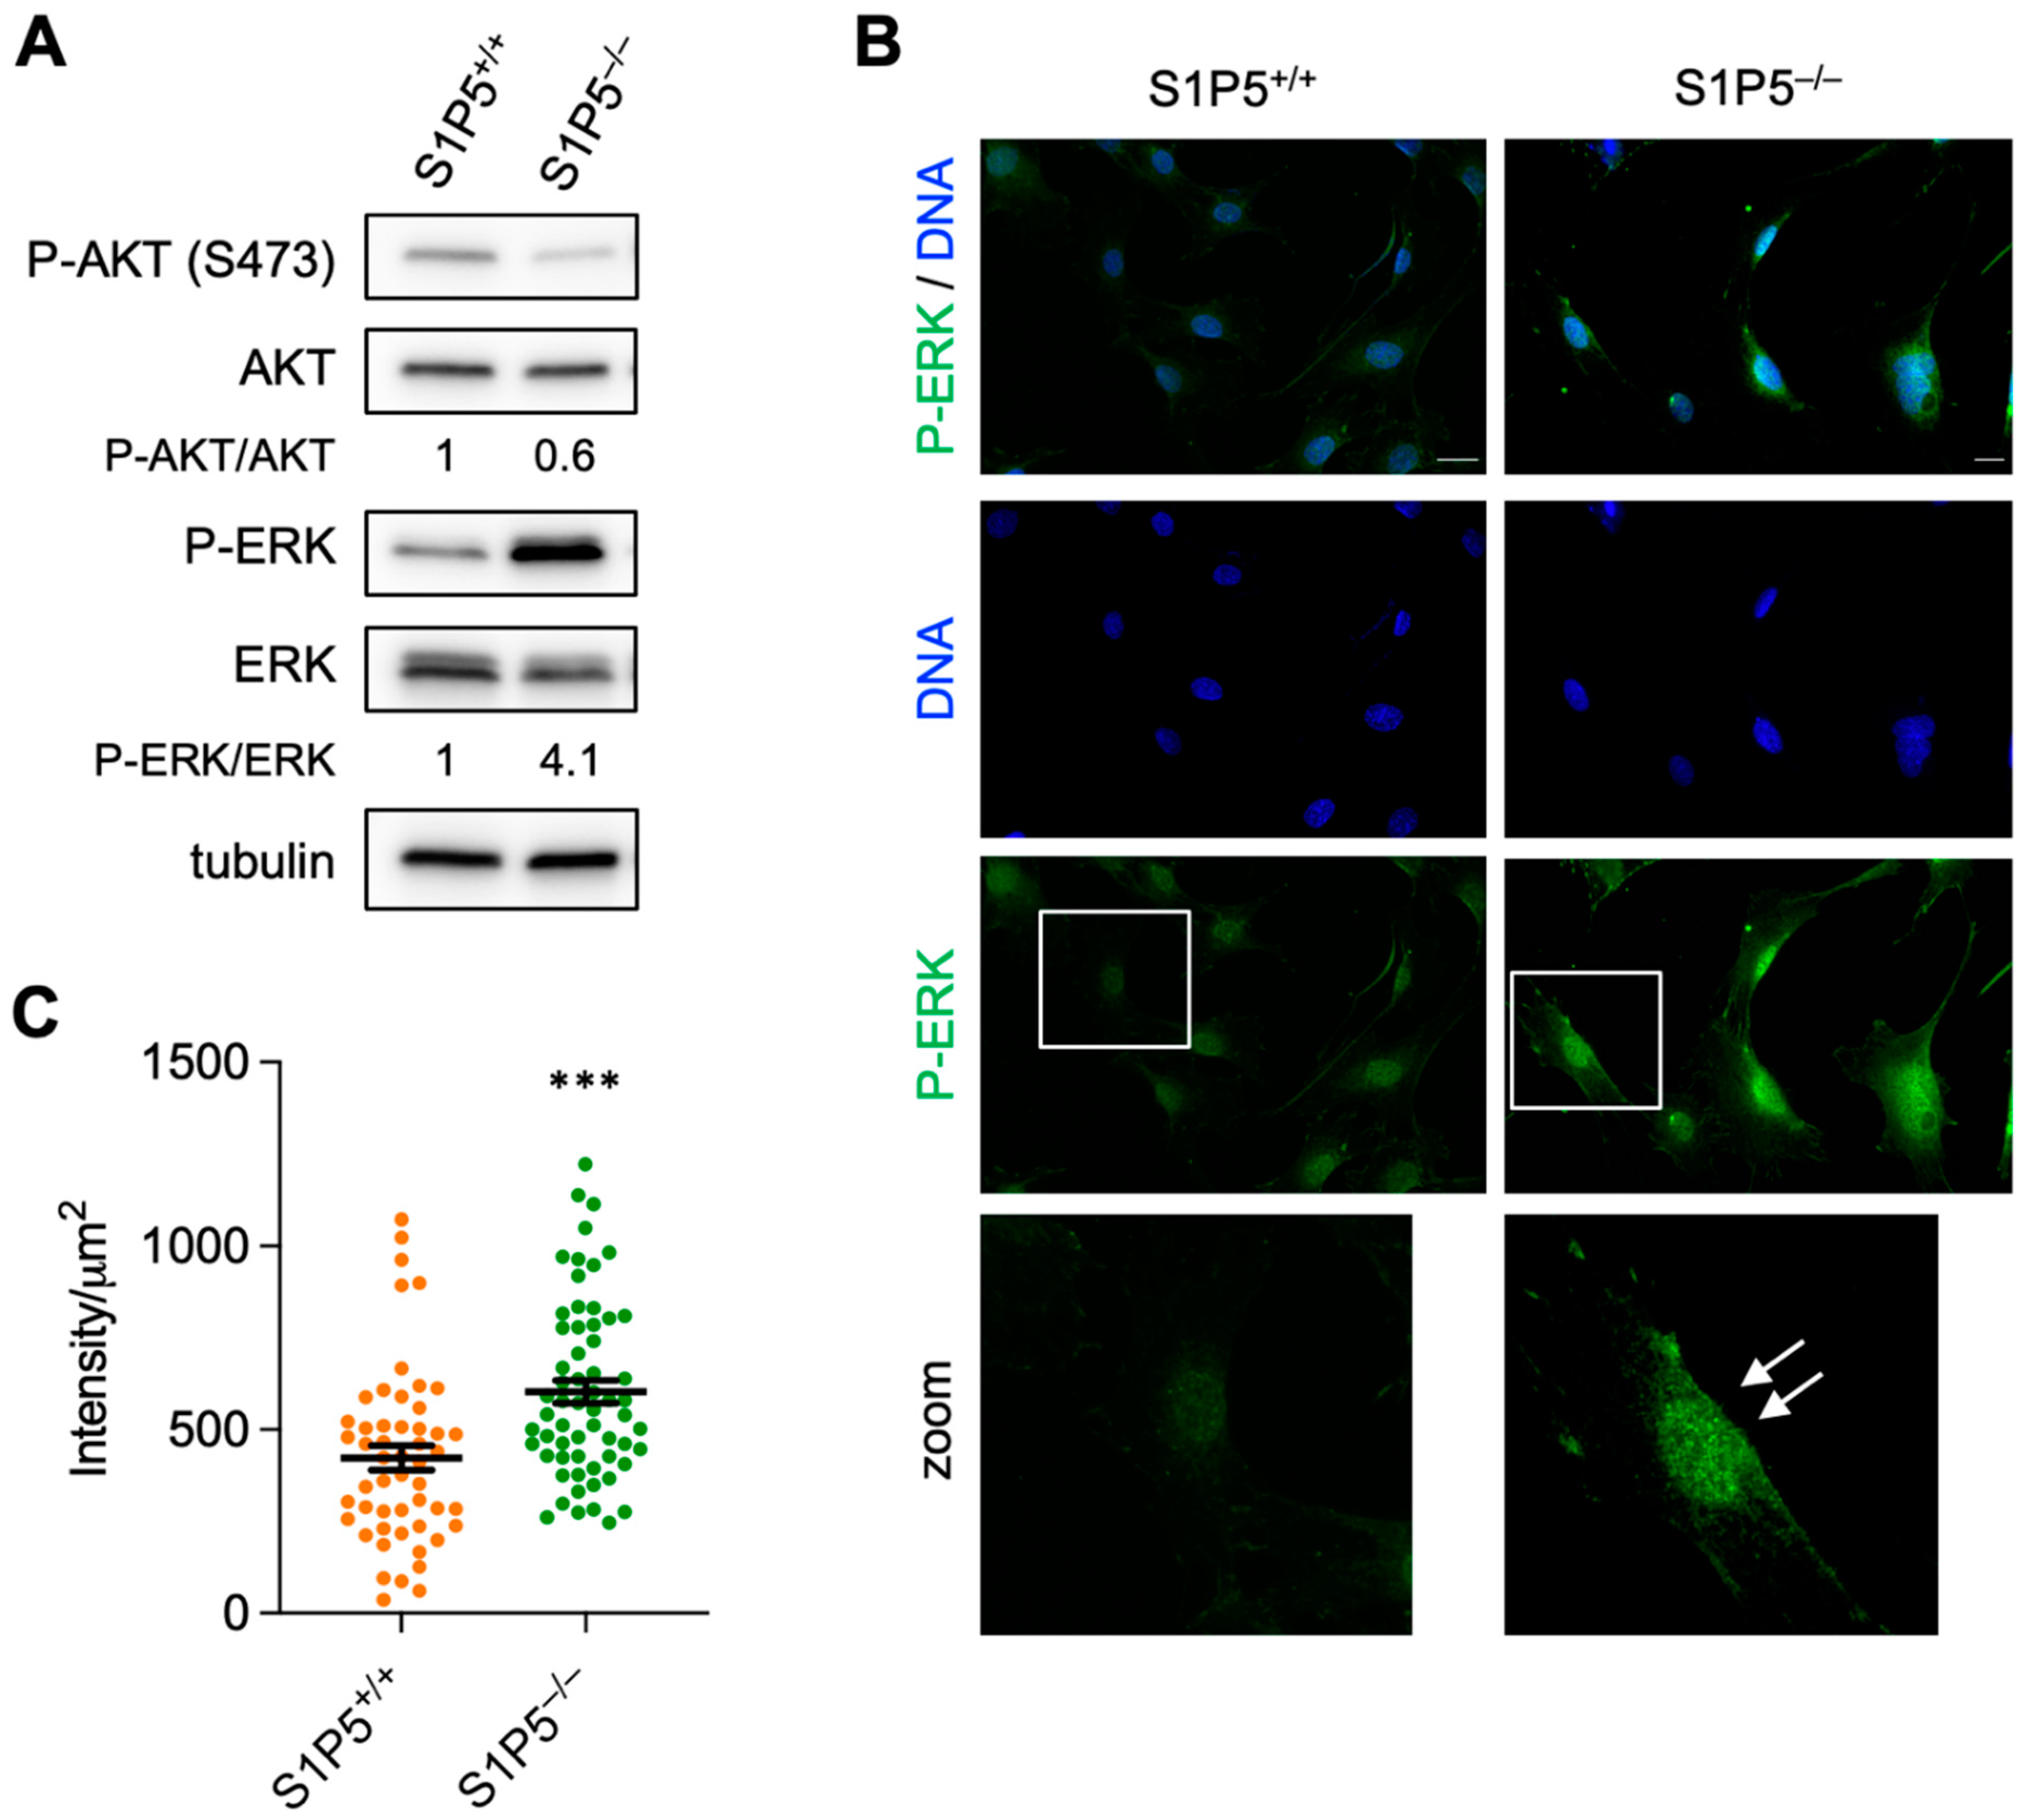
3.6. Loss of S1P5 Leads to Persistent Activation of ERK and Its Nuclear Localization
4. Discussion
5. Conclusions
Supplementary Materials
Author Contributions
Funding
Institutional Review Board Statement
Informed Consent Statement
Data Availability Statement
Acknowledgments
Conflicts of Interest
References
- Olivera, A.; Kohama, T.; Edsall, L.; Nava, V.; Cuvillier, O.; Poulton, S.; Spiegel, S. Sphingosine kinase expression increases intracellular sphingosine-1-phosphate and promotes cell growth and survival. J. Cell Biol. 1999, 147, 545–558. [Google Scholar] [CrossRef] [PubMed]
- Olivera, A.; Rosenfeldt, H.M.; Bektas, M.; Wang, F.; Ishii, I.; Chun, J.; Milstien, S.; Spiegel, S. Sphingosine kinase type 1 induces G12/13-mediated stress fiber formation, yet promotes growth and survival independent of G protein-coupled receptors. J. Biol. Chem. 2003, 278, 46452–46460. [Google Scholar] [CrossRef] [PubMed]
- Spiegel, S.; English, D.; Milstien, S. Sphingosine 1-phosphate signaling: Providing cells with a sense of direction. Trends Cell Biol. 2002, 12, 236–242. [Google Scholar] [CrossRef]
- Brinkmann, V. Sphingosine 1-phosphate receptors in health and disease: Mechanistic insights from gene deletion studies and reverse pharmacology. Pharmacol. Ther. 2007, 115, 84–105. [Google Scholar] [CrossRef] [PubMed]
- Rosen, H.; Gonzalez-Cabrera, P.J.; Sanna, M.G.; Brown, S. Sphingosine 1-phosphate receptor signaling. Annu. Rev. Biochem. 2009, 78, 743–768. [Google Scholar] [CrossRef]
- Mendelson, K.; Evans, T.; Hla, T. Sphingosine 1-phosphate signalling. Development 2014, 141, 5–9. [Google Scholar] [CrossRef]
- Maceyka, M.; Harikumar, K.B.; Milstien, S.; Spiegel, S. Sphingosine-1-phosphate signaling and its role in disease. Trends Cell Biol. 2012, 22, 50–60. [Google Scholar] [CrossRef]
- Cartier, A.; Hla, T. Sphingosine 1-phosphate: Lipid signaling in pathology and therapy. Science 2019, 366, eaar5551. [Google Scholar] [CrossRef]
- Talmont, F.; Hatzoglou, A.; Cuvillier, O. Multiple sclerosis and immuno-modulators of sphingosine 1-phosphate receptors. Med. Sci. 2020, 36, 243–252. [Google Scholar]
- Graler, M.H.; Goetzl, E.J. The immunosuppressant FTY720 down-regulates sphingosine 1-phosphate G-protein-coupled receptors. FASEB J. 2004, 18, 551–553. [Google Scholar] [CrossRef]
- Jaillard, C.; Harrison, S.; Stankoff, B.; Aigrot, M.S.; Calver, A.R.; Duddy, G.; Walsh, F.S.; Pangalos, M.N.; Arimura, N.; Kaibuchi, K.; et al. Edg8/S1P5: An oligodendroglial receptor with dual function on process retraction and cell survival. J. Neurosci. 2005, 25, 1459–1469. [Google Scholar] [CrossRef] [PubMed]
- van Doorn, R.; Lopes Pinheiro, M.A.; Kooij, G.; Lakeman, K.; van het Hof, B.; van der Pol, S.M.; Geerts, D.; van Horssen, J.; van der Valk, P.; van der Kam, E.; et al. Sphingosine 1-phosphate receptor 5 mediates the immune quiescence of the human brain endothelial barrier. J. Neuroinflamm. 2012, 9, 133. [Google Scholar] [CrossRef] [PubMed]
- Mayol, K.; Biajoux, V.; Marvel, J.; Balabanian, K.; Walzer, T. Sequential desensitization of CXCR4 and S1P5 controls natural killer cell trafficking. Blood 2011, 118, 4863–4871. [Google Scholar] [CrossRef] [PubMed]
- Chang, C.L.; Ho, M.C.; Lee, P.H.; Hsu, C.Y.; Huang, W.P.; Lee, H. S1P(5) is required for sphingosine 1-phosphate-induced autophagy in human prostate cancer PC-3 cells. Am. J. Physiol. Cell Physiol. 2009, 297, C451–C458. [Google Scholar] [CrossRef] [PubMed]
- Hu, W.M.; Li, L.; Jing, B.Q.; Zhao, Y.S.; Wang, C.L.; Feng, L.; Xie, Y.E. Effect of S1P5 on proliferation and migration of human esophageal cancer cells. World J. Gastroenterol. 2010, 16, 1859–1866. [Google Scholar] [CrossRef] [PubMed]
- Andrieu, G.; Ledoux, A.; Branka, S.; Bocquet, M.; Gilhodes, J.; Walzer, T.; Kasahara, K.; Inagaki, M.; Sabbadini, R.A.; Cuvillier, O.; et al. Sphingosine 1-phosphate signaling through its receptor S1P5 promotes chromosome segregation and mitotic progression. Sci. Signal 2017, 10, eaah4007. [Google Scholar] [CrossRef] [PubMed]
- Cuvillier, O.; Hatzoglou, A. Sphingosine 1-Phosphate signaling controls mitosis. Oncotarget 2017, 8, 114414–114415. [Google Scholar] [CrossRef]
- Rittling, S.R. Clonal nature of spontaneously immortalized 3T3 cells. Exp. Cell Res. 1996, 229, 7–13. [Google Scholar] [CrossRef]
- Gomez, D.; Guedin, A.; Mergny, J.L.; Salles, B.; Riou, J.F.; Teulade-Fichou, M.P.; Calsou, P. A G-quadruplex structure within the 5′-UTR of TRF2 mRNA represses translation in human cells. Nucleic Acids Res. 2010, 38, 7187–7198. [Google Scholar] [CrossRef]
- Ader, I.; Gstalder, C.; Bouquerel, P.; Golzio, M.; Andrieu, G.; Zalvidea, S.; Richard, S.; Sabbadini, R.A.; Malavaud, B.; Cuvillier, O. Neutralizing S1P inhibits intratumoral hypoxia, induces vascular remodelling and sensitizes to chemotherapy in prostate cancer. Oncotarget 2015, 6, 13803–13821. [Google Scholar] [CrossRef]
- Dimri, G.P.; Testori, A.; Acosta, M.; Campisi, J. Replicative senescence, aging and growth-regulatory transcription factors. Biol. Signals 1996, 5, 154–162. [Google Scholar] [CrossRef] [PubMed]
- Hatzoglou, A.; Ader, I.; Splingard, A.; Flanders, J.; Saade, E.; Leroy, I.; Traver, S.; Aresta, S.; de Gunzburg, J. Gem Associates with Ezrin and Acts via the Rho-GAP Protein Gmip to Down-regulate the Rho Pathway. Mol. Biol. Cell 2007, 18, 1242–1252. [Google Scholar] [CrossRef] [PubMed]
- Todaro, G.J.; Nilausen, K.; Green, H. Growth Properties of Polyoma Virus-Induced Hamster Tumor Cells. Cancer Res. 1963, 23, 825–832. [Google Scholar] [PubMed]
- Kilbey, A.; Blyth, K.; Wotton, S.; Terry, A.; Jenkins, A.; Bell, M.; Hanlon, L.; Cameron, E.R.; Neil, J.C. Runx2 disruption promotes immortalization and confers resistance to oncogene-induced senescence in primary murine fibroblasts. Cancer Res. 2007, 67, 11263–11271. [Google Scholar] [CrossRef] [PubMed]
- Jodar, L.; Mercken, E.M.; Ariza, J.; Younts, C.; Gonzalez-Reyes, J.A.; Alcain, F.J.; Buron, I.; de Cabo, R.; Villalba, J.M. Genetic deletion of Nrf2 promotes immortalization and decreases life span of murine embryonic fibroblasts. J. Gerontol. A Biol. Sci. Med. Sci. 2011, 66, 247–256. [Google Scholar] [CrossRef] [PubMed]
- Price, L.S.; Leng, J.; Schwartz, M.A.; Bokoch, G.M. Activation of Rac and Cdc42 by integrins mediates cell spreading. Mol. Biol. Cell 1998, 9, 1863–1871. [Google Scholar] [CrossRef]
- Sieg, D.J.; Hauck, C.R.; Schlaepfer, D.D. Required role of focal adhesion kinase (FAK) for integrin-stimulated cell migration. J. Cell Sci. 1999, 112 Pt 16, 2677–2691. [Google Scholar] [CrossRef]
- Okamoto, H.; Takuwa, N.; Gonda, K.; Okazaki, H.; Chang, K.; Yatomi, Y.; Shigematsu, H.; Takuwa, Y. EDG1 is a functional sphingosine-1-phosphate receptor that is linked via a Gi/o to multiple signaling pathways, including phospholipase C activation, Ca2+ mobilization, Ras-mitogen-activated protein kinase activation, and adenylate cyclase inhibition. J. Biol. Chem. 1998, 273, 27104–27110. [Google Scholar] [CrossRef]
- Malek, R.L.; Toman, R.E.; Edsall, L.C.; Wong, S.; Chiu, J.; Letterle, C.A.; Van Brocklyn, J.R.; Milstien, S.; Spiegel, S.; Lee, N.H. Nrg-1 belongs to the endothelial differentiation gene family of G protein-coupled sphingosine-1-phosphate receptors. J. Biol. Chem. 2001, 276, 5692–5699. [Google Scholar] [CrossRef]
- Olivera, A.; Spiegel, S. Sphingosine-1-phosphate as second messenger in cell proliferation induced by PDGF and FCS mitogens. Nature 1993, 365, 557–560. [Google Scholar] [CrossRef]
- O’Brien, N.; Jones, S.T.; Williams, D.G.; Cunningham, H.B.; Moreno, K.; Visentin, B.; Gentile, A.; Vekich, J.; Shestowsky, W.; Hiraiwa, M.; et al. Production and characterization of monoclonal anti-sphingosine-1-phosphate antibodies. J. Lipid Res. 2009, 50, 2245–2257. [Google Scholar] [CrossRef] [PubMed]
- Ebisuya, M.; Kondoh, K.; Nishida, E. The duration, magnitude and compartmentalization of ERK MAP kinase activity: Mechanisms for providing signaling specificity. J. Cell Sci. 2005, 118, 2997–3002. [Google Scholar] [CrossRef] [PubMed]
- Jenne, C.N.; Enders, A.; Rivera, R.; Watson, S.R.; Bankovich, A.J.; Pereira, J.P.; Xu, Y.; Roots, C.M.; Beilke, J.N.; Banerjee, A.; et al. T-bet-dependent S1P5 expression in NK cells promotes egress from lymph nodes and bone marrow. J. Exp. Med. 2009, 206, 2469–2481. [Google Scholar] [CrossRef]
- Huang, Y.L.; Chang, C.L.; Tang, C.H.; Lin, Y.C.; Ju, T.K.; Huang, W.P.; Lee, H. Extrinsic sphingosine 1-phosphate activates S1P5 and induces autophagy through generating endoplasmic reticulum stress in human prostate cancer PC-3 cells. Cell Signal 2014, 26, 611–618. [Google Scholar] [CrossRef]
- Small, J.V.; Stradal, T.; Vignal, E.; Rottner, K. The lamellipodium: Where motility begins. Trends Cell Biol. 2002, 12, 112–120. [Google Scholar] [CrossRef]
- Ilic, D.; Furuta, Y.; Kanazawa, S.; Takeda, N.; Sobue, K.; Nakatsuji, N.; Nomura, S.; Fujimoto, J.; Okada, M.; Yamamoto, T. Reduced cell motility and enhanced focal adhesion contact formation in cells from FAK-deficient mice. Nature 1995, 377, 539–544. [Google Scholar]
- Schaller, M.D. Cellular functions of FAK kinases: Insight into molecular mechanisms and novel functions. J. Cell Sci. 2010, 123, 1007–1013. [Google Scholar] [CrossRef]
- Lim, Y.; Lim, S.T.; Tomar, A.; Gardel, M.; Bernard-Trifilo, J.A.; Chen, X.L.; Uryu, S.A.; Canete-Soler, R.; Zhai, J.; Lin, H.; et al. PyK2 and FAK connections to p190Rho guanine nucleotide exchange factor regulate RhoA activity, focal adhesion formation, and cell motility. J. Cell Biol. 2008, 180, 187–203. [Google Scholar] [CrossRef]
- Lee, O.H.; Lee, D.J.; Kim, Y.M.; Kim, Y.S.; Kwon, H.J.; Kim, K.W.; Kwon, Y.G. Sphingosine 1-phosphate stimulates tyrosine phosphorylation of focal adhesion kinase and chemotactic motility of endothelial cells via the G(i) protein-linked phospholipase C pathway. Biochem. Biophys. Res. Commun. 2000, 268, 47–53. [Google Scholar] [CrossRef][Green Version]
- Miura, Y.; Yatomi, Y.; Rile, G.; Ohmori, T.; Satoh, K.; Ozaki, Y. Rho-mediated phosphorylation of focal adhesion kinase and myosin light chain in human endothelial cells stimulated with sphingosine 1-phosphate, a bioactive lysophospholipid released from activated platelets. J. Biochem. 2000, 127, 909–914. [Google Scholar] [CrossRef]
- Shikata, Y.; Birukov, K.G.; Birukova, A.A.; Verin, A.; Garcia, J.G. Involvement of site-specific FAK phosphorylation in sphingosine-1 phosphate- and thrombin-induced focal adhesion remodeling: Role of Src and GIT. FASEB J. 2003, 17, 2240–2249. [Google Scholar] [CrossRef] [PubMed]
- Murphy, L.O.; Blenis, J. MAPK signal specificity: The right place at the right time. Trends Biochem. Sci. 2006, 31, 268–275. [Google Scholar] [CrossRef] [PubMed]
- Whitehurst, A.; Cobb, M.H.; White, M.A. Stimulus-coupled spatial restriction of extracellular signal-regulated kinase 1/2 activity contributes to the specificity of signal-response pathways. Mol. Cell Biol. 2004, 24, 10145–10150. [Google Scholar] [CrossRef]
- Lidke, D.S.; Huang, F.; Post, J.N.; Rieger, B.; Wilsbacher, J.; Thomas, J.L.; Pouyssegur, J.; Jovin, T.M.; Lenormand, P. ERK nuclear translocation is dimerization-independent but controlled by the rate of phosphorylation. J. Biol. Chem. 2010, 285, 3092–3102. [Google Scholar] [CrossRef]
- Brondello, J.M.; McKenzie, F.R.; Sun, H.; Tonks, N.K.; Pouyssegur, J. Constitutive MAP kinase phosphatase (MKP-1) expression blocks G1 specific gene transcription and S-phase entry in fibroblasts. Oncogene 1995, 10, 1895–1904. [Google Scholar]
- Siehler, S.; Manning, D.R. Pathways of transduction engaged by sphingosine 1-phosphate through G protein-coupled receptors. Biochim. Biophys. Acta 2002, 1582, 94–99. [Google Scholar] [CrossRef]
- Im, D.S.; Heise, C.E.; Ancellin, N.; O’Dowd, B.F.; Shei, G.J.; Heavens, R.P.; Rigby, M.R.; Hla, T.; Mandala, S.; McAllister, G.; et al. Characterization of a novel sphingosine 1-phosphate receptor, Edg-8. J. Biol. Chem. 2000, 275, 14281–14286. [Google Scholar] [CrossRef]
- Yu, O.M.; Brown, J.H. G Protein-Coupled Receptor and RhoA-Stimulated Transcriptional Responses: Links to Inflammation, Differentiation, and Cell Proliferation. Mol. Pharmacol. 2015, 88, 171–180. [Google Scholar] [CrossRef]
- Bian, D.; Mahanivong, C.; Yu, J.; Frisch, S.M.; Pan, Z.K.; Ye, R.D.; Huang, S. The G12/13-RhoA signaling pathway contributes to efficient lysophosphatidic acid-stimulated cell migration. Oncogene 2006, 25, 2234–2244. [Google Scholar] [CrossRef]
- Graler, M.H.; Grosse, R.; Kusch, A.; Kremmer, E.; Gudermann, T.; Lipp, M. The sphingosine 1-phosphate receptor S1P4 regulates cell shape and motility via coupling to Gi and G12/13. J. Cell Biochem. 2003, 89, 507–519. [Google Scholar] [CrossRef]
- Sugimoto, N.; Takuwa, N.; Okamoto, H.; Sakurada, S.; Takuwa, Y. Inhibitory and stimulatory regulation of Rac and cell motility by the G12/13-Rho and Gi pathways integrated downstream of a single G protein-coupled sphingosine-1-phosphate receptor isoform. Mol. Cell Biol. 2003, 23, 1534–1545. [Google Scholar] [CrossRef] [PubMed]
- Cuvillier, O.; Ader, I.; Bouquerel, P.; Brizuela, L.; Malavaud, B.; Mazerolles, C.; Rischmann, P. Activation of sphingosine kinase-1 in cancer: Implications for therapeutic targeting. Curr. Mol. Pharmacol. 2010, 3, 53–65. [Google Scholar] [CrossRef] [PubMed]
- Kim, W.Y.; Sharpless, N.E. The regulation of INK4/ARF in cancer and aging. Cell 2006, 127, 265–275. [Google Scholar] [CrossRef] [PubMed]
- Papazoglu, C.; Mills, A.A. p53: At the crossroad between cancer and ageing. J. Pathol. 2007, 211, 124–133. [Google Scholar] [CrossRef]


Publisher’s Note: MDPI stays neutral with regard to jurisdictional claims in published maps and institutional affiliations. |
© 2022 by the authors. Licensee MDPI, Basel, Switzerland. This article is an open access article distributed under the terms and conditions of the Creative Commons Attribution (CC BY) license (https://creativecommons.org/licenses/by/4.0/).
Share and Cite
Talmont, F.; Mitri, E.; Dozier, C.; Besson, A.; Cuvillier, O.; Hatzoglou, A. Sphingosine 1-Phosphate Receptor 5 (S1P5) Deficiency Promotes Proliferation and Immortalization of Mouse Embryonic Fibroblasts. Cancers 2022, 14, 1661. https://doi.org/10.3390/cancers14071661
Talmont F, Mitri E, Dozier C, Besson A, Cuvillier O, Hatzoglou A. Sphingosine 1-Phosphate Receptor 5 (S1P5) Deficiency Promotes Proliferation and Immortalization of Mouse Embryonic Fibroblasts. Cancers. 2022; 14(7):1661. https://doi.org/10.3390/cancers14071661
Chicago/Turabian StyleTalmont, Franck, Elodie Mitri, Christine Dozier, Arnaud Besson, Olivier Cuvillier, and Anastassia Hatzoglou. 2022. "Sphingosine 1-Phosphate Receptor 5 (S1P5) Deficiency Promotes Proliferation and Immortalization of Mouse Embryonic Fibroblasts" Cancers 14, no. 7: 1661. https://doi.org/10.3390/cancers14071661
APA StyleTalmont, F., Mitri, E., Dozier, C., Besson, A., Cuvillier, O., & Hatzoglou, A. (2022). Sphingosine 1-Phosphate Receptor 5 (S1P5) Deficiency Promotes Proliferation and Immortalization of Mouse Embryonic Fibroblasts. Cancers, 14(7), 1661. https://doi.org/10.3390/cancers14071661