
Efficient Radiomics-Based Classification of Multi-Parametric MR Images to Identify Volumetric Habitats and Signatures in Glioblastoma: A Machine Learning Approach


Abstract
:Simple Summary
Abstract
1. Introduction
2. Materials and Methods
2.1. Cohort Selection
2.2. Imaging Processing & Semantic Annotations
2.3. Extraction of Radiomics Features
2.4. Training and Validation in Machine Learning Algorithms
2.5. Statistical Analysis
3. Results
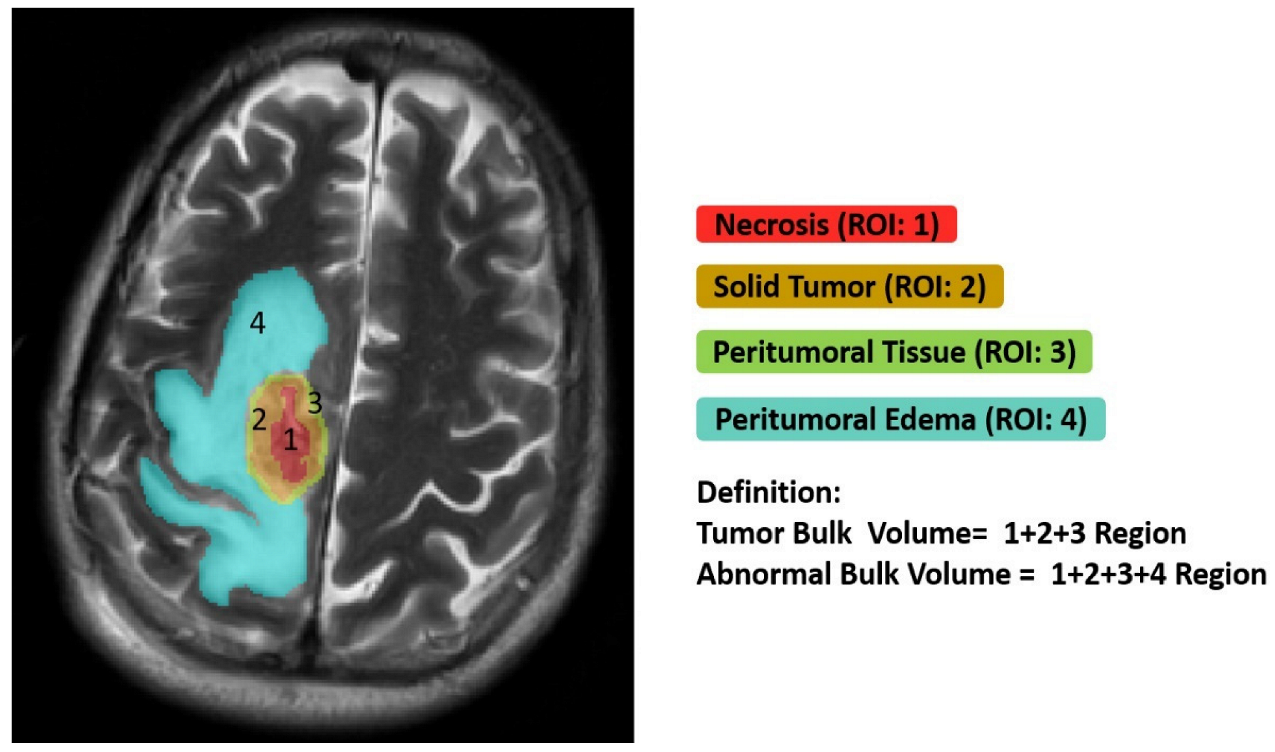
3.1. Ground Truth Segmentation and Identification of Tumor Habitats on MRI
3.2. Classification of Multi-Parametric MR Images to Identify Volumetric Habitats and Signatures
3.3. Biological Processes Underlying Volumetric Features
3.4. Statistical Results
4. Discussion
- (1)
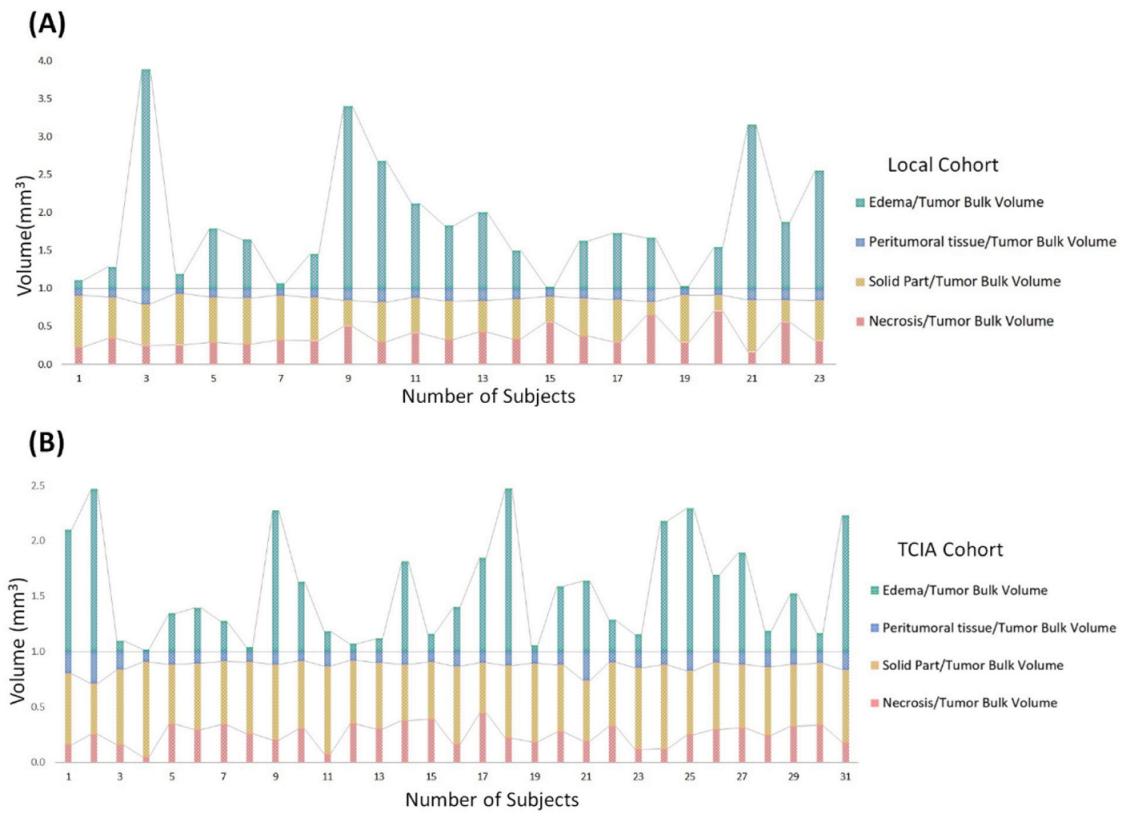
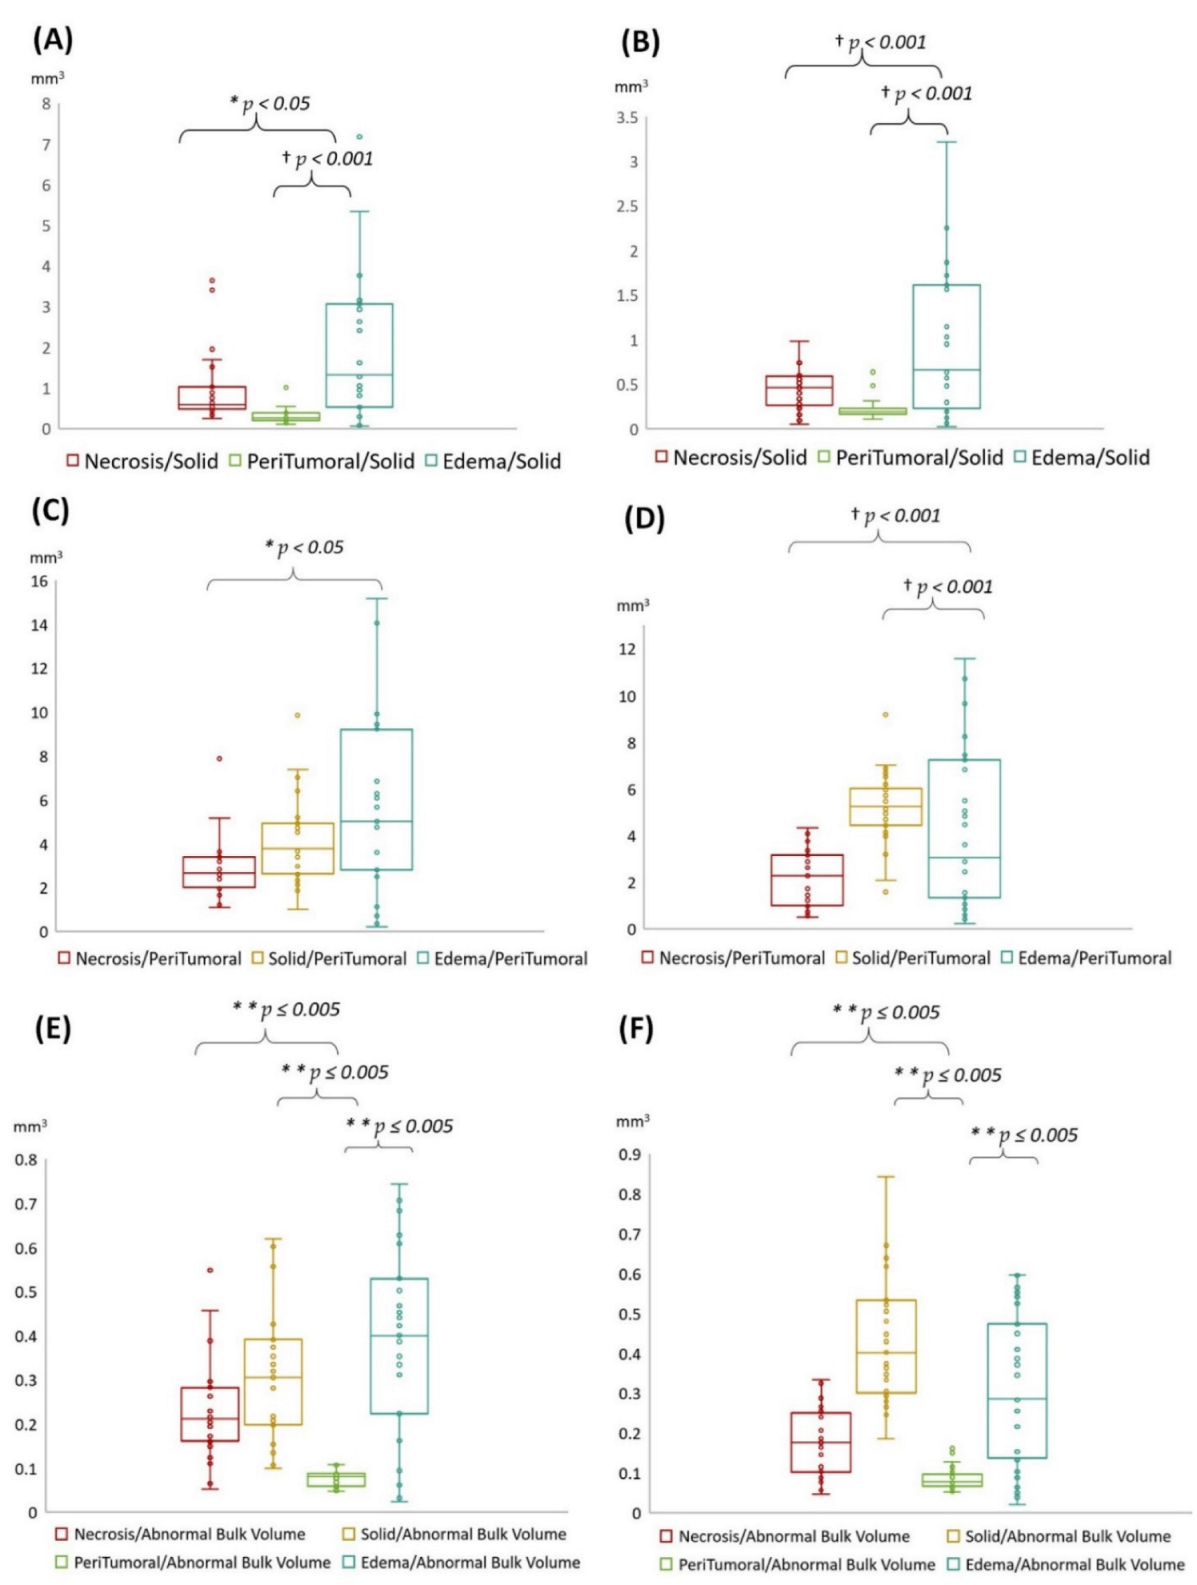
- Edema was mainly enriched for homeostasis. The proportional volume size of the edema was about 1.5 times larger than the size of the solid part tumor. The volume size of the solid part was approximately 0.7 times in the necrosis area. Therefore, the multi-parametric MRI-based radiomics model efficiently classified tumor subregions of GBM, and there are implications that prognostic radiomic features from routine MRI examination may also be significantly associated with key biological processes that affect response to chemotherapy in GBM as a practical imaging biomarker.
- (2)
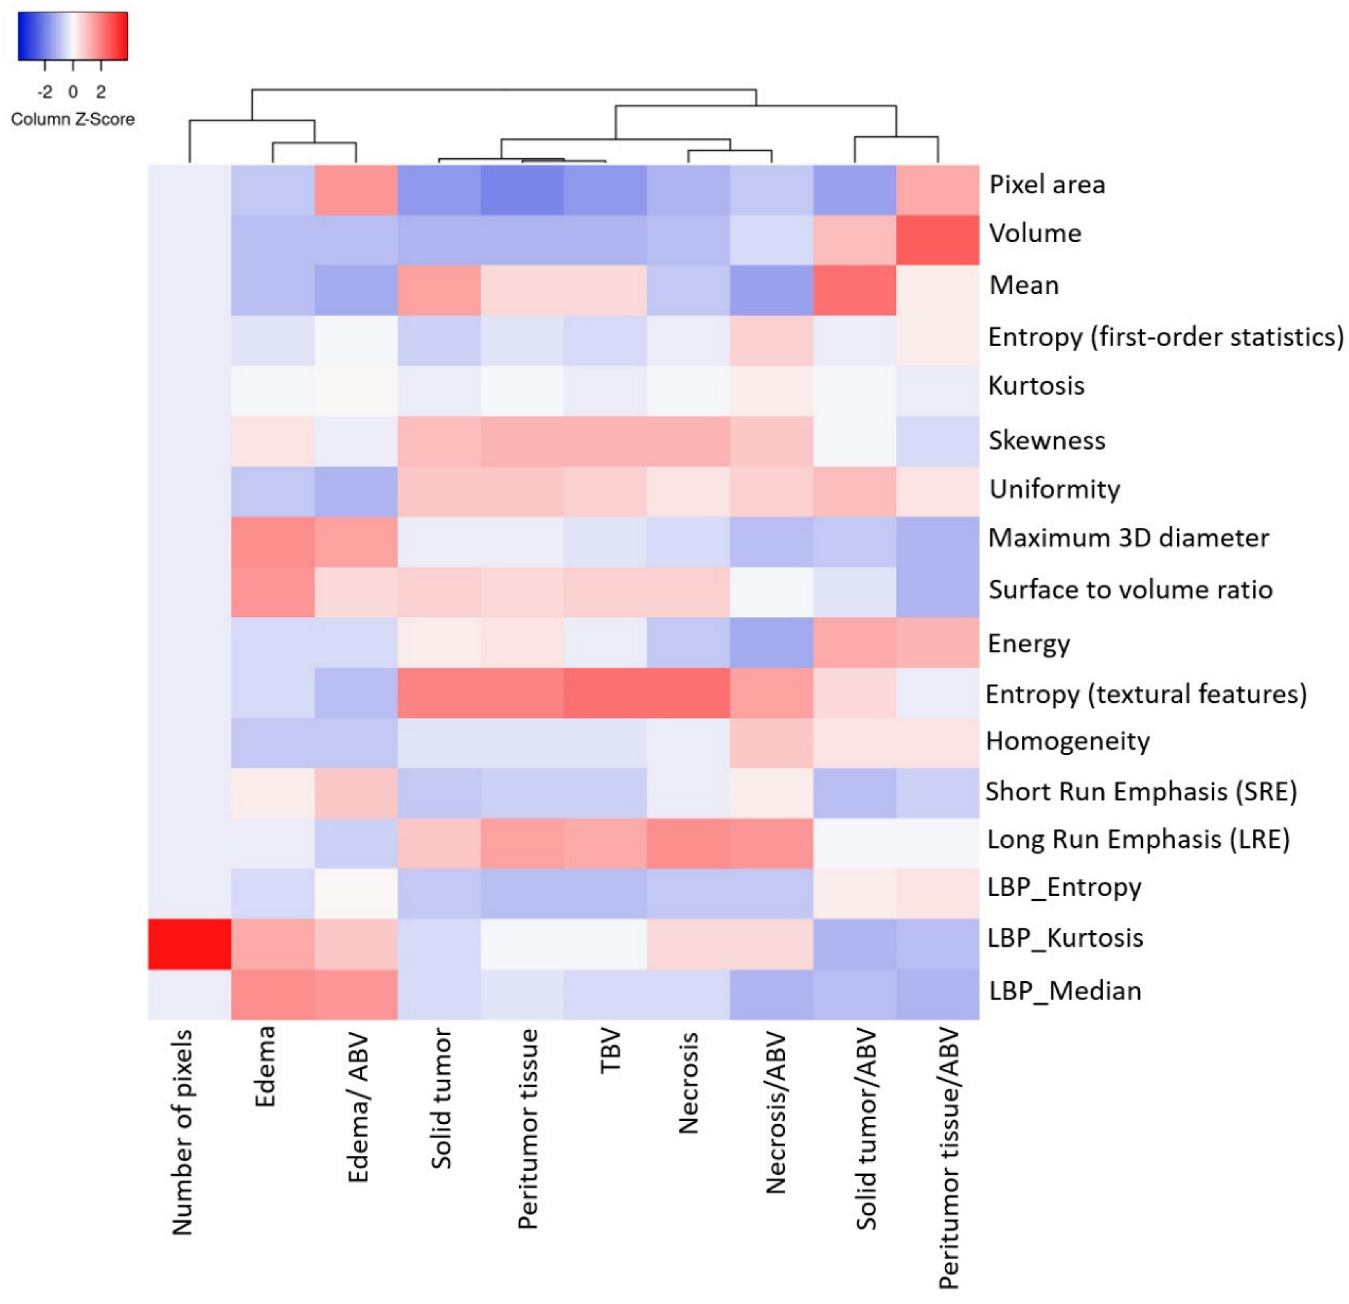
- The volumetric prototype plot is underlain by original tumor habitat that contains the tumor subregions. Generally, many more biological processes were significantly associated with the feature ratios, usually showing a trend towards a mix of pathways associated with the individual features [8]. In our investigation, volumetric feature ratios (i.e., ABV and TBV) were associated with a larger number of biological processes than the original features. Hierarchical cluster analysis using a subset of features has identified five distinct clusters according to the different volumetric habitats and features. The different types of cluster in entropy (textural feature), long run emphasis, skewness, uniformity, and LBP are correlated with classification among tumor subregions in solid part, peritumoral, necrosis, and edema, respectively.
- (3)
- Contrast enhancement was enriched for signal transduction and protein-folding processes. The peritumoral tissue is a small region in GBM in comparison with other subregions. However, these features were enriched for biological processes in immune response and apoptosis from spatial immunoprofiling while the abundance and phenotype of tumor infiltration lymphocytes are closely linked with clinical survival [8,27]. That reflected the regulation of gene expression such as autophagy gene in necrosis [28], vascular endothelial growth factor gene in peritumoral tissue [29], and angiogenesis gene in edema [30,31] with pathological and molecular features of GBM [32]. Moreover, aquaporin 4 (AQP4) contributes to extended tumor cell migration, possibly passing through increasing water permeability and implication of AQP4 in tumor edema [33,34].
- (4)
- Biological features correlate with corresponding MR imaging sequences because different MR imaging sequences come with diverse clinical imaging protocols. Quantitative features provide tumor microenvironment, spatial characteristics, distinguishing of molecular subtypes, survival predictor corresponding to LBP and histogram of oriented gradients, scale-invariant feature transform, histogram of contrast-enhanced tumor MRI, and contrast information between co-occurring subregions, respectively. Consequently, selection of MR imaging sequences can directly affect image feature definition and the corresponding biological interpretation [35]. Particularly, more biologically significant MRI sequences such as diffusion- and perfusion-weighted MRI have been shown to outperform radiomics models based on conventional MRI [4,9]. These approaches should be taken into account in future research as they will be able to encompass more features concerning intratumor heterogeneity and have shown improved performance in relation to molecular markers and predicting prognosis [9,36].
- (5)
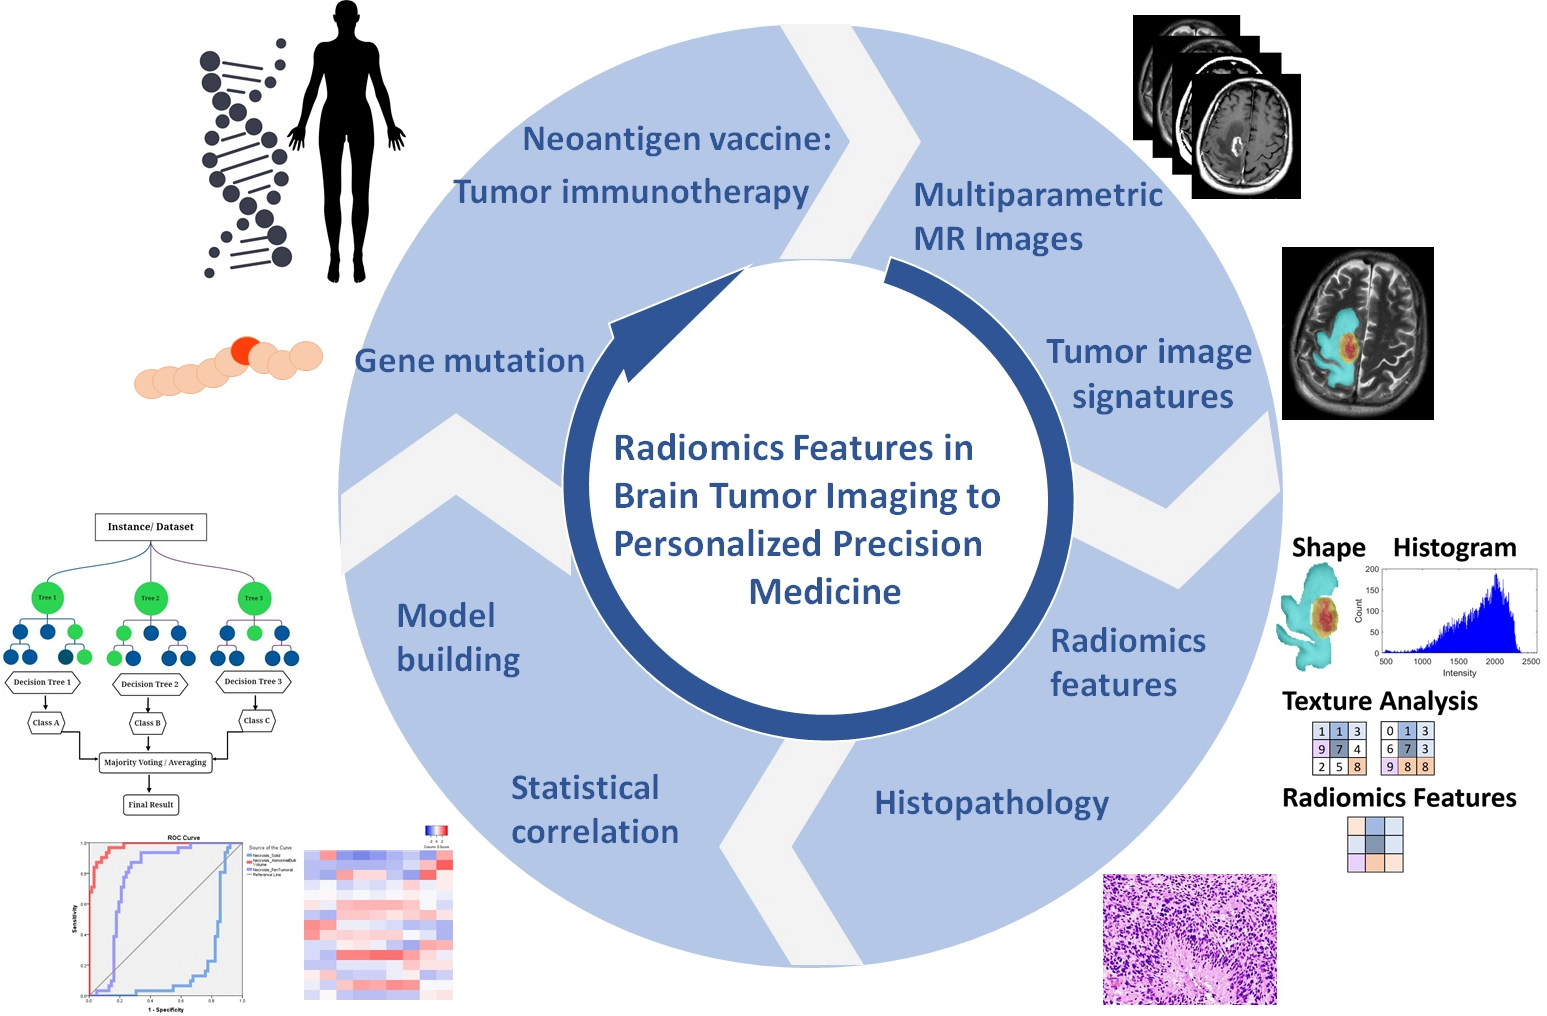
- We illustrated radiomic features based on imaging signatures of the heterogeneous GBM tumor tissue parts (Figure 2) and created a radiomic-based model for the semiautomatic annotation of GBM using MRI, ground truth, and machine learning [4]. The performance of radiomics has been demonstrated when features are extracted from distinct tumor areas such as active tumor, necrosis, and edema, separately. It will be much better for specific tumor areas in clinical applicability [36,37,38].
5. Conclusions
Author Contributions
Funding
Institutional Review Board Statement
Informed Consent Statement
Data Availability Statement
Conflicts of Interest
References
- Omuro, A.; DeAngelis, L.M. Glioblastoma and other malignant gliomas: A clinical review. JAMA 2013, 310, 1842–1850. [Google Scholar] [CrossRef]
- Louis, D.N.; Perry, A.; Reifenberger, G.; von Deimling, A.; Figarella-Branger, D.; Cavenee, W.K.; Ohgaki, H.; Wiestler, O.D.; Kleihues, P.; Ellison, D.W. The 2016 World Health Organization classification of tumors of the central nervous system: A summary. Acta Neuropathol. 2016, 131, 803–820. [Google Scholar] [CrossRef] [PubMed] [Green Version]
- Korfiatis, P.; Kline, T.L.; Coufalova, L.; Lachance, D.H.; Parney, I.F.; Carter, R.E.; Buckner, J.C.; Erickson, B.J. MRI texture features as biomarkers to predict MGMT methylation status in glioblastomas. Med. Phys. 2016, 43, 2835–2844. [Google Scholar] [CrossRef] [PubMed]
- Chiu, F.-Y.; Le, N.Q.K.; Chen, C.-Y. A Multiparametric MRI-based radiomics analysis to efficiently classify tumor subregions of glioblastoma: A pilot study in machine learning. J. Clin. Med. 2021, 10, 2030. [Google Scholar] [CrossRef] [PubMed]
- Menze, B.H.; Jakab, A.; Bauer, S.; Kalpathy-Cramer, J.; Farahani, K.; Kirby, J.; Burren, Y.; Porz, N.; Slotboom, J.; Wiest, R.; et al. The multimodal brain tumor image segmentation benchmark (BRATS). IEEE Trans. Med. Imaging 2015, 34, 1993–2024. [Google Scholar] [CrossRef] [PubMed]
- Bakas, S.; Akbari, H.; Sotiras, A.; Bilello, M.; Rozycki, M.; Kirby, J.S.; Freymann, J.B.; Farahani, K.; Davatzikos, C. Advancing the cancer genome atlas glioma MRI collections with expert segmentation labels and radiomic features. Sci. Data 2017, 4, 170117. [Google Scholar] [CrossRef] [PubMed] [Green Version]
- Sammut, C.; Webb, G.I. Leave-one-out cross-validation. In Encyclopedia of Machine Learning; Sammut, C., Webb, G.I., Eds.; Springer: Boston, MA, USA, 2010; pp. 600–601. [Google Scholar]
- Grossmann, P.; Gutman, D.A.; Dunn, W.D.; Holder, C.A.; Aerts, H.J.W.L. Imaging-genomics reveals driving pathways of MRI derived volumetric tumor phenotype features in Glioblastoma. BMC Cancer 2016, 16, 611. [Google Scholar] [CrossRef] [PubMed] [Green Version]
- Park, J.E.; Kim, H.S.; Jo, Y.; Yoo, R.E.; Choi, S.H.; Nam, S.J.; Kim, J.H. Radiomics prognostication model in glioblastoma using diffusion- and perfusion-weighted MRI. Sci. Rep. 2020, 10, 4250. [Google Scholar] [CrossRef] [PubMed]
- Chaddad, A.; Daniel, P.; Sabri, S.; Desrosiers, C.; Abdulkarim, B. Integration of Radiomic and multi-omic analyses predicts survival of newly diagnosed IDH1 wild-type glioblastoma. Cancers 2019, 11, 1148. [Google Scholar] [CrossRef] [PubMed] [Green Version]
- Rathore, S.; Akbari, H.; Rozycki, M.; Abdullah, K.G.; Nasrallah, M.P.; Binder, Z.A.; Davuluri, R.V.; Lustig, R.A.; Dahmane, N.; Bilello, M.; et al. Radiomic MRI signature reveals three distinct subtypes of glioblastoma with different clinical and molecular characteristics, offering prognostic value beyond IDH1. Sci. Rep. 2018, 8, 5087. [Google Scholar] [CrossRef] [PubMed]
- Haubold, J.; Demircioglu, A.; Gratz, M.; Glas, M.; Wrede, K.; Sure, U.; Antoch, G.; Keyvani, K.; Nittka, M.; Kannengiesser, S.; et al. Non-invasive tumor decoding and phenotyping of cerebral gliomas utilizing multiparametric 18F-FET PET-MRI and MR Fingerprinting. Eur. J. Nucl. Med. Mol. Imaging 2020, 47, 1435–1445. [Google Scholar] [CrossRef]
- Wang, K.; Qiao, Z.; Zhao, X.; Li, X.; Wang, X.; Wu, T.; Chen, Z.; Fan, D.; Chen, Q.; Ai, L. Individualized discrimination of tumor recurrence from radiation necrosis in glioma patients using an integrated radiomics-based model. Eur. J. Nucl. Med. Mol. Imaging 2020, 47, 1400–1411. [Google Scholar] [CrossRef] [PubMed] [Green Version]
- Lohmann, P.; Kocher, M.; Ceccon, G.; Bauer, E.K.; Stoffels, G.; Viswanathan, S.; Ruge, M.I.; Neumaier, B.; Shah, N.J.; Fink, G.R.; et al. Combined FET PET/MRI radiomics differentiates radiation injury from recurrent brain metastasis. NeuroImage Clin. 2018, 20, 537–542. [Google Scholar] [CrossRef] [PubMed]
- Aerts, H.J.W.L.; Velazquez, E.R.; Leijenaar, R.T.H.; Parmar, C.; Grossmann, P.; Carvalho, S.; Bussink, J.; Monshouwer, R.; Haibe-Kains, B.; Rietveld, D.; et al. Decoding tumour phenotype by noninvasive imaging using a quantitative radiomics approach. Nat. Commun. 2014, 5, 4006. [Google Scholar] [CrossRef] [PubMed]
- Lambin, P.; Rios-Velazquez, E.; Leijenaar, R.; Carvalho, S.; van Stiphout, R.G.P.M.; Granton, P.; Zegers, C.M.L.; Gillies, R.; Boellard, R.; Dekker, A.; et al. Radiomics: Extracting more information from medical images using advanced feature analysis. Eur. J. Cancer 2012, 48, 441–446. [Google Scholar] [CrossRef] [PubMed] [Green Version]
- Kumar, R.; Gupta, A.; Arora, H.S.; Pandian, G.N.; Raman, B. CGHF: A Computational decision support system for glioma classification using hybrid radiomics- and stationary wavelet-based features. IEEE Access 2020, 8, 79440–79458. [Google Scholar] [CrossRef]
- Lohmann, P.; Meißner, A.-K.; Kocher, M.; Bauer, E.K.; Werner, J.-M.; Fink, G.R.; Shah, N.J.; Langen, K.-J.; Galldiks, N. Feature-based PET/MRI radiomics in patients with brain tumors. Neuro-Oncol. Adv. 2021, 2, iv15–iv21. [Google Scholar] [CrossRef]
- Kickingereder, P.; Götz, M.; Muschelli, J.; Wick, A.; Neuberger, U.; Shinohara, R.T.; Sill, M.; Nowosielski, M.; Schlemmer, H.-P.; Radbruch, A.; et al. Large-scale radiomic profiling of recurrent glioblastoma identifies an imaging predictor for stratifying anti-angiogenic treatment response. Clin. Cancer Res. 2016, 22, 5765–5771. [Google Scholar] [CrossRef] [Green Version]
- Kickingereder, P.; Bonekamp, D.; Nowosielski, M.; Kratz, A.; Sill, M.; Burth, S.; Wick, A.; Eidel, O.; Schlemmer, H.-P.; Radbruch, A.; et al. Radiogenomics of glioblastoma: Machine learning–based classification of molecular characteristics by using multiparametric and multiregional mr imaging features. Radiology 2016, 281, 907–918. [Google Scholar] [CrossRef] [PubMed] [Green Version]
- Galldiks, N.; Law, I.; Pope, W.B.; Arbizu, J.; Langen, K.-J. The use of amino acid PET and conventional MRI for monitoring of brain tumor therapy. NeuroImage Clin. 2017, 13, 386–394. [Google Scholar] [CrossRef] [PubMed] [Green Version]
- Langen, K.-J.; Galldiks, N.; Hattingen, E.; Shah, N.J. Advances in neuro-oncology imaging. Nat. Rev. Neurol. 2017, 13, 279–289. [Google Scholar] [CrossRef] [PubMed]
- Albert, N.L.; Weller, M.; Suchorska, B.; Galldiks, N.; Soffietti, R.; Kim, M.M.; la Fougère, C.; Pope, W.; Law, I.; Arbizu, J.; et al. Response assessment in neuro-oncology working group and European Association for Neuro-Oncology recommendations for the clinical use of PET imaging in gliomas. Neurooncology 2016, 18, 1199–1208. [Google Scholar] [CrossRef] [PubMed]
- Galldiks, N.; Langen, K.-J.; Albert, N.L.; Chamberlain, M.; Soffietti, R.; Kim, M.M.; Law, I.; Le Rhun, E.; Chang, S.; Schwarting, J.; et al. PET imaging in patients with brain metastasis—Report of the RANO/PET group. Neurooncology 2019, 21, 585–595. [Google Scholar] [CrossRef]
- Pope, W.B. Chapter 7—Brain metastases: Neuroimaging. In Handbook of Clinical Neurology; Schiff, D., van den Bent, M.J., Eds.; Elsevier: Amsterdam, The Netherlands, 2018; Volume 149, pp. 89–112. [Google Scholar]
- Langen, K.-J.; Watts, C. Amino acid PET for brain tumours—Ready for the clinic? Nat. Rev. Neurol. 2016, 12, 375–376. [Google Scholar] [CrossRef] [PubMed]
- Rutledge, W.C.; Kong, J.; Gao, J.; Gutman, D.A.; Cooper, L.A.D.; Appin, C.; Park, Y.; Scarpace, L.; Mikkelsen, T.; Cohen, M.L.; et al. Tumor-infiltrating lymphocytes in glioblastoma are associated with specific genomic alterations and related to transcriptional class. Clin. Cancer Res. 2013, 19, 4951–4960. [Google Scholar] [CrossRef] [PubMed] [Green Version]
- Mariño, G.; Niso-Santano, M.; Baehrecke, E.H.; Kroemer, G. Self-consumption: The interplay of autophagy and apoptosis. Nat. Rev. Mol. Cell Biol. 2014, 15, 81–94. [Google Scholar] [CrossRef] [Green Version]
- Björndahl, M.A.; Cao, R.; Burton, J.B.; Brakenhielm, E.; Religa, P.; Galter, D.; Wu, L.; Cao, Y. Vascular Endothelial growth factor-a promotes peritumoral lymphangiogenesis and lymphatic metastasis. Cancer Res. 2005, 65, 9261–9268. [Google Scholar] [CrossRef] [PubMed] [Green Version]
- Kaal, E.C.A.; Vecht, C.J. The management of brain edema in brain tumors. Curr. Opin. Oncol. 2004, 16, 593–600. [Google Scholar] [CrossRef]
- Esquenazi, Y.; Lo, V.P.; Lee, K. Critical care management of cerebral edema in brain tumors. J. Intensive Care Med. 2017, 32, 15–24. [Google Scholar] [CrossRef] [PubMed]
- D’Alessio, A.; Proietti, G.; Sica, G.; Scicchitano, B.M. Pathological and molecular features of glioblastoma and its peritumoral tissue. Cancers 2019, 11, 469. [Google Scholar] [CrossRef] [Green Version]
- Maugeri, R.; Schiera, G.; Di Liegro, C.M.; Fricano, A.; Iacopino, D.G.; Di Liegro, I. Aquaporins and brain tumors. Int. J. Mol. Sci. 2016, 17, 1029. [Google Scholar] [CrossRef] [PubMed] [Green Version]
- Mader, S.; Brimberg, L. Aquaporin-4 water channel in the brain and its implication for health and disease. Cells 2019, 8, 90. [Google Scholar] [CrossRef] [Green Version]
- Zhou, M.; Scott, J.; Chaudhury, B.; Hall, L.; Goldgof, D.; Yeom, K.W.; Iv, M.; Ou, Y.; Kalpathy-Cramer, J.; Napel, S.; et al. Radiomics in brain tumor: Image assessment, quantitative feature descriptors, and machine-learning approaches. Am. J. Neuroradiol. 2018, 39, 208–216. [Google Scholar] [CrossRef] [PubMed]
- Verduin, M.; Primakov, S.; Compter, I.; Woodruff, H.C.; van Kuijk, S.M.J.; Ramaekers, B.L.T.; te Dorsthorst, M.; Revenich, E.G.M.; ter Laan, M.; Pegge, S.A.H.; et al. Prognostic and predictive value of integrated qualitative and quantitative magnetic resonance imaging analysis in glioblastoma. Cancers 2021, 13, 722. [Google Scholar] [CrossRef] [PubMed]
- Chaddad, A.; Sabri, S.; Niazi, T.; Abdulkarim, B. Prediction of survival with multi-scale radiomic analysis in glioblastoma patients. Med. Biol. Eng. Comput. 2018, 56, 2287–2300. [Google Scholar] [CrossRef] [PubMed]
- Li, Z.C.; Bai, H.; Sun, Q.; Zhao, Y.; Lv, Y.; Zhou, J.; Liang, C.; Chen, Y.; Liang, D.; Zheng, H. Multiregional radiomics profiling from multiparametric MRI: Identifying an imaging predictor of IDH1 mutation status in glioblastoma. Cancer Med. 2018, 7, 5999–6009. [Google Scholar] [CrossRef] [Green Version]
- Marusyk, A.; Polyak, K. Tumor heterogeneity: Causes and consequences. Biochim. Biophys. Acta Rev. Cancer 2010, 1805, 105–117. [Google Scholar] [CrossRef] [Green Version]
- Hegi, M.E.; Diserens, A.-C.; Gorlia, T.; Hamou, M.-F.; de Tribolet, N.; Weller, M.; Kros, J.M.; Hainfellner, J.A.; Mason, W.; Mariani, L.; et al. MGMT Gene silencing and benefit from temozolomide in glioblastoma. N. Engl. J. Med. 2005, 352, 997–1003. [Google Scholar] [CrossRef] [PubMed] [Green Version]
- Drabycz, S.; Roldán, G.; de Robles, P.; Adler, D.; McIntyre, J.B.; Magliocco, A.M.; Cairncross, J.G.; Mitchell, J.R. An analysis of image texture, tumor location, and MGMT promoter methylation in glioblastoma using magnetic resonance imaging. NeuroImage 2010, 49, 1398–1405. [Google Scholar] [CrossRef] [PubMed]
- Traverso, A.; Wee, L.; Dekker, A.; Gillies, R. Repeatability and reproducibility of radiomic features: A systematic review. Int. J. Radiat. Oncol. Biol. Phys. 2018, 102, 1143–1158. [Google Scholar] [CrossRef] [PubMed] [Green Version]
- Jiang, T.; Shi, T.; Zhang, H.; Hu, J.; Song, Y.; Wei, J.; Ren, S.; Zhou, C. Tumor neoantigens: From basic research to clinical applications. J. Hematol. Oncol. 2019, 12, 93. [Google Scholar] [CrossRef] [PubMed] [Green Version]
- Peng, M.; Mo, Y.; Wang, Y.; Wu, P.; Zhang, Y.; Xiong, F.; Guo, C.; Wu, X.; Li, Y.; Li, X.; et al. Neoantigen vaccine: An emerging tumor immunotherapy. Mol. Cancer 2019, 18, 128. [Google Scholar] [CrossRef] [PubMed] [Green Version]
- Keskin, D.B.; Anandappa, A.J.; Sun, J.; Tirosh, I.; Mathewson, N.D.; Li, S.; Oliveira, G.; Giobbie-Hurder, A.; Felt, K.; Gjini, E.; et al. Neoantigen vaccine generates intratumoral T cell responses in phase Ib glioblastoma trial. Nature 2019, 565, 234–239. [Google Scholar] [CrossRef] [PubMed]
- Zhang, J.; Caruso, F.P.; Sa, J.K.; Justesen, S.; Nam, D.-H.; Sims, P.; Ceccarelli, M.; Lasorella, A.; Iavarone, A. The combination of neoantigen quality and T lymphocyte infiltrates identifies glioblastomas with the longest survival. Commun. Biol. 2019, 2, 135. [Google Scholar] [CrossRef] [PubMed] [Green Version]


| 1. Local Patients with GBM | 2. TCIA Database with GBM | |||
|---|---|---|---|---|
| Parameter | Mean ± SD (Min.–Max.) | 95% Confidence Interval-Mean (Lower–Upper Bound) | Mean ± SD (Min.–Max.) | 95% Confidence Interval-Mean (Lower–Upper Bound) |
| Necrosis/ABV | 0.23 ± 0.12 (0.05–0.55) | 0.18–0.28 ** | 0.17 ± 0.83 (0.05–0.33) | 0.14–0.20 ** |
| Solid/ABV | 0.31 ± 0.16 (0.10–0.62) | 0.24–0.38 ** | 0.43 ± 0.15 (0.18–0.84) | 0.37–0.49 ** |
| Peritumoral tissue/ABV | 0.08 ± 0.02 (0.05–0.11) | 0.07–0.08 | 0.09 ± 0.03 (0.05–0.16) | 0.08–0.10 |
| Edema/ABV | 0.39 ± 0.21 (0.02–0.74) | 0.30–0.48 ** | 0.31 ± 0.19 (0.02–0.60) | 0.24–0.38 ** |
| 1. Local Patients with GBM | 2. TCIA Database with GBM | |||
|---|---|---|---|---|
| Parameter | Mean ± SD (Min.–Max.) | 95% Confidence Interval-Mean (Lower–Upper Bound) | Mean ± SD (Min.–Max.) | 95% Confidence Interval-Mean (Lower–Upper Bound) |
| Necrosis/Solid | 0.97 ± 0.91 (0.24–3.64) | 0.57–1.36 * | 0.44 ± 0.21 (0.05–0.98) | 0.36–0.51 † |
| Peritumoral tissue/Solid | 0.31 ± 0.19 (0.10–1.00) | 0.23–0.39 † | 0.22 ± 0.10 (0.11–0.64) | 0.18–0.26 † |
| Edema/Solid | 1.98 ± 1.80 (0.05–7.17) | 1.20–2.76 | 0.96 ± 0.82 (0.02–3.22) | 0.66–1.27 |
| 1. Local Patients with GBM | 2. TCIA Database with GBM | |||
|---|---|---|---|---|
| Parameter | Mean ± SD (Min.–Max.) | 95% Confidence Interval-Mean (Lower–Upper Bound) | Mean ± SD (Min.–Max.) | 95% Confidence Interval-Mean (Lower–Upper Bound) |
| Necrosis/Peritumoral tissue | 2.94 ± 1.42 (1.09–7.88) | 2.33–3.56 | 2.20 ± 1.18 (0.50–4.32) | 1.76–2.63 |
| Solid/Peritumoral tissue | 4.12 ± 2.03 (1.00–9.85) | 3.25–5.00 | 5.16 ± 1.49 (1.57–9.17) | 4.61–5.70 † |
| Edema/Peritumoral tissue | 5.89 ± 4.34 (0.21–15.15) | 4.01–7.76 * | 4.25 ± 3.31 (0.21–11.55) | 3.04–5.46 † |
| Study | Theme | MRI Sequences PET Tracer | Feature Type | Classification Method | Performance (Training) |
|---|---|---|---|---|---|
| MRI | |||||
| Chiu et al. (2021) [4] | Efficiently classify tumor subregions of GBM for prognostication with key biological processes | T1-CE, T2-WI, T2-FLAIR, ADC | Morphological features, Intensity features, Texture features, Histogram features | Random forest | 0.96 (AUC) |
| Park et al. (2020) [9] | Prognostication subtypes model of GBM | T1-CE, T2-FLAIR, DWI, dynamic susceptibility contrast (DSC). | Morphological features, Intensity features, Texture features | Cox regression and LASSO | 0.74 (C-index) |
| Chaddad et al. (2019) [10] | Predicts Survival of IDH1 Wild-Type Glioblastoma | T1-CE, T2-FLAIR | Morphological features, Intensity features, Texture features | Random forest | 0.78 (AUC) |
| Rathore et al. (2018) [11] | Tumor subtypes of GBM with different clinical and molecular characteristics offering prognostic value | T1-WI, T1-CE, T2-WI, T2-FLAIR, DSC-MRI, DTI | Morphological features, Intensity features, Texture features, Histogram features | K-means clustering | 0.75 (C-index) |
| PET/MRI | |||||
| Haubold et al. (2020) [12] | Tumor decoding and phenotyping: prediction of 1p/19q co-deletion | T1-CE, ADC, 3D-FLAIR (SPACE)/18F-FET | Morphological features, Intensity features, Metabolic features | (1) 1p/19q co-deletion: Random forest (2) MGMT promoter methylation status: SVM | (1) 0.98 (AUC) (2) 0.76 (C-index) |
| Wang et al. (2020) [13] | Differentiation of radiation necrosis from tumor recurrence | T1-CE, FLAIR/18F-FDG & 11C-MET PET | Morphological features, Texture features, Metabolic features | LASSO binary logistic regression | 0.99/0.91 (AUC) |
| Lohmann et al. (2018) [14] | Radiomics differentiates radiation injury from recurrent brain metastasis | T1-CE, T2-WI, T2-FLAIR/ 18F-FET | Morphological features, Texture features, Histogram features, Metabolic features | Logistic regression | 0.96 (AUC) |
Publisher’s Note: MDPI stays neutral with regard to jurisdictional claims in published maps and institutional affiliations. |
© 2022 by the authors. Licensee MDPI, Basel, Switzerland. This article is an open access article distributed under the terms and conditions of the Creative Commons Attribution (CC BY) license (https://creativecommons.org/licenses/by/4.0/).
Share and Cite
Chiu, F.-Y.; Yen, Y. Efficient Radiomics-Based Classification of Multi-Parametric MR Images to Identify Volumetric Habitats and Signatures in Glioblastoma: A Machine Learning Approach. Cancers 2022, 14, 1475. https://doi.org/10.3390/cancers14061475
Chiu F-Y, Yen Y. Efficient Radiomics-Based Classification of Multi-Parametric MR Images to Identify Volumetric Habitats and Signatures in Glioblastoma: A Machine Learning Approach. Cancers. 2022; 14(6):1475. https://doi.org/10.3390/cancers14061475
Chicago/Turabian StyleChiu, Fang-Ying, and Yun Yen. 2022. "Efficient Radiomics-Based Classification of Multi-Parametric MR Images to Identify Volumetric Habitats and Signatures in Glioblastoma: A Machine Learning Approach" Cancers 14, no. 6: 1475. https://doi.org/10.3390/cancers14061475
APA StyleChiu, F.-Y., & Yen, Y. (2022). Efficient Radiomics-Based Classification of Multi-Parametric MR Images to Identify Volumetric Habitats and Signatures in Glioblastoma: A Machine Learning Approach. Cancers, 14(6), 1475. https://doi.org/10.3390/cancers14061475