
Choroidal Abnormalities in Pediatric NF1: A Cohort Natural History Study

 ,
,  ,
,  ,
,  and
and 
Abstract
:Simple Summary
Abstract
1. Introduction
2. Materials and Methods
Statistical Analysis
3. Results
4. Discussion
5. Conclusions
Supplementary Materials
Author Contributions
Funding
Institutional Review Board Statement
Informed Consent Statement
Data Availability Statement
Acknowledgments
Conflicts of Interest
References
- Evans, D.G.; Howard, E.; Giblin, C.; Clancy, T.; Spencer, H.; Huson, S.M.; Lalloo, F. Birth incidence and prevalence of tumor-prone syndromes: Estimates from a UK family genetic register service. Am. J. Med. Genet. Part A 2010, 152, 327–332. [Google Scholar] [CrossRef] [PubMed]
- Ferner, R.E.; Huson, S.M.; Thomas, N.; Moss, C.; Willshaw, H.; Evans, D.G.; Upadhyaya, M.; Towers, R.; Gleeson, M.; Steiger, C.; et al. Guidelines for the diagnosis and management of individuals with neurofibromatosis. J. Med. Genet. 2007, 44, 81–88. [Google Scholar] [CrossRef] [PubMed] [Green Version]
- Listernick, R.; Ferner, R.E.; Liu, G.T.; Gutmann, D.H. Optic pathway gliomas in neurofibromatosis-1: Controversies and recommendations. Ann. Neurol. 2007, 61, 189–198. [Google Scholar] [CrossRef] [PubMed]
- Pasmant, E.; Vidaud, M.; Vidaud, D.; Wolkenstein, P. Neurofibromatosis type 1: From genotype to phenotype. J. Med. Genet. 2012, 49, 483–489. [Google Scholar] [CrossRef] [Green Version]
- Clementi, M.; Barbujani, G.; Turolla, L.; Tenconi, R. Neurofibromatosis-1: A maximum likelihood estimation of mutation rate. Hum. Genet. 1990, 84, 116–118. [Google Scholar] [CrossRef]
- Legius, E.; Messiaen, L.; Wolkenstein, P.; Pancza, P.; Avery, R.A.; Berman, Y.; Blakeley, J.; Babovic-Vuksanovic, D.; Cunha, K.S.; Ferner, R.; et al. Revised diagnostic criteria for neurofibromatosis type 1 and Legius syndrome: An international consensus recommendation. Genet. Med. 2021, 23, 1506–1513. [Google Scholar] [CrossRef]
- Tadini, G.; Milani, D.; Menni, F.; Pezzani, L.; Sabatini, C.; Esposito, S. Is it time to change the neurofibromatosis 1 diagnostic criteria? Eur. J. Intern. Med. 2014, 25, 506–510. [Google Scholar] [CrossRef]
- Parrozzani, R.; Clementi, M.; Frizziero, L.; Miglionico, G.; Perrini, P.; Cavarzeran, F.; Kotsafti, O.; Comacchio, F.; Trevisson, E.; Convento, E.; et al. In vivo detection of Choroidal abnormalities related to NF1: Feasibility and comparison with standard NIH diagnostic criteria in pediatric patients. Investig. Ophthalmol. Vis. Sci. 2015, 56, 6036–6042. [Google Scholar] [CrossRef]
- Vagge, A.; Camicione, P.; Capris, C.; Sburlati, C.; Panarello, S.; Calevo, M.G.; Traverso, C.E.; Capris, P. Choroidal abnormalities in neurofibromatosis type 1 detected by near-infrared reflectance imaging in paediatric population. Acta Ophthalmol. 2015, 93, e667–e671. [Google Scholar] [CrossRef]
- Cassiman, C.; Casteels, I.; Jacob, J.; Plasschaert, E.; Brems, H.; Dubron, K.; Keer, K.V.; Legius, E. Choroidal abnormalities in café-au-lait syndromes: A new differential diagnostic tool? Clin. Genet. 2017, 91, 529–535. [Google Scholar] [CrossRef]
- Viola, F.; Villani, E.; Natacci, F.; Selicorni, A.; Melloni, G.; Vezzola, D.; Barteselli, G.; Mapelli, C.; Pirondini, C.; Ratiglia, R. Choroidal abnormalities detected by near-infrared reflectance imaging as a new diagnostic criterion for neurofibromatosis 1. Ophthalmology 2012, 119, 369–375. [Google Scholar] [CrossRef] [PubMed] [Green Version]
- Parrozzani, R.; Midena, E. Author response: Choroidal abnormalities detected by near-infrared imaging (NIR) in pediatric patients with neurofibromatosis type 1 (NF1). Investig. Ophthalmol. Vis. Sci. 2016, 57, 775. [Google Scholar] [CrossRef] [PubMed] [Green Version]
- Klein, R.M.; Glassman, L. Neurofibromatosis of the choroid. Am. J. Ophthalmol. 1985, 99, 367–368. [Google Scholar] [CrossRef]
- Wolter, J.R. Nerve Fibrils in Ovoid Bodies: With Neurofibromatosis of the Choroid. Arch. Ophthalmol. 1965, 73, 696–699. [Google Scholar] [CrossRef]
- Kurosawa, A.; Kurosawa, H. Ovoid Bodies in Choroidal Neurofibromatosis. Arch. Ophthalmol. 1982, 100, 1939–1941. [Google Scholar] [CrossRef]
- Woog, J.J.; Albert, D.M.; Craft, J.; Silberman, N.; Horns, D. Choroidal ganglioneuroma in neurofibromatosis. Graefe’s Arch. Clin. Exp. Ophthalmol. 1983, 220, 25–31. [Google Scholar] [CrossRef]
- Rescaldani, C.; Nicolini, P.; Fatigati, G.; Bottoni, F.G. Clinical application of digital indocyanine green angiography in choroidal neurofibromatosis. Ophthalmologica 1998, 212, 99–104. [Google Scholar] [CrossRef]
- Yasunari, T.; Shiraki, K.; Hattori, H.; Miki, T. Frequency of choroidal abnormalities in neurofibromatosis type 1. Lancet 2000, 356, 988–992. [Google Scholar] [CrossRef]
- Nakakura, S.; Shiraki, K.; Yasunari, T.; Hayashi, Y.; Ataka, S.; Kohno, T. Quantification and anatomic distribution of choroidal abnormalities in patients with type I neurofibromatosis. Graefe’s Arch. Clin. Exp. Ophthalmol. 2005, 243, 980–984. [Google Scholar] [CrossRef]
- Ueda-Consolvo, T.; Miyakoshi, A.; Ozaki, H.; Houki, S.; Hayashi, A. Near-infrared fundus autofluorescence-visualized melanin in the choroidal abnormalities of neurofibromatosis type 1. Clin. Ophthalmol. 2012, 6, 1191–1194. [Google Scholar]
- Makino, S.; Tampo, H. Optical Coherence Tomography Imaging of Choroidal Abnormalities in Neurofibromatosis Type 1. Case Rep. Ophthalmol. Med. 2013, 2013, 292981. [Google Scholar] [CrossRef] [PubMed] [Green Version]
- Makino, S.; Tampo, H.; Arai, Y.; Obata, H. Correlations between choroidal abnormalities, lisch nodules, and age in patients with neurofibromatosis type 1. Clin. Ophthalmol. 2014, 8, 165–168. [Google Scholar] [CrossRef] [PubMed] [Green Version]
- Moramarco, A.; Giustini, S.; Nofroni, I.; Mallone, F.; Miraglia, E.; Iacovino, C.; Calvieri, S.; Lambiase, A. Near-infrared imaging: An in vivo, non-invasive diagnostic tool in neurofibromatosis type 1. Graefe’s Arch. Clin. Exp. Ophthalmol. 2018, 256, 307–311. [Google Scholar] [CrossRef] [PubMed]
- Goktas, S.; Sakarya, Y.; Ozcimen, M.; Alpfidan, I.; Uzun, M.; Sakarya, R.; Yarbag, A. Frequency of choroidal abnormalities in pediatric patients with neurofibromatosis type 1. J. Pediatr. Ophthalmol. Strabismus 2014, 51, 204–208. [Google Scholar] [CrossRef]
- Avery, R.A.; Bouffet, E.; Packer, R.J.; Reginald, A. Feasibility and comparison of visual acuity testing methods in children with neurofibromatosis type 1 and/or optic pathway gliomas. Investig. Opthalmol. Vis. Sci. 2013, 54, 1034–1038. [Google Scholar] [CrossRef] [Green Version]
- Chou, R.; Dana, T.; Bougatsos, C. Screening for visual impairment in children ages 1–5 years: Systematic review to update the 2004 U.S. preventive services task force recommendation. Evid. Synth. 2011, 81, 1–137. [Google Scholar]
- Sabbagh, A.; Pasmant, E.; Imbard, A.; Luscan, A.; Soares, M.; Blanché, H.; Laurendeau, I.; Ferkal, S.; Vidaud, M.; Pinson, S.; et al. NF1 molecular characterization and neurofibromatosis type I genotype-phenotype correlation: The French experience. Hum. Mutat. 2013, 34, 1510–1518. [Google Scholar] [CrossRef]
- Castle, B.; Baser, M.E.; Huson, S.M.; Cooper, D.N. Evaluation of genotype-phenotype correlations in neurofibromatosis type 1. J. Med. Genet. 2003, 40, 109. [Google Scholar] [CrossRef] [Green Version]
- DeBella, K.; Szudek, J.; Friedman, J.M. Use of the National Institutes of Health criteria for diagnosis of neurofibromatosis 1 in children. Pediatrics 2000, 105, 608–614. [Google Scholar] [CrossRef]
- Chilibeck, C.M.; Shah, S.; Russell, H.C.; Vincent, A.L. The presence and progression of choroidal neurofibromas in a predominantly pediatric population with neurofibromatosis type-1. Ophthalmic Genet. 2021, 42, 223–229. [Google Scholar] [CrossRef]
- Touzé, R.; Manassero, A.; Bremond-Gignac, D.; Robert, M.P. Long-term follow-up of choroidal abnormalities in children with neurofibromatosis type 1. Clin. Exp. Ophthalmol. 2021, 49, 516–519. [Google Scholar] [CrossRef] [PubMed]
- Yip, V.C.H.; Pan, C.W.; Lin, X.Y.; Lee, Y.S.; Gazzard, G.; Yong, T.Y.; Saw, S.M. The relationship between growth spurts and myopia in Singapore children. Investig. Ophthalmol. Vis. Sci. 2012, 53, 7961–7966. [Google Scholar] [CrossRef] [PubMed] [Green Version]
- Kearney, S.; Strang, N.C.; Cagnolati, B.; Gray, L.S. Change in body height, axial length and refractive status over a four-year period in caucasian children and young adults. J. Optom. 2020, 13, 128–136. [Google Scholar] [CrossRef] [PubMed]
- Ojaimi, E.; Morgan, I.G.; Robaei, D.; Rose, K.A.; Smith, W.; Rochtchina, E.; Mitchell, P. Effect of stature and other anthropometric parameters on eye size and refraction in a population-based study of Australian children. Investig. Ophthalmol. Vis. Sci. 2005, 46, 4424–4429. [Google Scholar] [CrossRef] [Green Version]


| CAs Parameter | Baseline | T1 | T3 | T5 | T7 |
|---|---|---|---|---|---|
| n = 99 | n = 80 | n = 99 | n = 59 | n = 36 | |
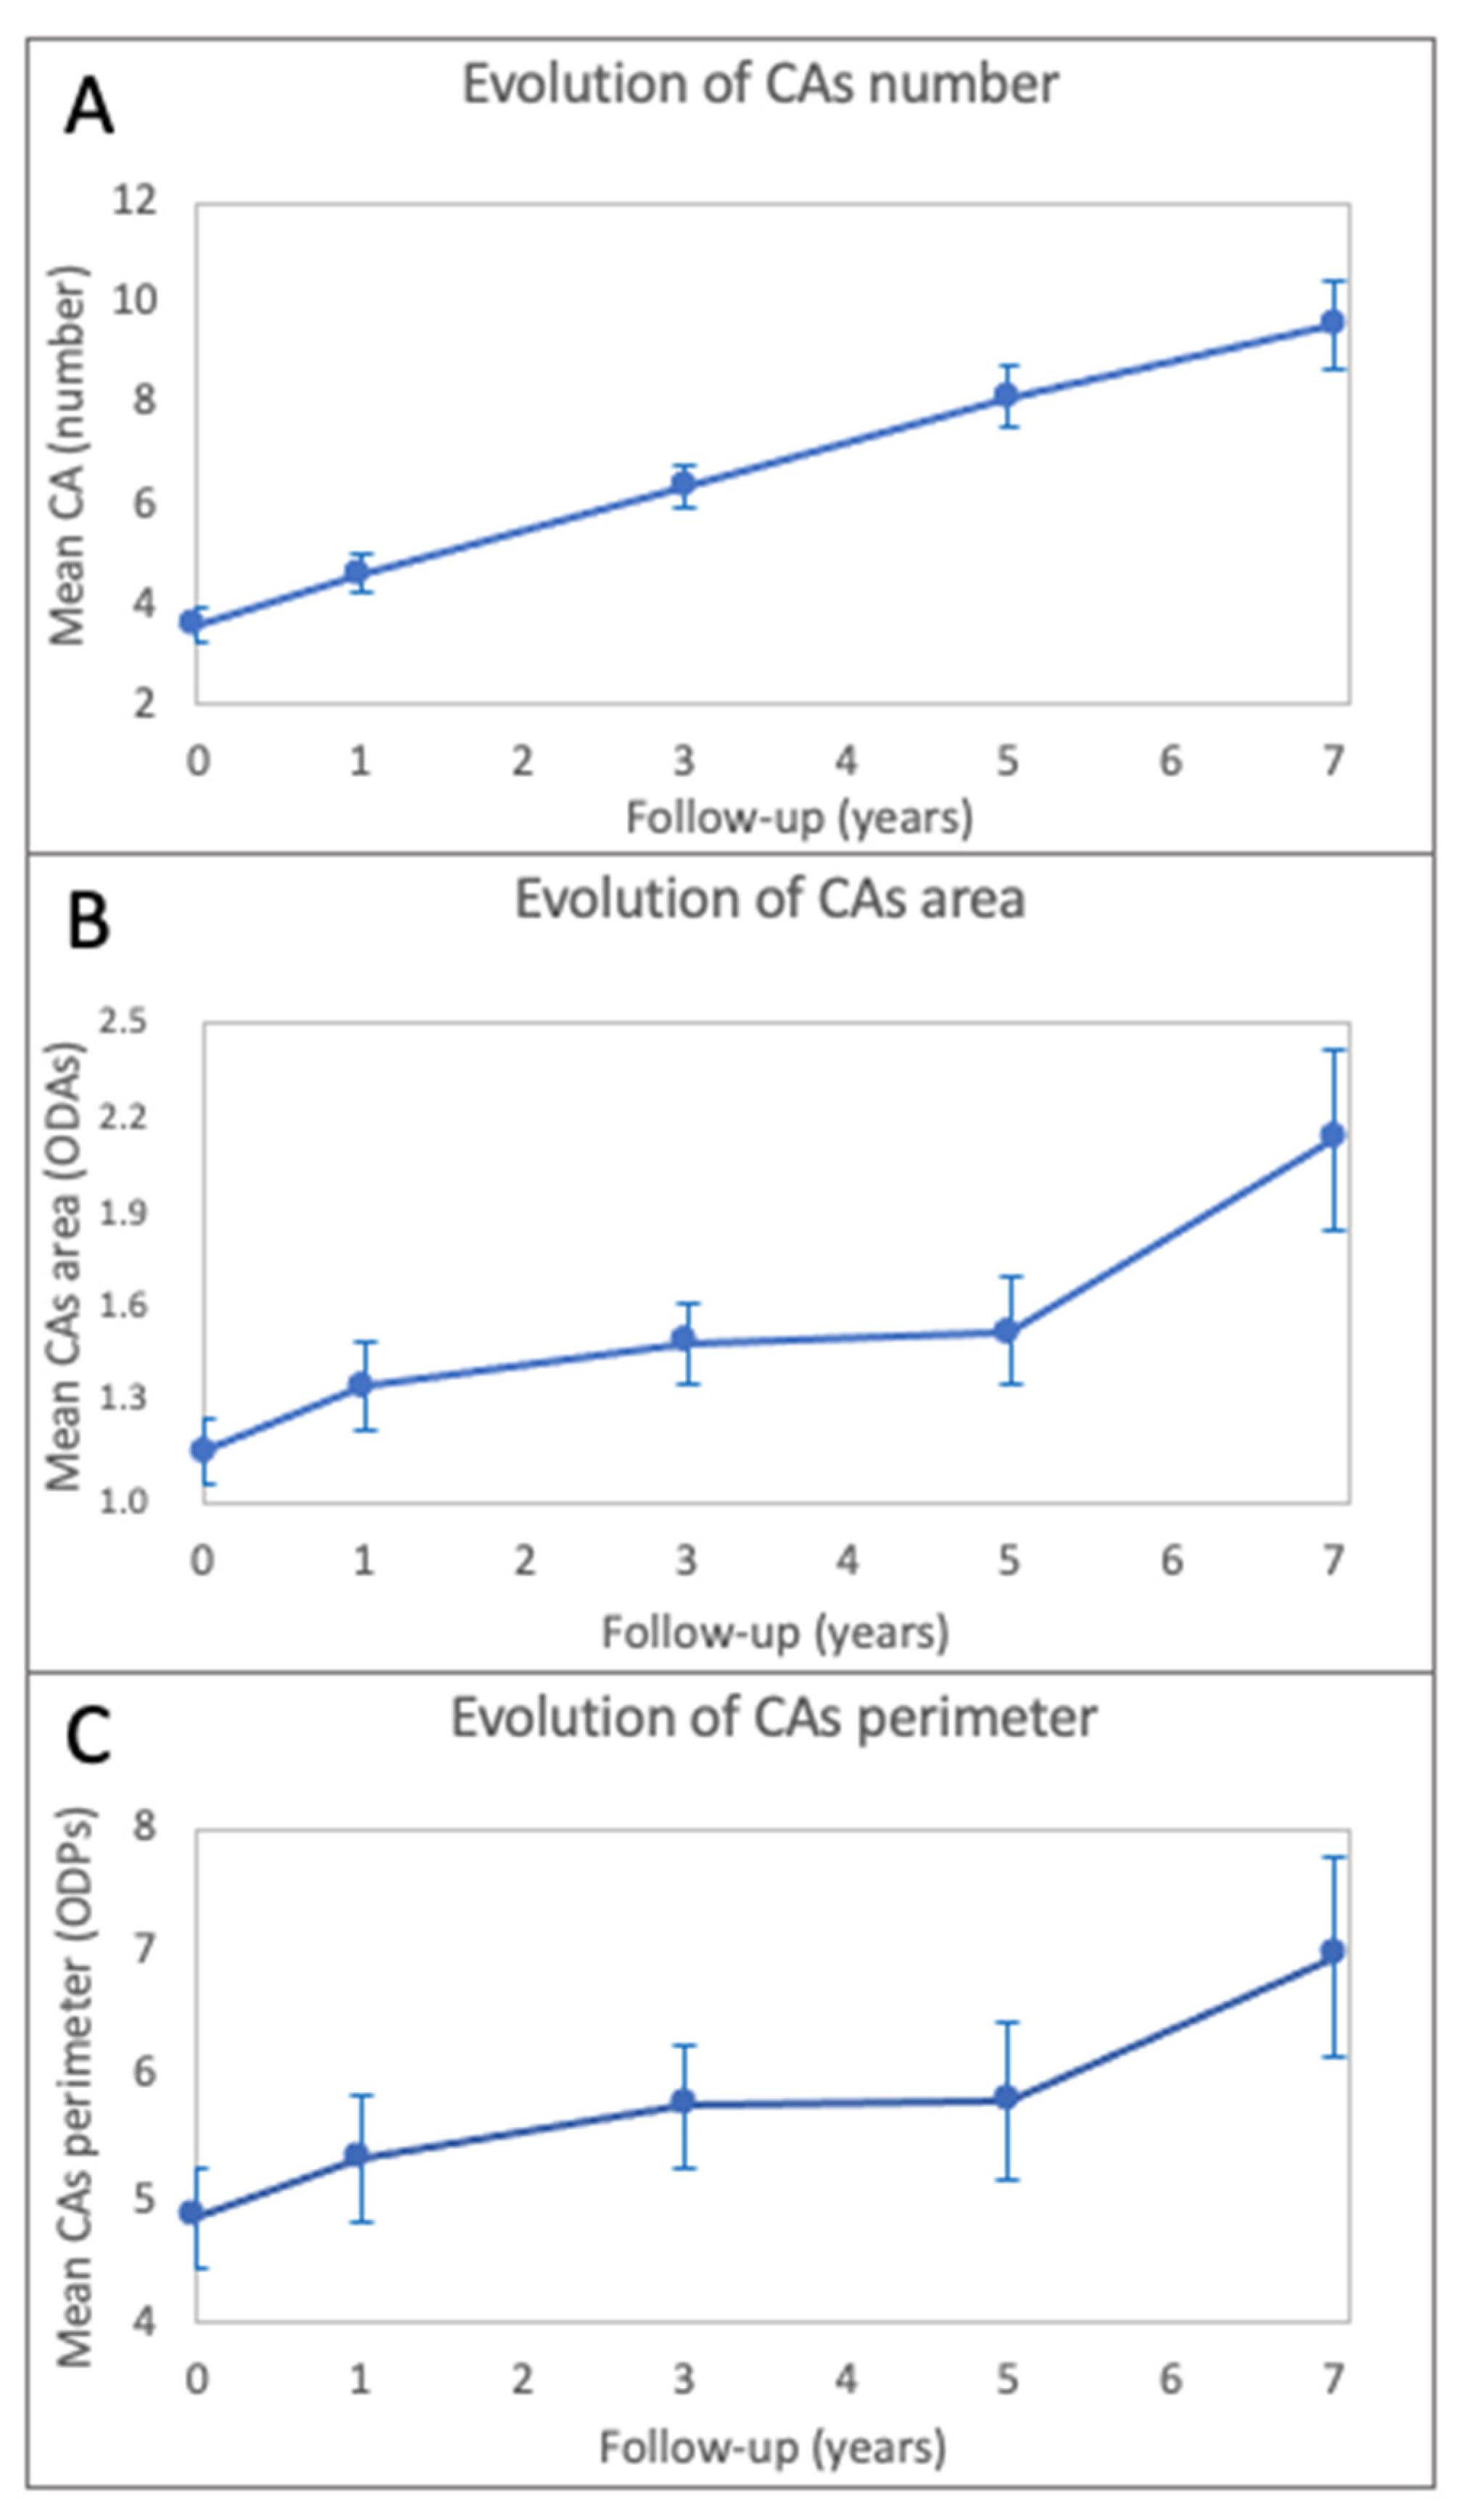
| Number (mean ± sd) | 3.6 ± 3.2 | 4.6 ± 3.5 | 6.4 ± 4.1 | 8.1 ± 4.8 | 9.6 ± 5.3 |
| Area 1 (mean ± sd) | 1.159 ± 0.975 | 1.367 ± 1.178 | 1.495 ± 1.162 | 1.534 ± 1.213 | 2.130 ± 1.564 |
| Perimeter 2 (mean ± sd) | 4.858 ± 3.745 | 5.320 ± 4.417 | 5.753 ± 4.652 | 5.803 ± 4.647 | 6.956 ± 4.536 |
| Parameter | CAs Number | CAs Area | CAs Perimeter |
|---|---|---|---|
| Time | 0.8213, p < 0.0001 | 0.1047, p < 0.0001 | 0.2102, p < 0.0001 |
| Age | −0.1313, p = 0.0068 | −0.0019, p = 0.8446 | 0.0514, p = 0.1736 |
| Baseline value | 1.1707, p < 0.0001 | 1.1274, p < 0.0001 | 1.1012, p < 0.0001 |
| Time Interval | CAs Number | CAs Area | CAs Perimeter | |||
|---|---|---|---|---|---|---|
| p-Value | Coefficient | p-Value | Coefficient | p-Value | Coefficient | |
| Baseline vs. T1 | <0.0001 | −1.1721 | 0.0004 | −0.2427 | 0.0126 | −0.7167 |
| Baseline vs. T3 | <0.0001 | −2.7677 | <0.0001 | −0.3362 | 0.0003 | −0.8943 |
| Baseline vs. T5 | <0.0001 | −4.4944 | <0.0001 | −0.4637 | <0.0001 | −1.2635 |
| Baseline vs. T7 | <0.0001 | −5.5130 | <0.0001 | −0.8906 | <0.0001 | −1.5382 |
| T1 vs. T3 | <0.0001 | −1.5956 | 0.5015 | −0.0935 | 0.9316 | −0.1776 |
| T1 vs. T5 | <0.0001 | −3.3223 | 0.0113 | −0.2210 | 0.2190 | −0.5468 |
| T1 vs. T7 | <0.0001 | −4.3409 | <0.0001 | −0.6479 | 0.0697 | −0.8215 |
| T3 vs. T5 | <0.0001 | −1.7268 | 0.2968 | −0.1275 | 0.5781 | −0.3692 |
| T3 vs. T7 | <0.0001 | −2.7453 | <0.0001 | −0.5545 | 0.2204 | −0.6439 |
| T5 vs. T7 | 0.0418 | −1.0185 | <0.0001 | −0.4270 | 0.9186 | −0.2747 |
| NF-Related Sign | Patients Number | Frequency | |
|---|---|---|---|
| n | % | ||
| Lisch nodules (at least 2) | 53 | 38 | 71.7% |
| Café-au-lait macules | 50 | 50 | 100% |
| Atypical freckling | 50 | 50 | 100% |
| Neurofibromas (at least 2 or 1 plexiform) | 50 | 27 | 54% |
| Optic pathway glioma | 50 | 18 | 34.62% |
| Distinctive osseous lesions | 50 | 5 | 10% |
| Type of Mutation | Frequency | |
|---|---|---|
| n | % | |
| Missense | 8 | 16.7% |
| Frameshift | 16 | 33.3% |
| Splicing | 7 | 14.6% |
| Deletion | 3 | 6.2% |
| Nonsense | 14 | 29.2% |
| Total | 48 | 100% |
Publisher’s Note: MDPI stays neutral with regard to jurisdictional claims in published maps and institutional affiliations. |
© 2022 by the authors. Licensee MDPI, Basel, Switzerland. This article is an open access article distributed under the terms and conditions of the Creative Commons Attribution (CC BY) license (https://creativecommons.org/licenses/by/4.0/).
Share and Cite
Cosmo, E.; Frizziero, L.; Miglionico, G.; De Biasi, C.S.; Bruno, M.; Trevisson, E.; Gabbiato, I.; Midena, G.; Parrozzani, R. Choroidal Abnormalities in Pediatric NF1: A Cohort Natural History Study. Cancers 2022, 14, 1423. https://doi.org/10.3390/cancers14061423
Cosmo E, Frizziero L, Miglionico G, De Biasi CS, Bruno M, Trevisson E, Gabbiato I, Midena G, Parrozzani R. Choroidal Abnormalities in Pediatric NF1: A Cohort Natural History Study. Cancers. 2022; 14(6):1423. https://doi.org/10.3390/cancers14061423
Chicago/Turabian StyleCosmo, Eleonora, Luisa Frizziero, Giacomo Miglionico, Chiara Sofia De Biasi, Marisa Bruno, Eva Trevisson, Ilaria Gabbiato, Giulia Midena, and Raffaele Parrozzani. 2022. "Choroidal Abnormalities in Pediatric NF1: A Cohort Natural History Study" Cancers 14, no. 6: 1423. https://doi.org/10.3390/cancers14061423
APA StyleCosmo, E., Frizziero, L., Miglionico, G., De Biasi, C. S., Bruno, M., Trevisson, E., Gabbiato, I., Midena, G., & Parrozzani, R. (2022). Choroidal Abnormalities in Pediatric NF1: A Cohort Natural History Study. Cancers, 14(6), 1423. https://doi.org/10.3390/cancers14061423