
Segmentation Uncertainty Estimation as a Sanity Check for Image Biomarker Studies

 , ,
, ,
Abstract
:Simple Summary
Abstract
1. Introduction
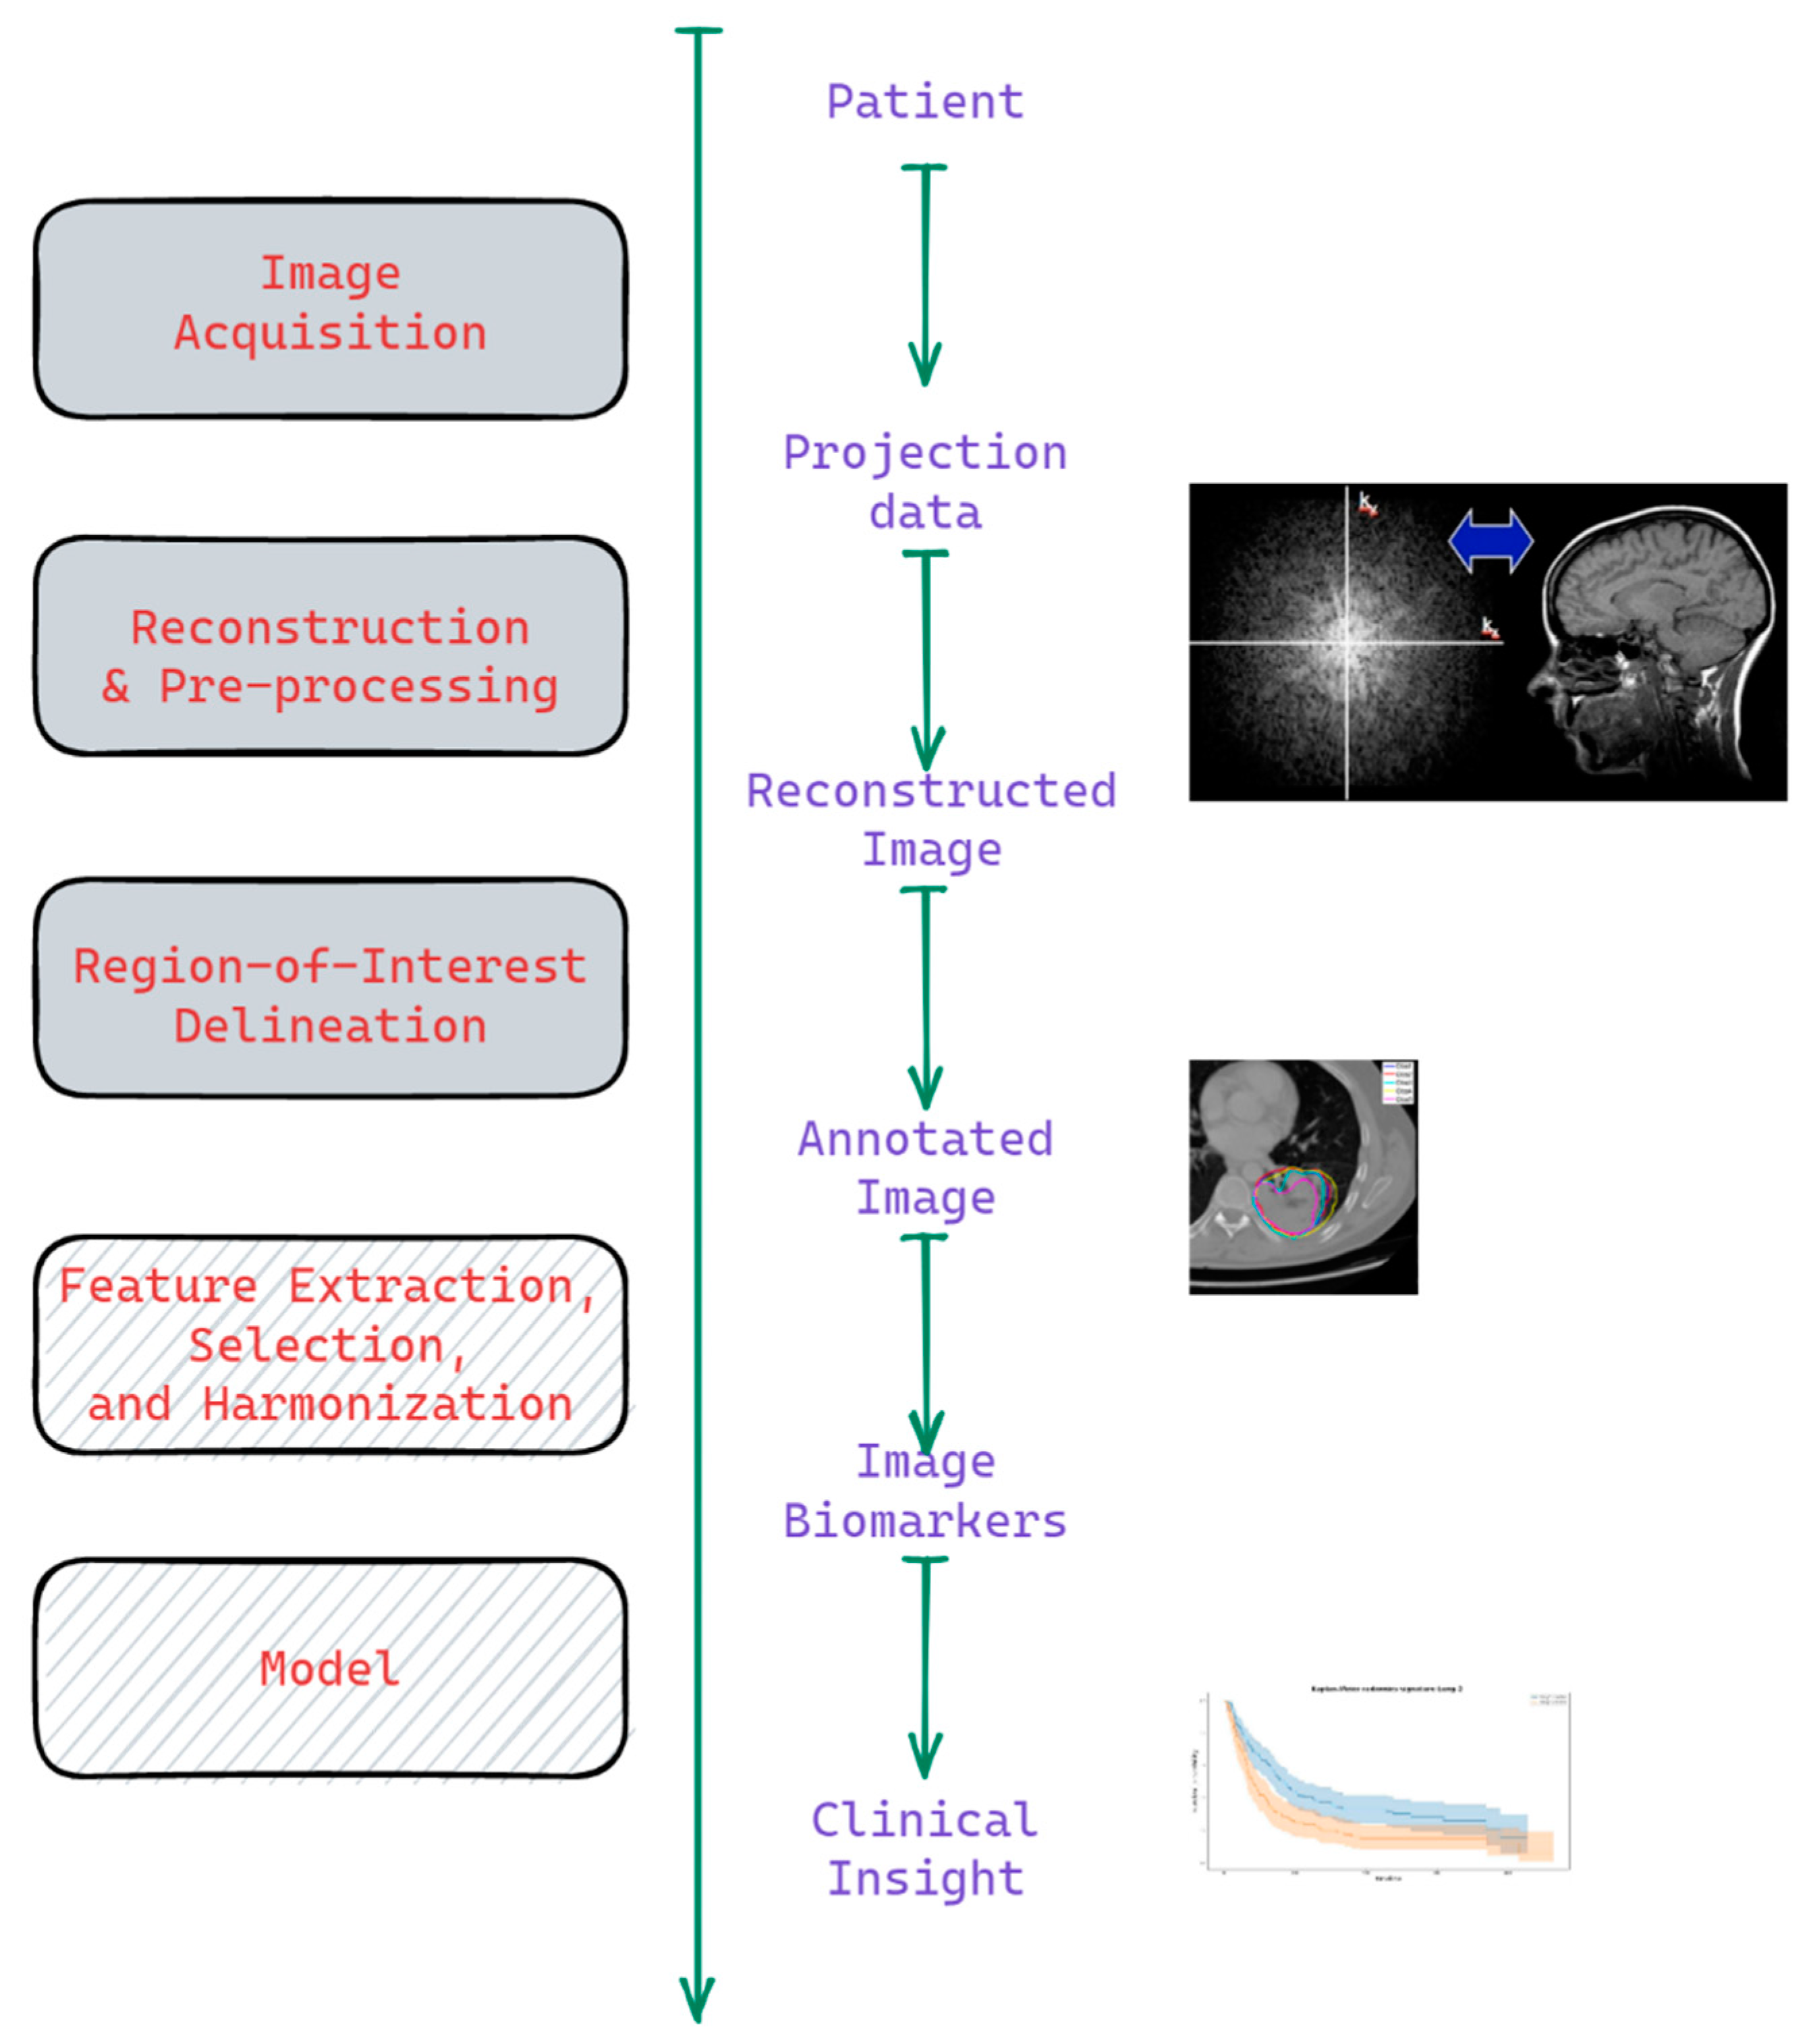
1.1. Background
1.2. Problem
- —the intra-patient variance due to protocol ‘a’ uncertainty;
- —the covariance of protocol ‘a’ and ‘b’ uncertainties.
2. Materials and Methods
2.1. Datasets
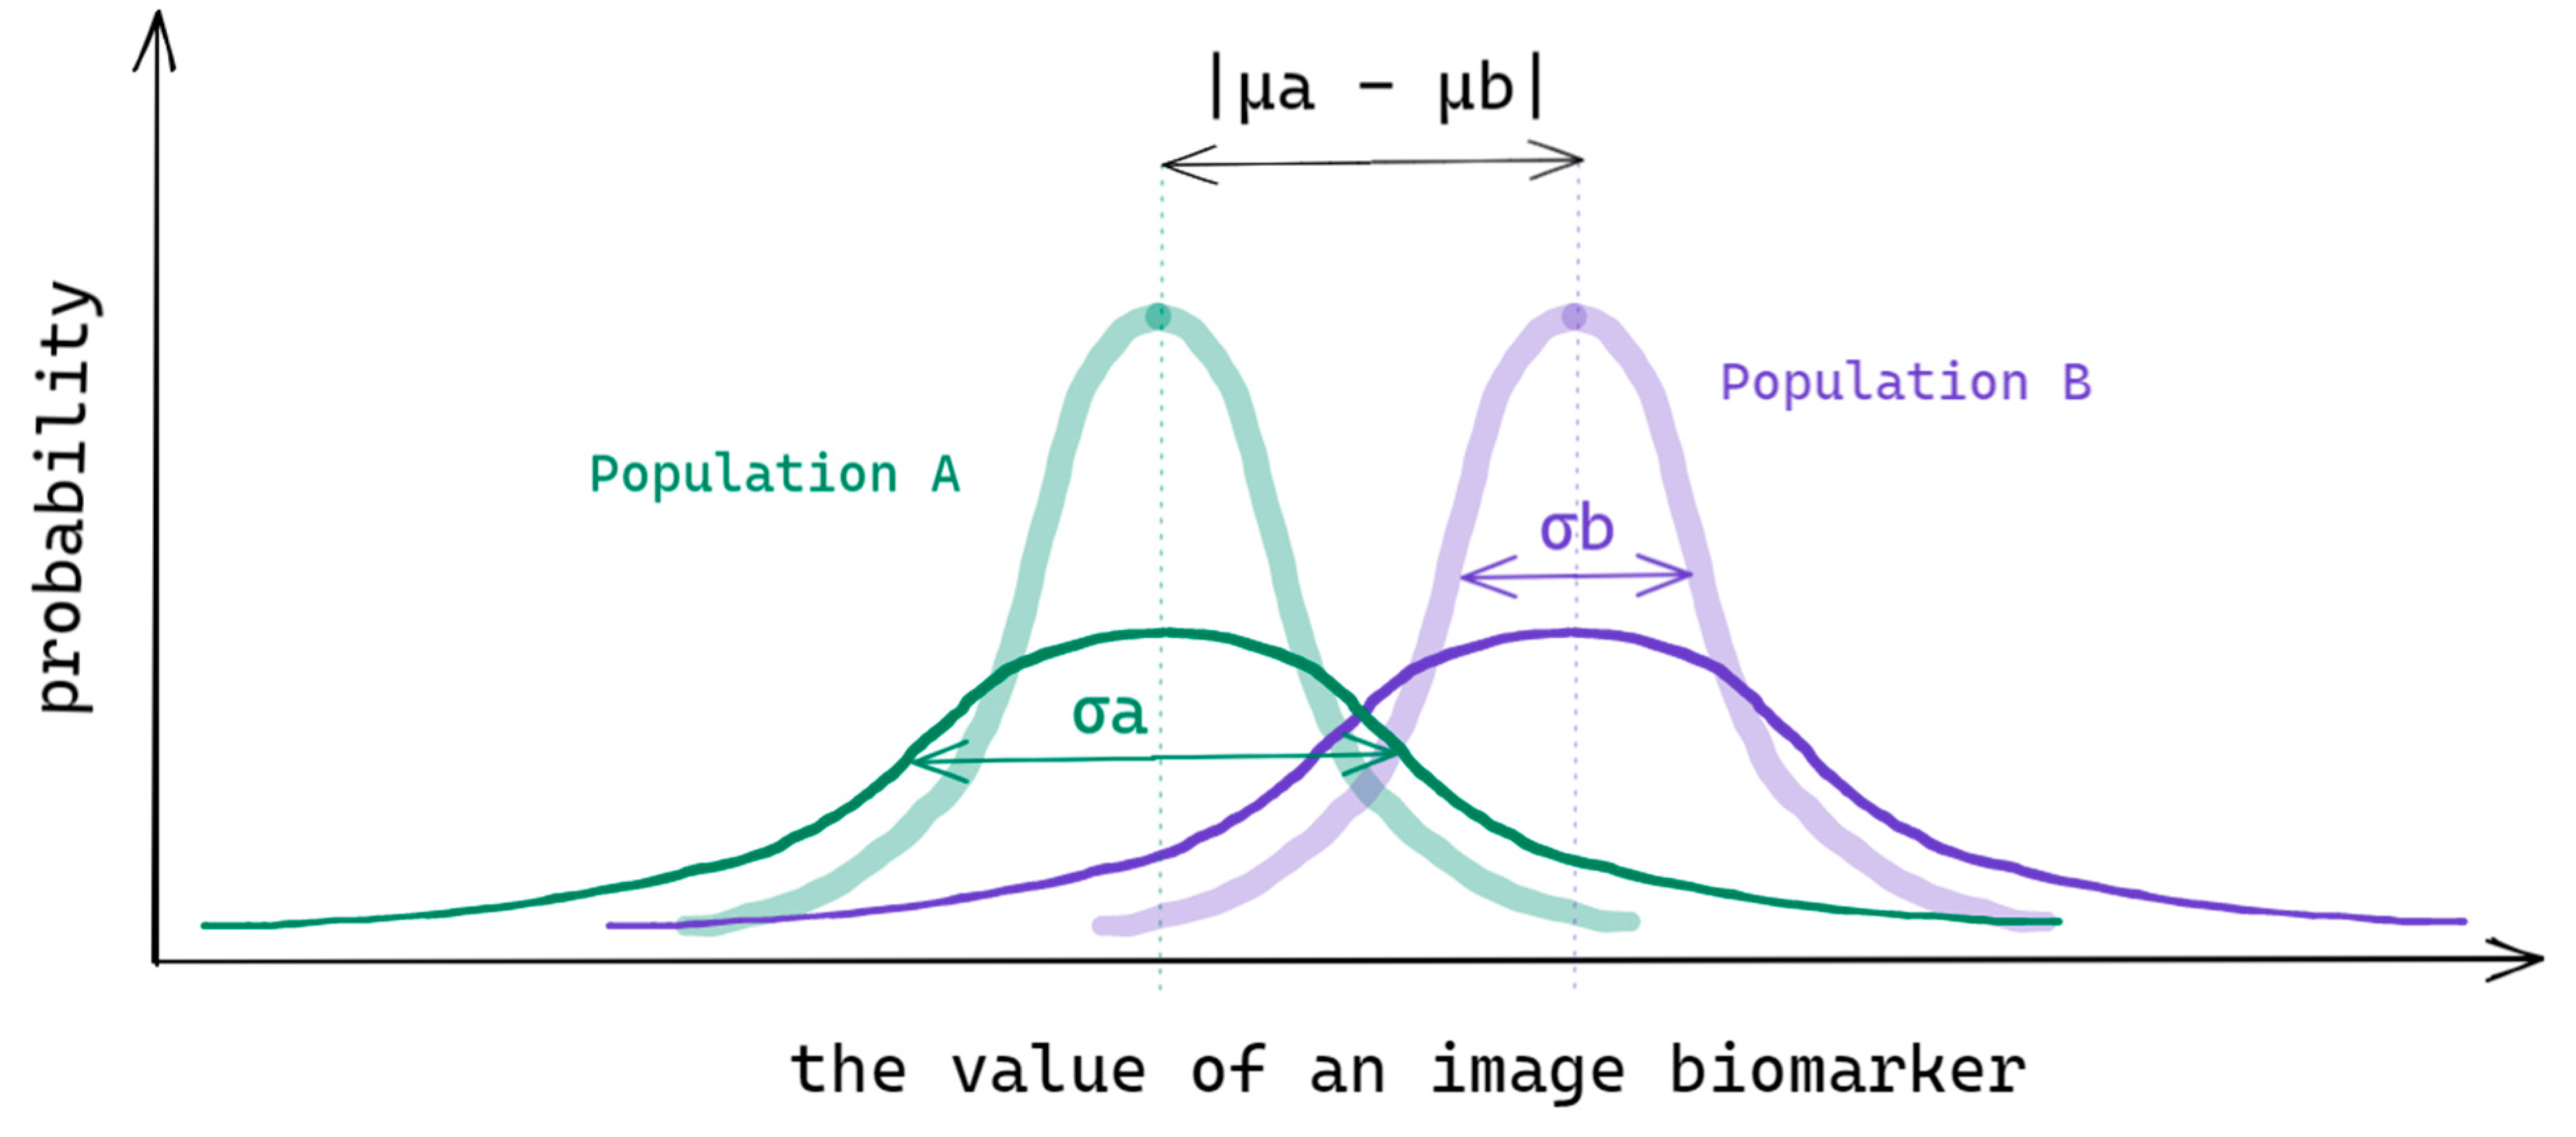
2.2. Estimation of Segmentation Uncertainty and the Effect Size of the Radiomic Features
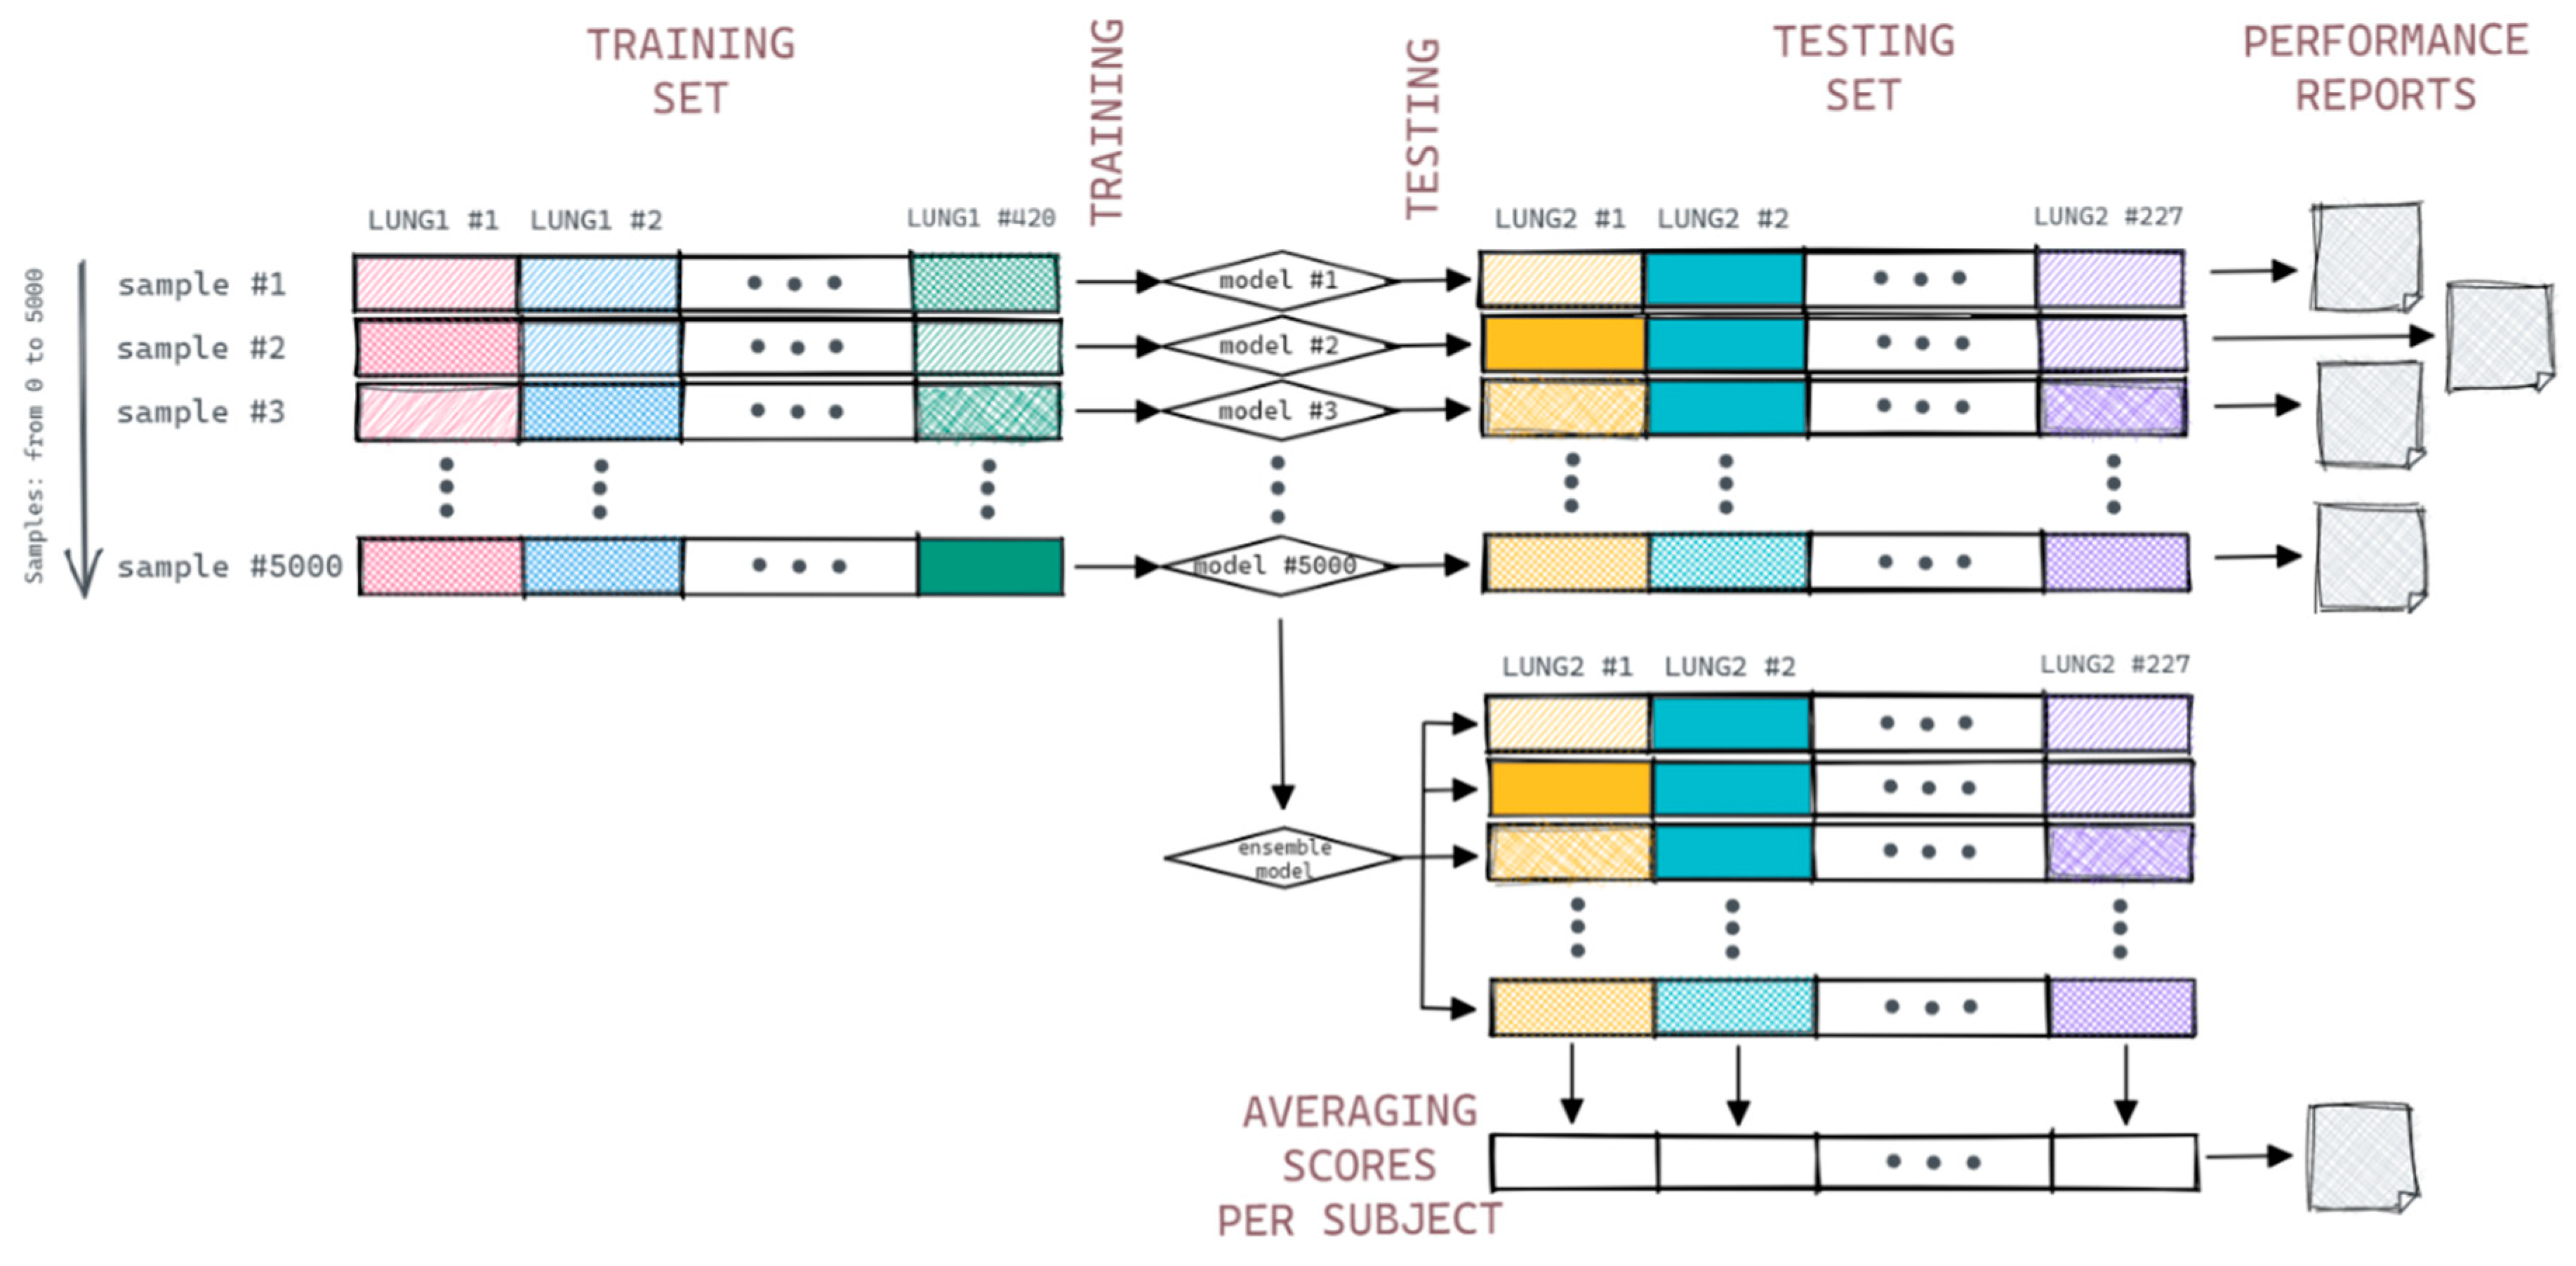
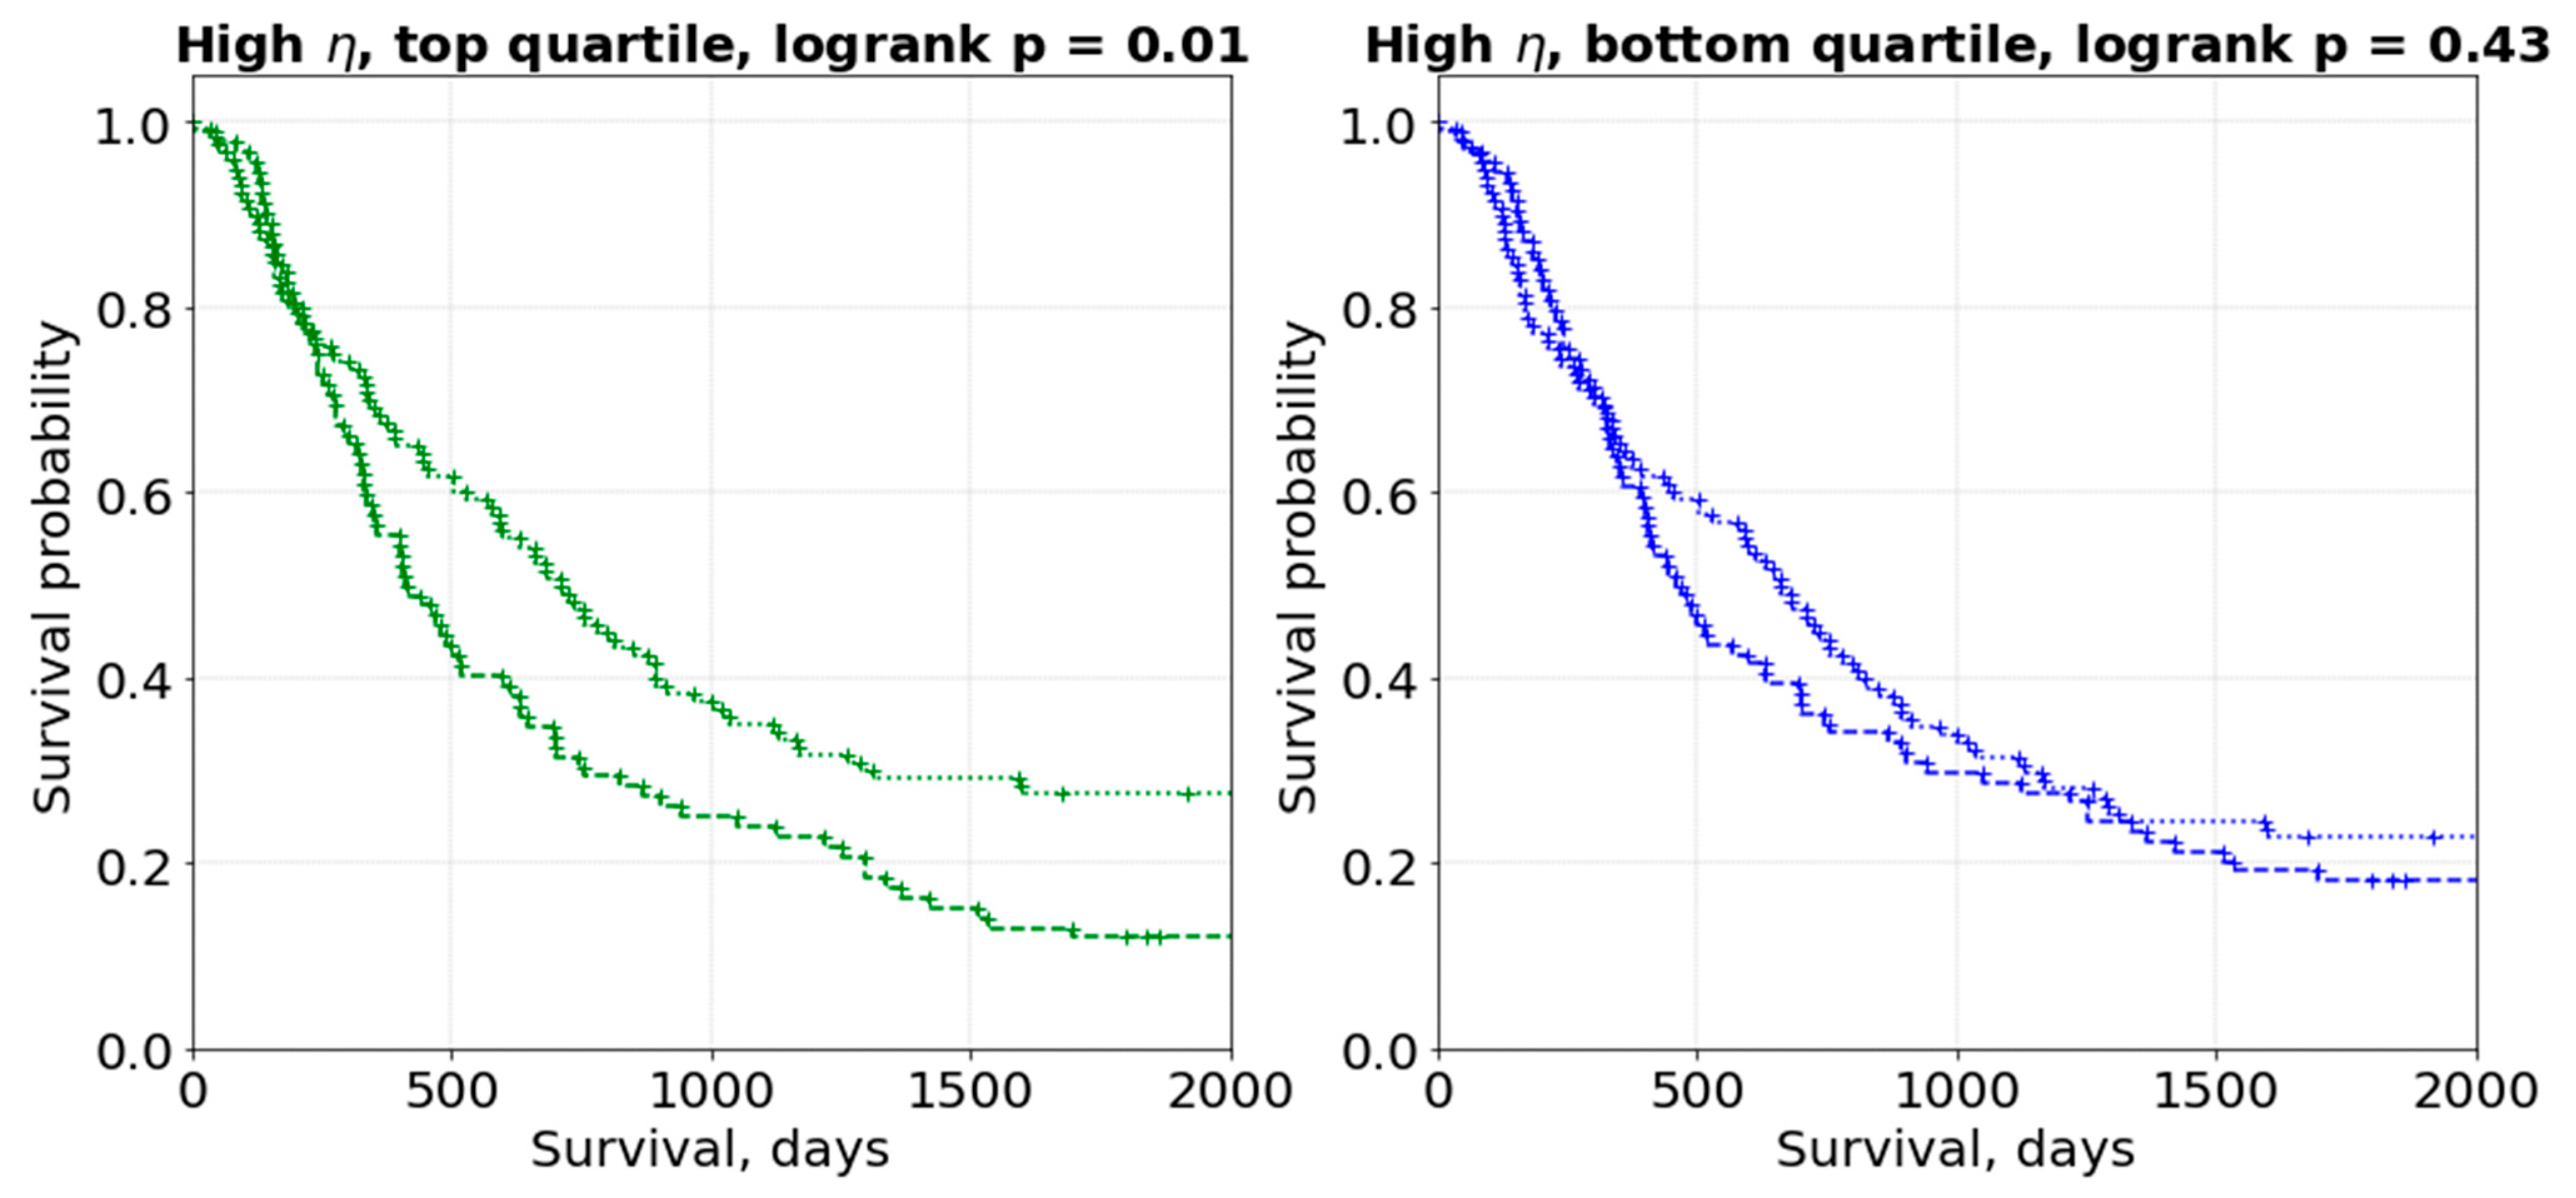
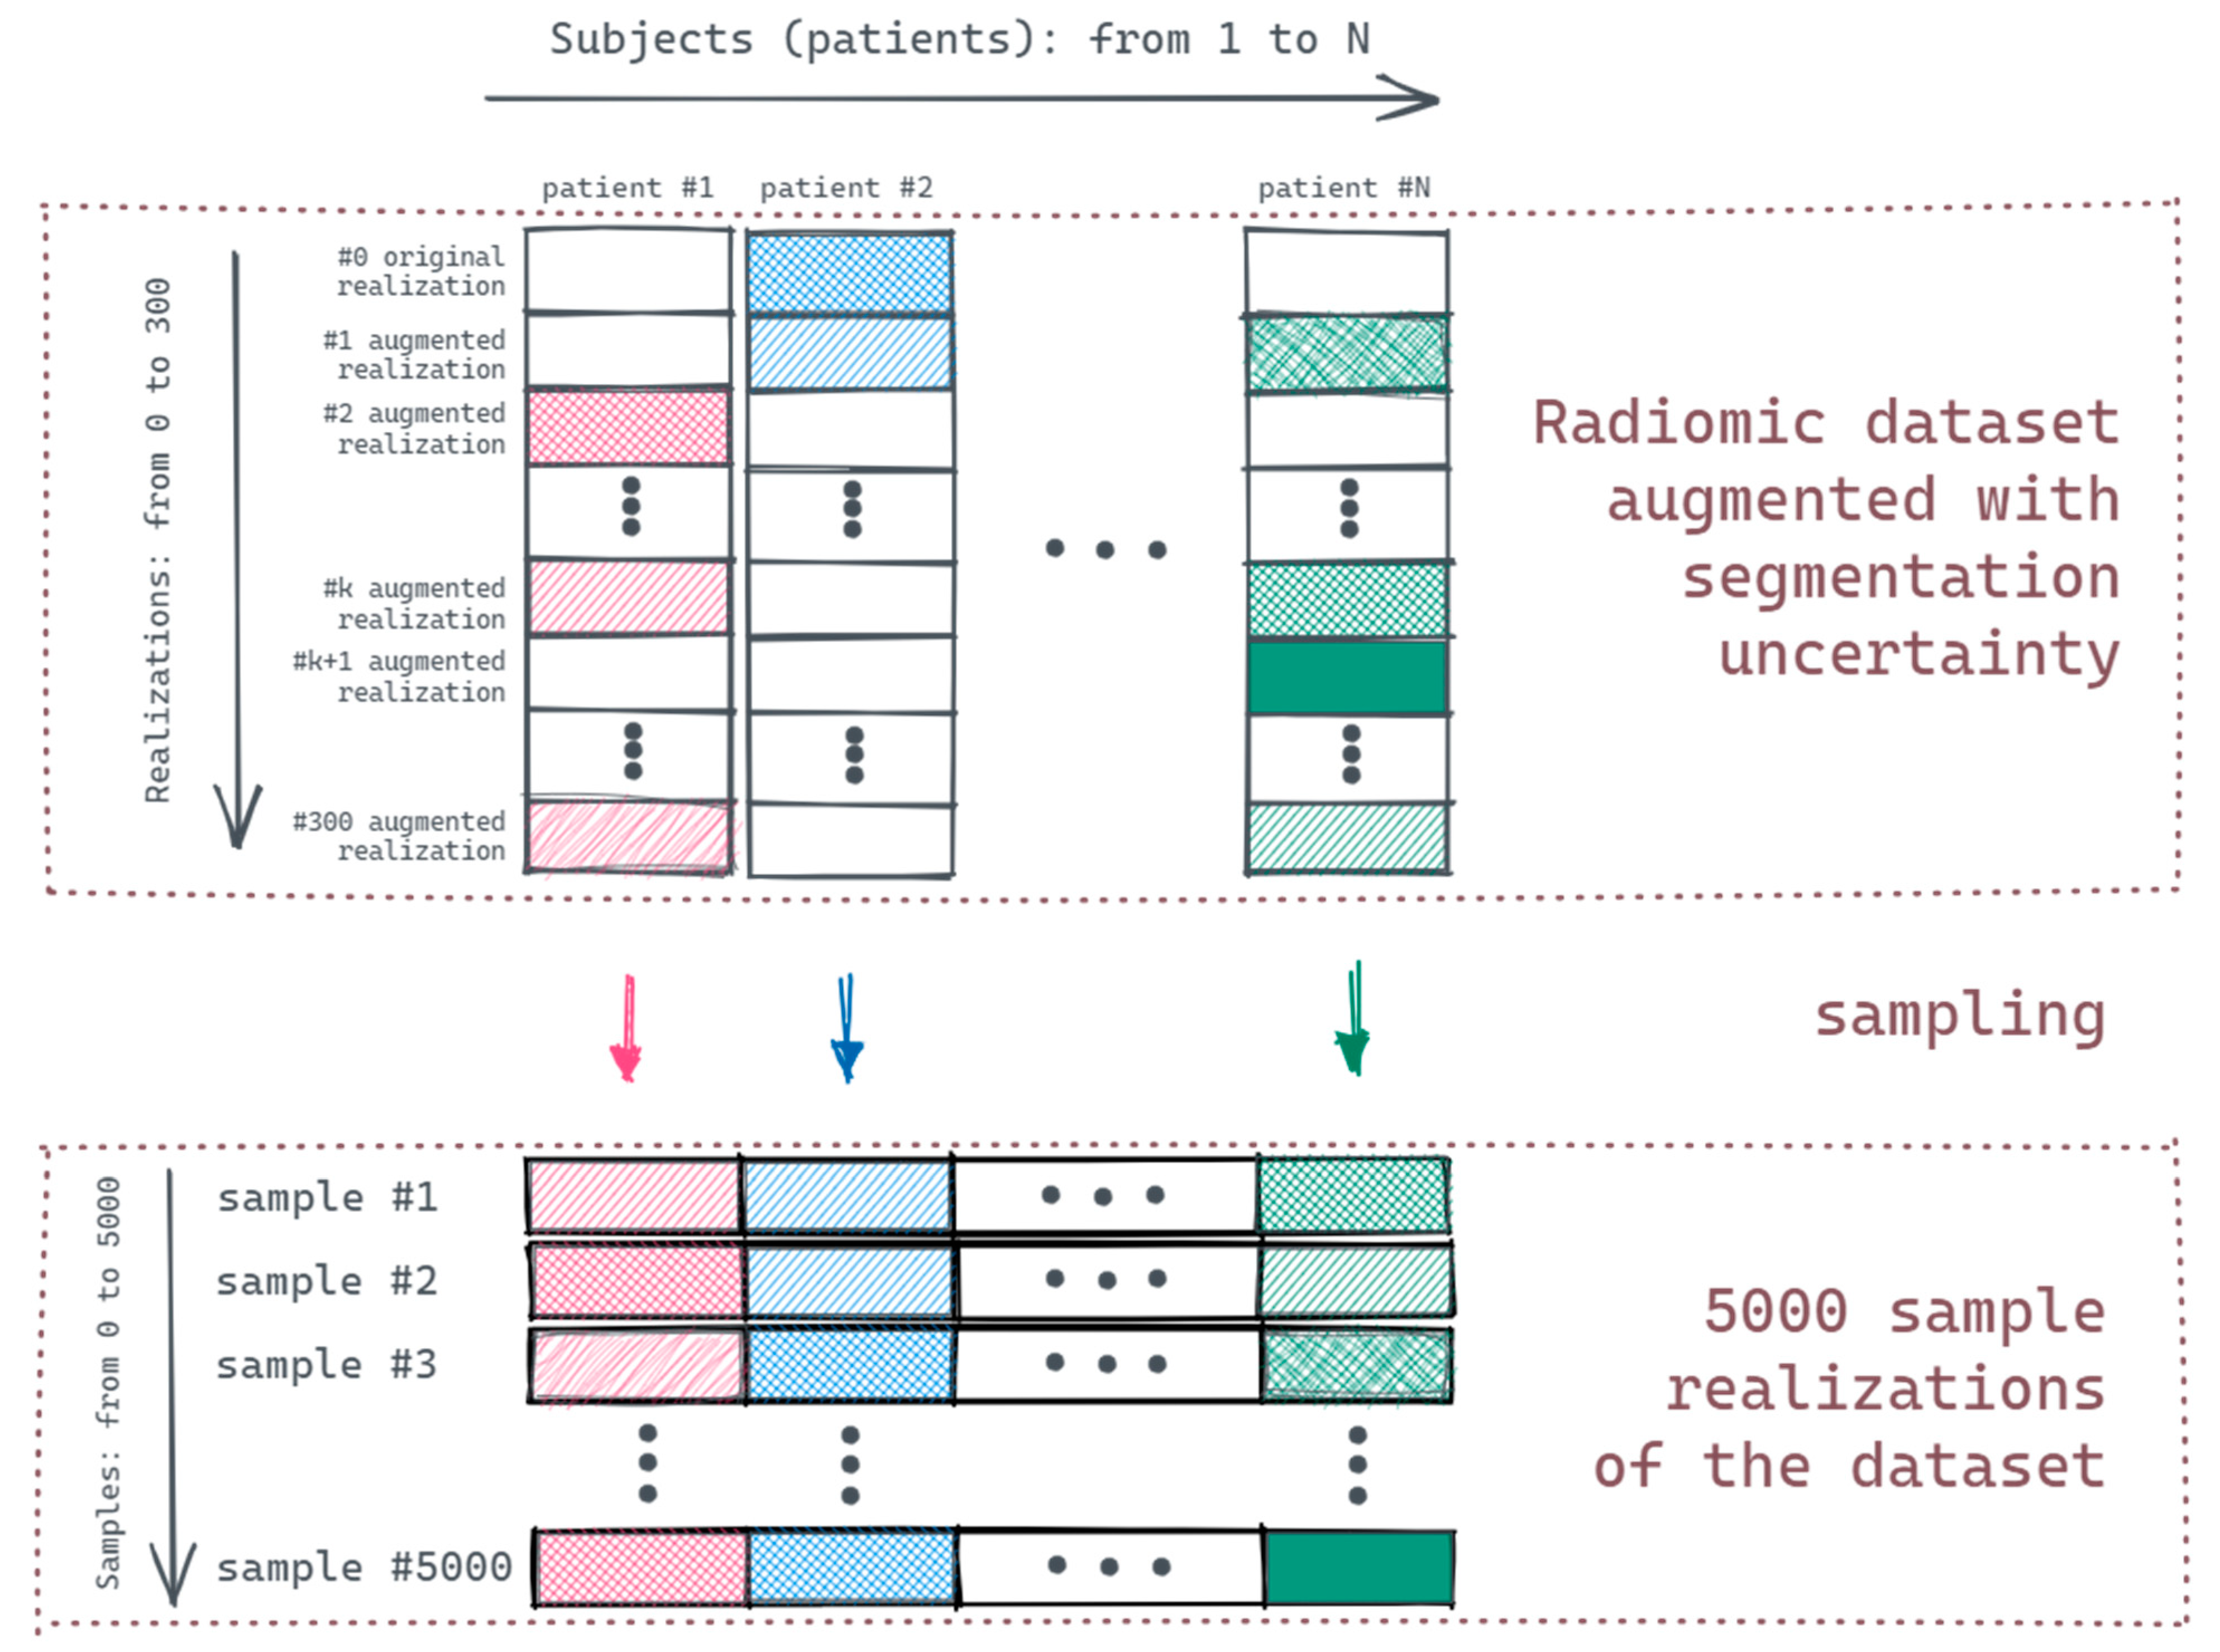
2.3. Prognostic Model Simulation
- #MajC—number of samples of the majority class for a subject;
- #MinC—number of samples of the minority class for a subject.
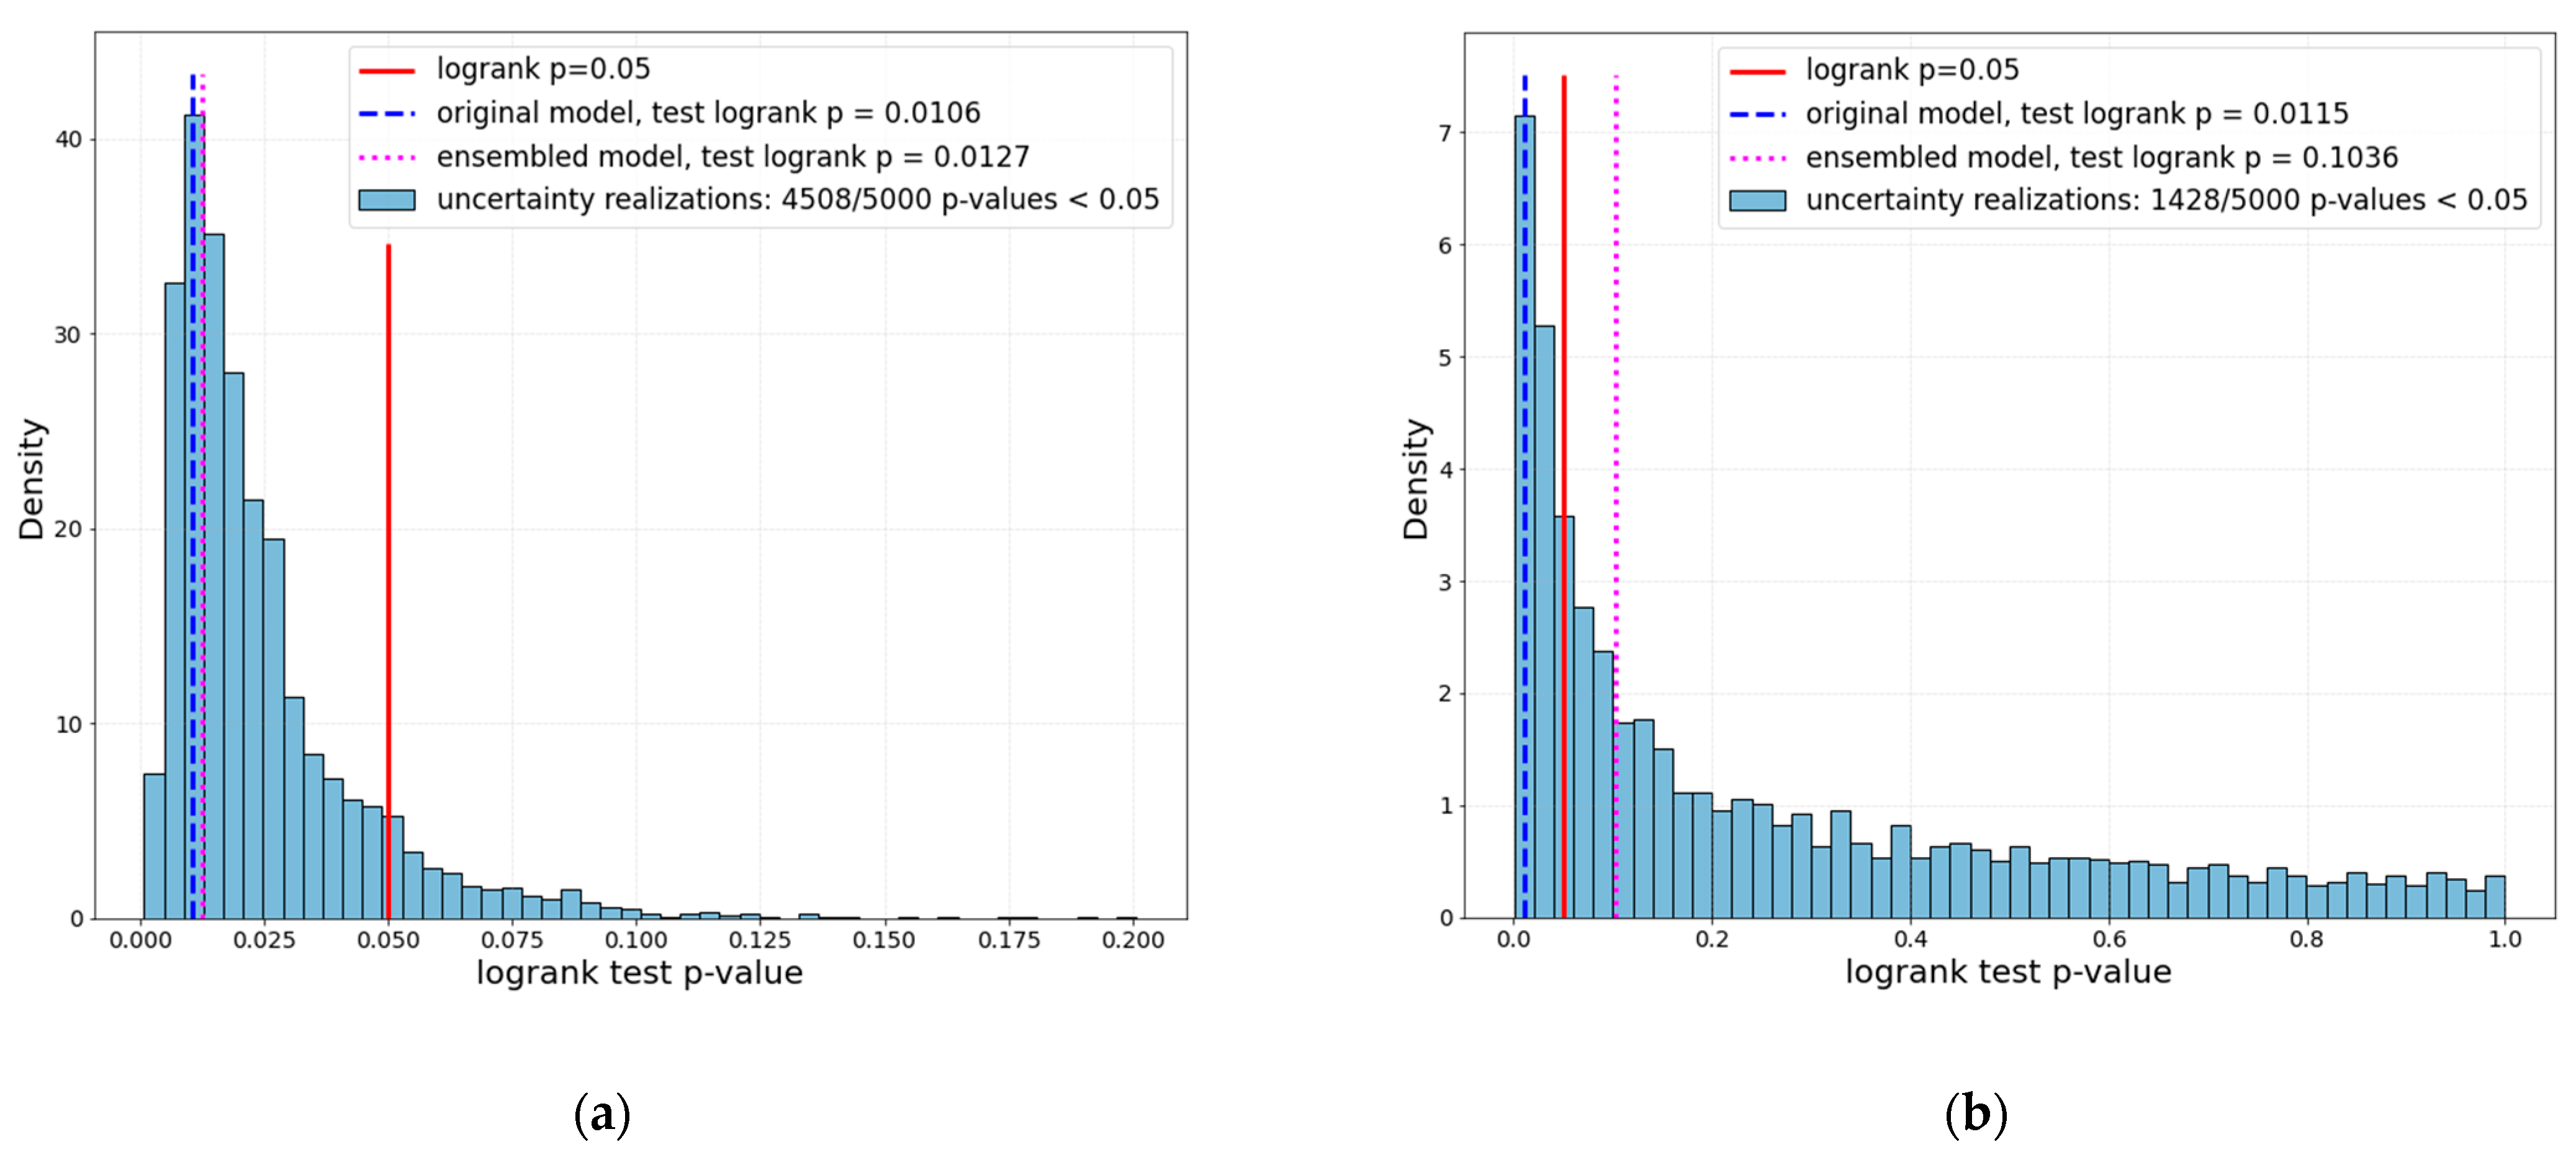
3. Results
4. Discussion
4.1. General Discussion
4.2. Limitations and Future Perspective
5. Conclusions
Supplementary Materials
Author Contributions
Funding
Institutional Review Board Statement
Informed Consent Statement
Data Availability Statement
Acknowledgments
Conflicts of Interest
References
- Zhovannik, I.; Pai, S.; Santos, T.A.d.S.; van Driel, L.L.; Dekker, A.; Fijten, R.; Traverso, A.; Bussink, J.; Monshouwer, R. Radiomics integration into a picture archiving and communication system. Phys. Imaging Radiat. Oncol. 2021, 20, 30–33. [Google Scholar] [CrossRef] [PubMed]
- Van Griethuysen, J.J.M.; Fedorov, A.; Parmar, C.; Hosny, A.; Aucoin, N.; Narayan, V.; Beets-Tan, R.G.H.; Fillion-Robin, J.-C.; Pieper, S.; Aerts, H.J.W.L. Computational Radiomics System to Decode the Radiographic Phenotype. Cancer Res. 2017, 77, e104–e107. [Google Scholar] [CrossRef] [PubMed] [Green Version]
- Hosny, A.; Aerts, H.J.; Mak, R.H. Handcrafted versus deep learning radiomics for prediction of cancer therapy response. Lancet Digit. Health 2019, 1, e106–e107. [Google Scholar] [CrossRef] [Green Version]
- Mali, S.A.; Ibrahim, A.; Woodruff, H.C.; Andrearczyk, V.; Müller, H.; Primakov, S.; Salahuddin, Z.; Chatterjee, A.; Lambin, P. Making Radiomics More Reproducible across Scanner and Imaging Protocol Variations: A Review of Harmonization Methods. J. Pers. Med. 2021, 11, 842. [Google Scholar] [CrossRef] [PubMed]
- Pfaehler, E.; Zhovannik, I.; Wei, L.; Boellaard, R.; Dekker, A.; Monshouwer, R.; El Naqa, I.; Bussink, J.; Gillies, R.; Wee, L.; et al. A systematic review and quality of reporting checklist for repeatability and reproducibility of radiomic features. Phys. Imaging Radiat. Oncol. 2021, 20, 69–75. [Google Scholar] [CrossRef] [PubMed]
- Velazquez, E.R.; Parmar, C.; Jermoumi, M.; Mak, R.H.; van Baardwijk, A.; Fennessy, F.M.; Lewis, J.H.; De Ruysscher, D.; Kikinis, R.; Lambin, P.; et al. Volumetric CT-based segmentation of NSCLC using 3D-Slicer. Sci Rep. 2013, 3, 3529. [Google Scholar] [CrossRef] [PubMed] [Green Version]
- Zhovannik, I.; Bussink, J.; Traverso, A.; Shi, Z.; Kalendralis, P.; Wee, L.; Dekker, A.; Fijten, R.; Monshouwer, R. Learning from scanners: Bias reduction and feature correction in radiomics. Clin. Transl. Radiat. Oncol. 2019, 19, 33–38. [Google Scholar] [CrossRef] [PubMed] [Green Version]
- Orlhac, F.; Boughdad, S.; Philippe, C.; Stalla-Bourdillon, H.; Nioche, C.; Champion, L.; Soussan, M.; Frouin, F.; Frouin, V.; Buvat, I. A Postreconstruction Harmonization Method for Multicenter Radiomic Studies in PET. J. Nucl. Med. 2018, 59, 1321–1328. [Google Scholar] [CrossRef] [PubMed]
- Cohen, J. Statistical Power Analysis for the Behavioural Sciences/Jacob Cohen, 2nd ed.; Routledge: New York, NY, USA; Abingdon, UK, 1988. [Google Scholar]
- Aerts, H.J.W.L.; Velazquez, E.R.; Leijenaar, R.T.H.; Parmar, C.; Grossmann, P.; Carvalho, S.; Bussink, J.; Monshouwer, R.; Haibe-Kains, B.; Rietveld, D.; et al. Decoding tumour phenotype by noninvasive imaging using a quantitative radiomics approach. Nat. Commun. 2014, 5, 4006. [Google Scholar] [CrossRef] [PubMed]
- Shi, Z.; Zhovannik, I.; Traverso, A.; Dankers, F.J.W.M.; Deist, T.M.; Kalendralis, P.; Monshouwer, R.; Bussink, J.; Fijten, R.; Aerts, H.J.W.L.; et al. Distributed radiomics as a signature validation study using the Personal Health Train infrastructure. Sci. Data 2019, 6, 1–8. [Google Scholar] [CrossRef] [Green Version]
- Nikolov, S.; Blackwell, S.; Zverovitch, A.; Mendes, R.; Livne, M.; De Fauw, J.; Patel, Y.; Meyer, C.; Askham, H.; Romera-Paredes, B.; et al. Clinically Applicable Segmentation of Head and Neck Anatomy for Radiotherapy: Deep Learning Algorithm Development and Validation Study. J. Med. Internet Res. 2021, 23, e26151. [Google Scholar] [CrossRef] [PubMed]
- Primakov, S.; Ibrahim, A.; van Timmeren, J.; Wu, G.; Keek, S.; Beuque, M.; Granzier, R.; Scrivener, M.; Sanduleanu, S.; Kayan, E.; et al. OC-0557 AI-based NSCLC detection and segmentation: Faster and more prognostic than manual segmentation. Radiother. Oncol. 2021, 161, S441–S443. [Google Scholar] [CrossRef]
- Welch, M.L.; McIntosh, C.; Haibe-Kains, B.; Milosevic, M.; Wee, L.; Dekker, A.; Huang, S.H.; Purdie, T.; O’Sullivan, B.; Aerts, H.J.; et al. Vulnerabilities of radiomic signature development: The need for safeguards. Radiother. Oncol. 2019, 130, 2–9. [Google Scholar] [CrossRef] [Green Version]
- Zwanenburg, A.; Leger, S.; Agolli, L.; Pilz, K.; Troost, E.G.C.; Richter, C.; Löck, S. Assessing robustness of radiomic features by image perturbation. Sci. Rep. 2019, 9, 614. [Google Scholar] [CrossRef] [PubMed] [Green Version]
- Sheombarsing, R.; Moriakov, N.; Sonke, J.-J.; Teuwen, J. Subpixel object segmentation using wavelets and multi resolution analysis. arXiv 2021, arXiv:2110.15233. [Google Scholar]


| Setup A—Low η | Setup B—High η | ||
|---|---|---|---|
| Feature | η | Feature | η |
| first-order Maximum | 0.0 | glszm GrayLevelVariance | 0.2944 |
| gldm GrayLevelNonUniformity | 0.0108 | glrlm RunEntropy | 0.3066 |
| glrlm GrayLevelNonUniformity | 0.0115 | glcm MCC | 0.3216 |
| ngtdm Coarseness | 0.0129 | glszm GrayLevelNonUniformityNormalized | 0.4005 |
Publisher’s Note: MDPI stays neutral with regard to jurisdictional claims in published maps and institutional affiliations. |
© 2022 by the authors. Licensee MDPI, Basel, Switzerland. This article is an open access article distributed under the terms and conditions of the Creative Commons Attribution (CC BY) license (https://creativecommons.org/licenses/by/4.0/).
Share and Cite
Zhovannik, I.; Bontempi, D.; Romita, A.; Pfaehler, E.; Primakov, S.; Dekker, A.; Bussink, J.; Traverso, A.; Monshouwer, R. Segmentation Uncertainty Estimation as a Sanity Check for Image Biomarker Studies. Cancers 2022, 14, 1288. https://doi.org/10.3390/cancers14051288
Zhovannik I, Bontempi D, Romita A, Pfaehler E, Primakov S, Dekker A, Bussink J, Traverso A, Monshouwer R. Segmentation Uncertainty Estimation as a Sanity Check for Image Biomarker Studies. Cancers. 2022; 14(5):1288. https://doi.org/10.3390/cancers14051288
Chicago/Turabian StyleZhovannik, Ivan, Dennis Bontempi, Alessio Romita, Elisabeth Pfaehler, Sergey Primakov, Andre Dekker, Johan Bussink, Alberto Traverso, and René Monshouwer. 2022. "Segmentation Uncertainty Estimation as a Sanity Check for Image Biomarker Studies" Cancers 14, no. 5: 1288. https://doi.org/10.3390/cancers14051288
APA StyleZhovannik, I., Bontempi, D., Romita, A., Pfaehler, E., Primakov, S., Dekker, A., Bussink, J., Traverso, A., & Monshouwer, R. (2022). Segmentation Uncertainty Estimation as a Sanity Check for Image Biomarker Studies. Cancers, 14(5), 1288. https://doi.org/10.3390/cancers14051288