
EOB-MR Based Radiomics Analysis to Assess Clinical Outcomes following Liver Resection in Colorectal Liver Metastases

 , , ,
, , ,  , and
, and
Abstract
:Simple Summary
Abstract
1. Introduction
2. Materials and Methods
2.1. Dataset Characteristics
2.2. MR Imaging Protocol
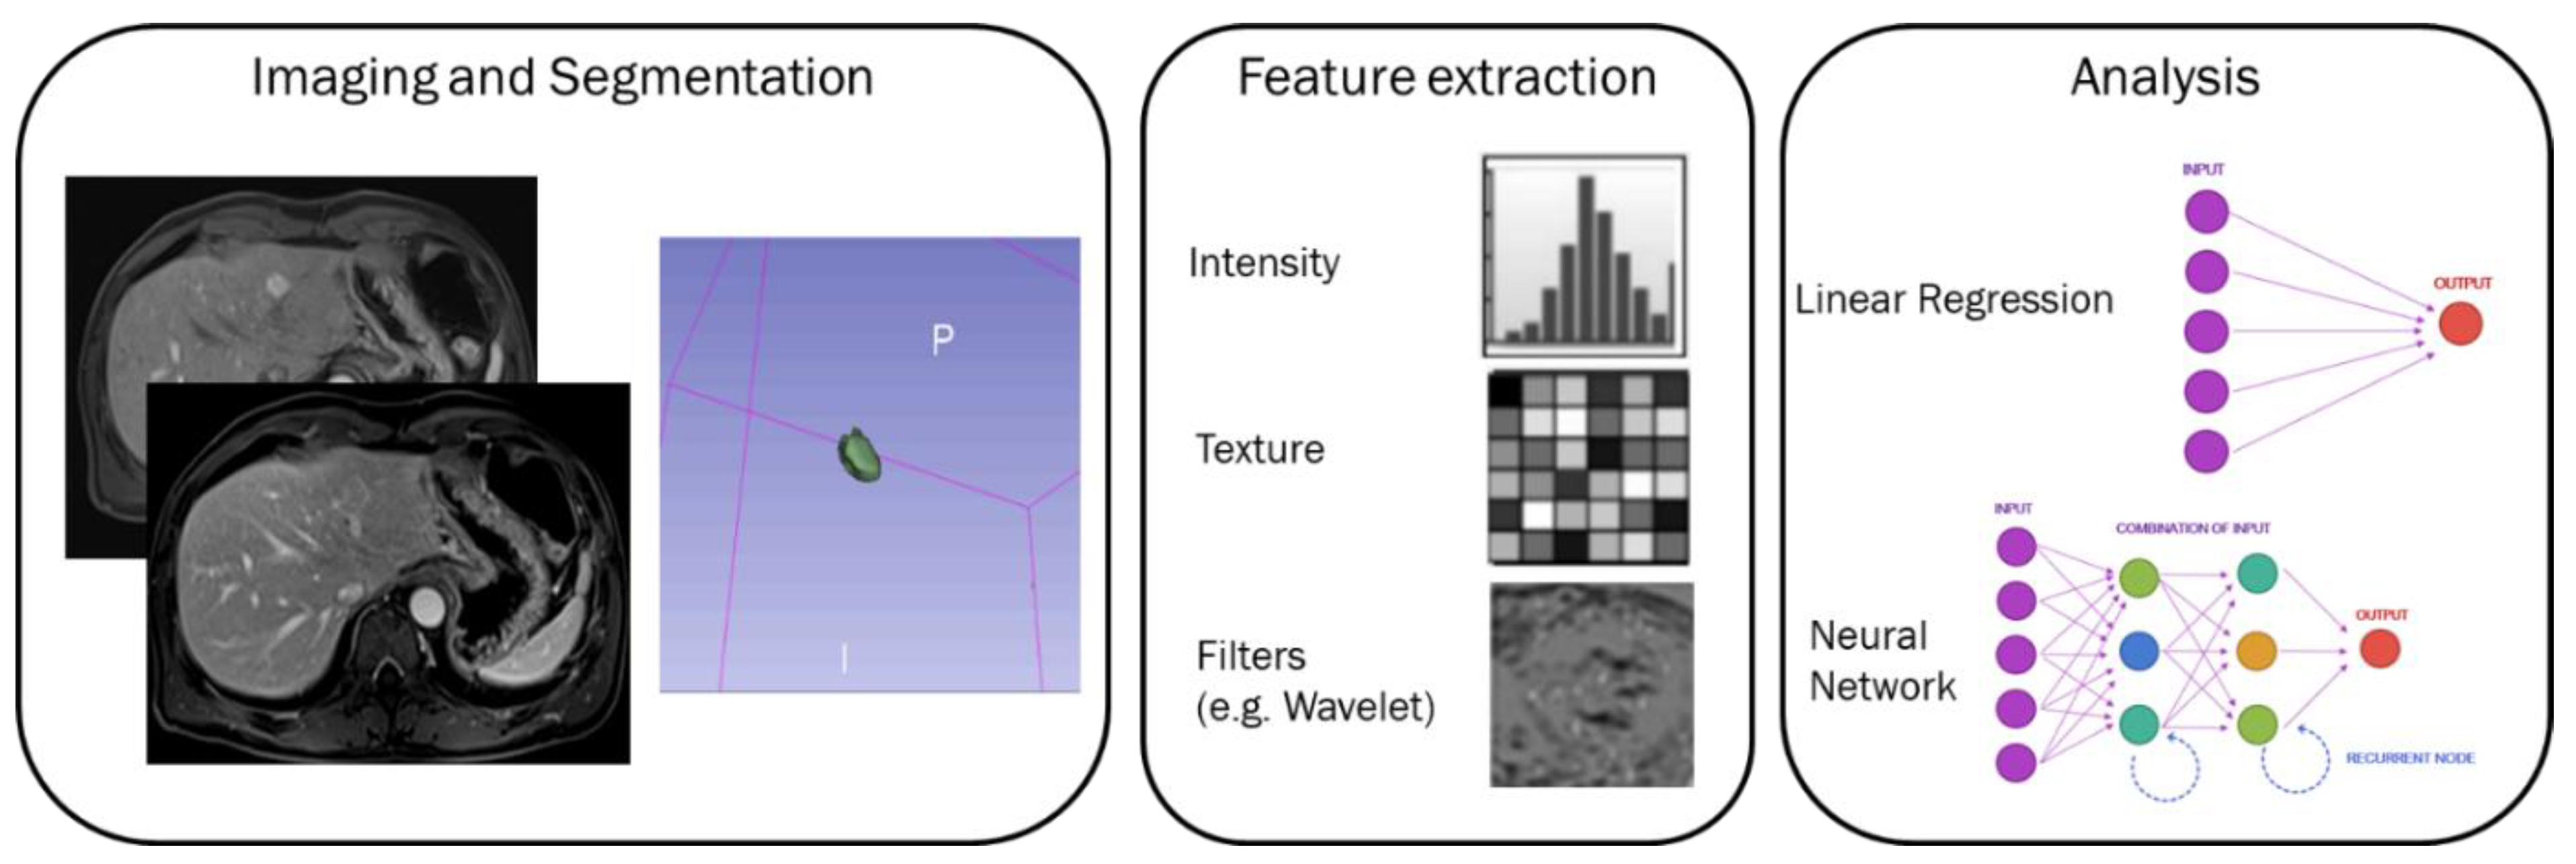
2.3. Image Processing
2.4. MRI Post-Processing with Pyradiomics Tool
- First Order (FIRST ORDER): describes the individual values of voxels obtained as a result of ROI cropping. These are generally histogram-based properties (energy, entropy, kurtosis, skewness);
- Shape based features both 2D and 3D measures;
- Gray Level Co-occurrence Matrix (GLCM): calculates how often the same and similar pixel values come together in an image and records statistical measurements according to this matrix. These resulting values numerically characterize the texture of the image;
- Gray Level Run Length Matrix (GLRLM): Defined as the number of homogeneous consecutive pixels with the same gray tone and quantifies the gray-level studies;
- Gray Level Size Zone Matrix (GLSZM): Properties based on this matrix assign voxel counts according to the logic of measuring gray-level regions in an image;
- Neighboring Gray Tone Difference Matrix (NGTDM): Digitization of textures obtained from filtered images and their fractal properties;
- Gray Level Dependence Matrix (GLDM): Number of bound voxels at x distance from the central voxel;
2.5. Statistical Analysis
2.6. Univariate Analysis
2.7. Multivariate Analysis
3. Results
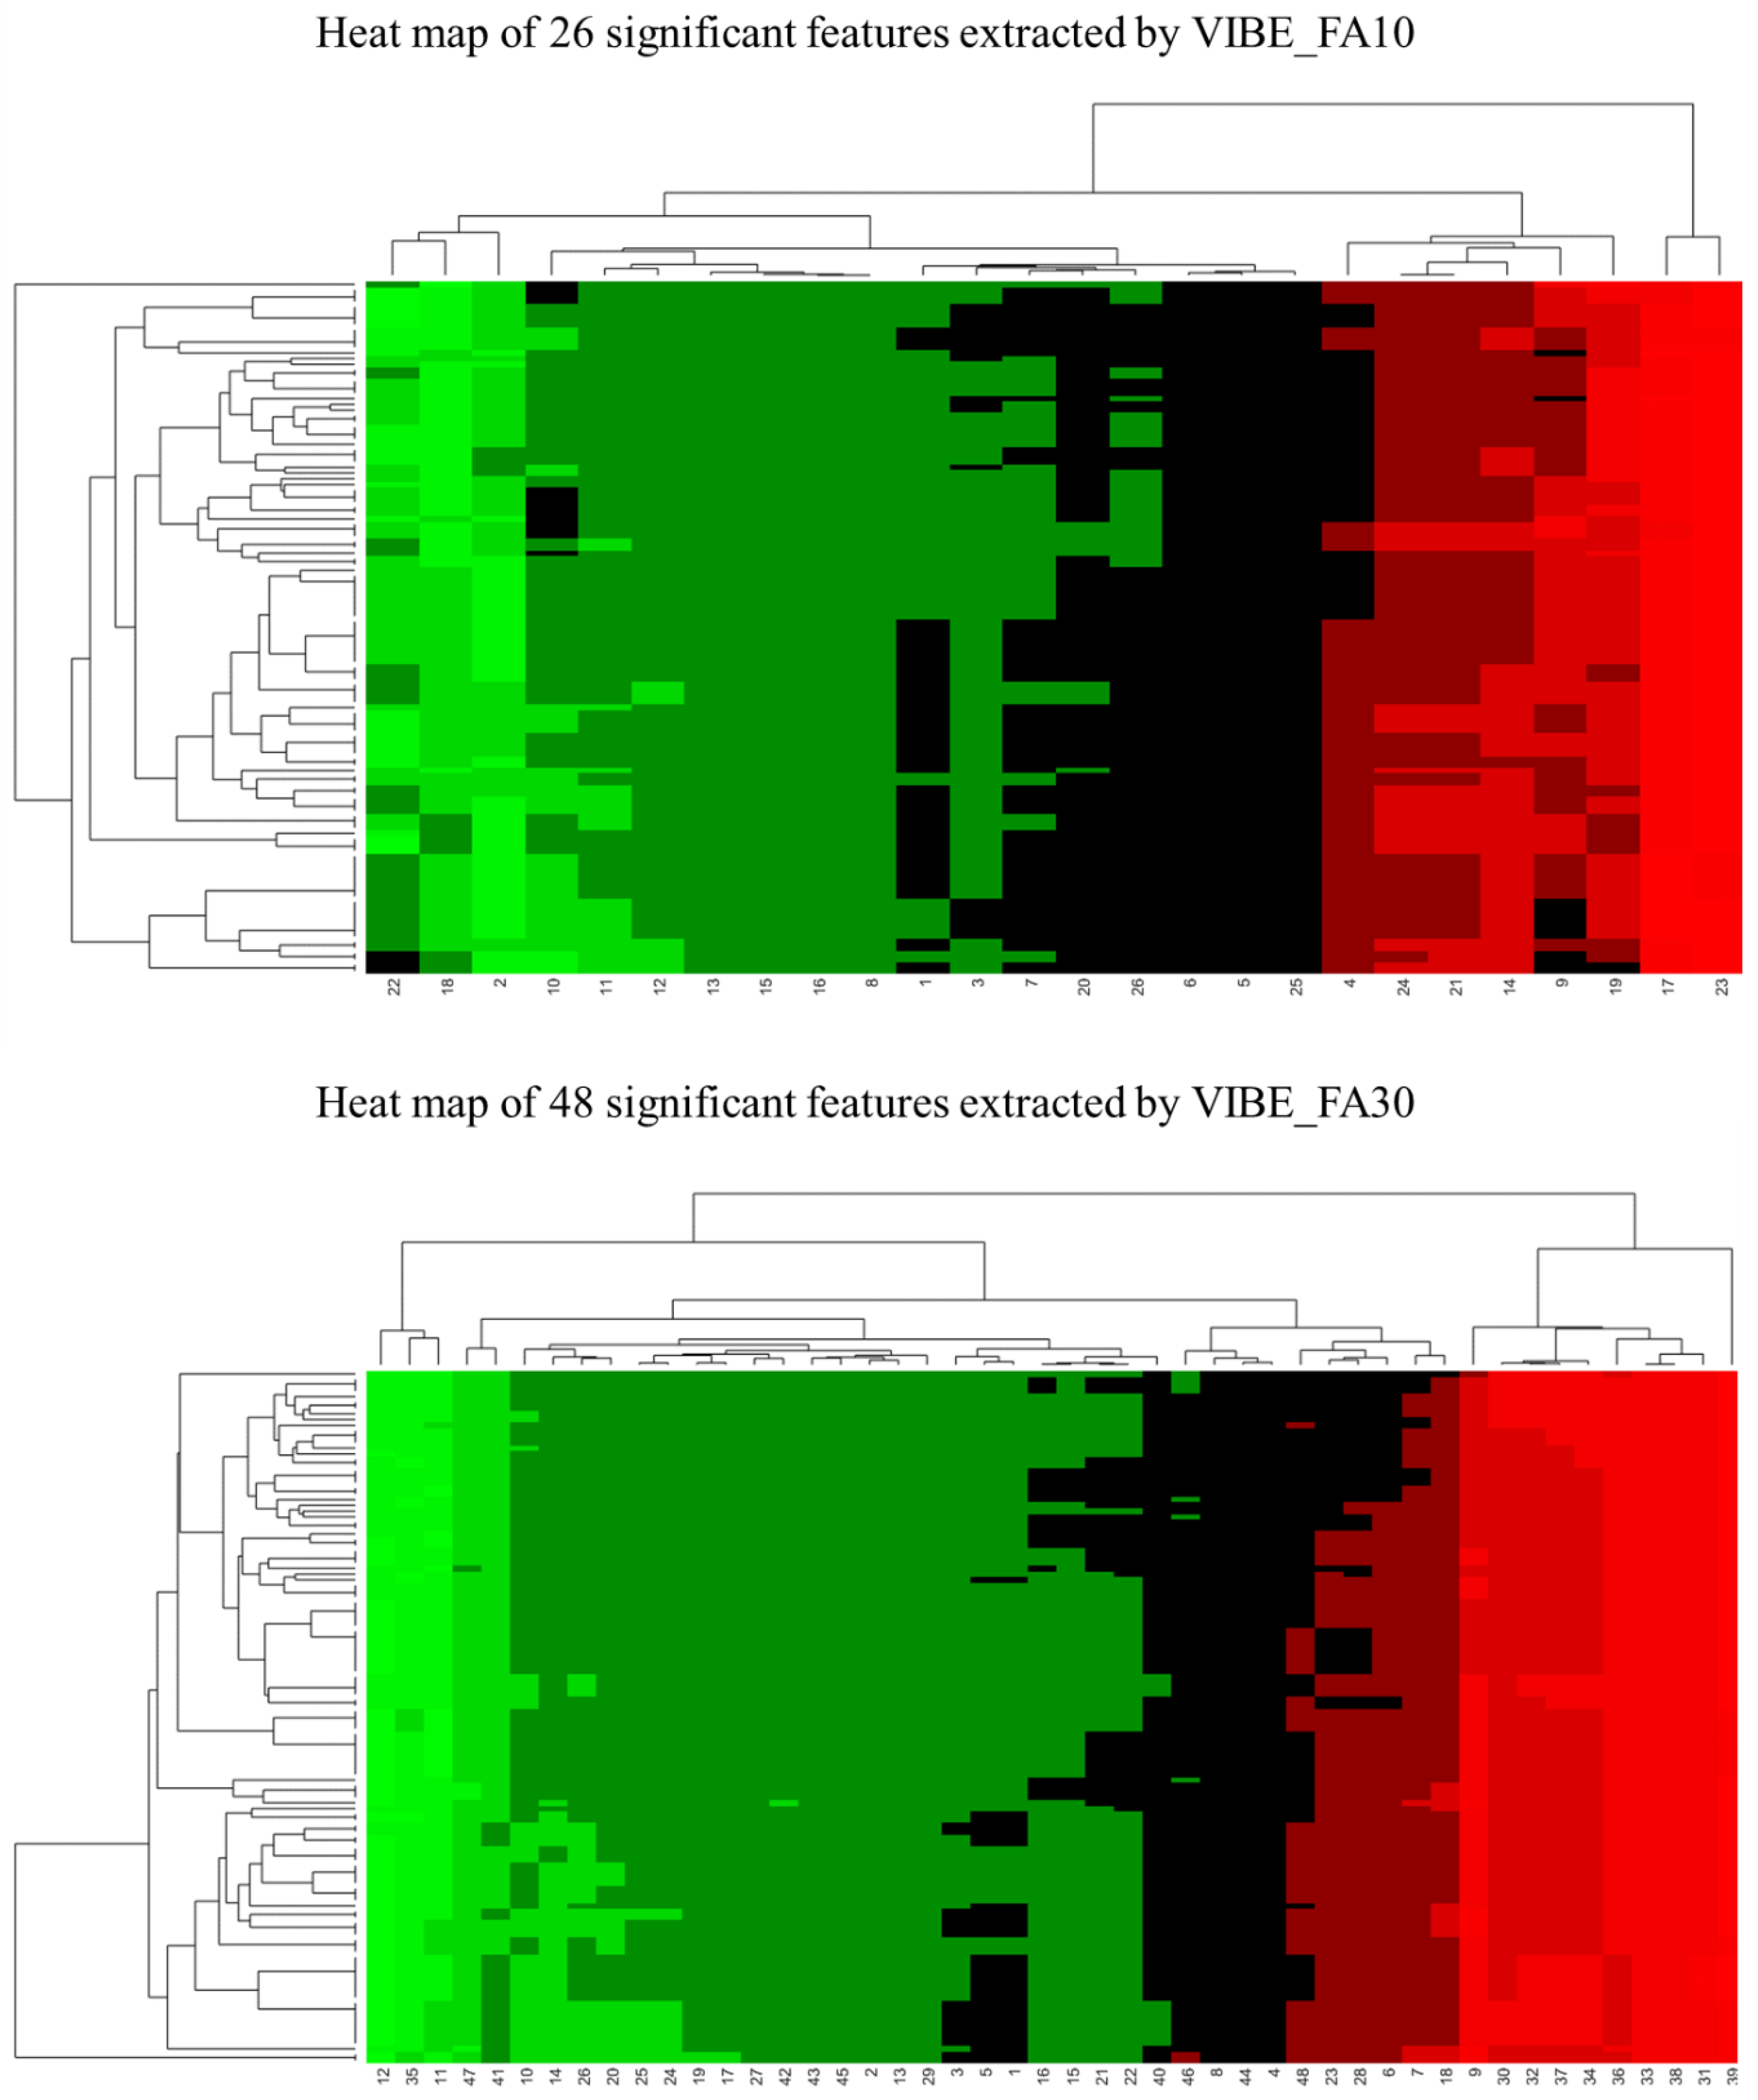
3.1. Univariate Analysis Findings
3.2. Multivariate Analysis Findings
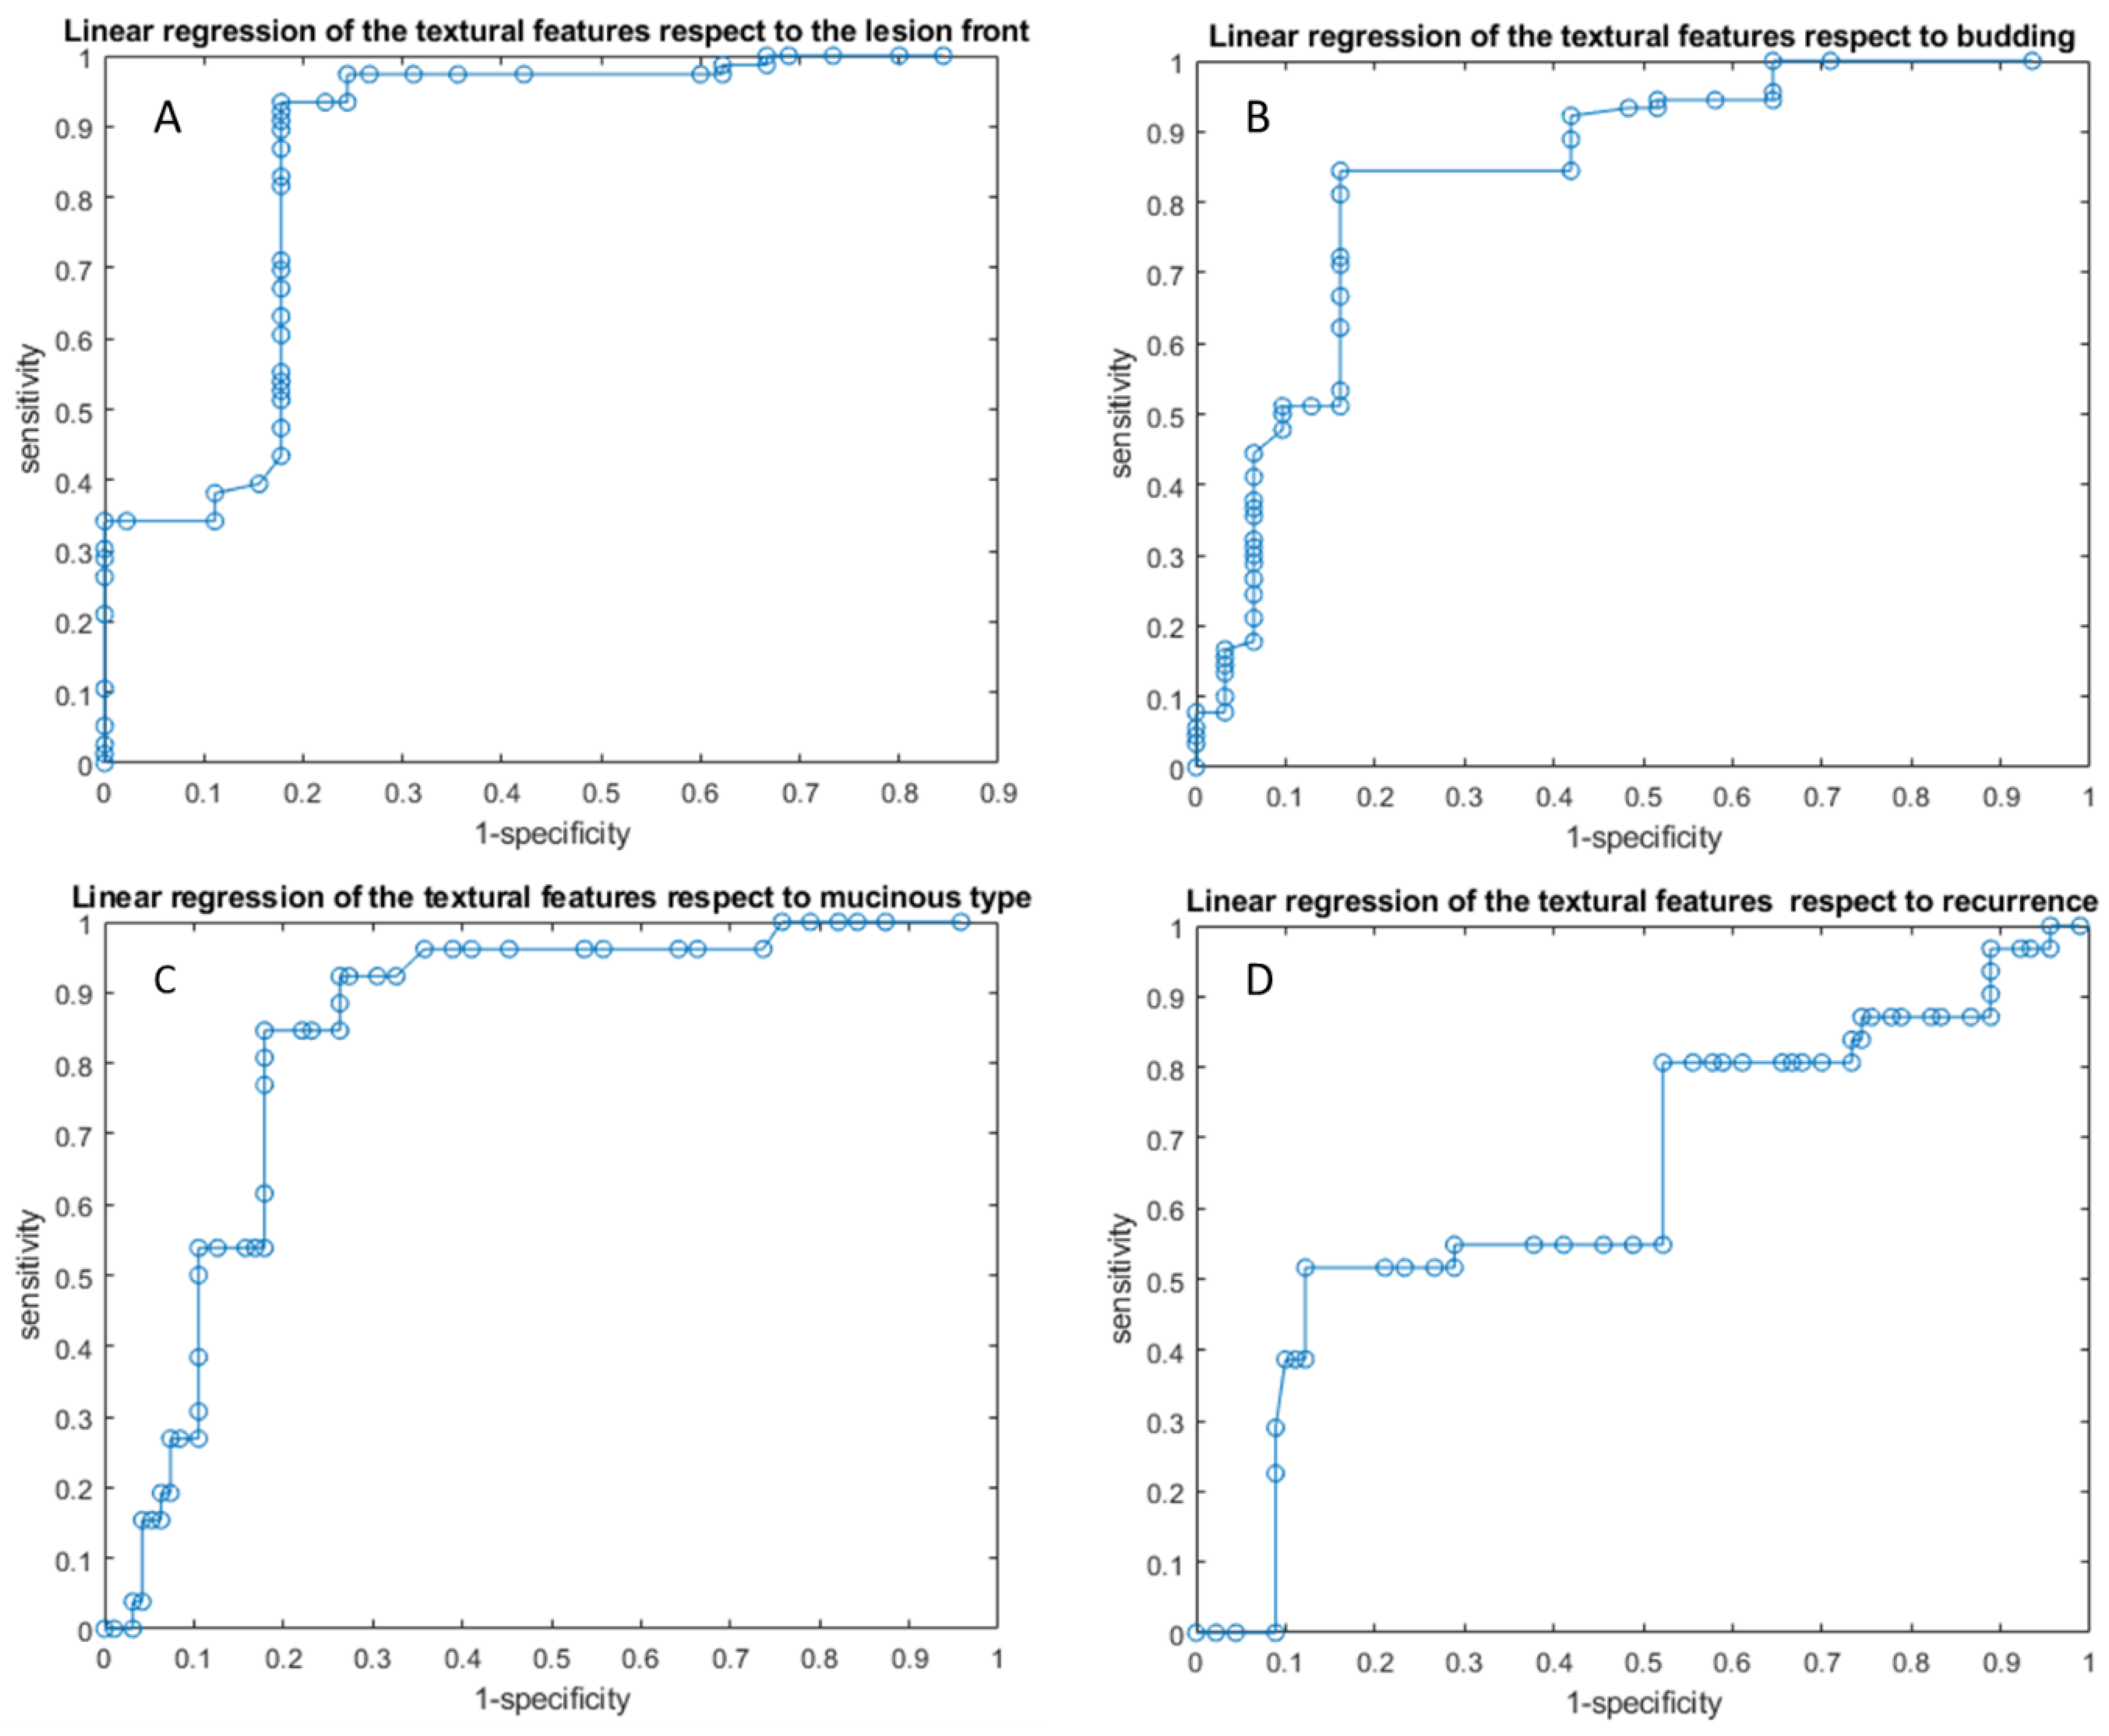
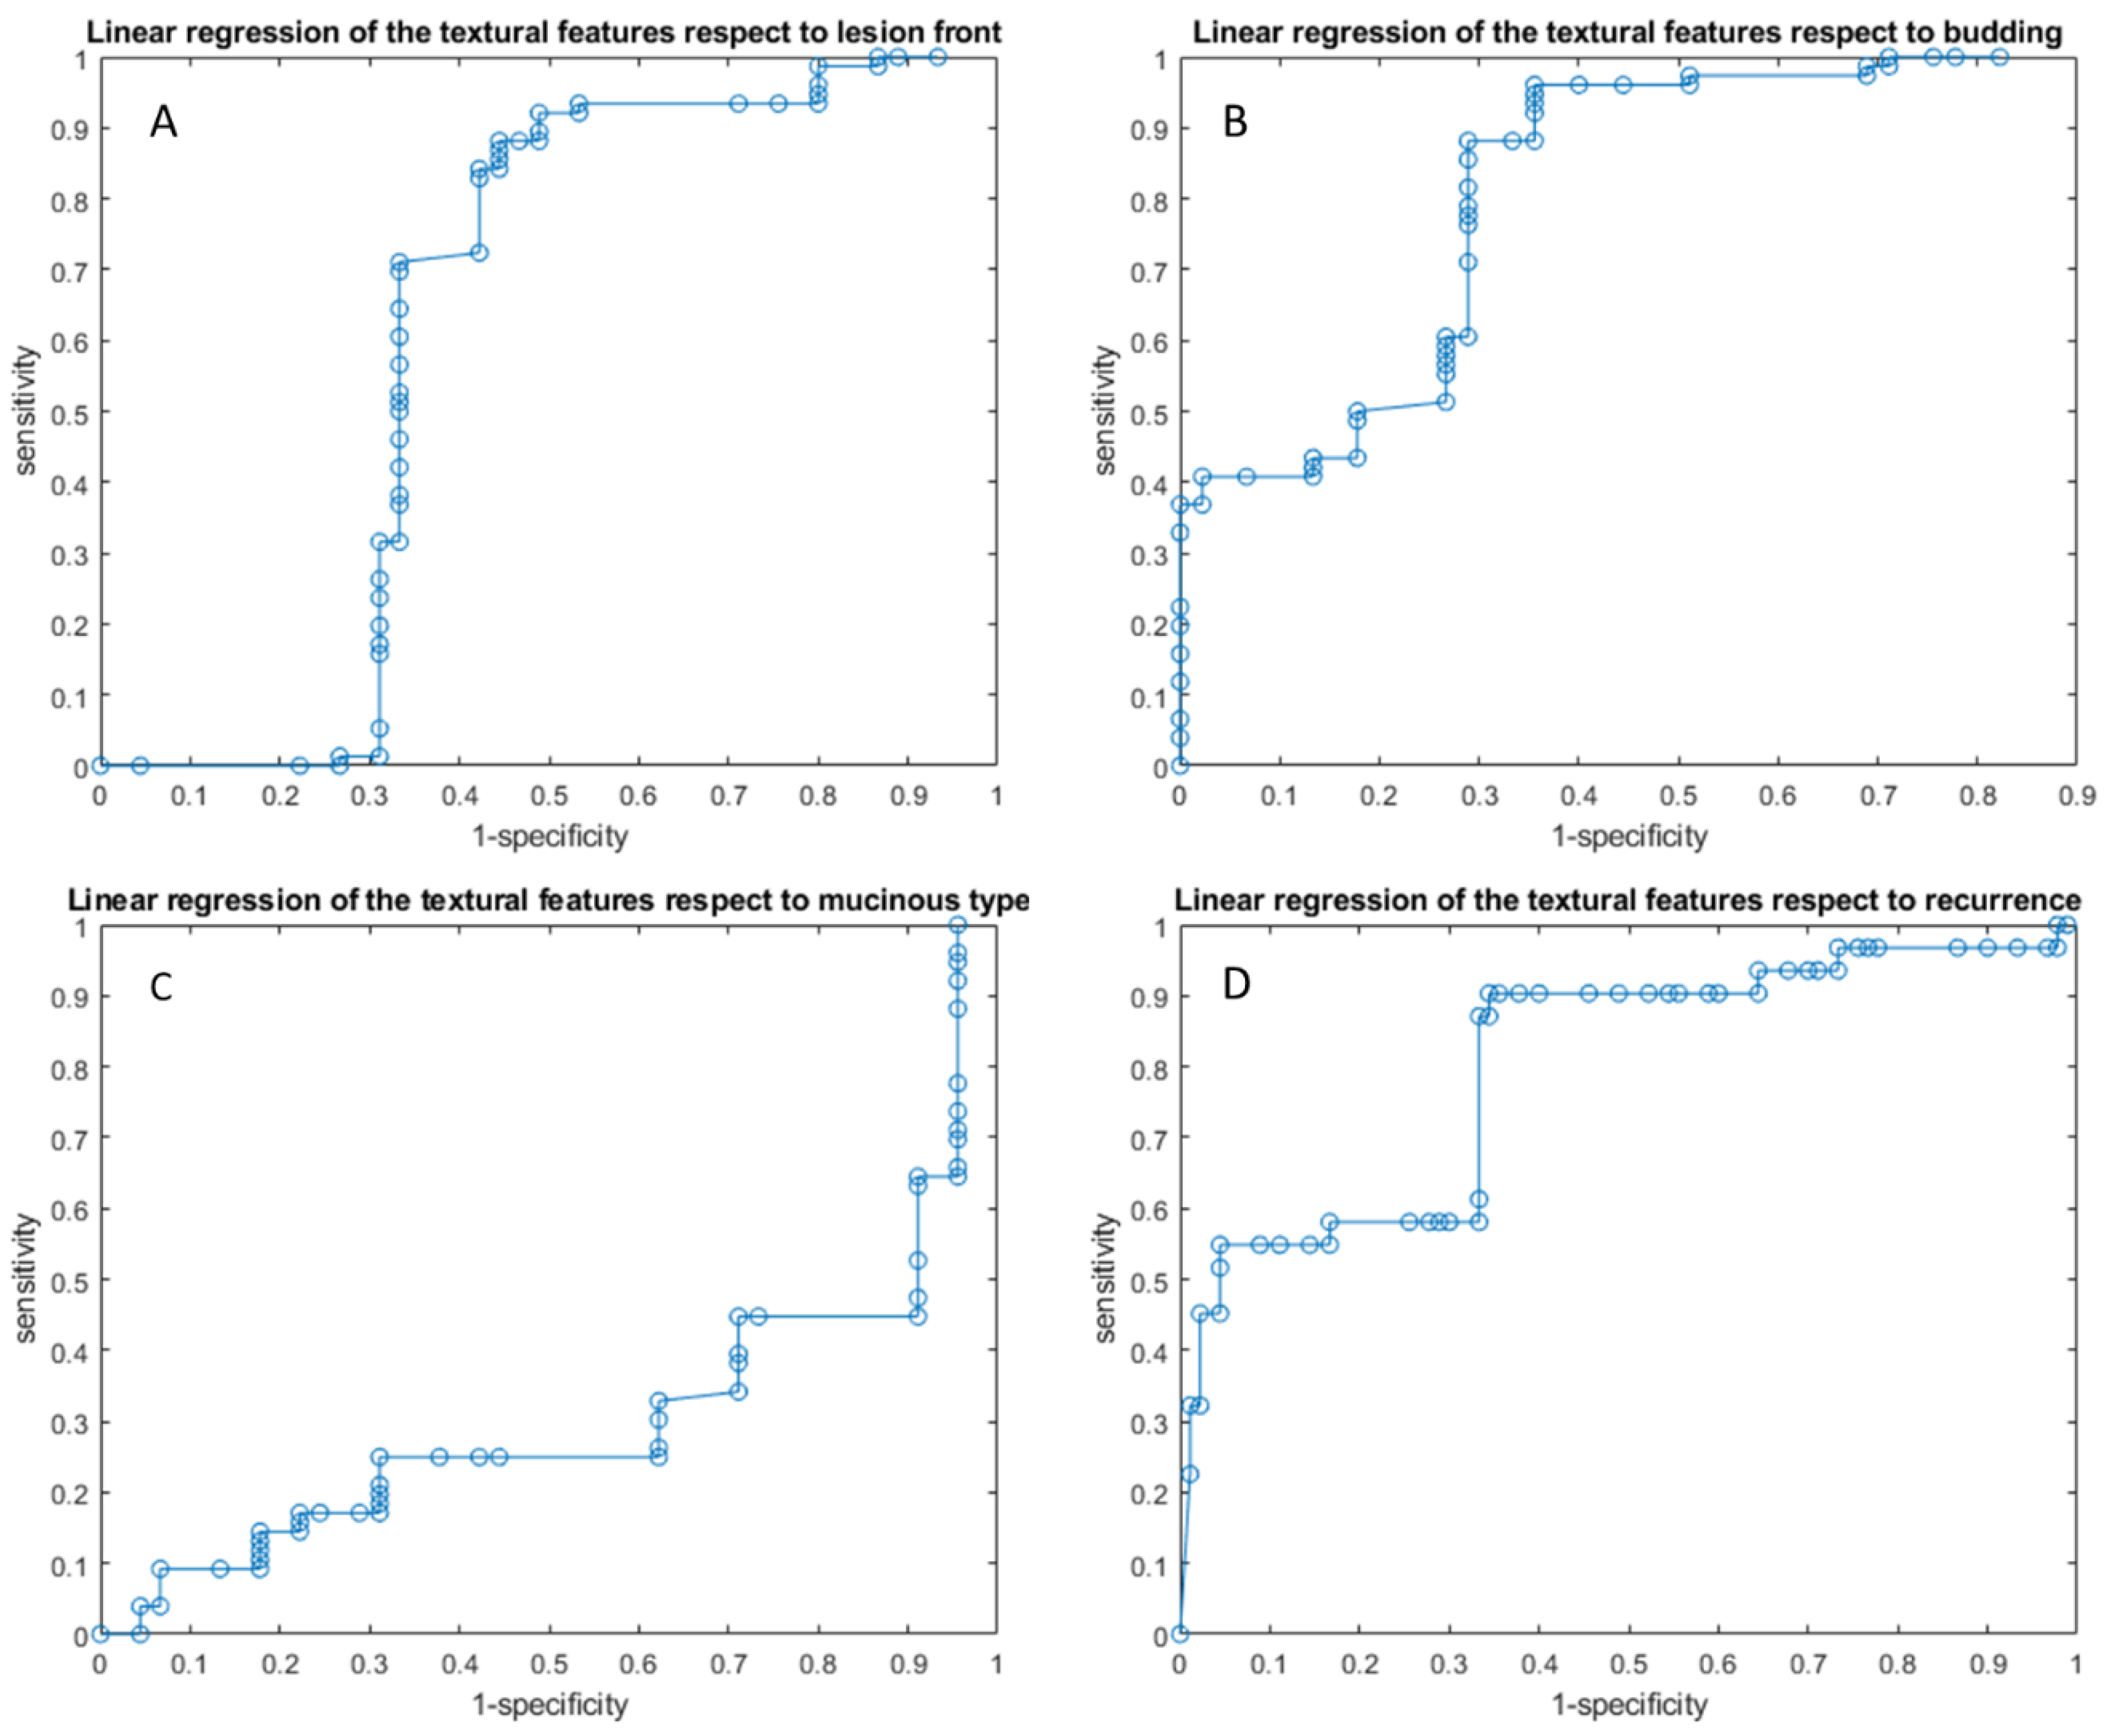
3.2.1. Linear Regression Analysis Findings
3.2.2. Pattern Recognition Approaches Findings
4. Discussions
5. Conclusions
Author Contributions
Funding
Institutional Review Board Statement
Informed Consent Statement
Data Availability Statement
Acknowledgments
Conflicts of Interest
References
- Granata, V.; Fusco, R.; Costa, M.; Picone, C.; Cozzi, D.; Moroni, C.; La Casella, G.V.; Montanino, A.; Monti, R.; Mazzoni, F.; et al. Preliminary Report on Computed Tomography Radiomics Features as Biomarkers to Immunotherapy Selection in Lung Adenocarcinoma Patients. Cancers 2021, 13, 3992. [Google Scholar] [CrossRef] [PubMed]
- Granata, V.; Fusco, R.; Barretta, M.L.; Picone, C.; Avallone, A.; Belli, A.; Patrone, R.; Ferrante, M.; Cozzi, D.; Grassi, R.; et al. Radiomics in hepatic metastasis by colorectal cancer. Infect. Agent Cancer 2021, 16, 39. [Google Scholar] [CrossRef] [PubMed]
- Fusco, R.; Piccirillo, A.; Sansone, M.; Granata, V.; Rubulotta, M.R.; Petrosino, T.; Barretta, M.L.; Vallone, P.; Di Giacomo, R.; Esposito, E.; et al. Radiomics and Artificial Intelligence Analysis with Textural Metrics Extracted by Contrast-Enhanced Mammography in the Breast Lesions Classification. Diagnostics 2021, 11, 815. [Google Scholar] [CrossRef] [PubMed]
- Fusco, R.; Granata, V.; Mazzei, M.A.; Meglio, N.D.; Roscio, D.D.; Moroni, C.; Monti, R.; Cappabianca, C.; Picone, C.; Neri, E.; et al. Quantitative imaging decision support (QIDSTM) tool consistency evaluation and radiomic analysis by means of 594 metrics in lung carcinoma on chest CT scan. Cancer Control 2021, 28, 1073274820985786. [Google Scholar] [CrossRef] [PubMed]
- Granata, V.; Fusco, R.; Avallone, A.; De Stefano, A.; Ottaiano, A.; Sbordone, C.; Brunese, L.; Izzo, F.; Petrillo, A. Radiomics-Derived Data by Contrast Enhanced Magnetic Resonance in RAS Mutations Detection in Colorectal Liver Metastases. Cancers 2021, 13, 453. [Google Scholar] [CrossRef]
- Granata, V.; Fusco, R.; Risi, C.; Ottaiano, A.; Avallone, A.; De Stefano, A.; Grimm, R.; Grassi, R.; Brunese, L.; Izzo, F.; et al. Diffusion-Weighted MRI and Diffusion Kurtosis Imaging to Detect RAS Mutation in Colorectal Liver Metastasis. Cancers 2020, 12, 2420. [Google Scholar] [CrossRef]
- Petralia, G.; Summers, P.E.; Agostini, A.; Ambrosini, R.; Cianci, R.; Cristel, G.; Calistri, L.; Colagrande, S. Dynamic contrast-enhanced MRI in oncology: How we do it. Radiol. Med. 2020, 125, 1288–1300. [Google Scholar] [CrossRef]
- Ria, F.; Samei, E. Is regulatory compliance enough to ensure excellence in medicine? Radiol. Med. 2020, 125, 904–905. [Google Scholar] [CrossRef]
- Zhang, A.; Song, J.; Ma, Z.; Chen, T. Combined dynamic contrast-enhanced magnetic resonance imaging and diffusion-weighted imaging to predict neoadjuvant chemotherapy effect in FIGO stage IB2-IIA2 cervical cancers. Radiol. Med. 2020, 125, 1233–1242. [Google Scholar] [CrossRef]
- Crimi, F.; Capelli, G.; Spolverato, G.; Bao, Q.R.; Florio, A.; Milite Rossi, S.; Cecchin, D.; Albertoni, L.; Campi, C.; Pucciarelli, S.; et al. MRI T2-weighted sequences-based texture analysis (TA) as a predictor of response to neoadjuvant chemo-radiotherapy (nCRT) in patients with locally advanced rectal cancer (LARC). Radiol. Med. 2020, 125, 1216–1224. [Google Scholar] [CrossRef]
- Kirienko, M.; Ninatti, G.; Cozzi, L.; Voulaz, E.; Gennaro, N.; Barajon, I.; Ricci, F.; Carlo-Stella, C.; Zucali, P.; Sollini, M.; et al. Computed tomography (CT)-derived radiomic features differentiate prevascular mediastinum masses as thymic neoplasms versus lymphomas. Radiol. Med. 2020, 125, 951–960. [Google Scholar] [CrossRef] [PubMed]
- Zhang, L.; Kang, L.; Li, G.; Zhang, X.; Ren, J.; Shi, Z.; Li, J.; Yu, S. Computed tomography-based radiomics model for discriminating the risk stratification of gastrointestinal stromal tumors. Radiol. Med. 2020, 125, 465–473. [Google Scholar] [CrossRef] [PubMed]
- Gurgitano, M.; Angileri, S.A.; Rodà, G.M.; Liguori, A.; Pandolfi, M.; Ierardi, A.M.; Wood, B.J.; Carrafiello, G. Interventional Radiology ex-machina: Impact of Artificial Intelligence on practice. Radiol. Med. 2021, 126, 998–1006. [Google Scholar] [CrossRef]
- Scapicchio, C.; Gabelloni, M.; Barucci, A.; Cioni, D.; Saba, L.; Neri, E. A deep look into radiomics. Radiol. Med. 2021, 126, 1296–1311. [Google Scholar] [CrossRef] [PubMed]
- Wei, J.; Jiang, H.; Gu, D.; Niu, M.; Fu, F.; Han, Y.; Song, B.; Tian, J. Radiomics in liver diseases: Current progress and future opportunities. Liver Int. 2020, 40, 2050–2063. [Google Scholar] [CrossRef]
- Saini, A.; Breen, I.; Pershad, Y.; Naidu, S.; Knuttinen, M.G.; Alzubaidi, S.; Sheth, R.; Albadawi, H.; Kuo, M.; Oklu, R. Radiogenomics and Radiomics in Liver Cancers. Diagnostics 2018, 9, 4. [Google Scholar] [CrossRef] [Green Version]
- De la Pinta, C.; Castillo, M.E.; Collado, M.; Galindo-Pumariño, C.; Peña, C. Radiogenomics: Hunting Down Liver Metastasis in Colorectal Cancer Patients. Cancers 2021, 13, 5547. [Google Scholar] [CrossRef]
- Nardone, V.; Reginelli, A.; Grassi, R.; Boldrini, L.; Vacca, G.; D’Ippolito, E.; Annunziata, S.; Farchione, A.; Belfiore, M.P.; Desideri, I.; et al. Delta radiomics: A systematic review. Radiol. Med. 2021, 126, 1571–1583. [Google Scholar] [CrossRef]
- Brunese, L.; Brunese, M.C.; Carbone, M.; Ciccone, V.; Mercaldo, F.; Santone, A. Automatic PI-RADS assignment by means of formal methods. Radiol. Med. 2021, 127, 83–89. [Google Scholar] [CrossRef]
- Van der Lubbe, M.F.J.A.; Vaidyanathan, A.; de Wit, M.; van den Burg, E.L.; Postma, A.A.; Bruintjes, T.D.; Bilderbeek-Beckers, M.A.L.; Dammeijer, P.F.M.; Bossche, S.V.; Van Rompaey, V.; et al. A non-invasive, automated diagnosis of Menière’s disease using radiomics and machine learning on conventional magnetic resonance imaging: A multicentric, case-controlled feasibility study. Radiol. Med. 2021, 27, 72–82. [Google Scholar] [CrossRef]
- Granata, V.; Fusco, R.; Avallone, A.; Cassata, A.; Palaia, R.; Delrio, P.; Grassi, R.; Tatangelo, F.; Grazzini, G.; Izzo, F.; et al. Abbreviated MRI protocol for colorectal liver metastases: How the radiologist could work in pre surgical setting. PLoS ONE 2020, 15, e0241431. [Google Scholar] [CrossRef] [PubMed]
- Granata, V.; Fusco, R.; Venanzio Setola, S.; Mattace Raso, M.; Avallone, A.; De Stefano, A.; Nasti, G.; Palaia, R.; Delrio, P.; Petrillo, A.; et al. Liver radiologic findings of chemotherapy-induced toxicity in liver colorectal metastases patients. Eur. Rev. Med. Pharmacol. Sci. 2019, 23, 9697–9706. [Google Scholar] [CrossRef] [PubMed]
- Granata, V.; Fusco, R.; Maio, F.; Avallone, A.; Nasti, G.; Palaia, R.; Albino, V.; Grassi, R.; Izzo, F.; Petrillo, A. Qualitative assessment of EOB-GD-DTPA and Gd-BT-DO3A MR contrast studies in HCC patients and colorectal liver metastases. Infect. Agent Cancer 2019, 14, 40. [Google Scholar] [CrossRef] [PubMed]
- Granata, V.; Fusco, R.; de Lutio di Castelguidone, E.; Avallone, A.; Palaia, R.; Delrio, P.; Tatangelo, F.; Botti, G.; Grassi, R.; Izzo, F.; et al. Diagnostic performance of gadoxetic acid-enhanced liver MRI versus multidetector CT in the assessment of colorectal liver metastases compared to hepatic resection. BMC Gastroenterol. 2019, 19, 129. [Google Scholar] [CrossRef] [PubMed] [Green Version]
- Granata, V.; Fusco, R.; Avallone, A.; Catalano, O.; Piccirillo, M.; Palaia, R.; Nasti, G.; Petrillo, A.; Izzo, F. A radiologist’s point of view in the presurgical and intraoperative setting of colorectal liver metastases. Future Oncol. 2018, 14, 2189–2206. [Google Scholar] [CrossRef]
- Granata, V.; Fusco, R.; Catalano, O.; Avallone, A.; Palaia, R.; Botti, G.; Tatangelo, F.; Granata, F.; Cascella, M.; Izzo, F.; et al. Diagnostic accuracy of magnetic resonance, computed tomography and contrast enhanced ultrasound in radiological multimo-dality assessment of peribiliary liver metastases. PLoS ONE 2017, 12, e0179951. [Google Scholar] [CrossRef] [Green Version]
- Granata, V.; Fusco, R.; Catalano, O.; Filice, S.; Amato, D.M.; Nasti, G.; Avallone, A.; Izzo, F.; Petrillo, A. Early Assessment of Colorectal Cancer Patients with Liver Metastases Treated with Antiangiogenic Drugs: The Role of Intravoxel Incoherent Motion in Diffusion-Weighted Imaging. PLoS ONE 2015, 10, e0142876. [Google Scholar] [CrossRef]
- Van Griethuysen, J.J.M.; Fedorov, A.; Parmar, C.; Hosny, A.; Aucoin, N.; Narayan, V.; Beets-Tan, R.G.H.; Fillion-Robin, J.C.; Pieper, S.; Aerts, H.J.W.L. Computational Radiomics System to Decode the Radiographic Phenotype. Cancer Res. 2017, 77, e104–e107. [Google Scholar] [CrossRef] [Green Version]
- Zwanenburg, A.; Vallières, M.; Abdalah, M.A.; Aerts, H.J.W.L.; Andrearczyk, V.; Apte, A.; Ashrafinia, S.; Bakas, S.; Beukinga, R.J.; Boellaard, R.; et al. The Image Biomarker Standardization Initiative: Standardized Quantitative Radiomics for High-Throughput Image-based Phenotyping. Radiology 2020, 295, 328–338. [Google Scholar] [CrossRef] [Green Version]
- Fusco, R.; Sansone, M.; Filice, S.; Carone, G.; Amato, D.M.; Sansone, C.; Petrillo, A. Pattern Recognition Approaches for Breast Cancer DCE-MRI Classification: A Systematic Review. J. Med. Biol. Eng. 2016, 36, 449–459. [Google Scholar] [CrossRef] [Green Version]
- Beckers, R.C.J.; Trebeschi, S.; Maas, M.; Schnerr, R.S.; Sijmons, J.M.L.; Beets, G.L.; Houwers, J.B.; Beets-Tan, R.G.H.; Lambregts, D.M.J. CT texture analysis in colorectal liver metastases and the surrounding liver parenchyma and its potential as an imaging biomarker of disease aggressiveness, response and survival. Eur. J. Radiol. 2018, 102, 15–21. [Google Scholar] [CrossRef]
- Andersen, I.R.; Thorup, K.; Andersen, M.B.; Olesen, R.; Mortensen, F.V.; Nielsen, D.T.; Rasmussen, F. Texture in the monitoring of regorafenib therapy in patients with colorectal liver metastases. Acta Radiol. 2019, 60, 1084–1093. [Google Scholar] [CrossRef] [PubMed]
- Zhang, H.; Li, W.; Hu, F.; Sun, Y.; Hu, T.; Tong, T. MR texture analysis: Potential imaging biomarker for predicting the chemotherapeutic response of patients with colorectal liver metastases. Abdom. Radiol. 2018, 44, 65–71. [Google Scholar] [CrossRef]
- Lubner, M.G.; Stabo, N.; Lubner, S.J.; del Rio, A.M.; Song, C.; Halberg, R.B.; Pickhardt, P.J. CT textural analysis of hepatic metastatic colorectal cancer: Pre-treatment tumor heterogeneity correlates with pathology and clinical outcomes. Abdom. Imaging 2015, 40, 2331–2337. [Google Scholar] [CrossRef] [PubMed]
- Simpson, A.L.; Doussot, A.; Creasy, J.M.; Adams, L.B.; Allen, P.J.; DeMatteo, R.P.; Gönen, M.; Kemeny, N.E.; Kingham, T.P.; Shia, J.; et al. Computed Tomography Image Texture: A Noninvasive Prognostic Marker of Hepatic Recurrence After Hepatectomy for Metastatic Colorectal Cancer. Ann. Surg. Oncol. 2017, 24, 2482–2490. [Google Scholar] [CrossRef] [PubMed]
- Ganeshan, B.; Miles, K.A.; Young, R.C.; Chatwin, C.R. Hepatic Enhancement in Colorectal Cancer: Texture Analysis Correlates with Hepatic Hemodynamics and Patient Survival. Acad. Radiol. 2007, 14, 1520–1530. [Google Scholar] [CrossRef]
- Rahmim, A.; Bak-Fredslund, K.P.; Ashrafinia, S.; Lu, L.; Schmidtlein, C.; Subramaniam, R.M.; Morsing, A.; Keiding, S.; Horsager, J.; Munk, O.L. Prognostic modeling for patients with colorectal liver metastases incorporating FDG PET radiomic features. Eur. J. Radiol. 2019, 113, 101–109. [Google Scholar] [CrossRef]
- Dercle, L.; Lu, L.; Schwartz, L.H.; Qian, M.; Tejpar, S.; Eggleton, P.; Zhao, B.; Piessevaux, H. Radiomics Response Signature for Identification of Metastatic Colorectal Cancer Sensitive to Therapies Targeting EGFR Pathway. J. Natl. Cancer Inst. 2020, 112, 902–912. [Google Scholar] [CrossRef]
- Ravanelli, M.; Agazzi, G.M.; Tononcelli, E.; Roca, E.; Cabassa, P.; Baiocchi, G.L.; Berruti, A.; Maroldi, R.; Farina, D. Texture features of colorectal liver metastases on pretreatment contrast-enhanced CT may predict response and prognosis in patients treated with bevacizumab-containing chemotherapy: A pilot study including comparison with standard chemotherapy. Radiol. Med. 2019, 124, 877–886. [Google Scholar] [CrossRef]
- Taghavi, M.; Staal, F.C.; Simões, R.; Hong, E.K.; Lambregts, D.M.; van der Heide, U.A.; Beets-Tan, R.G.; Maas, M. CT radiomics models are unable to predict new liver metastasis after successful thermal ablation of colorectal liver metastases. Acta Radiol. 2021, 17, 2841851211060437. [Google Scholar] [CrossRef]
- Rizzetto, F.; Calderoni, F.; de Mattia, C.; Defeudis, A.; Giannini, V.; Mazzetti, S.; Vassallo, L.; Ghezzi, S.; Sartore-Bianchi, A.; Marsoni, S.; et al. Impact of inter-reader contouring variability on textural radiomics of colorectal liver metastases. Eur. Radiol. Exp. 2020, 4, 62. [Google Scholar] [CrossRef] [PubMed]


| Patient Description | Numbers (%)/Range |
|---|---|
| Gender | Men 53 (65.4%) |
| Women 28 (34.6%) | |
| Age | 61 years; range: 35–82 years |
| Primary Cancer Site | |
| Colon | 52 (64.2%) |
| Rectum | 29 (35.8%) |
| Prior Chemotherapy | 81 (100%) |
| Hepatic Metastases Description | |
| Patients with single nodule | 52 (64.2%) |
| Patients with multiple nodules | 29 (35.8%)/range: 2–13 metastases |
| Nodule size (mm) | mean size 36.4 mm; range 7–58 mm |
| Front of Tumor Growth | |
| expansive | 30 (37.0%) |
| infiltrative | 51 (63.0%) |
| Tumor Budding | |
| Absent | 12 (14.8%) |
| Low grade | 14 (17.3%) |
| High grade | 55 (67.9%) |
| Mucinous Carcinoma | 25 (30.9%) |
| Recurrence | 19 (23.5%) |
| RAS Mutation | 42 (51.9%) |
| Sequence | Orientation | TR/TE/FA (ms/ms/deg.) | AT (min) | Acquisition Matrix | ST/Gap (mm) | FS |
|---|---|---|---|---|---|---|
| Trufisp T2-W | Coronal | 4.30/2.15/80 | 0.46 | 512 × 512 | 4/0 | without |
| HASTE T2-W | Axial | 1500/90/170 | 0.36 | 320 × 320 | 5/0 | without and with (SPAIR) |
| HASTE T2w | Coronal | 1500/92/170 | 0.38 | 320 × 320 | 5/0 | without |
| In-Out phase T1-W | Axial | 160/2.35/70 | 0.33 | 256 × 192 | 5/0 | without |
| VIBE T1-W_FA10 | Axial | 4.80/1.76/10 | 0.18 | 320 × 260 | 3/0 | with (SPAIR) |
| VIBE T1-W_FA30 | Axial | 4.80/1.76/30 | 0.18 | 320 × 260 | 3/0 | with (SPAIR) |
| Significant Textural Features Extracted by | VIBE_FA10 Respect to the Front of Tumor Growth | VIBE_FA30 Respect to the Front of Tumor Growth | VIBE_FA10 Respect to the Tumor Budding | VIBE_FA30 Respect to the Tumor Budding | VIBE_FA10 Respect to the Mucinous Type | VIBE_FA30 Respect to the Mucinous Type | VIBE_FA10 Respect to Recurrence | VIBE_FA30 Respect to Recurrence |
|---|---|---|---|---|---|---|---|---|
| Wavelet_HHL_glcm_MaximumProbability | Wavelet_HLH_glcm_MaximumProbability | Wavelet_HHL_glcm_MaximumProbability | Original_glcm_InverseVariance | Wavelet_HHH_ngtdm_Busyness | Wavelet_HHL_glszm_ZoneVariance | Wavelet_LLH_glrlm_ShortRunEmphasis | Wavelet_LHL_glcm_Correlation | |
| AUC | 0.66 | 0.68 | 0.70 | 0.70 | 0.65 | 0.63 | 0.48 | 0.74 |
| Sensitivity | 0.92 | 0.83 | 0.94 | 0.96 | 0.42 | 0.46 | 0.31 | 0.52 |
| Specificity | 0.62 | 0.82 | 0.68 | 0.65 | 0.95 | 0.96 | 1.00 | 0.97 |
| PPV | 0.80 | 0.89 | 0.89 | 0.89 | 0.69 | 0.75 | 1.00 | 0.84 |
| NPV | 0.82 | 0.74 | 0.81 | 0.83 | 0.86 | 0.87 | 0.84 | 0.85 |
| Accuracy | 0.81 | 0.84 | 0.88 | 0.89 | 0.84 | 0.85 | 0.85 | 0.86 |
| Cut-off | 0.28 | 0.28 | 0.28 | 0.35 | 1306.26 | 1,289,504.66 | 0.84 | 0.46 |
| Linear Regression of Significant Features | AUC | Sensitivity | Specificity | PPV | NPV | Accuracy | Cut-Off |
| Linear regression of the textural features extracted from the VIBE_FA10 with respect to the front of tumor growth | 0.72 | 0.93 | 0.82 | 0.90 | 0.88 | 0.89 | 1.49 |
| Linear regression of the textural features extracted from the VIBE_FA10 with respect to the tumor budding | 0.78 | 0.84 | 0.84 | 0.94 | 0.65 | 0.84 | 1.54 |
| Linear regression of the textural features extracted from the VIBE_FA10 with respect to the mucinous type | 0.80 | 0.85 | 0.82 | 0.56 | 0.95 | 0.83 | 0.28 |
| Linear regression of the textural features extracted from the VIBE_FA10 with respect to the recurrence presence | 0.63 | 0.52 | 0.88 | 0.59 | 0.84 | 0.79 | 3.81 |
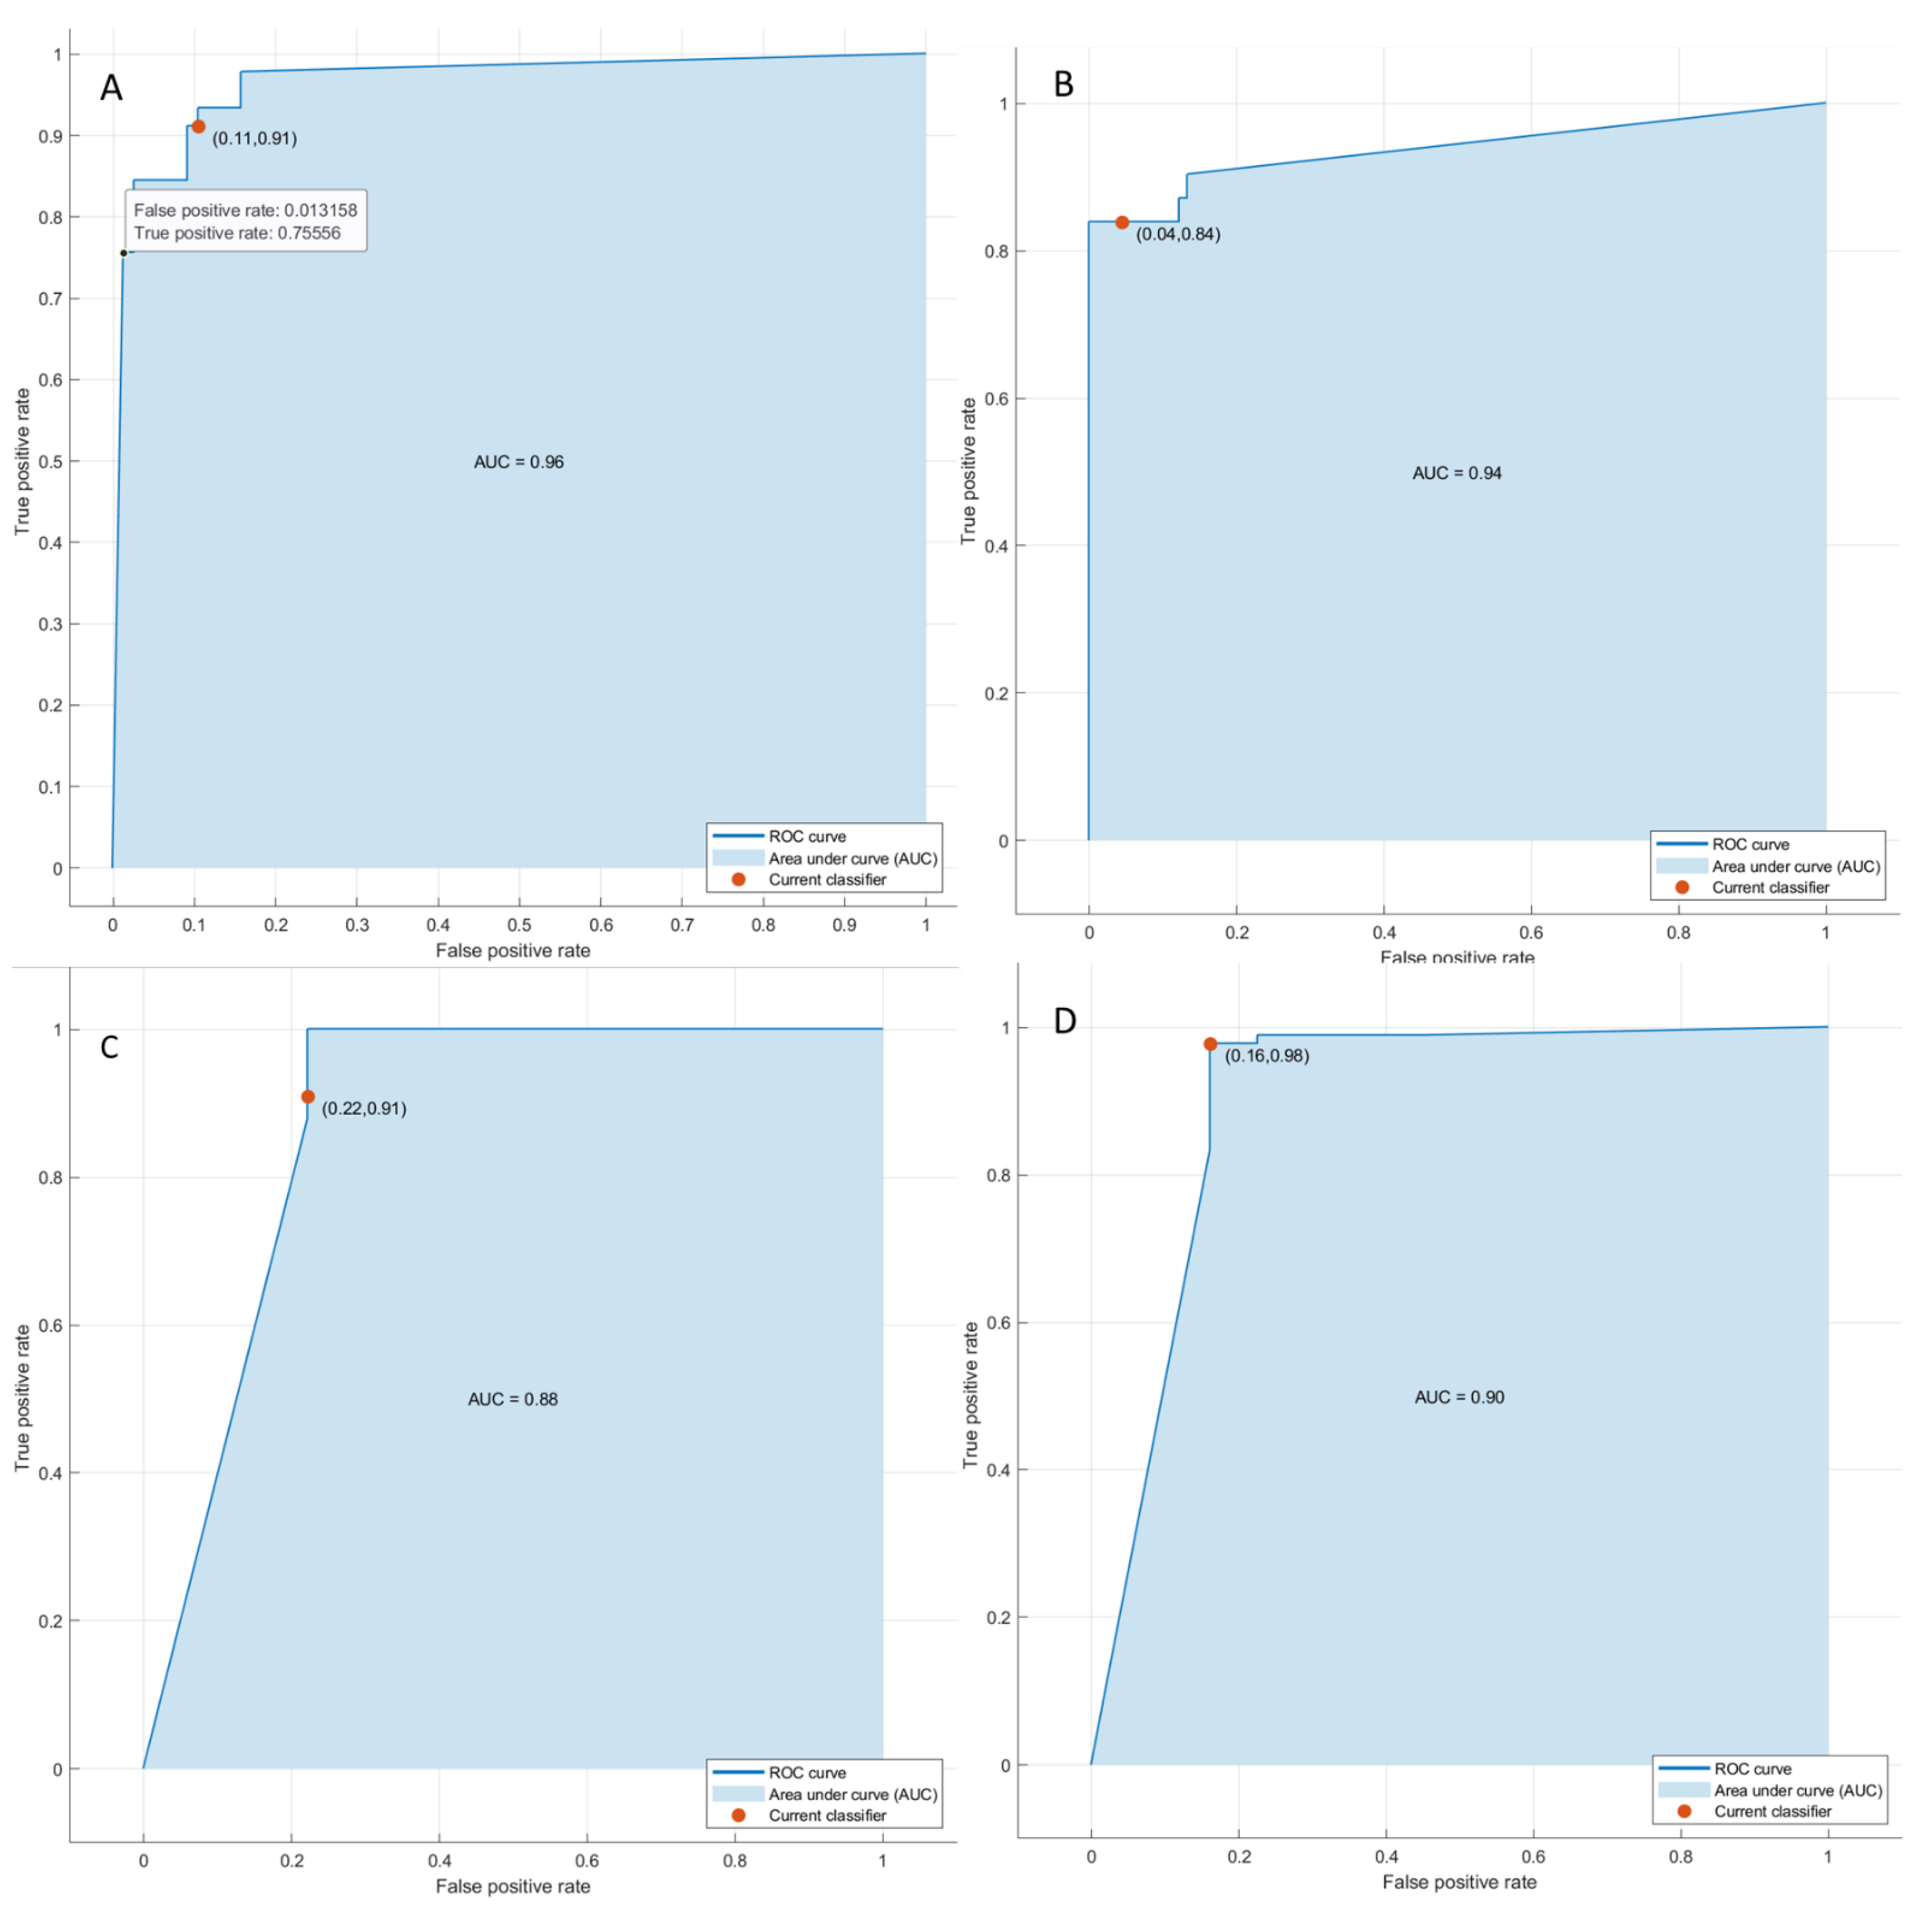
| Pattern Recognition Analysis with Significant Features | Dataset | AUC | Accuracy | Sensitivity | Specificity | Training Time [sec] | Model Type and Parameters |
| KNN | Training set | 0.96 | 0.91 | 0.84 | 0.95 | 8.7 | Weighted KNN; number of neighbors:10; distance metric: Euclidean; distance weight: squared inverse |
| Validation set | 0.97 | 0.92 | 1 | 0.86 | |||
| Training set | 0.89 | 0.93 | 0.81 | 0.97 | 3.9 | ||
| Validation set | 0.9 | 0.93 | 0.73 | 1 | |||
| Training set | 0.93 | 0.89 | 0.94 | 0.73 | 3.2 | ||
| Validation set | 0.95 | 0.88 | 0.91 | 0.8 | |||
| Training set | 0.91 | 0.93 | 0.99 | 0.77 | 9.21 | ||
| Validation set | 0.97 | 0.94 | 0.9 | 0.91 |
| Linear Regression of Significant Features | AUC | Sensitivity | Specificity | PPV | NPV | Accuracy | Cut-Off |
| Linear regression of the textural features extracted from the VIBE_FA30 with respect to the front of tumor growth | 0.55 | 0.88 | 0.56 | 0.77 | 0.74 | 0.76 | 8.81 |
| Linear regression of the textural features extracted from the VIBE_FA30 with respect to the tumor budding | 0.65 | 0.96 | 0.64 | 0.82 | 0.91 | 0.84 | 0.56 |
| Linear regression of the textural features extracted from the VIBE_FA30 with respect to the mucinous type | 0.26 | 1.00 | 0.04 | 0.64 | 1.00 | 0.64 | −0.17 |
| Linear regression of the textural features extracted from the VIBE_FA30 with respect to the recurrence presence | 0.79 | 0.90 | 0.66 | 0.47 | 0.95 | 0.72 | 0.27 |
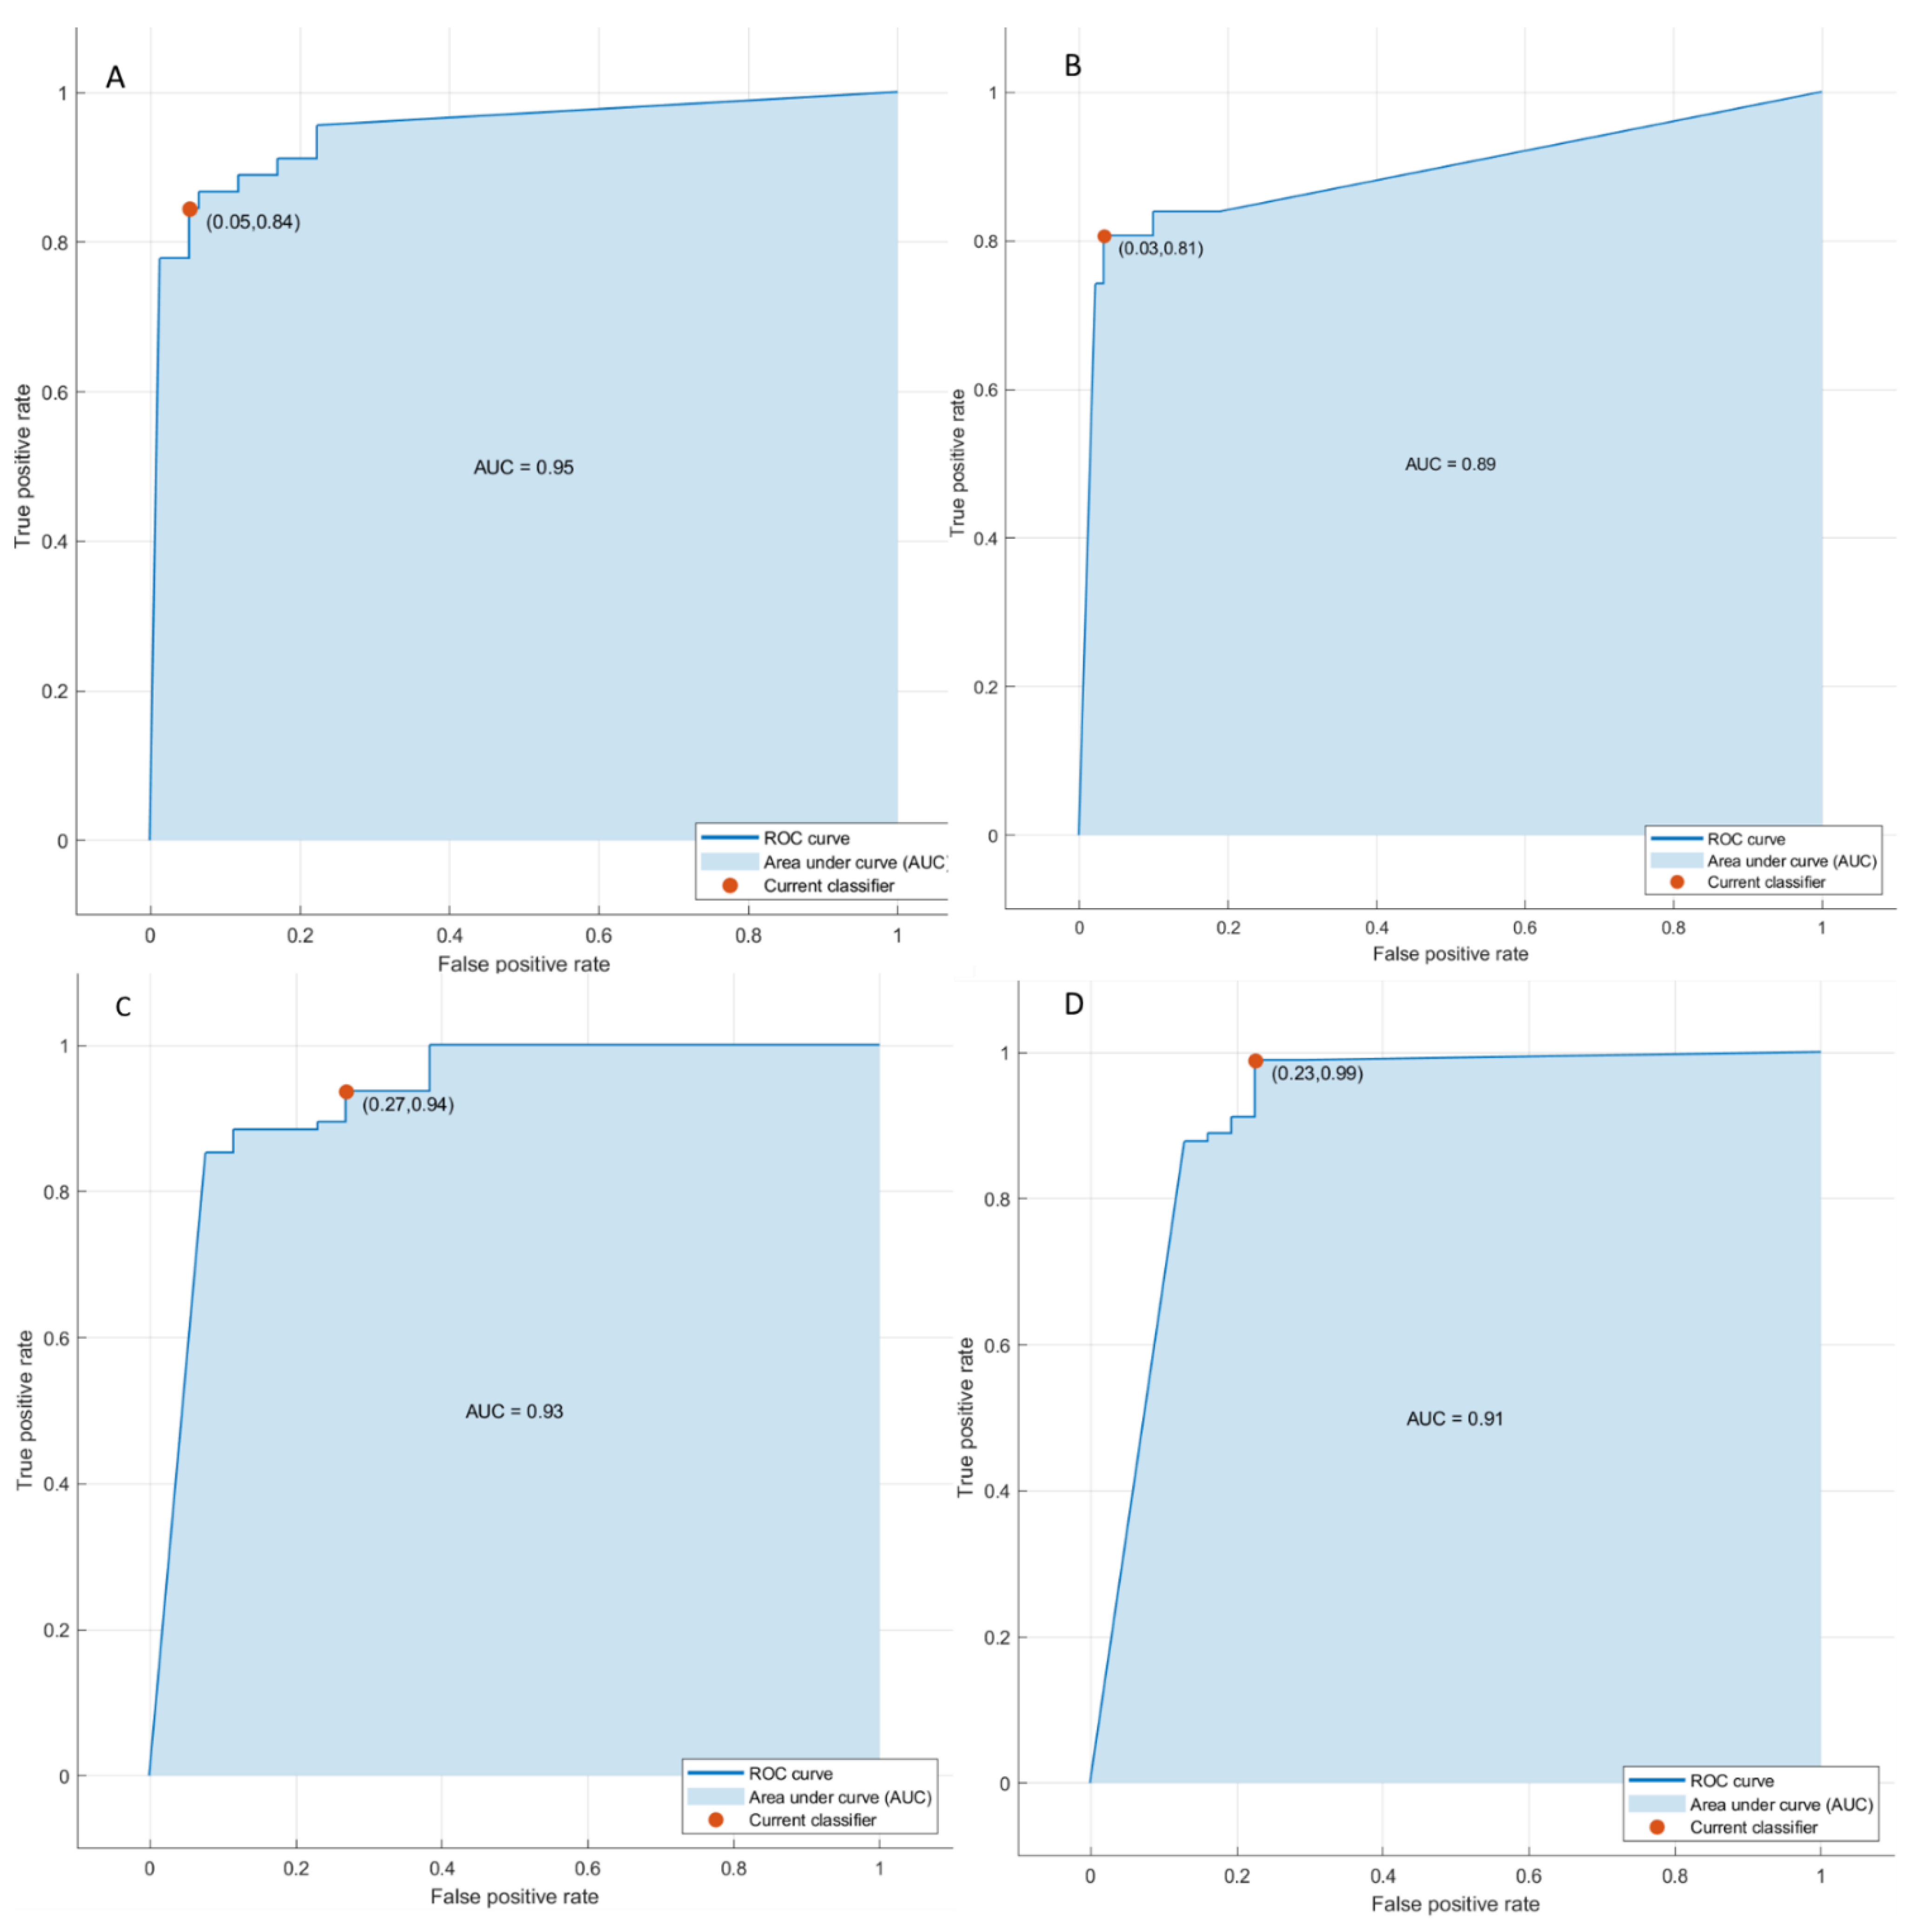
| Pattern Recognition Analysis with Significant Features | Dataset | AUC | Accuracy | Sensitivity | Specificity | Training time [sec] | Model Type and Parameters |
| KNN | Training set | 0.96 | 0.90 | 0.91 | 0.89 | 13.4 | Weighted KNN; number of neighbors:10; distance metric: Euclidean; distance weight: squared inverse |
| Validation set | 0.95 | 0.80 | 0.67 | 1 | |||
| Training set | 0.94 | 0.93 | 0.84 | 0.96 | 8.3 | ||
| Validation set | 0.94 | 0.89 | 0.89 | 0.89 | |||
| Training set | 0.93 | 0.91 | 0.96 | 0.73 | 7.51 | ||
| Validation set | 0.89 | 0.88 | 0.89 | 0.8 | |||
| Training set | 0.9 | 0.94 | 0.98 | 0.84 | 8.4 | ||
| Validation set | 0.85 | 0.91 | 0.94 | 0.8 |
| Linear Regression of the Textural Features Extracted by VIBE_FA10 with Respect to the Front of Tumor Growth | Coefficients | p Value | p Value |
| Intercept | −7.37 | 0.08 | 0.000 |
| original_shape_SurfaceVolumeRatio | −0.85 | 0.58 | |
| wavelet_LHL_glszm_SmallAreaLowGrayLevelEmphasis | 1.50 | 0.19 | |
| wavelet_LLH_glcm_InverseVariance | 4.15 | 0.00 | |
| wavelet_HHH_glrlm_ShortRunHighGrayLevelEmphasis | 0.14 | 0.00 | |
| wavelet_HHH_glrlm_ShortRunEmphasis | 6.25 | 0.51 | |
| wavelet_HHH_glrlm_RunPercentage | −6.73 | 0.57 | |
| wavelet_HHH_glrlm_RunLengthNonUniformityNormalized | 5.15 | 0.40 | |
| wavelet_HHL_glcm_MaximumProbability | 16.11 | 0.00 | |
| Linear Regression of the Textural Features ExtractedbyVIBE_FA10 with Respect to the Tumor Budding | Coefficients | p value | p value |
| Intercept | −17.88 | 0.00 | 0.000 |
| wavelet_HLL_gldm_LargeDependenceLowGrayLevelEmphasis | 0.11 | 0.32 | |
| wavelet_HLL_glrlm_LongRunLowGrayLevelEmphasis | −3.28 | 0.33 | |
| wavelet_HLL_glszm_GrayLevelNonUniformityNormalized | −4.28 | 0.05 | |
| wavelet_LLH_glrlm_GrayLevelNonUniformityNormalized | 2.15 | 0.07 | |
| wavelet_HLH_glcm_JointEnergy | 48.41 | 0.00 | |
| wavelet_HLH_firstorder_10Percentile | 0.00 | 0.96 | |
| wavelet_HHH_glcm_MaximumProbability | 1.42 | 0.87 | |
| wavelet_HHL_glcm_MaximumProbability | 24.94 | 0.00 | |
| Linear Regression of the Textural Features ExtractedbyVIBE_FA10 with Respect to the Mucinous Type | Coefficients | p value | p value |
| Intercept | 3.31 | 0.14 | 0.000 |
| wavelet_LHL_gldm_DependenceNonUniformity | 0.00 | 0.03 | |
| wavelet_LHL_ngtdm_Strength | −1.20 | 0.08 | |
| wavelet_LHL_ngtdm_Busyness | 0.00 | 0.07 | |
| wavelet_LHH_glcm_ClusterTendency | 7.50 | 0.00 | |
| wavelet_HLH_gldm_DependenceEntropy | −0.03 | 0.97 | |
| wavelet_HLH_firstorder_Mean | 0.12 | 0.59 | |
| wavelet_HHH_ngtdm_Busyness | 0.00 | 0.08 | |
| wavelet_HHL_gldm_DependenceEntropy | −1.44 | 0.04 | |
| Linear Regression of the Textural Features ExtractedbyVIBE_FA10 with Respect to the Recurrence Presence | Coefficients | p value | p value |
| Intercept | −2.95 | 0.05 | 0.030 |
| wavelet_LLH_glrlm_ShortRunEmphasis | 8.19 | 0.04 | |
| wavelet_LLH_glrlm_RunLengthNonUniformityNormalized | −5.25 | 0.10 | |
| wavelet_HHH_ngtdm_Busyness | 0.00 | 0.49 | |
| Linear Regression of the Textural Features ExtractedbyVIBE_FA30 with Respect to the Front of Tumor Growth | Coefficients | p value | p value |
| Intercept | −4.868 | 0.010 | 0.000 |
| original_glcm_InverseVariance | 1.484 | 0.260 | |
| wavelet_HLL_gldm_GrayLevelVariance | −4.907 | 0.206 | |
| wavelet_HLL_glcm_InverseVariance | 4.257 | 0.165 | |
| wavelet_HLL_glcm_DifferenceVariance | −0.967 | 0.182 | |
| wavelet_HLL_glcm_SumEntropy | 1.329 | 0.195 | |
| wavelet_HLL_glcm_SumSquares | −0.462 | 0.540 | |
| wavelet_HLL_firstorder_RobustMeanAbsoluteDeviation | 0.360 | 0.244 | |
| wavelet_HLL_firstorder_MeanAbsoluteDeviation | −0.612 | 0.161 | |
| wavelet_HLL_firstorder_RootMeanSquared | 0.153 | 0.273 | |
| wavelet_HLL_firstorder_RootMeanSquared | 0.823 | 0.717 | |
| wavelet_HLL_firstorder_Variance | 0.010 | 0.162 | |
| wavelet_LHH_glrlm_ShortRunLowGrayLevelEmphasis | −0.018 | 0.944 | |
| wavelet_HLH_glcm_MaximumProbability | 8.613 | 0.051 | |
| wavelet_HLH_glcm_MaximumProbability | 0.903 | 0.817 | |
| wavelet_LLL_gldm_SmallDependenceLowGrayLevelEmphasis | 24.740 | 0.440 | |
| Linear Regression of the Textural Features ExtractedbyVIBE_FA30 with Respect to the Tumor Budding | Coefficients | p value | p value |
| Intercept | 5.220 | 0.521 | 0.000 |
| original_glcm_InverseVariance | 2.978 | 0.008 | |
| wavelet_HLL_glcm_JointEnergy | −12.594 | 0.008 | |
| wavelet_HLL_glcm_Idm | 114.999 | 0.000 | |
| wavelet_HLL_glcm_Id | −123.518 | 0.002 | |
| wavelet_HLL_firstorder_Uniformity | −18.651 | 0.011 | |
| wavelet_HLL_firstorder_10Percentile | −0.005 | 0.801 | |
| wavelet_HLL_glrlm_GrayLevelNonUniformityNormalized | 14.712 | 0.009 | |
| wavelet_HLL_glszm_GrayLevelNonUniformityNormalized | −0.804 | 0.458 | |
| wavelet_LHL_glcm_Idm | −71.494 | 0.012 | |
| wavelet_LHL_glcm_Id | 79.815 | 0.014 | |
| wavelet_LHH_firstorder_10Percentile | −0.003 | 0.941 | |
| wavelet_LLH_firstorder_Uniformity | 10.540 | 0.002 | |
| wavelet_LLH_glrlm_GrayLevelNonUniformityNormalized | −12.808 | 0.002 | |
| wavelet_LLH_glszm_GrayLevelNonUniformityNormalized | 2.066 | 0.156 | |
| wavelet_HHL_glcm_JointEnergy | 1.672 | 0.853 | |
| wavelet_HHL_firstorder_10Percentile | 0.202 | 0.006 | |
| Linear Regression of the Textural Features ExtractedbyVIBE_FA30 with Respect to the Mucinous Type | Coefficients | p value | p value |
| Intercept | 13.293 | 0.018 | 0.000 |
| original_shape_SurfaceVolumeRatio | −2.669 | 0.000 | |
| wavelet_LHH_gldm_DependenceNonUniformity | 0.004 | 0.113 | |
| wavelet_LHH_gldm_GrayLevelNonUniformity | 0.000 | 0.710 | |
| wavelet_HLH_gldm_DependenceNonUniformity | −0.014 | 0.000 | |
| wavelet_HLH_glrlm_GrayLevelNonUniformity | 0.005 | 0.003 | |
| wavelet_HHH_gldm_DependenceNonUniformity | −0.002 | 0.473 | |
| wavelet_HHH_glszm_ZonePercentage | 67.121 | 0.000 | |
| wavelet_HHH_ngtdm_Busyness | 0.000 | 0.000 | |
| wavelet_HHL_gldm_DependenceNonUniformity | 0.012 | 0.000 | |
| wavelet_HHL_glrlm_GrayLevelNonUniformity | −0.005 | 0.004 | |
| wavelet_HHL_glszm_ZoneVariance | 0.000 | 0.462 | |
| wavelet_LLL_glcm_Idmn | −12.578 | 0.025 | |
| Linear Regression of the Textural Features ExtractedbyVIBE_FA30 with Respect to the Recurrence Presence | Coefficients | p value | p value |
| Intercept | −0.018 | 0.966 | 0.000 |
| original_glszm_ZonePercentage | 0.852 | 0.540 | |
| wavelet_HLL_glcm_Correlation | −0.464 | 0.684 | |
| wavelet_LHL_glcm_Correlation | 5.324 | 0.001 | |
| wavelet_LHL_glcm_SumEntropy | −0.243 | 0.474 | |
| wavelet_LHL_glcm_Imc2 | v2.956 | 0.037 | |
| wavelet_LHL_glcm_ClusterTendency | −0.014 | 0.891 | |
| wavelet_HLH_glcm_Correlation | 2.266 | 0.341 | |
| wavelet_HHL_glrlm_HighGrayLevelRunEmphasis | 0.033 | 0.010 |
Publisher’s Note: MDPI stays neutral with regard to jurisdictional claims in published maps and institutional affiliations. |
© 2022 by the authors. Licensee MDPI, Basel, Switzerland. This article is an open access article distributed under the terms and conditions of the Creative Commons Attribution (CC BY) license (https://creativecommons.org/licenses/by/4.0/).
Share and Cite
Granata, V.; Fusco, R.; De Muzio, F.; Cutolo, C.; Setola, S.V.; Dell’Aversana, F.; Ottaiano, A.; Nasti, G.; Grassi, R.; Pilone, V.; et al. EOB-MR Based Radiomics Analysis to Assess Clinical Outcomes following Liver Resection in Colorectal Liver Metastases. Cancers 2022, 14, 1239. https://doi.org/10.3390/cancers14051239
Granata V, Fusco R, De Muzio F, Cutolo C, Setola SV, Dell’Aversana F, Ottaiano A, Nasti G, Grassi R, Pilone V, et al. EOB-MR Based Radiomics Analysis to Assess Clinical Outcomes following Liver Resection in Colorectal Liver Metastases. Cancers. 2022; 14(5):1239. https://doi.org/10.3390/cancers14051239
Chicago/Turabian StyleGranata, Vincenza, Roberta Fusco, Federica De Muzio, Carmen Cutolo, Sergio Venanzio Setola, Federica Dell’Aversana, Alessandro Ottaiano, Guglielmo Nasti, Roberta Grassi, Vincenzo Pilone, and et al. 2022. "EOB-MR Based Radiomics Analysis to Assess Clinical Outcomes following Liver Resection in Colorectal Liver Metastases" Cancers 14, no. 5: 1239. https://doi.org/10.3390/cancers14051239
APA StyleGranata, V., Fusco, R., De Muzio, F., Cutolo, C., Setola, S. V., Dell’Aversana, F., Ottaiano, A., Nasti, G., Grassi, R., Pilone, V., Miele, V., Brunese, M. C., Tatangelo, F., Izzo, F., & Petrillo, A. (2022). EOB-MR Based Radiomics Analysis to Assess Clinical Outcomes following Liver Resection in Colorectal Liver Metastases. Cancers, 14(5), 1239. https://doi.org/10.3390/cancers14051239