
A Deep Learning Model for Cervical Cancer Screening on Liquid-Based Cytology Specimens in Whole Slide Images

 and
and 
Abstract
:Simple Summary
Abstract
1. Introduction
2. Materials and Methods
2.1. Clinical Cases and Cytopathological Records
2.2. Dataset
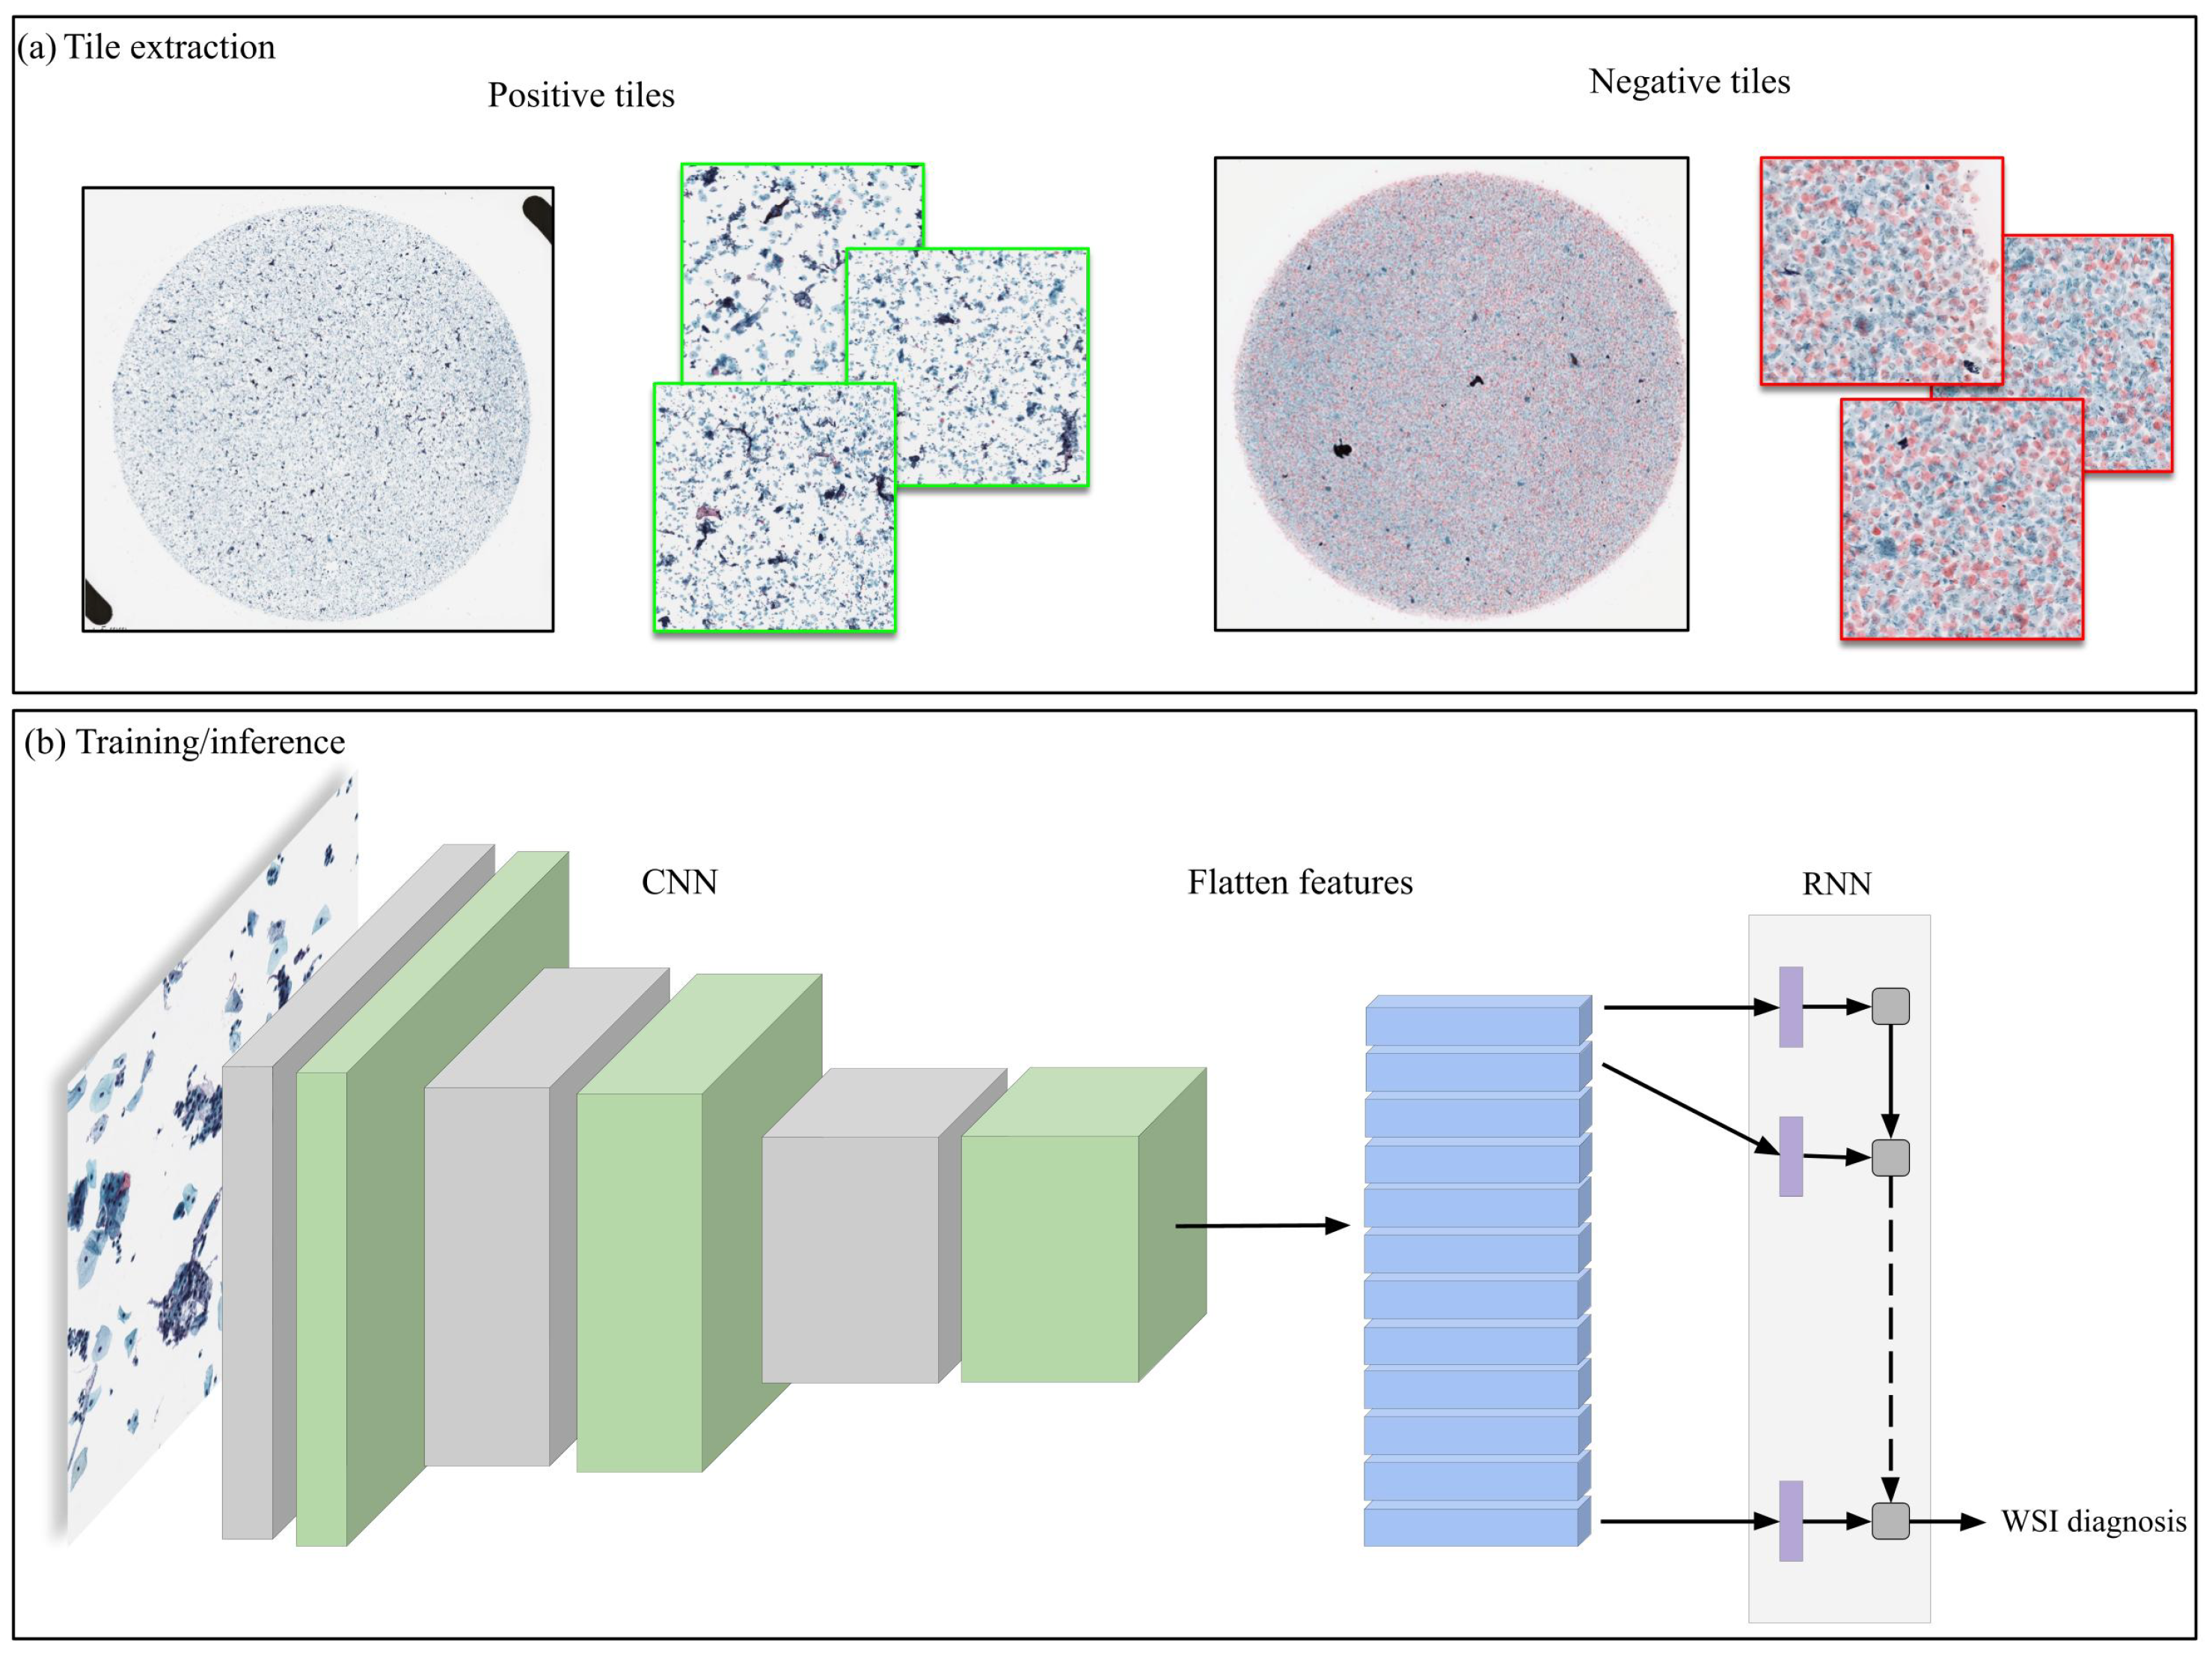
2.3. Annotation
2.4. Deep Learning Models
2.5. Interobserver Concordance Study
2.6. Software and Statistical Analysis
2.7. Code Availability
3. Results
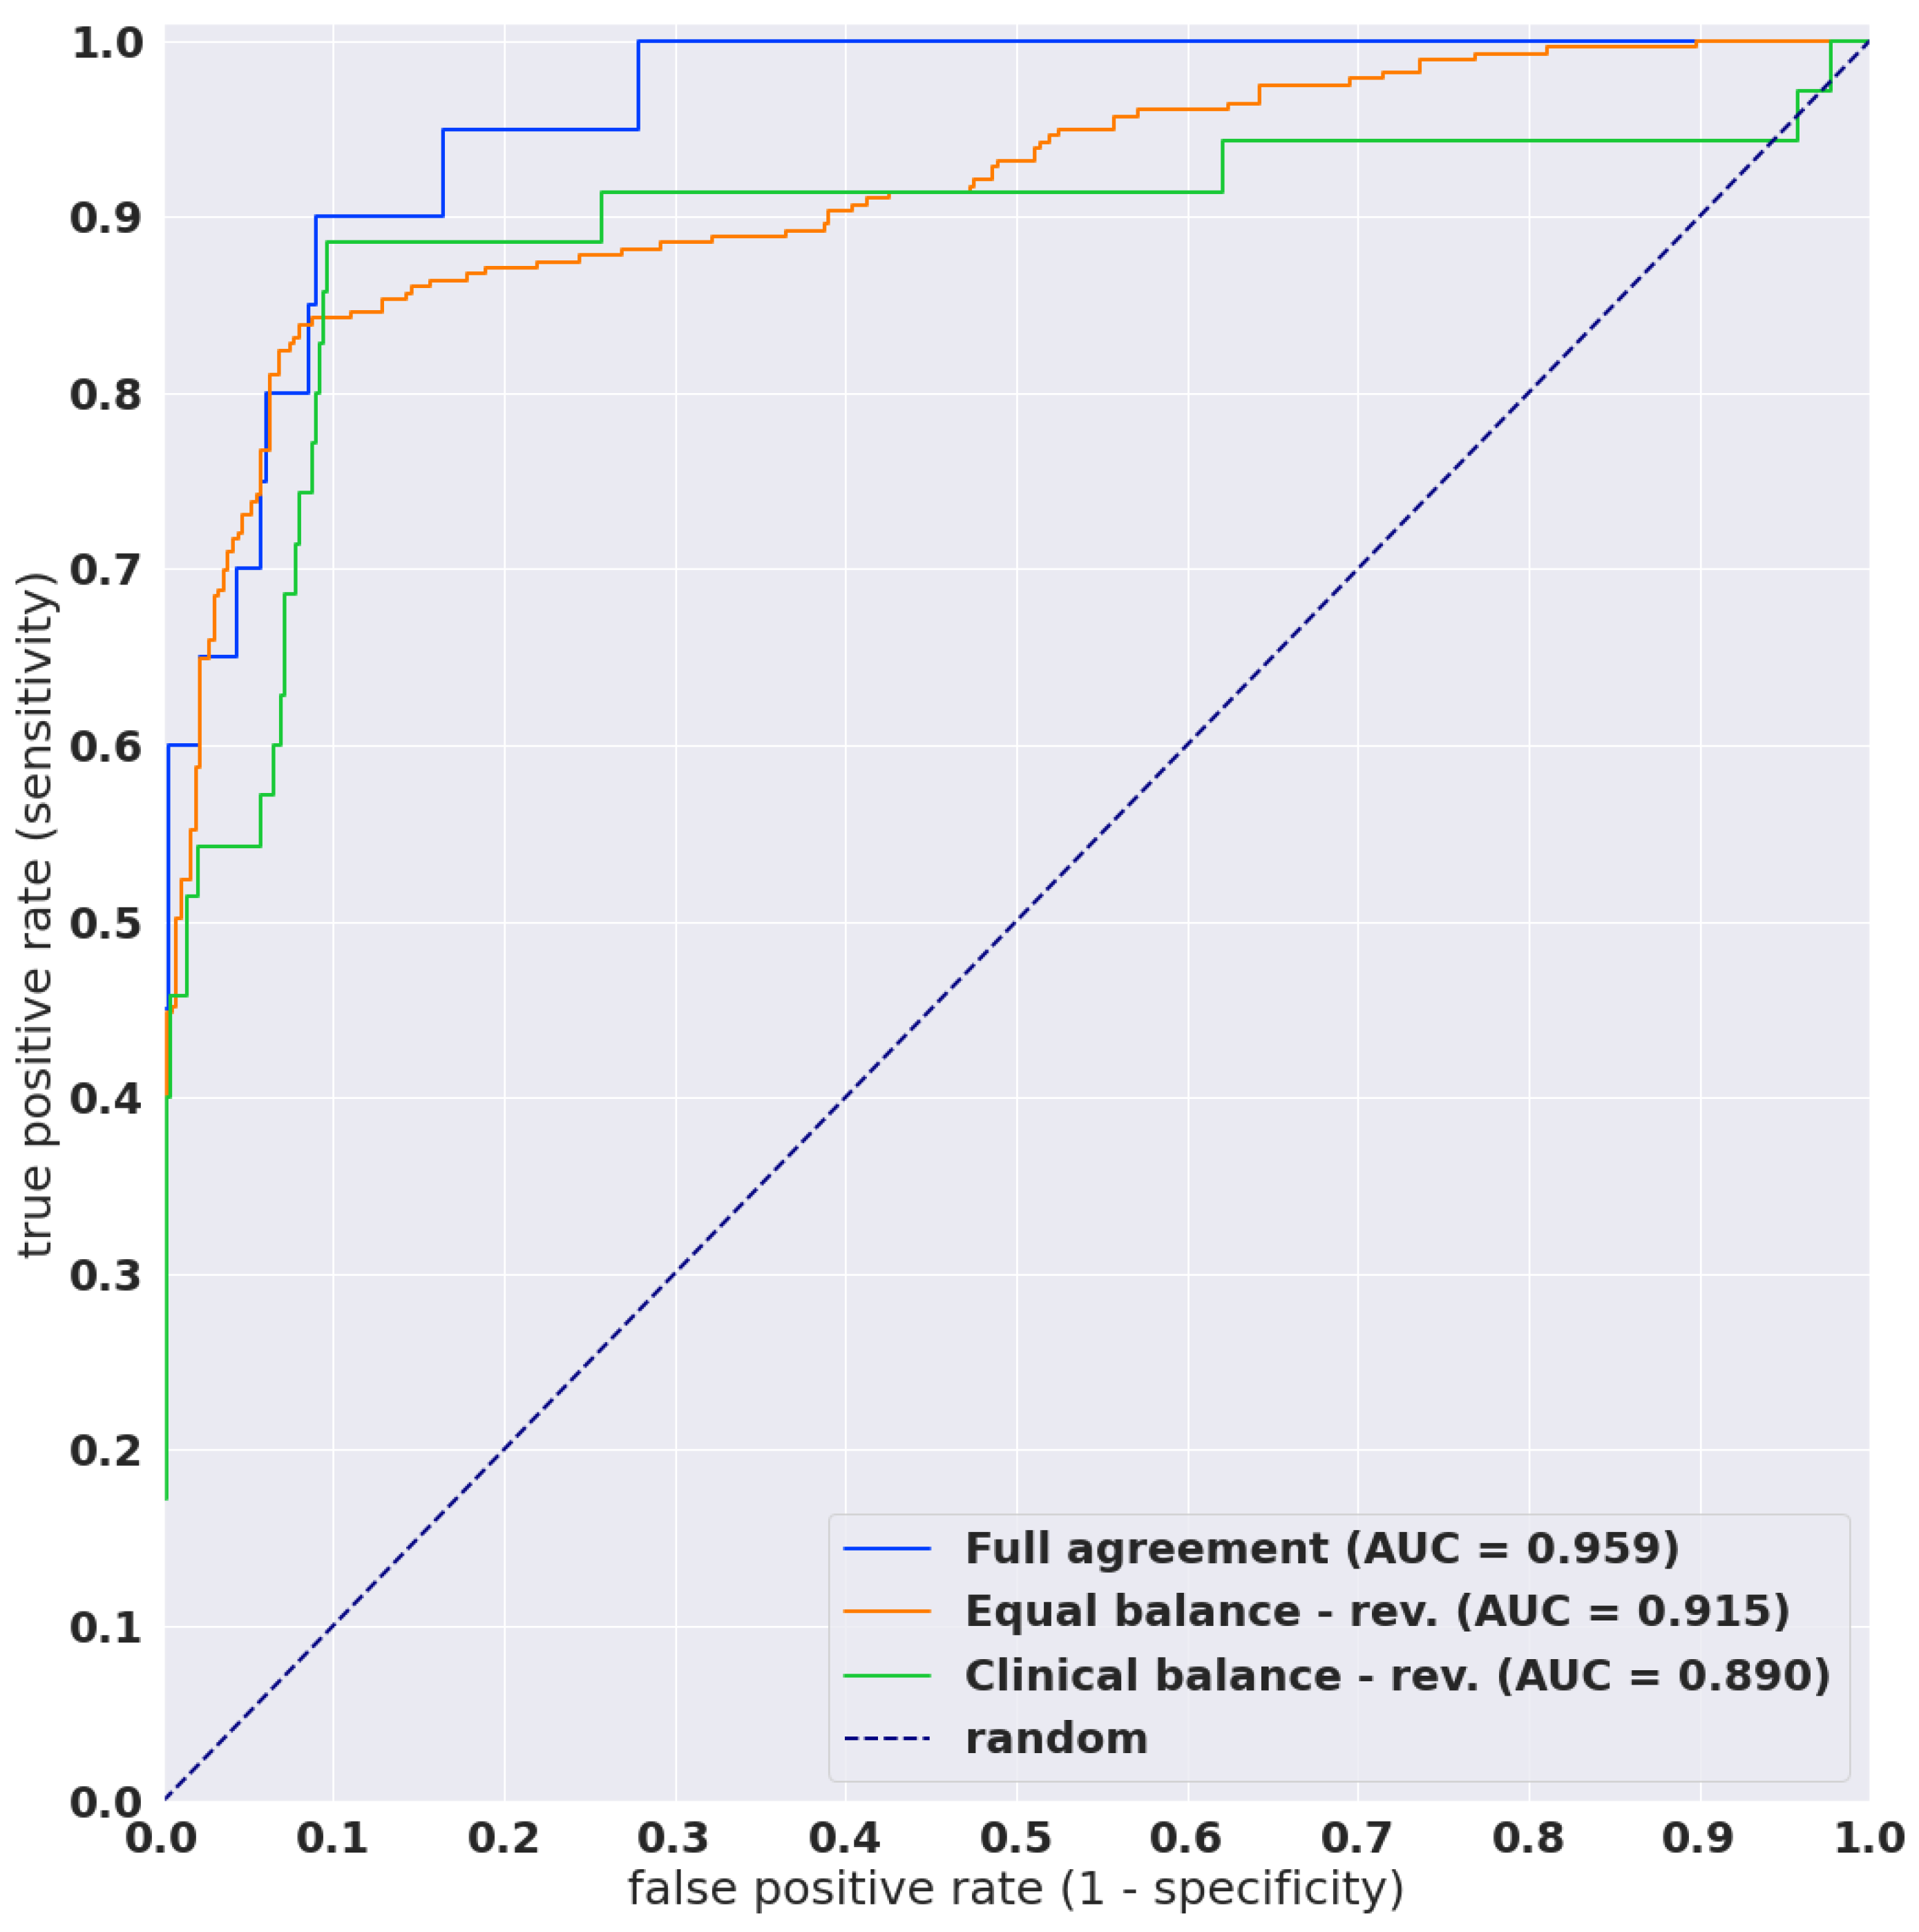
3.1. High AUC Performance of WSI Evaluation of Neoplastic Cervical Liquid-Based Cytology (LBC) Images
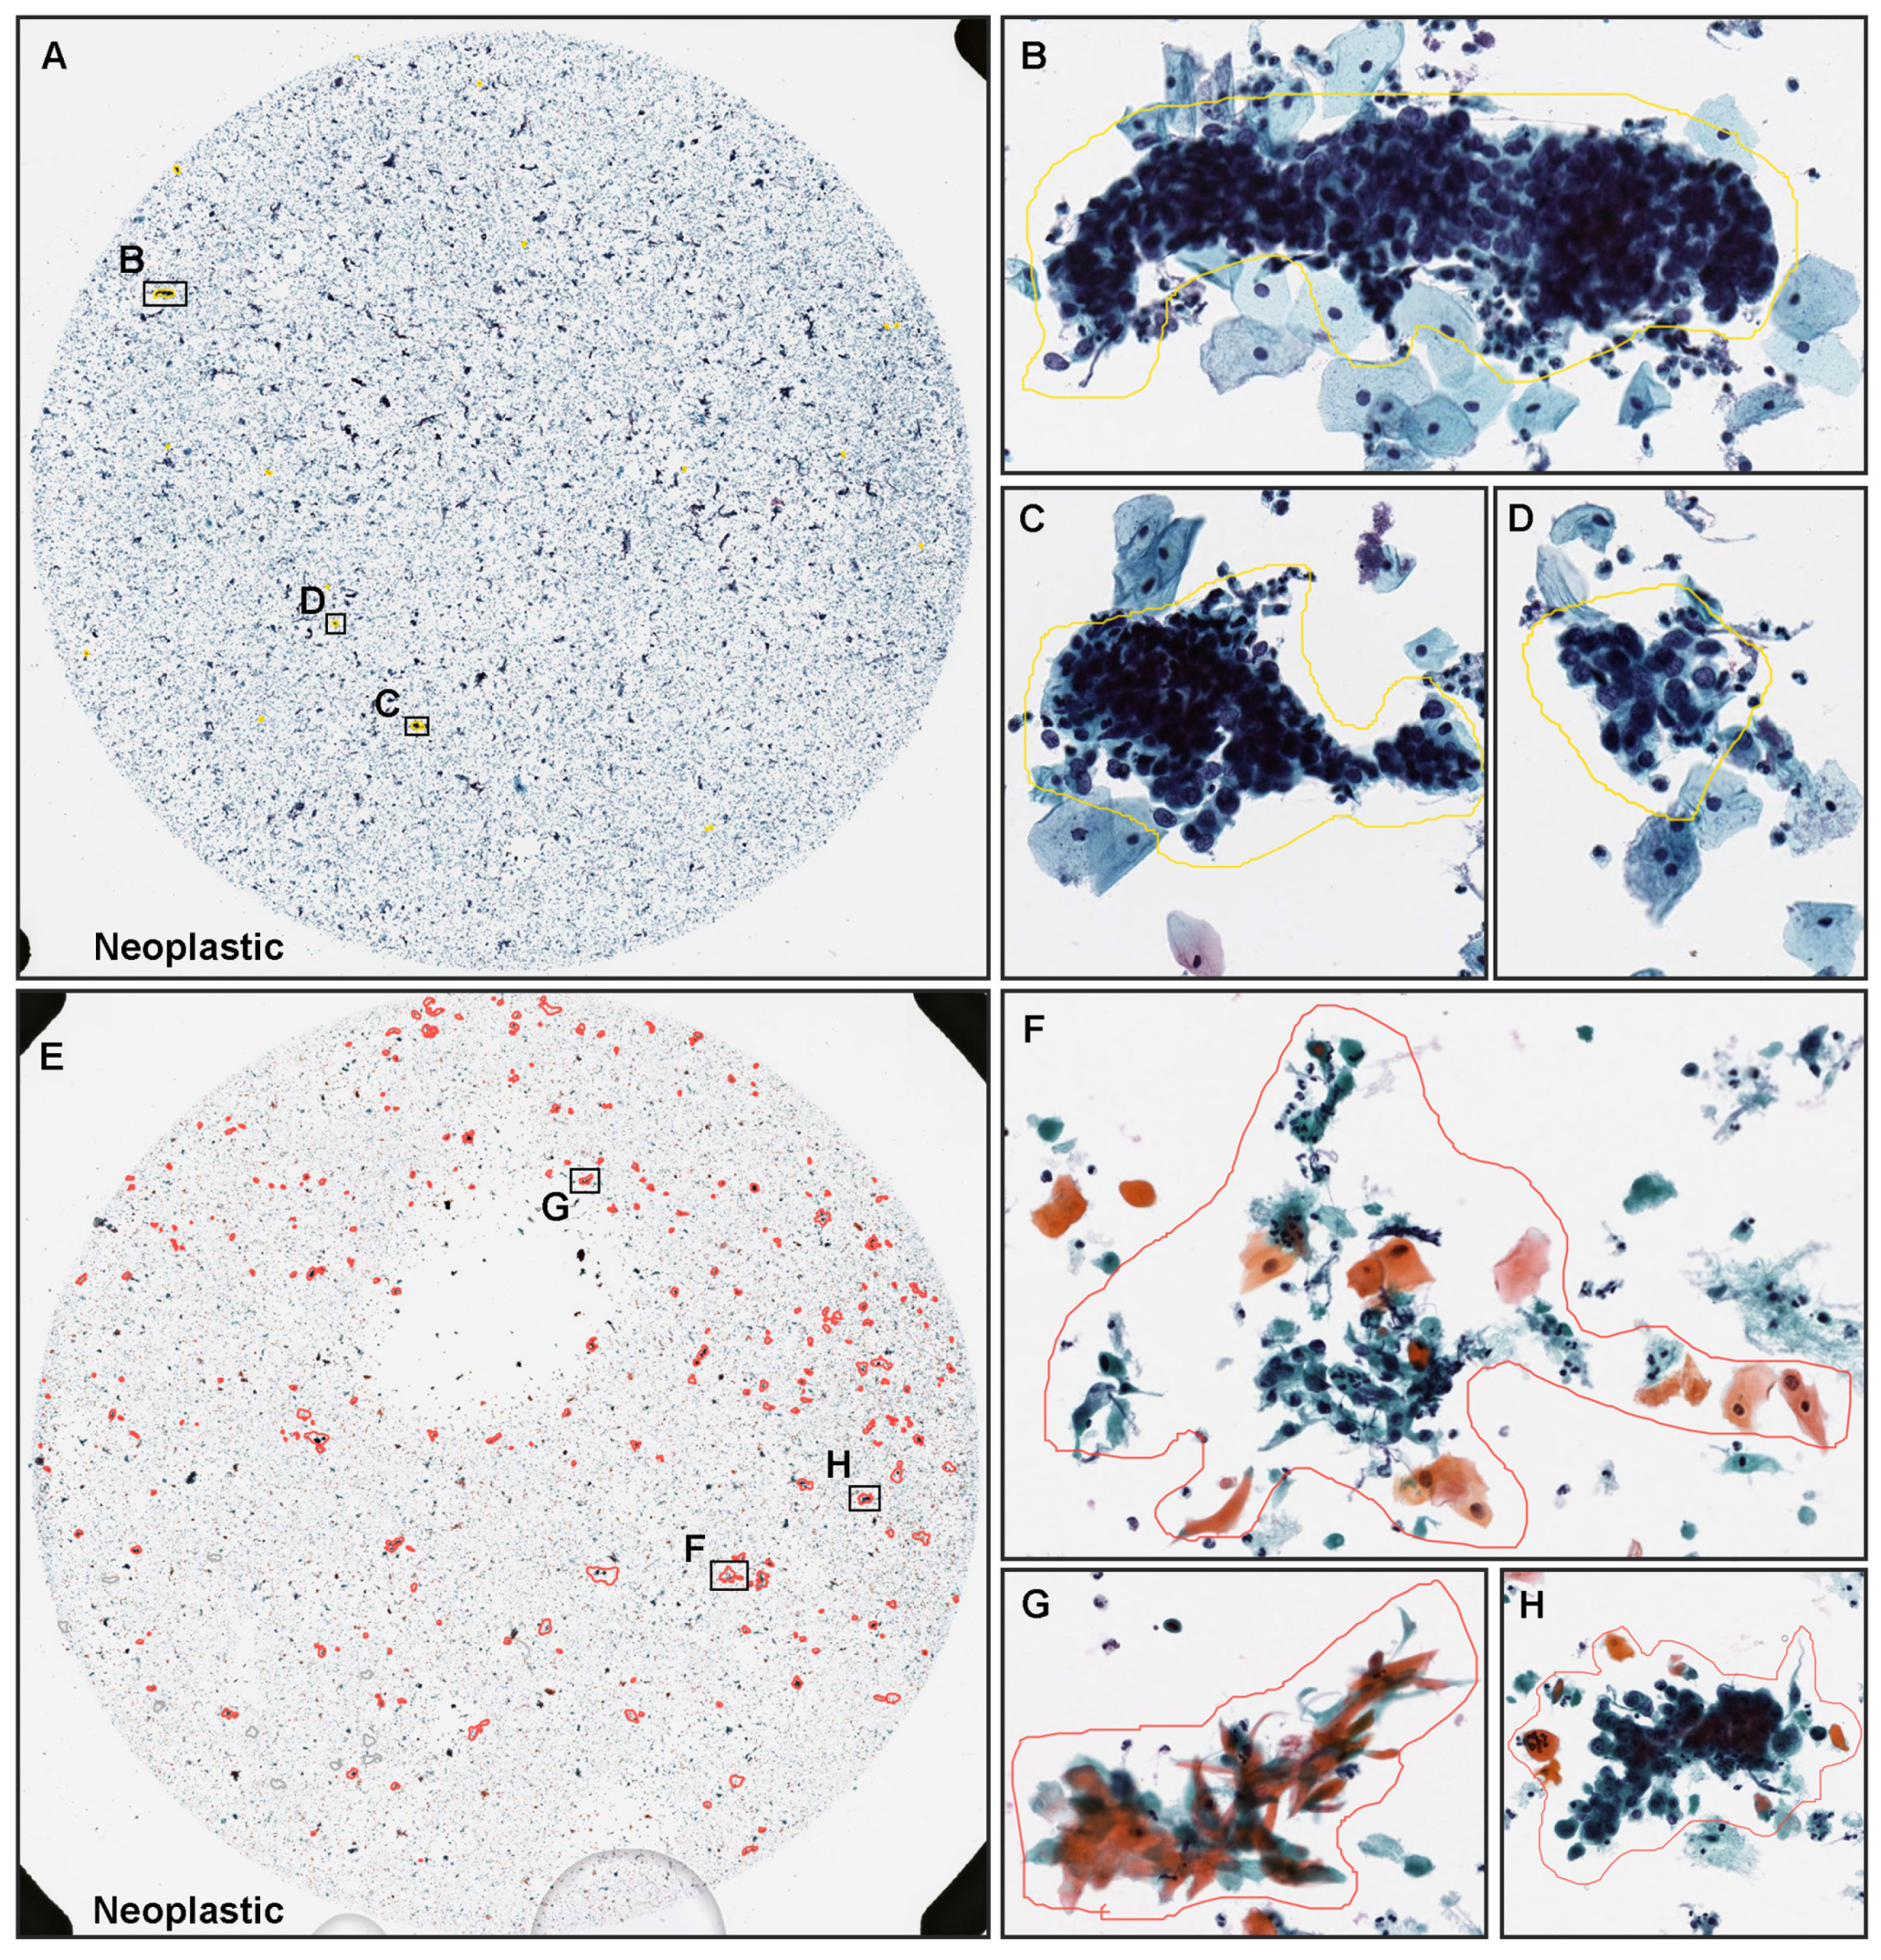
3.2. True Positive Prediction
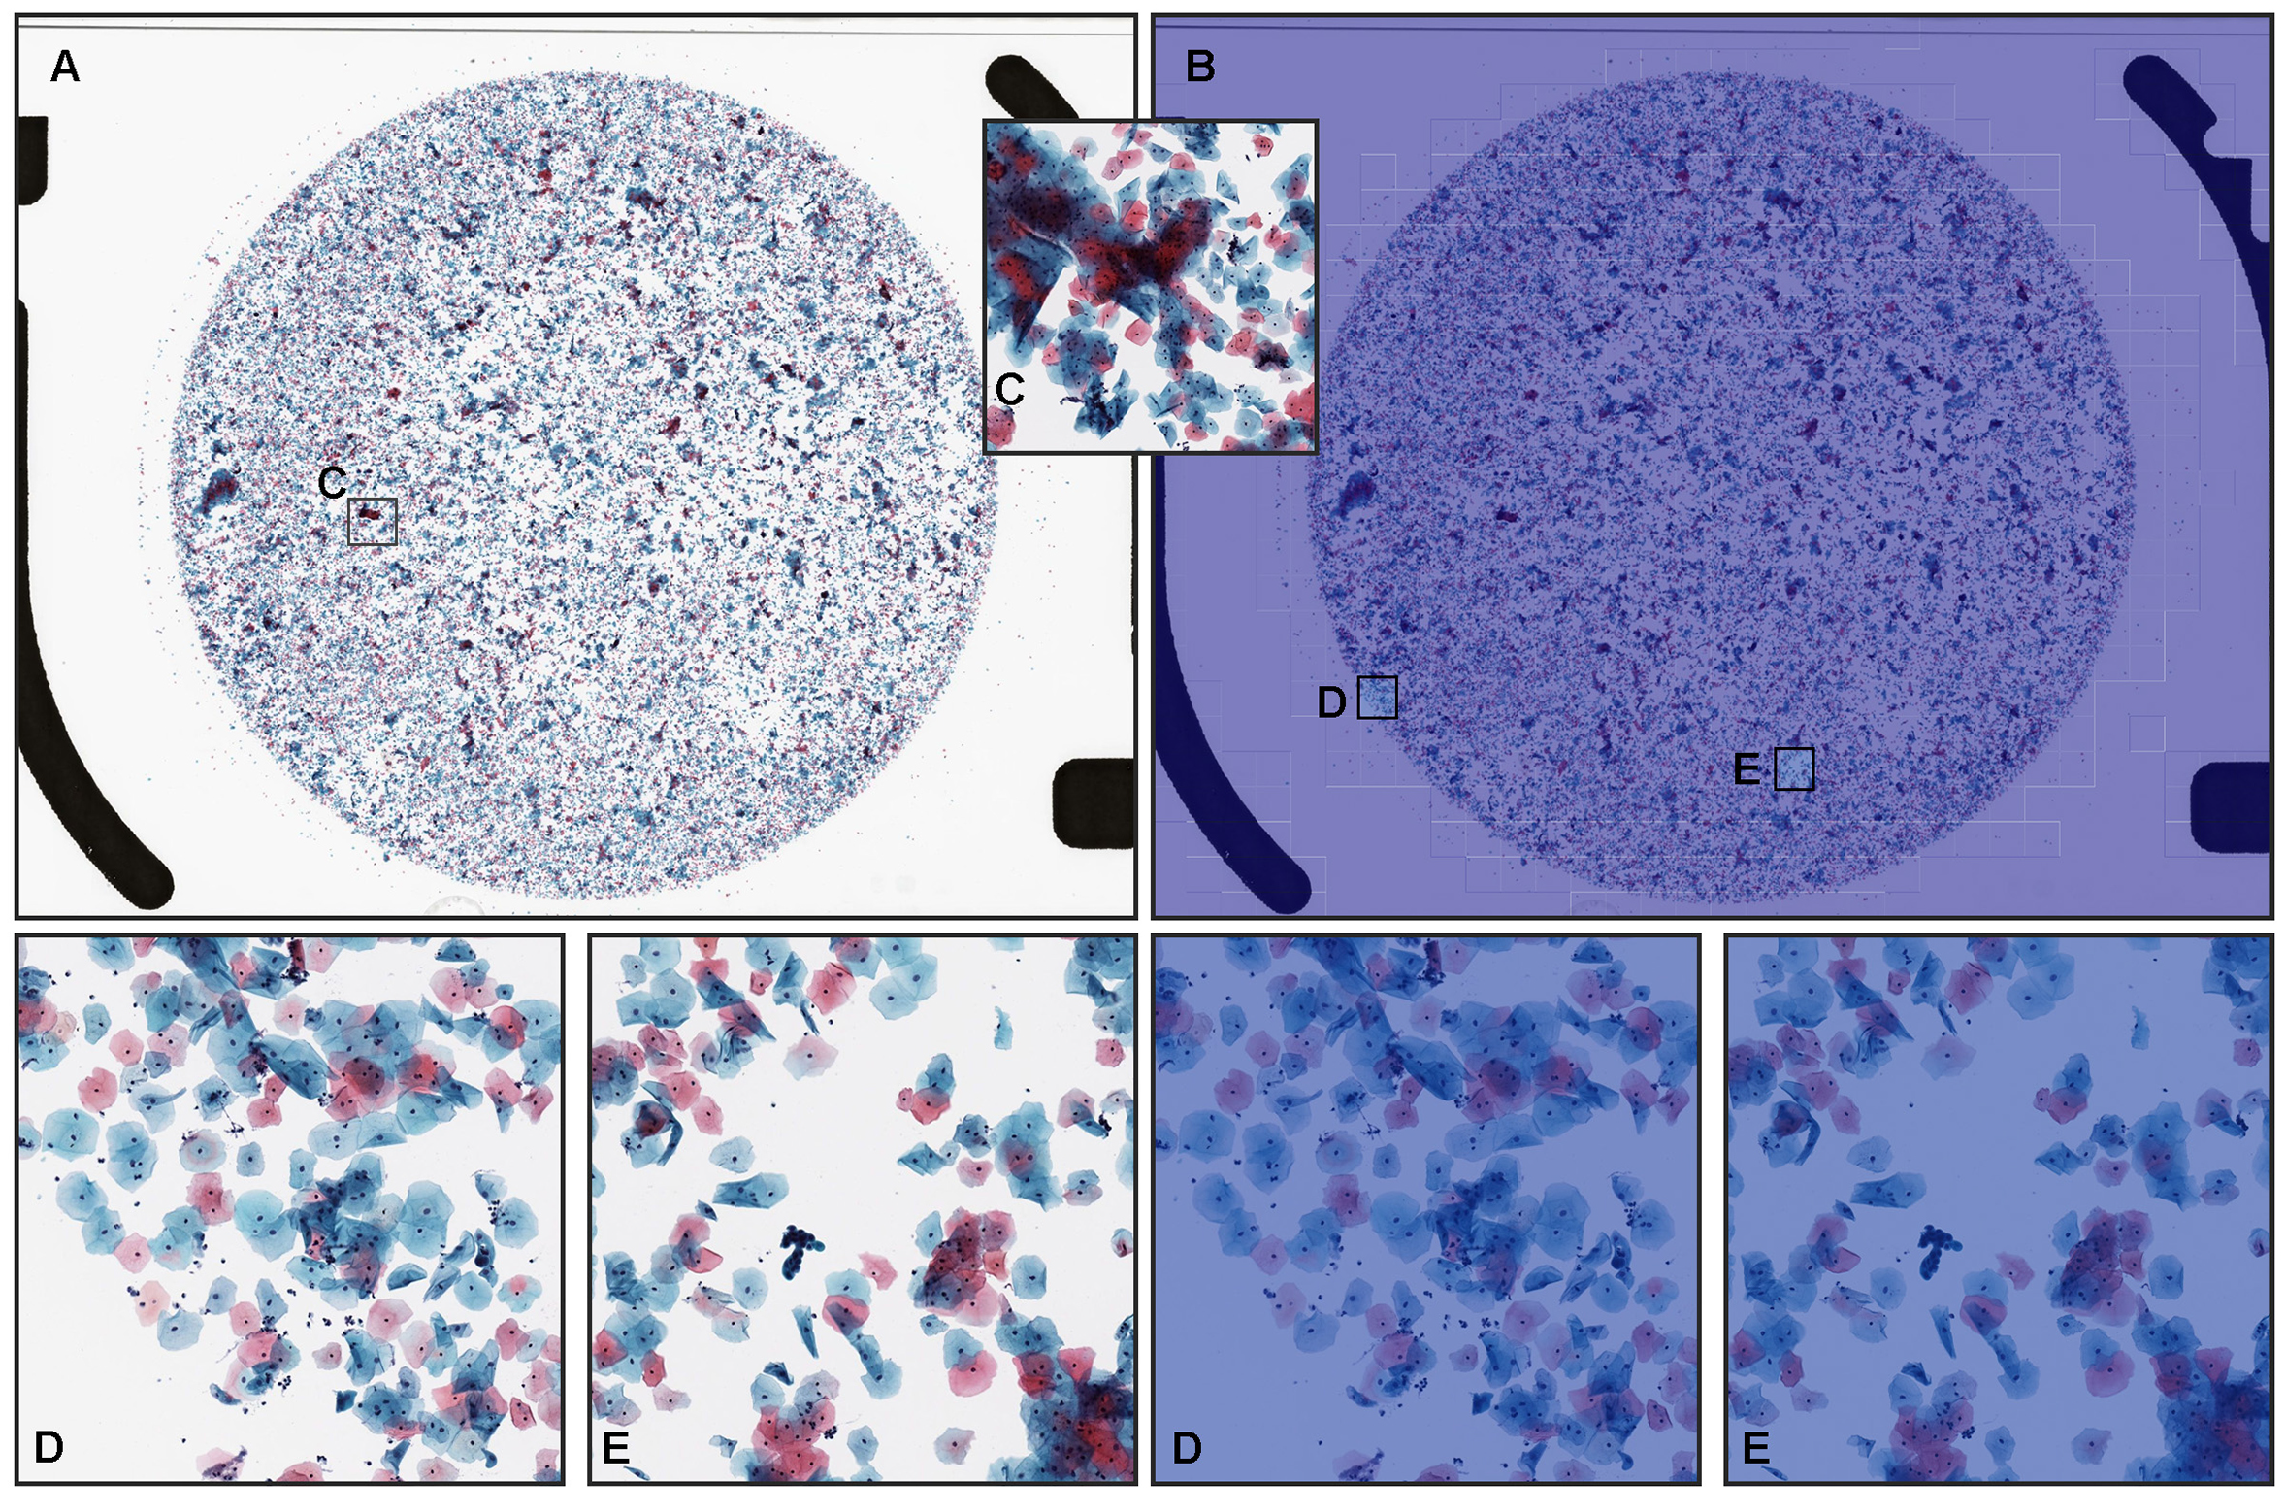
3.3. True Negative Prediction
3.4. False Positive Prediction
3.5. Interobserver Variability
4. Discussion
5. Conclusions
Author Contributions
Funding
Institutional Review Board Statement
Informed Consent Statement
Data Availability Statement
Acknowledgments
Conflicts of Interest
References
- Sung, H.; Ferlay, J.; Siegel, R.L.; Laversanne, M.; Soerjomataram, I.; Jemal, A.; Bray, F. Global cancer statistics 2020: GLOBOCAN estimates of incidence and mortality worldwide for 36 cancers in 185 countries. CA Cancer J. Clin. 2021, 71, 209–249. [Google Scholar] [CrossRef] [PubMed]
- Arbyn, M.; Anttila, A.; Jordan, J.; Ronco, G.; Schenck, U.; Segnan, N.; Wiener, H.; Herbert, A.; Von Karsa, L. European guidelines for quality assurance in cervical cancer screening.—Summary document. Ann. Oncol. 2010, 21, 448–458. [Google Scholar] [CrossRef] [PubMed]
- Wright, T.C.; Schiffman, M.; Solomon, D.; Cox, J.T.; Garcia, F.; Goldie, S.; Hatch, K.; Noller, K.L.; Roach, N.; Runowicz, C.; et al. Interim guidance for the use of human papillomavirus DNA testing as an adjunct to cervical cytology for screening. Obstet. Gynecol. 2004, 103, 304–309. [Google Scholar] [CrossRef] [PubMed]
- Wright, T.C., Jr.; Massad, L.S.; Dunton, C.J.; Spitzer, M.; Wilkinson, E.J.; Solomon, D. 2006 consensus guidelines for the management of women with abnormal cervical cancer screening tests. Am. J. Obstet. Gynecol. 2007, 197, 346–355. [Google Scholar] [CrossRef]
- Saslow, D.; Runowicz, C.D.; Solomon, D.; Moscicki, A.B.; Smith, R.A.; Eyre, H.J.; Cohen, C. American Cancer Society guideline for the early detection of cervical neoplasia and cancer. CA Cancer J. Clin. 2002, 52, 342–362. [Google Scholar] [CrossRef]
- Smith, R.A.; Andrews, K.S.; Brooks, D.; Fedewa, S.A.; Manassaram-Baptiste, D.; Saslow, D.; Wender, R.C. Cancer screening in the United States, 2019: A review of current American Cancer Society guidelines and current issues in cancer screening. CA Cancer J. Clin. 2019, 69, 184–210. [Google Scholar] [CrossRef]
- Sasieni, P.; Castanon, A.; Cuzick, J. Effectiveness of cervical screening with age: Population based case-control study of prospectively recorded data. BMJ 2009, 339, b2968. [Google Scholar] [CrossRef] [Green Version]
- Hamashima, C.; Aoki, D.; Miyagi, E.; Saito, E.; Nakayama, T.; Sagawa, M.; Saito, H.; Sobue, T. The Japanese guideline for cervical cancer screening. Jpn. J. Clin. Oncol. 2010, 40, 485–502. [Google Scholar] [CrossRef] [Green Version]
- ACOG, Committee on Practice Bulletins. ACOG Practice Bulletin Number 45, August 2003: Committee on Practice Bulletins-Gynecology. Cervical Cytology Screening. Obstet. Gynecol. 2003, 102, 417–427. [Google Scholar] [CrossRef]
- Anttila, A.; Pukkala, E.; Söderman, B.; Kallio, M.; Nieminen, P.; Hakama, M. Effect of organised screening on cervical cancer incidence and mortality in Finland, 1963–1995: Recent increase in cervical cancer incidence. Int. J. Cancer 1999, 83, 59–65. [Google Scholar] [CrossRef]
- McGoogan, E.; Reith, A. Would monolayers provide more representative samples and improved preparations for cervical screening? Overview and evaluation of systems available. Acta Cytol. 1996, 40, 107–119. [Google Scholar] [CrossRef]
- Fahey, M.T.; Irwig, L.; Macaskill, P. Meta-analysis of Pap test accuracy. Am. J. Epidemiol. 1995, 141, 680–689. [Google Scholar] [CrossRef] [PubMed]
- Solomon, D.; Schiffman, M.; Tarone, R. Comparison of three management strategies for patients with atypical squamous cells of undetermined significance: Baseline results from a randomized trial. J. Natl. Cancer Inst. 2001, 93, 293–299. [Google Scholar] [CrossRef] [PubMed]
- Lee, J.; Kuan, L.; Oh, S.; Patten, F.W.; Wilbur, D.C. A feasibility study of the AutoPap system location-guided screening. Acta Cytol. 1998, 42, 221–226. [Google Scholar] [CrossRef] [PubMed]
- Elsheikh, T.M.; Austin, R.M.; Chhieng, D.F.; Miller, F.S.; Moriarty, A.T.; Renshaw, A.A. American society of cytopathology workload recommendations for automated pap test screening: Developed by the productivity and quality assurance in the era of automated screening task force. Diagn. Cytopathol. 2013, 41, 174–178. [Google Scholar] [CrossRef]
- Sugiyama, Y.; Sasaki, H.; Komatsu, K.; Yabushita, R.; Oda, M.; Yanoh, K.; Ueda, M.; Itamochi, H.; Okugawa, K.; Fujita, H.; et al. A multi-institutional feasibility study on the use of automated screening systems for quality control rescreening of cervical cytology. Acta Cytol. 2016, 60, 451–457. [Google Scholar] [CrossRef]
- Colgan, T.; Patten, S., Jr.; Lee, J. A clinical trial of the AutoPap 300 QC system for quality control of cervicovaginal cytology in the clinical laboratory. Acta Cytol. 1995, 39, 1191–1198. [Google Scholar]
- Patten, S.F., Jr.; Lee, J.S.; Wilbur, D.C.; Bonfiglio, T.A.; Colgan, T.J.; Richart, R.M.; Cramer, H.; Moinuddin, S. The AutoPap 300 QC System multicenter clinical trials for use in quality control rescreening of cervical smears: I. A prospective intended use study. Cancer Cytopathol. Interdiscip. Int. J. Am. Cancer Soc. 1997, 81, 337–342. [Google Scholar] [CrossRef]
- Marshall, C.J.; Rowe, L.; Bentz, J.S. Improved quality-control detection of false-negative pap smears using the Autopap 300 QC system. Diagn. Cytopathol. 1999, 20, 170–174. [Google Scholar] [CrossRef]
- Saieg, M.A.; Motta, T.H.; Fodra, M.E.; Scapulatempo, C.; Longatto-Filho, A.; Stiepcich, M.M. Automated screening of conventional gynecological cytology smears: Feasible and reliable. Acta Cytol. 2014, 58, 378–382. [Google Scholar] [CrossRef]
- Nanda, K.; McCrory, D.C.; Myers, E.R.; Bastian, L.A.; Hasselblad, V.; Hickey, J.D.; Matchar, D.B. Accuracy of the Papanicolaou test in screening for and follow-up of cervical cytologic abnormalities: A systematic review. Ann. Intern. Med. 2000, 132, 810–819. [Google Scholar] [CrossRef] [PubMed]
- Krane, J.F.; Granter, S.R.; Trask, C.E.; Hogan, C.L.; Lee, K.R. Papanicolaou smear sensitivity for the detection of adenocarcinoma of the cervix: A study of 49 cases. Cancer Cytopathol. 2001, 93, 8–15. [Google Scholar] [CrossRef]
- Stoler, M.H.; Schiffman, M. Interobserver reproducibility of cervical cytologic and histologic interpretations: Realistic estimates from the ASCUS-LSIL Triage Study. JAMA 2001, 285, 1500–1505. [Google Scholar] [CrossRef] [PubMed] [Green Version]
- Mukhopadhyay, S.; Feldman, M.D.; Abels, E.; Ashfaq, R.; Beltaifa, S.; Cacciabeve, N.G.; Cathro, H.P.; Cheng, L.; Cooper, K.; Dickey, G.E.; et al. Whole slide imaging versus microscopy for primary diagnosis in surgical pathology: A multicenter blinded randomized noninferiority study of 1992 cases (pivotal study). Am. J. Surg. Pathol. 2018, 42, 39. [Google Scholar] [CrossRef]
- Lahrmann, B.; Valous, N.A.; Eisenmann, U.; Wentzensen, N.; Grabe, N. Semantic focusing allows fully automated single-layer slide scanning of cervical cytology slides. PLoS ONE 2013, 8, e61441. [Google Scholar] [CrossRef] [Green Version]
- Song, Y.; Zhang, L.; Chen, S.; Ni, D.; Li, B.; Zhou, Y.; Lei, B.; Wang, T. A deep learning based framework for accurate segmentation of cervical cytoplasm and nuclei. In Proceedings of the 2014 36th Annual International Conference of the IEEE Engineering in Medicine and Biology Society, Chicago, IL, USA, 26–30 August 2014; pp. 2903–2906. [Google Scholar]
- Yu, K.H.; Zhang, C.; Berry, G.J.; Altman, R.B.; Ré, C.; Rubin, D.L.; Snyder, M. Predicting non-small cell lung cancer prognosis by fully automated microscopic pathology image features. Nat. Commun. 2016, 7, 12474. [Google Scholar] [CrossRef] [Green Version]
- Hou, L.; Samaras, D.; Kurc, T.M.; Gao, Y.; Davis, J.E.; Saltz, J.H. Patch-based convolutional neural network for whole slide tissue image classification. In Proceedings of the IEEE Conference on Computer Vision and Pattern Recognition, Las Vegas, NV, USA, 27–30 June 2016; pp. 2424–2433. [Google Scholar]
- Litjens, G.; Sánchez, C.I.; Timofeeva, N.; Hermsen, M.; Nagtegaal, I.; Kovacs, I.; Hulsbergen-Van De Kaa, C.; Bult, P.; Van Ginneken, B.; Van Der Laak, J. Deep learning as a tool for increased accuracy and efficiency of histopathological diagnosis. Sci. Rep. 2016, 6, 26286. [Google Scholar] [CrossRef] [Green Version]
- Kraus, O.Z.; Ba, J.L.; Frey, B.J. Classifying and segmenting microscopy images with deep multiple instance learning. Bioinformatics 2016, 32, i52–i59. [Google Scholar] [CrossRef]
- Korbar, B.; Olofson, A.M.; Miraflor, A.P.; Nicka, C.M.; Suriawinata, M.A.; Torresani, L.; Suriawinata, A.A.; Hassanpour, S. Deep learning for classification of colorectal polyps on whole-slide images. J. Pathol. Inform. 2017, 8, 30. [Google Scholar]
- Zhang, L.; Sonka, M.; Lu, L.; Summers, R.M.; Yao, J. Combining fully convolutional networks and graph-based approach for automated segmentation of cervical cell nuclei. In Proceedings of the 2017 IEEE 14th International Symposium on Biomedical Imaging (ISBI 2017), Melbourne, VIC, Australia, 18–21 April 2017; pp. 406–409. [Google Scholar]
- Luo, X.; Zang, X.; Yang, L.; Huang, J.; Liang, F.; Rodriguez-Canales, J.; Wistuba, I.I.; Gazdar, A.; Xie, Y.; Xiao, G. Comprehensive computational pathological image analysis predicts lung cancer prognosis. J. Thorac. Oncol. 2017, 12, 501–509. [Google Scholar] [CrossRef] [Green Version]
- Coudray, N.; Ocampo, P.S.; Sakellaropoulos, T.; Narula, N.; Snuderl, M.; Fenyö, D.; Moreira, A.L.; Razavian, N.; Tsirigos, A. Classification and mutation prediction from non–small cell lung cancer histopathology images using deep learning. Nat. Med. 2018, 24, 1559–1567. [Google Scholar] [CrossRef] [PubMed]
- Wei, J.W.; Tafe, L.J.; Linnik, Y.A.; Vaickus, L.J.; Tomita, N.; Hassanpour, S. Pathologist-level classification of histologic patterns on resected lung adenocarcinoma slides with deep neural networks. Sci. Rep. 2019, 9, 3358. [Google Scholar] [CrossRef] [PubMed] [Green Version]
- Jith, O.N.; Harinarayanan, K.; Gautam, S.; Bhavsar, A.; Sao, A.K. DeepCerv: Deep neural network for segmentation free robust cervical cell classification. In Computational Pathology and Ophthalmic Medical Image Analysis; Springer: Berlin/Heidelberg, Germany, 2018; pp. 86–94. [Google Scholar]
- Lin, H.; Hu, Y.; Chen, S.; Yao, J.; Zhang, L. Fine-grained classification of cervical cells using morphological and appearance based convolutional neural networks. IEEE Access 2019, 7, 71541–71549. [Google Scholar] [CrossRef]
- Gupta, M.; Das, C.; Roy, A.; Gupta, P.; Pillai, G.R.; Patole, K. Region of interest identification for cervical cancer images. In Proceedings of the 2020 IEEE 17th International Symposium on Biomedical Imaging (ISBI), Iowa City, IA, USA, 3–7 April 2020; pp. 1293–1296. [Google Scholar]
- Chen, H.; Liu, J.; Wen, Q.M.; Zuo, Z.Q.; Liu, J.S.; Feng, J.; Pang, B.C.; Xiao, D. CytoBrain: Cervical cancer screening system based on deep learning technology. J. Comput. Sci. Technol. 2021, 36, 347–360. [Google Scholar] [CrossRef]
- Gertych, A.; Swiderska-Chadaj, Z.; Ma, Z.; Ing, N.; Markiewicz, T.; Cierniak, S.; Salemi, H.; Guzman, S.; Walts, A.E.; Knudsen, B.S. Convolutional neural networks can accurately distinguish four histologic growth patterns of lung adenocarcinoma in digital slides. Sci. Rep. 2019, 9, 1483. [Google Scholar] [CrossRef]
- Bejnordi, B.E.; Veta, M.; Van Diest, P.J.; Van Ginneken, B.; Karssemeijer, N.; Litjens, G.; Van Der Laak, J.A.; Hermsen, M.; Manson, Q.F.; Balkenhol, M.; et al. Diagnostic assessment of deep learning algorithms for detection of lymph node metastases in women with breast cancer. JAMA 2017, 318, 2199–2210. [Google Scholar] [CrossRef]
- Saltz, J.; Gupta, R.; Hou, L.; Kurc, T.; Singh, P.; Nguyen, V.; Samaras, D.; Shroyer, K.R.; Zhao, T.; Batiste, R.; et al. Spatial organization and molecular correlation of tumor-infiltrating lymphocytes using deep learning on pathology images. Cell Rep. 2018, 23, 181–193. [Google Scholar] [CrossRef] [PubMed] [Green Version]
- Campanella, G.; Hanna, M.G.; Geneslaw, L.; Miraflor, A.; Silva, V.W.K.; Busam, K.J.; Brogi, E.; Reuter, V.E.; Klimstra, D.S.; Fuchs, T.J. Clinical-grade computational pathology using weakly supervised deep learning on whole slide images. Nat. Med. 2019, 25, 1301–1309. [Google Scholar] [CrossRef]
- Iizuka, O.; Kanavati, F.; Kato, K.; Rambeau, M.; Arihiro, K.; Tsuneki, M. Deep learning models for histopathological classification of gastric and colonic epithelial tumours. Sci. Rep. 2020, 10, 1504. [Google Scholar] [CrossRef] [Green Version]
- Holmström, O.; Linder, N.; Kaingu, H.; Mbuuko, N.; Mbete, J.; Kinyua, F.; Törnquist, S.; Muinde, M.; Krogerus, L.; Lundin, M.; et al. Point-of-Care Digital Cytology With Artificial Intelligence for Cervical Cancer Screening in a Resource-Limited Setting. JAMA Netw. Open 2021, 4, e211740. [Google Scholar] [CrossRef]
- Lin, H.; Chen, H.; Wang, X.; Wang, Q.; Wang, L.; Heng, P.A. Dual-path network with synergistic grouping loss and evidence driven risk stratification for whole slide cervical image analysis. Med. Image Anal. 2021, 69, 101955. [Google Scholar] [CrossRef] [PubMed]
- Cheng, S.; Liu, S.; Yu, J.; Rao, G.; Xiao, Y.; Han, W.; Zhu, W.; Lv, X.; Li, N.; Cai, J.; et al. Robust whole slide image analysis for cervical cancer screening using deep learning. Nat. Commun. 2021, 12, 5639. [Google Scholar] [CrossRef] [PubMed]
- Li, W.; Liu, L.L.; Luo, Z.Z.; Han, C.Y.; Wu, Q.H.; Zhang, L.; Tian, L.S.; Yuan, J.; Zhang, T.; Chen, Z.W.; et al. Associations of sexually transmitted infections and bacterial vaginosis with abnormal cervical cytology: A cross-sectional survey with 9090 community women in China. PLoS ONE 2020, 15, e0230712. [Google Scholar] [CrossRef] [PubMed]
- Duby, J.M.; DiFurio, M.J. Implementation of the ThinPrep Imaging System in a tertiary military medical center. Cancer Cytopathol. J. Am. Cancer Soc. 2009, 117, 264–270. [Google Scholar] [CrossRef] [PubMed]
- Tan, M.; Le, Q. Efficientnet: Rethinking model scaling for convolutional neural networks. In Proceedings of the International Conference on Machine Learning, Long Beach, CA, USA, 9–15 June 2019; pp. 6105–6114. [Google Scholar]
- Cho, K.; Van Merriënboer, B.; Bahdanau, D.; Bengio, Y. On the properties of neural machine translation: Encoder-decoder approaches. arXiv 2014, arXiv:1409.1259. [Google Scholar]
- Kanavati, F.; Tsuneki, M. Partial transfusion: On the expressive influence of trainable batch norm parameters for transfer learning. arXiv 2021, arXiv:2102.05543. [Google Scholar]
- Otsu, N. A threshold selection method from gray-level histograms. IEEE Trans. Syst. Man, Cybern. 1979, 9, 62–66. [Google Scholar] [CrossRef] [Green Version]
- Goode, A.; Gilbert, B.; Harkes, J.; Jukic, D.; Satyanarayanan, M. OpenSlide: A vendor-neutral software foundation for digital pathology. J. Pathol. Inform. 2013, 4, 27. [Google Scholar]
- Kingma, D.P.; Ba, J. Adam: A method for stochastic optimization. arXiv 2014, arXiv:1412.6980. [Google Scholar]
- Abadi, M.; Agarwal, A.; Barham, P.; Brevdo, E.; Chen, Z.; Citro, C.; Corrado, G.S.; Davis, A.; Dean, J.; Devin, M.; et al. TensorFlow: Large-Scale Machine Learning on Heterogeneous Systems. 2015. Available online: tensorflow.org (accessed on 3 February 2019).
- Artstein, R.; Poesio, M. Inter-coder agreement for computational linguistics. Comput. Linguist. 2008, 34, 555–596. [Google Scholar] [CrossRef] [Green Version]
- Pedregosa, F.; Varoquaux, G.; Gramfort, A.; Michel, V.; Thirion, B.; Grisel, O.; Blondel, M.; Prettenhofer, P.; Weiss, R.; Dubourg, V.; et al. Scikit-learn: Machine learning in Python. J. Mach. Learn. Res. 2011, 12, 2825–2830. [Google Scholar]
- Hunter, J.D. Matplotlib: A 2D graphics environment. Comput. Sci. Eng. 2007, 9, 90–95. [Google Scholar] [CrossRef]
- Efron, B.; Tibshirani, R.J. An Introduction to the Bootstrap; CRC Press: Boca Raton, FL, USA, 1994. [Google Scholar]
- Troni, G.M.; Cariaggi, M.P.; Bulgaresi, P.; Houssami, N.; Ciatto, S. Reliability of sparing Papanicolaou test conventional reading in cases reported as no further review at AutoPap-assisted cytological screening: Survey of 30,658 cases with follow-up cytological screening. Cancer Cytopathol. Interdiscip. Int. J. Am. Cancer Soc. 2007, 111, 93–98. [Google Scholar] [CrossRef] [PubMed]
- Wilbur, D.C.; Black-Schaffer, W.S.; Luff, R.D.; Abraham, K.P.; Kemper, C.; Molina, J.T.; Tench, W.D. The Becton Dickinson FocalPoint GS Imaging System: Clinical trials demonstrate significantly improved sensitivity for the detection of important cervical lesions. Am. J. Clin. Pathol. 2009, 132, 767–775. [Google Scholar] [CrossRef] [Green Version]
- Wilbur, D.C.; Prey, M.U.; Miller, W.M.; Pawlick, G.F.; Colgan, T.J. The AutoPap system for primary screening in cervical cytology. Comparing the results of a prospective, intended-use study with routine manual practice. Acta Cytol. 1998, 42, 214–220. [Google Scholar] [CrossRef] [PubMed]
- Biscotti, C.V.; Dawson, A.E.; Dziura, B.; Galup, L.; Darragh, T.; Rahemtulla, A.; Wills-Frank, L. Assisted primary screening using the automated ThinPrep Imaging System. Am. J. Clin. Pathol. 2005, 123, 281–287. [Google Scholar] [CrossRef] [PubMed]
- Bolger, N.; Heffron, C.; Regan, I.; Sweeney, M.; Kinsella, S.; McKeown, M.; Creighton, G.; Russell, J.; O’Leary, J. Implementation and evaluation of a new automated interactive image analysis system. Acta Cytol. 2006, 50, 483–491. [Google Scholar] [CrossRef]


| Total | Neoplastic | NILM | |
|---|---|---|---|
| training | 1503 | 302 | 1201 |
| validation | 150 | 50 | 100 |
| test: full agreement | 300 | 20 | 280 |
| test: equal balance | 750 | 375 | 375 |
| test: equal balance-rev. | 643 | 279 | 364 |
| test: clinical balance | 750 | 38 | 712 |
| test: clinical balance-rev. | 525 | 35 | 490 |
| Full Agreement | Clinical Balance | Clinical Balance-rev. | Equal Balance | Equal Balance-rev. | |
|---|---|---|---|---|---|
| ROC AUC | 0.960 [0.921–0.988] | 0.774 [0.679–0.841] | 0.890 [0.808–0.963] | 0.827 [0.795–0.852] | 0.915 [0.892–0.937] |
| log loss | 2.244 [2.021–2.458] | 2.272 [2.141–2.412] | 1.347 [1.238–1.465] | 1.126 [0.994–1.264] | 0.913 [0.794–1.055] |
| accuracy | 0.907 [0.873–0.937] | 0.629 [0.591–0.660] | 0.903 [0.876–0.924] | 0.759 [0.725–0.785] | 0.885 [0.859–0.908] |
| sensitivity | 0.850 [0.667–1.000] | 0.816 [0.686–0.923] | 0.886 [0.774–0.978] | 0.624 [0.573–0.668] | 0.839 [0.794–0.880] |
| specificity | 0.911 [0.877–0.942] | 0.619 [0.579–0.652] | 0.904 [0.877–0.926] | 0.893 [0.862–0.924] | 0.920 [0.890–0.945] |
| Predicted Label | ||||
|---|---|---|---|---|
| NILM | Neoplastic | |||
| Full agreement | True label | NILM | 255 | 25 |
| Neoplastic | 3 | 17 | ||
| Clinical balance | True label | NILM | 441 | 271 |
| Neoplastic | 7 | 31 | ||
| Clinical balance-rev. | True label | NILM | 443 | 47 |
| Neoplastic | 4 | 31 | ||
| Equal balance | True label | NILM | 335 | 40 |
| Neoplastic | 141 | 234 | ||
| Equal balance-rev. | True label | NILM | 335 | 29 |
| Neoplastic | 45 | 234 | ||
| Age | Exp. (Years) | Case 1 | Case 2 | Case 3 | Case 4 | Case 5 | Case 6 | Case 7 | Case 8 | Case 9 | Case 10 | |
|---|---|---|---|---|---|---|---|---|---|---|---|---|
| Dx | NILM | NILM | NILM | NILM | NILM | NILM | NILM | NILM | HSIL | LSIL | ||
| 30s | ≥10 | CS1 | NILM | NILM | NILM | NILM | NILM | NILM | NILM | NILM | HSIL | ASC-H |
| 50s | CS2 | NILM | NILM | NILM | ASC-H | NILM | NILM | HSIL | ASC-H | HSIL | HSIL | |
| 50s | CS3 | NILM | NILM | NILM | NILM | NILM | NILM | NILM | ASC-US | HSIL | LSIL | |
| 40s | CS4 | NILM | NILM | NILM | ASC-US | NILM | NILM | NILM | ASC-US | HSIL | SCC | |
| 30s | CS5 | NILM | NILM | NILM | NILM | NILM | NILM | NILM | NILM | HSIL | ASC-US | |
| 30s | CS6 | NILM | ASC-US | NILM | NILM | NILM | NILM | NILM | NILM | HSIL | HSIL | |
| 60s | CS7 | NILM | NILM | NILM | NILM | NILM | NILM | NILM | NILM | HSIL | ASC-H | |
| 40s | CS8 | NILM | NILM | NILM | NILM | NILM | NILM | NILM | NILM | HSIL | ASC-US | |
| 20s | <10 | CS9 | NILM | NILM | NILM | NILM | NILM | NILM | NILM | NILM | HSIL | LSIL |
| 20s | CS10 | NILM | NILM | NILM | NILM | NILM | NILM | NILM | NILM | LSIL | LSIL | |
| 30s | CS11 | NILM | NILM | NILM | NILM | ASC-H | NILM | NILM | HSIL | LSIL | HSIL | |
| 20s | CS12 | NILM | ASC-US | ASC-H | NILM | NILM | NILM | NILM | LSIL | SCC | HSIL | |
| 40s | CS13 | NILM | NILM | HSIL | NILM | NILM | NILM | NILM | ASC-US | HSIL | ASC-H | |
| 30s | CS14 | NILM | NILM | LSIL | NILM | NILM | NILM | NILM | NILM | HSIL | LSIL | |
| 20s | CS15 | NILM | NILM | NILM | NILM | NILM | NILM | LSIL | NILM | HSIL | ASC-US | |
| 20s | CS16 | NILM | NILM | NILM | ASC-US | LSIL | NILM | NILM | ASC-US | HSIL | SCC |
| Classification | Dx Report | 16 Cytoscreeners | 8 Cytoscreeners (≥10 Years of Exp.) | |
|---|---|---|---|---|
| NILM | 0.042 (slight) | 0.755 (substantial) | ||
| Subclass | Neoplastic | 0.098 (slight) | 0.500 (moderate) | |
| All cases | 0.364 (fair) | 0.716 (substantial) | ||
| NILM | 0.073 (slight) | 0.815 (almost perfect) | ||
| Binary | Neoplastic | 1.000 (complete) | 1.000 (complete) | |
| All cases | 0.568 (moderate) | 0.861 (almost perfect) |
Publisher’s Note: MDPI stays neutral with regard to jurisdictional claims in published maps and institutional affiliations. |
© 2022 by the authors. Licensee MDPI, Basel, Switzerland. This article is an open access article distributed under the terms and conditions of the Creative Commons Attribution (CC BY) license (https://creativecommons.org/licenses/by/4.0/).
Share and Cite
Kanavati, F.; Hirose, N.; Ishii, T.; Fukuda, A.; Ichihara, S.; Tsuneki, M. A Deep Learning Model for Cervical Cancer Screening on Liquid-Based Cytology Specimens in Whole Slide Images. Cancers 2022, 14, 1159. https://doi.org/10.3390/cancers14051159
Kanavati F, Hirose N, Ishii T, Fukuda A, Ichihara S, Tsuneki M. A Deep Learning Model for Cervical Cancer Screening on Liquid-Based Cytology Specimens in Whole Slide Images. Cancers. 2022; 14(5):1159. https://doi.org/10.3390/cancers14051159
Chicago/Turabian StyleKanavati, Fahdi, Naoki Hirose, Takahiro Ishii, Ayaka Fukuda, Shin Ichihara, and Masayuki Tsuneki. 2022. "A Deep Learning Model for Cervical Cancer Screening on Liquid-Based Cytology Specimens in Whole Slide Images" Cancers 14, no. 5: 1159. https://doi.org/10.3390/cancers14051159
APA StyleKanavati, F., Hirose, N., Ishii, T., Fukuda, A., Ichihara, S., & Tsuneki, M. (2022). A Deep Learning Model for Cervical Cancer Screening on Liquid-Based Cytology Specimens in Whole Slide Images. Cancers, 14(5), 1159. https://doi.org/10.3390/cancers14051159