Article

Genetic Alterations Predict Long-Term Survival in Ductal Adenocarcinoma of the Pancreatic Head

1
Department of Surgery (A), Medical Faculty, Heinrich-Heine-University and University Hospital Duesseldorf, 40225 Duesseldorf, Germany
2
Institute of Pathology, Medical Faculty, Heinrich-Heine-University and University Hospital Duesseldorf, Moorenstr. 5, 40225 Duesseldorf, Germany
3
Department of Gastroenterology, Hepatology and Infectious Diseases, Medical Faculty, Heinrich-Heine-University and University Hospital Duesseldorf, 40225 Duesseldorf, Germany
*
Author to whom correspondence should be addressed.
Equally contributed.
Cancers 2022, 14(3), 850; https://doi.org/10.3390/cancers14030850
Submission received: 27 December 2021 / Revised: 28 January 2022 / Accepted: 5 February 2022 / Published: 8 February 2022
(This article belongs to the Special Issue Feature Paper from Journal Reviewers)

Abstract

:

Simple Summary

Pancreatic cancer is notorious for its poor prognosis. However, rare long-term survivors of pancreatic cancer exist. The aim of this study was to characterize the molecular profile of pancreatic cancer long-term survivors, to improve the stratification and management of pancreatic cancer patients in the future. Thirty-nine pancreatic cancer patients including short-term and long-term survivors were evaluated thoroughly. Their molecular profile was analyzed using panel next generation sequencing. As a result, patients with mutations commonly found in pancreatic cancer (KRAS G12D mutations and/or TP53 nonsense and splice site mutations) showed significantly worse survival. In contrast, long-term survivors of pancreatic cancer did not show the above-mentioned mutations but did show rare mutations of KRAS (Q61H/D57N). In conclusion, long-term survivors of pancreatic cancer do have a distinct molecular profile. Further studies using larger patient cohorts are warranted to confirm these results and possibly unravel rare potential targets for targeted therapy in pancreatic cancer.

Abstract

Background: Survival of patients with adenocarcinoma of the pancreas (PDAC) is poor and has remained almost unchanged over the past decades. The genomic landscape of PDAC has been characterized in recent years. The aim of this study was to identify a genetic profile as a possible predictor of prolonged survival in order to tailor therapy for PDAC patients. Methods: Panel next generation sequencing (NGS) and immunohistochemistry (IHC) were performed on paraffin-embedded tumor tissues from curatively treated PDAC patients. Tumor slides were re-evaluated with a focus on the histomorphology. Patients were subgrouped according to short and long overall (<4 years/>4 years) and disease-free (<2 years/>2 years) survival. Results: Thirty-nine patients were included in the study. Clinicopathological staging variables as well as the histomorphological subgroups were homogenously distributed between short- and long-term overall and disease-free survivors. In survival analysis, patients with the KRAS G12D mutation and patients with TP53 nonsense and splice-site mutations had a significantly worse overall survival (OS) and disease-free survival (DFS). Patients with long-term OS and DFS showed no KRAS G12D, no TP53 nonsense or splice-site mutations. Rare Q61H/D57N KRAS mutations were only found in long-term survivors. The allele frequency rate of KRAS and TP53 mutations in tumor cells was significantly higher in short-term disease-free survivors and overall survivors, respectively. Conclusions: NGS of PDAC revealed significant differences in survival outcome in a patient collective with homogenously distributed clinicopathological variables. Further multi-institutional studies are warranted to identify more long-term survivors to detect genetic differences suitable for targeted therapy.

1. Introduction

Ductal adenocarcinoma of the pancreatic head (hPDAC) is characterized by a poor prognosis with a median overall survival of approximately 6 months, and is predicted to become the second leading cause of cancer-related death in the United States and also in Germany by 2030 [1,2]. To date, the only curative therapy remains margin-negative oncological resection with an adjuvant treatment regime starting within 6 weeks after surgery [3,4]. PDAC metastasizes primarily to the peritoneum, liver and lung [5,6]. At diagnosis, 50% of patients already have distant metastases, and a further 30% present with locally advanced disease and are therefore also not eligible for surgery. Thus, only 20% of patients with PDAC receive surgery with curative intent. Taken together, PDAC is regarded as one of the most lethal cancers [7,8].
Although therapeutic regimens have been modified over the past decades, and a detailed pathological evaluation of the resection status has been implemented, survival outcome has not significantly changed over the past years [9,10,11,12]. The yet not entirely understood molecular alterations in hPDAC might be responsible for the lack of effective chemotherapeutic drugs, and thus therapy resistance and tumor recurrence. hPDAC is a highly heterogeneous disease. Histomorphological and molecular subtypes of hPDAC have recently been discovered, and their importance as possible indicators of prognosis and therapy response after adjuvant therapy is being investigated. In 2008, Jones et al. reported the first genome-wide analysis of PDAC [13], whereby the driver function of previously known genes, such as TP53 and SMAD4, was confirmed [14,15,16]. Genetic factors relevant for PDAC prognosis, such as certain mutations or number of mutated driver genes, have been reported in the literature [17]. However, specific factors associated with the long-term survival of patients with hPDAC are still poorly understood.
Previous studies on the survival of patients with surgically resected hPDACs have reported that smaller tumor size, negative lymph nodes and margin clearance are predictors of a more favorable prognosis, but similar features are found in short-term survivors as well [12,18,19,20,21,22]. Thus, additional factors must play a supplemental role in determining long-term survival in patients with hPDAC. For example, an altered tumor microenvironment or enhanced immune response dependent on tumor-produced neoantigens have been shown to play an important role in long-term survival of hPDAC [23]. We therefore aimed to analyze whether any differences exist in the mutational profile of short- and long-term survivors of PDAC.

2. Materials and Methods

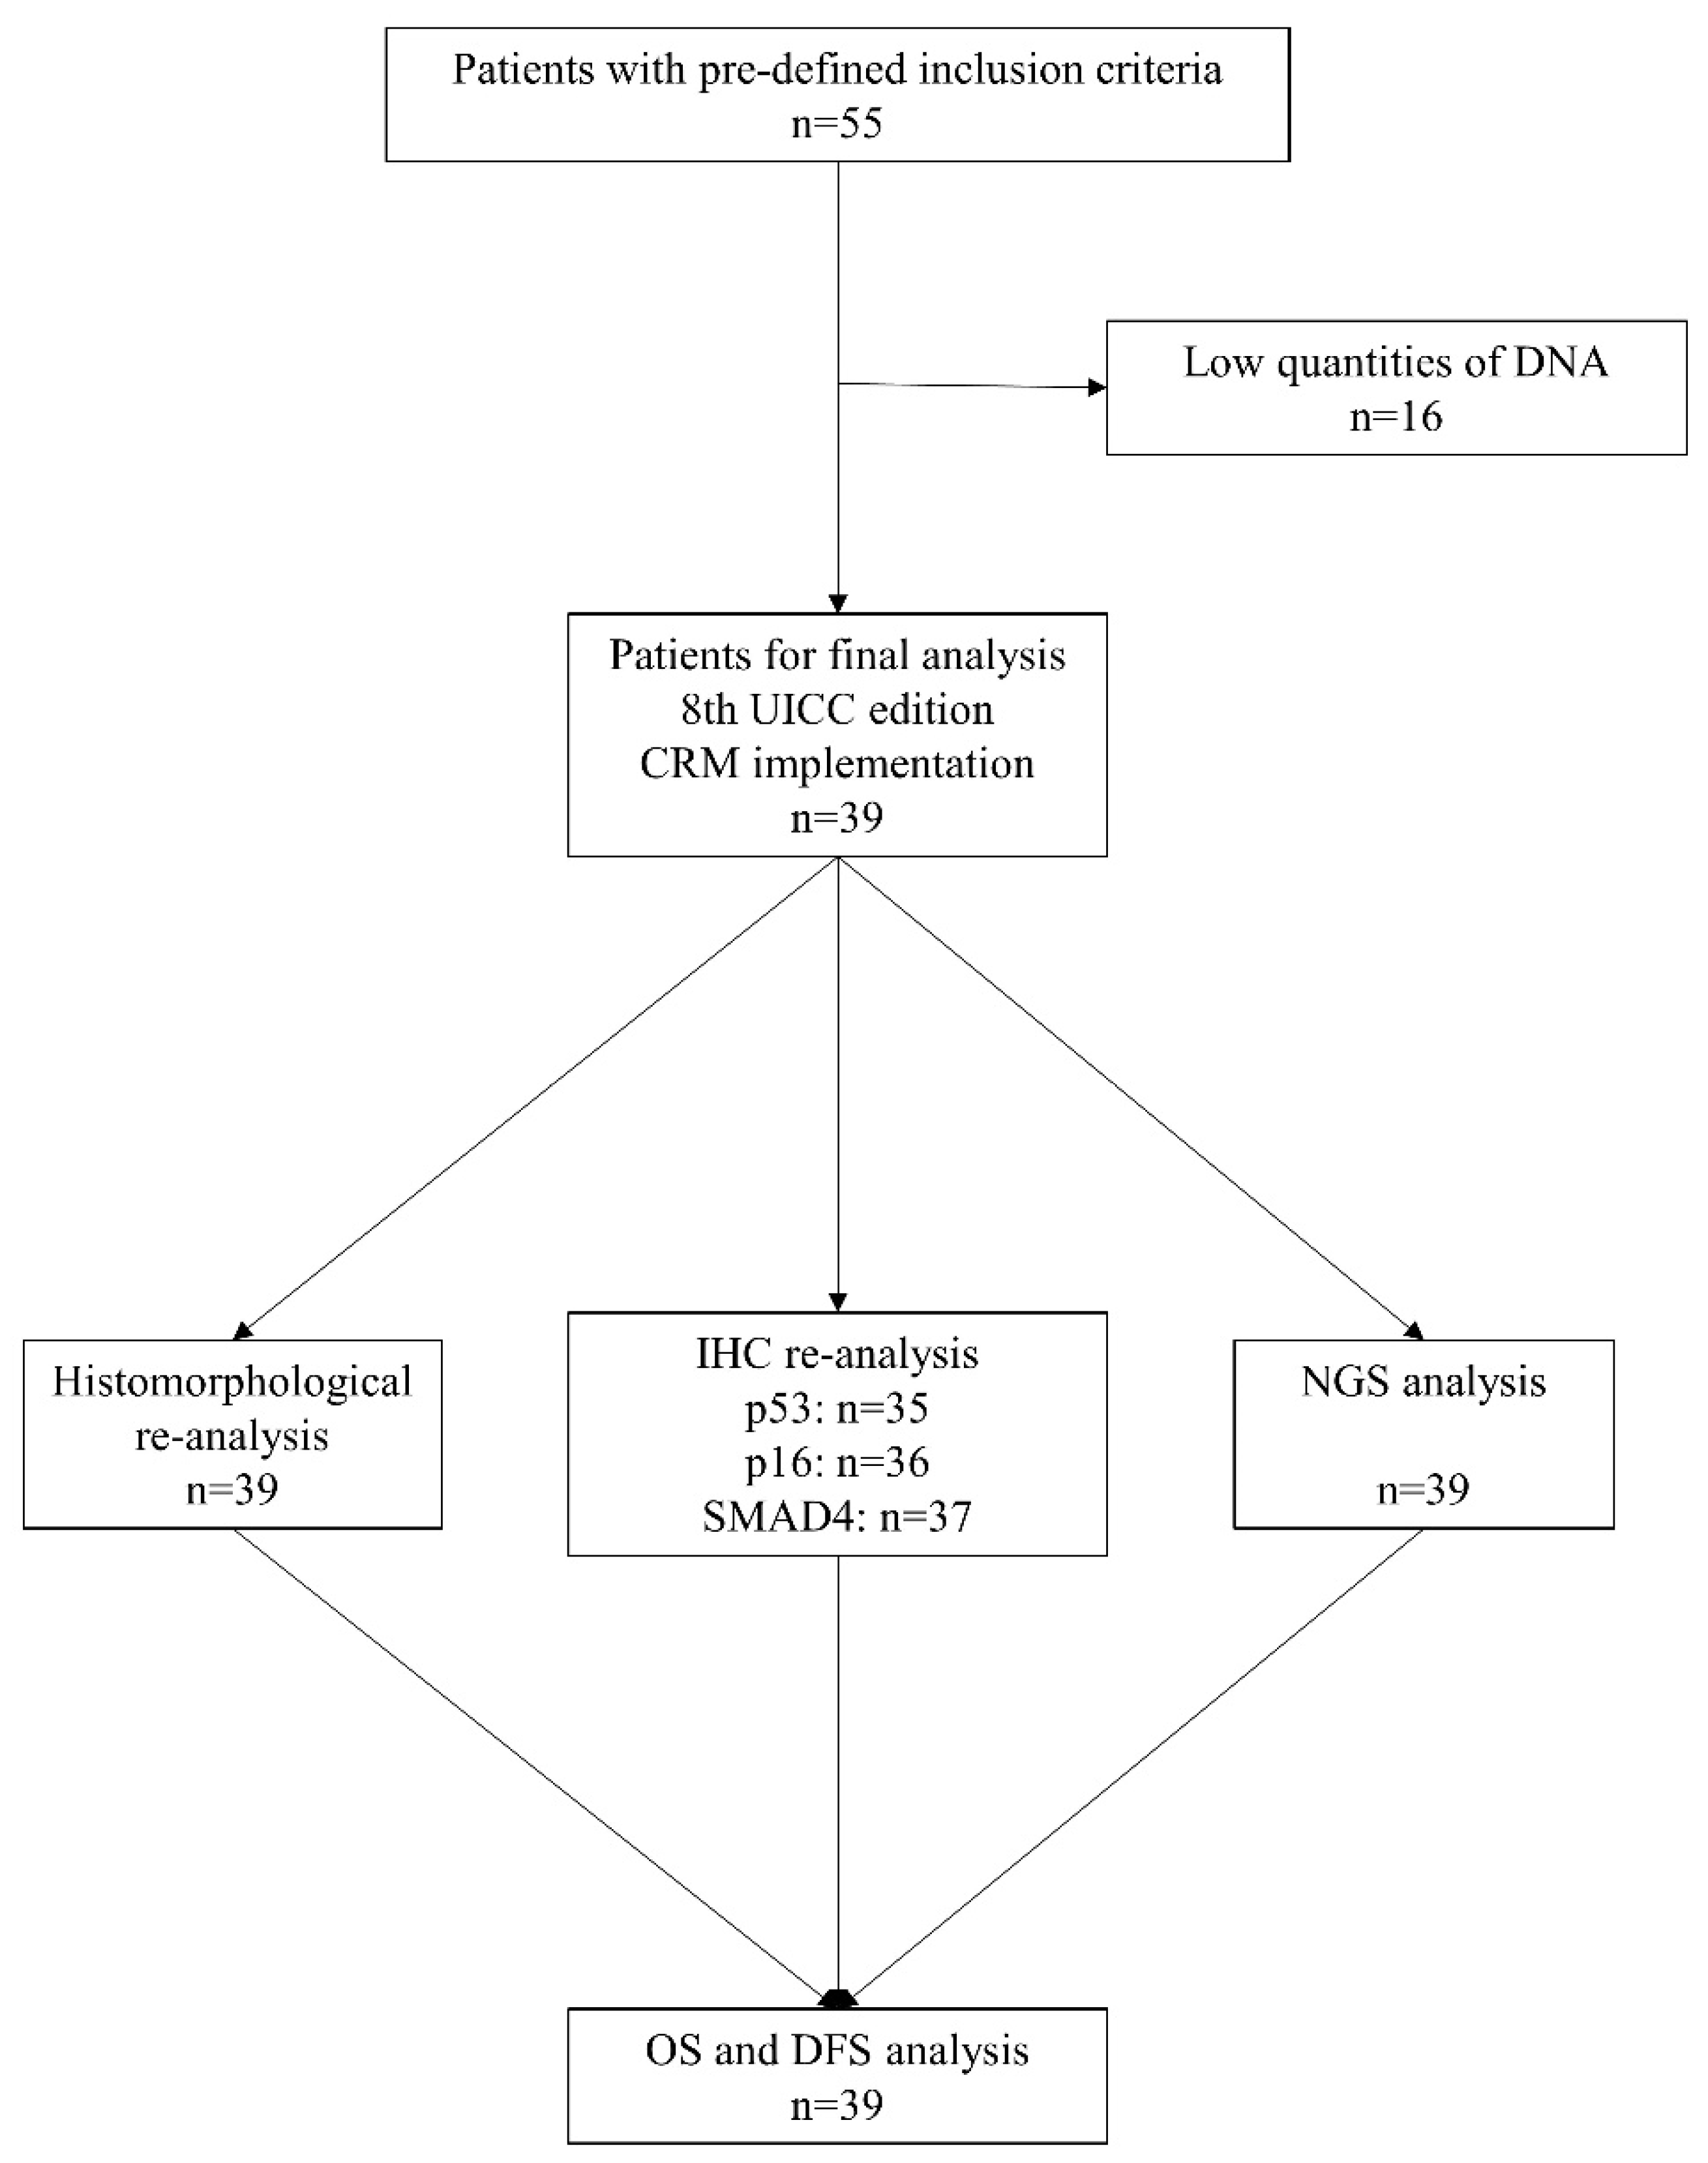
2.1. Patient Selection and Clinicopathological Data

Patients who received surgery for hPDAC between 2003 and 2016 at the University Hospital of Duesseldorf were included. Exclusion criteria were patients with (1) malignancies of the pancreatic head other than PDAC, (2) TNM staging without information of lymphatic, perineural and venous invasion (Lx, Pnx, Vx), (3) resection status evaluation without CRM implementation, (4) insufficient follow-up information, (5) patients who succumbed within 30 days of surgery, and (5) patients who did not receive a complete course of an adjuvant treatment regimen. Clinicopathological data (gender, age at the time of surgery, disease-free survival (DFS) overall survival (OS), and results of follow-up examinations including time of diagnosis of metastases and site of metastases) were retrieved and collected from patients’ medical records. The data were analyzed retrospectively. In order to evaluate disease-free survival (DFS), all lesions highly suspicious of metachronous disease detected on imaging were considered in the survival analysis. Furthermore, relapse-specific survival (RSS), defined as the survival from the date of the relapse diagnosis until death, was calculated.
Data on the TNM categories (size of tumor/involvement of adjacent arteries, lymph node status and status on distant metastasis), along with grading, lymphatic, venous invasion and perineural invasion were retrospectively collected from the original histopathological reports for each patient. The TNM staging system, if applicable, was updated to the 8th Edition of the UICC TNM classification of malignant tumors [24].
Histopathological slides obtained from the tumor center were re-evaluated. Only cases with enough available tumor material were included in the analysis. Furthermore, all tumor slides were re-evaluated for histopathological subtyping according to the newest WHO classification [25].

2.2. Histopathological Slide Preparation and DNA Isolation

Five 4-µm slides were cut from one representative paraffin block. One slide was stained with hematoxylin and eosin and used for the final histopathological evaluation. The tumor area was marked and DNA isolation was performed using the Qiagen™ GeneRead DNA FFFPE Kit™ (Qiagen™, Hilden, Germany) according to the manufacturer’s instructions (Supplemental Figure S1).

2.3. DNA Sequencing

Extracted DNA was first quantified by Qubit™ dsDNA BR Assay Kit (Thermofisher, Darmstadt, Germany). Subsequently, quantitative PCR (qPCR) was performed employing a custom primer assay (HML-2 for: 5′-AAACGCCAATCCTGAGTGTC-3′; HML-2 rev: 5′-CATAGCTCCTCCGATTCCAT-3′) directed against a subset of long terminal repeats (LTRs) from HML 2 human endogenous retroviruses with Power SYBR™ Green PCR Master Mix on a StepOnePlus™ real-time PCR system (both Thermofisher, Darmstadt, Germany).

2.4. Library Preparation and Massive Parallel Sequencing

Library preparation was carried out using Ion AmpliSeq™ Library Kit 2.0 and Ion AmpliSeq™ Cancer Hotspot Panel v2 with 10 ng of amplifiable DNA following manufacturer’s recommendations. Ion Xpress™ barcode adapters kits were utilized for barcoding the libraries. Afterwards, libraries were quantified by qPCR using the Ion Library TaqMan™ quantitation kit on a StepOnePlus™ real-time PCR system and were compiled equimolarly for subsequent sequencing reaction. Massive parallel sequencing was conducted on an Ion S5 system using the Ion 520™ and Ion 530™ Kit-OT2 with an Ion 530™ chip. Primary data analyses were performed by Ion Torrent Suite software. For variant annotation, generated binary alignment map (BAM) files were uploaded to and analyzed by Ion Reporter™ software using recommended analysis parameters for the Ion AmpliSeq™ Cancer Hotspot Panel v2. Detected variants were examined using the Integrative Genomics Viewer (IGV) [26,27]. All reagents and software were from Thermofisher (Darmstadt, Germany).

2.5. Immunohistochemistry

Tumor tissue slides were stained for p16, p53 and Smad4 on the Ventana BenchMark ULTRA automated IHC/ISH slide staining system (Roche Diagnostics, Tucson, AZ, USA) according to the protocols established for routine diagnostics at the Institute of Pathology of the Heinrich Heine University and the University Hospital Duesseldorf, Germany (Supplemental Table S1). Staining was analyzed in a blinded fashion for clinicopathological data by two independent investigators (S.A.S. and L.H.). For p16 and Smad4, only complete lack of staining was classified as loss of expression. For p53, either complete loss of expression (no staining) or overexpression (strong expression in >75% of tumor cells) was classified as aberrant expression (Supplemental Figure S2).

2.6. Statistical Analysis

The Wilcoxon test was used to analyze the differences in clinicopathological parameters and mutations. The Mann–Whitney U test was used to examine numerical data and to correlate the distribution between clinicopathological variables. For categorical data, the Chi-square test and the Pearson’s test were applied. Overall survival (OS), disease-free survival (DFS) and relapse-specific survival (RSS) were included for outcome measures. OS was determined as the period from the date of surgery until the date of death of any cause or until the date of last follow-up. DFS was defined as the period from the date of surgery until the date of diagnosed metachronous metastases or local recurrence. RSS was the period from the date of recurrence until death or last follow-up. Kaplan–Meier curves were generated and analyzed using the log-rank (Mantel–Cox) test. Hazard ratios (HRs) with 95% confidence intervals (CIs) were estimated. Analyses were performed using SPSS® statistics for Windows (version 26.0; SPSS, Inc., Chicago, IL, USA). p < 0.05 was considered to indicate a statistically significant difference.
The analysis was performed in conformity with the Declaration of Helsinki and the rules of good clinical practice. Furthermore, a positive vote of the Institutional Review Board (IRB) of the Ethics Committee, Heinrich Heine University Duesseldorf (IRB-no. 3281 and 5387) was obtained.

3. Results

3.1. Histopathological and Genetic Analysis

From a total cohort of 283 patients who received surgery for hPDAC, 55 patients met our predefined inclusion criteria for NGS. Figure 1 represents the flow chart of the study. Tumor areas with ≥80% tumor cellularity were dissected for DNA extraction, thus minimizing stromal contamination. In 16 patients, no adequate DNA sequencing was possible because of low quantities or insufficient quality of DNA. The analysis was performed in the remaining 39 patients (Table 1 and Figure 1).
The median age of all 39 patients at the time of surgery was 69 years (range: 47–90). Our cohort consisted of 24 male (61.5%) and 15 female (38.5%) patients. All patients received a partial pancreaticoduodenectomy. Thirty-three patients (84.62%) received gemcitabine monotherapy, while six patients (15.38%) received a combination therapy with paclitaxel. FOLFIRINOX as a standardized adjuvant treatment regime was not applied to our study cohort based on the guidelines at the time the study was performed. Follow-up data were available for all patients. A total of 25 patients (64.1%) died during the follow-up period. The median OS of all 39 patients was 18.8 months (range: 2.16 months–154.4 months). The median DFS was 7.92 months (range: 1.2 month–154.4 months). Of the 39 patients, 26 patients were diagnosed with metachronous relapse during follow-up (66.7%). In 11 patients, metachronous hepatic metastases were evident, whereas in 12 and 3 patients, pulmonary relapse and peritoneal carcinomatosis were diagnosed, respectively. The median RSS for the 26 patients was 7.03 months (range: 0–36.2 months).
Cases were reclassified into histomorphological subtypes according to current criteria. In thirty-one (79.5%) patients, the tumor was classified as classical PDAC, in four patients as anaplastic, and in a further four patients each as papillary, medullary, complex and large-duct type PDAC, respectively. Additional immunohistochemical staining of tumor slides was successfully performed for p53 in 35 patients, for p16 in 36 patients, and for Smad4 in 37 patients, respectively. Aberrant immunohistochemical expression of p53 was found in 16 patients (20/35, 57.1%). Loss of immunohistochemical expression of p16 and Smad4 was found in 26 (26/36, 72.2% for p16 and 26/37, 70.3% for Smad4). A correlation analysis was performed between histomorphological subgroups (classical PDAC vs. rest), immunohistochemical staining results (p53, p16 and Smad4) and clinicopathological variables (Supplemental Tables S2 and S3). When patients were stratified according to histomorphology (classical PDAC vs. rest), all incorporated clinicopathological variables were homogenously distributed (Supplemental Table S2). A distribution analysis was also performed regarding immunohistochemical results (aberrant expression of p53, p16 and Smad4) (Supplemental Table S3). Only patients with an aberrant expression of p16 showed a higher T category when compared to patients without aberrant p16 expression (p = 0.011).

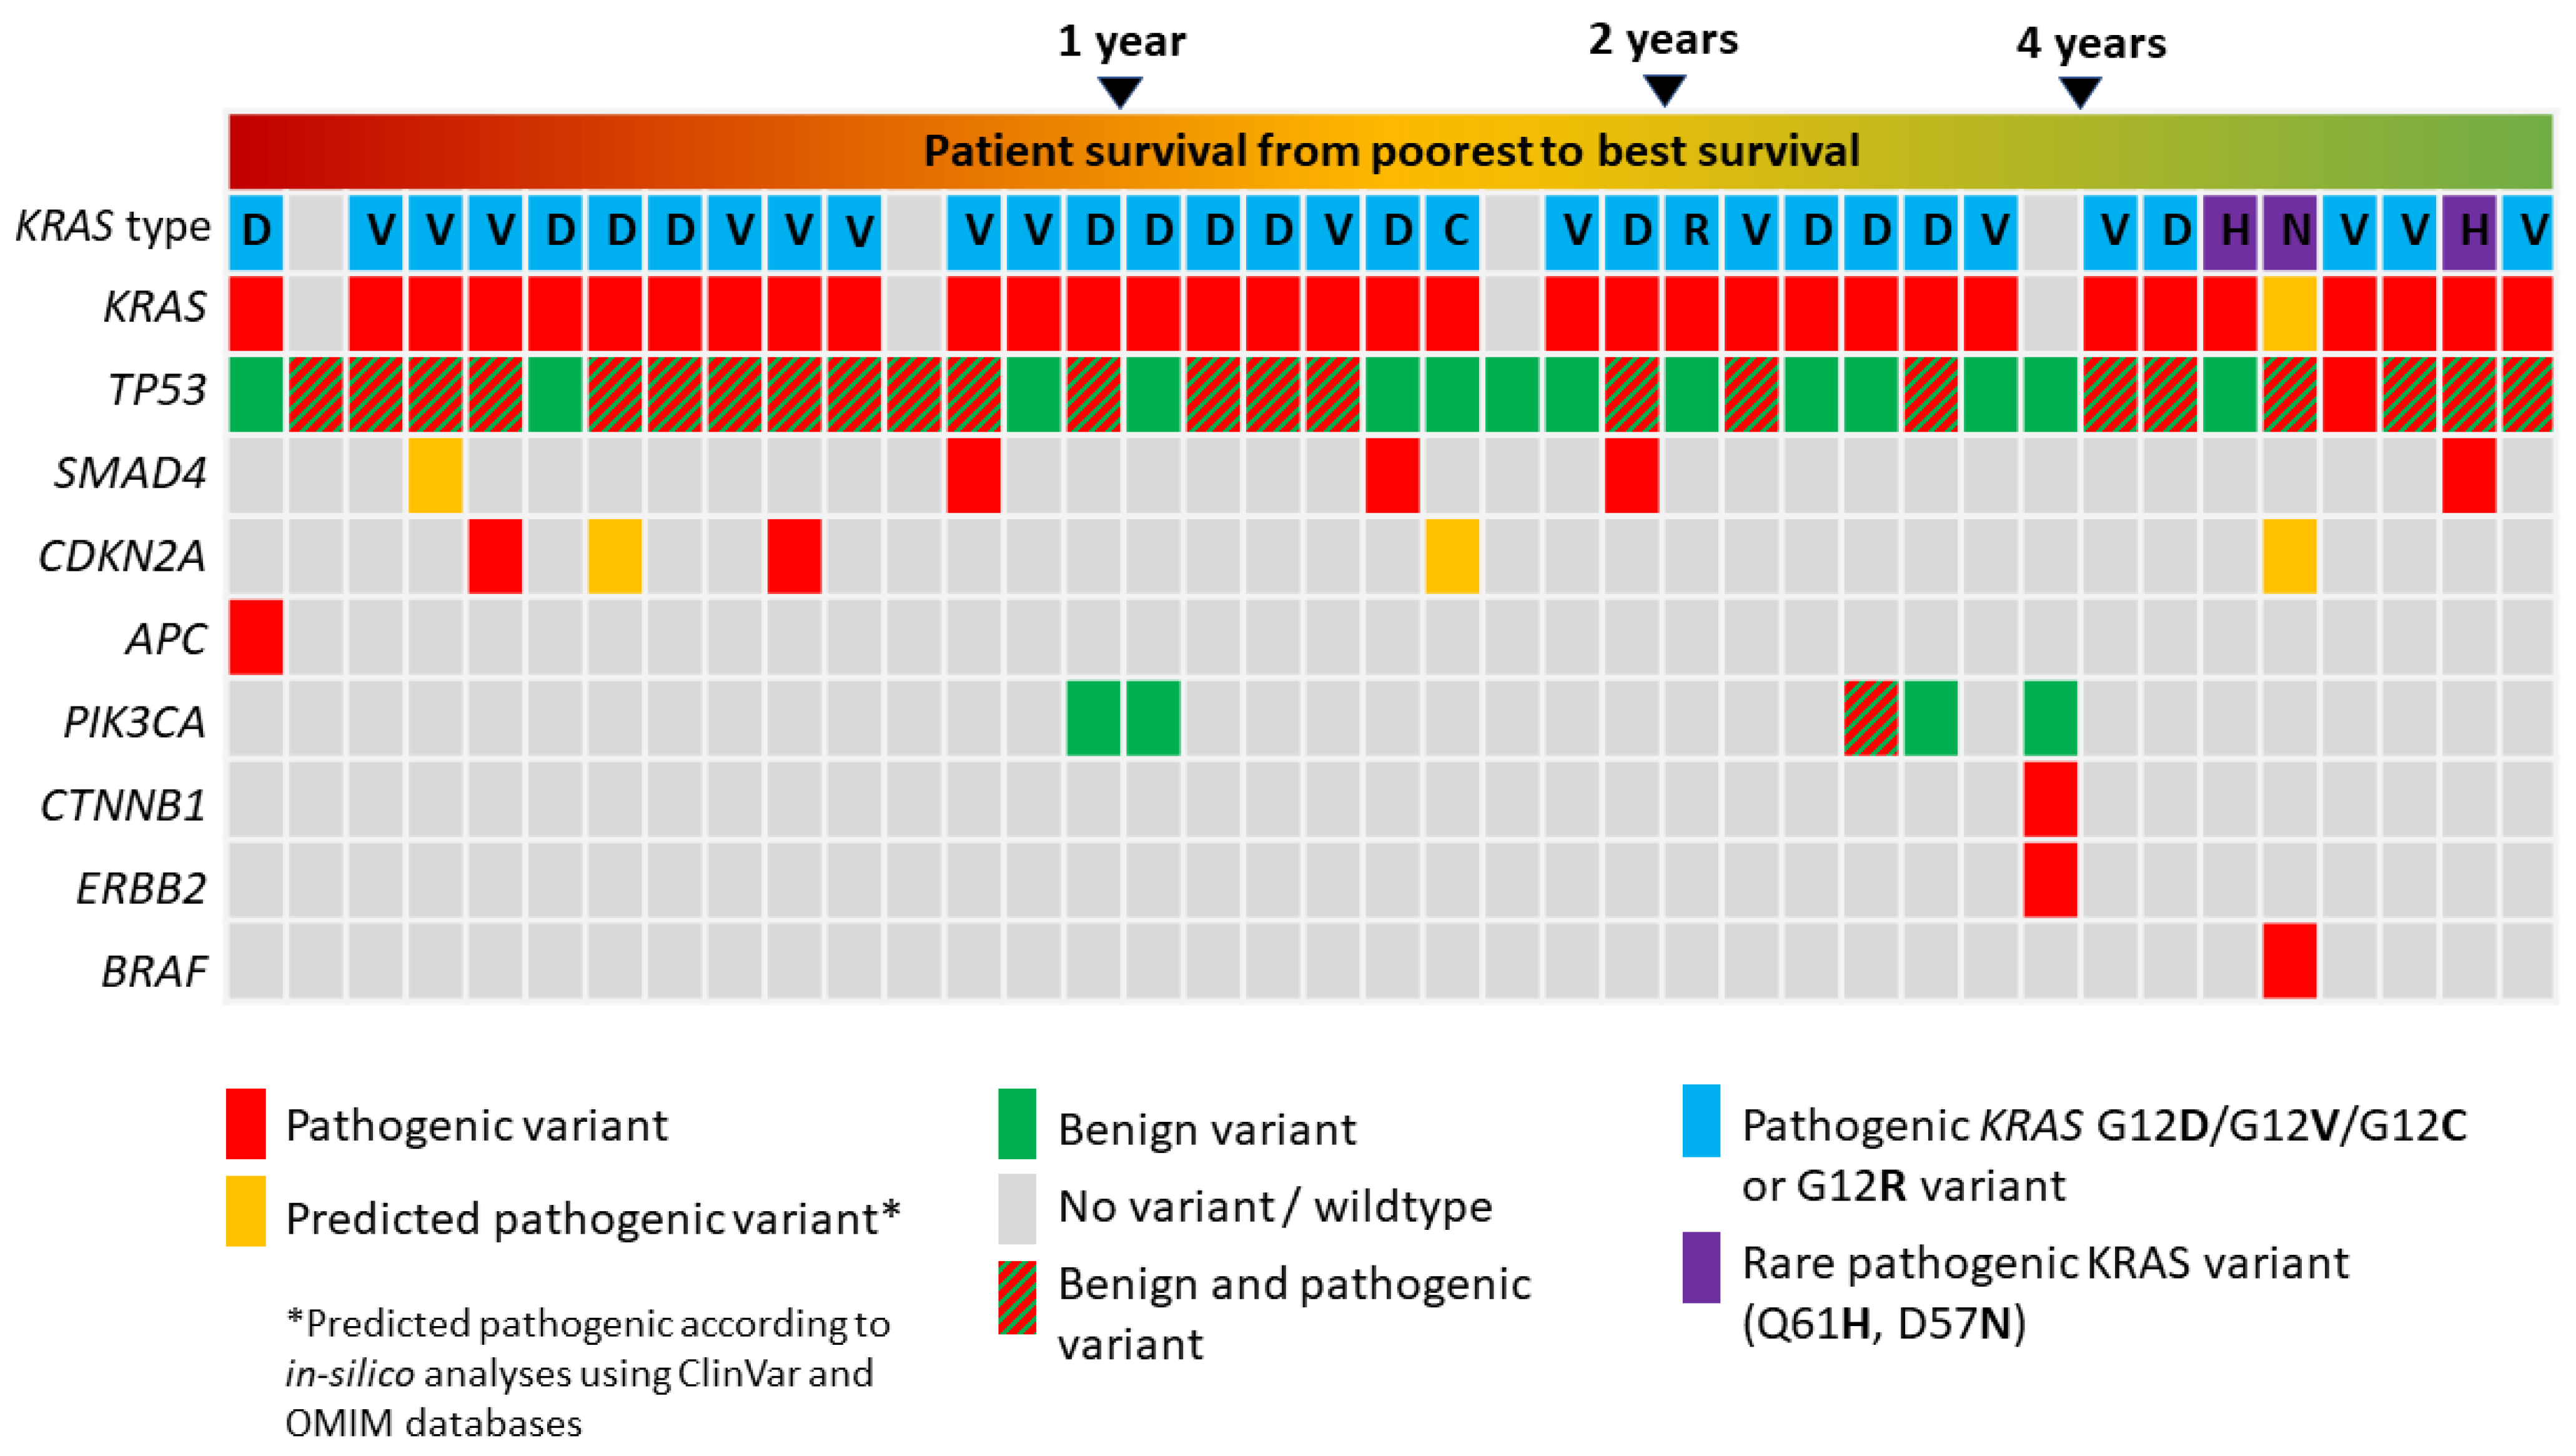
3.2. Panel Next Generation Sequencing

Results of mutation analysis are summarized in Figure 2 and Supplemental Table S4. From the total study collective, pathogenic KRAS mutations were found in 35 patients (89.74%). In 16 patients (41.02%), KRAS missense mutations resulted in the amino acid change G12V. Fourteen patients (35.90%) harbored KRAS missense mutations with resulting the amino acid change G12D, one KRAS mutation resulted in the amino acid change G12C and one further patient harbored a KRAS missense mutation with the resulting amino acid change G12R (each 2.8%). In three patients (10.26%), rare KRAS missense mutations were evident (two patients with Q61H, one patient with D57N alteration). Twenty-five (64.10%) patients harbored pathogenic TP53 mutations. Missense mutations were evident in 20 patients (51.28%), whereas nonsense and frameshift/splice-site mutations were evident in 5 patients (12.8%) (Supplemental Table S4).
An additional third driver mutation was present in 13 patients (33.33%) (Supplemental Table S4). Of these 13 patients, five (38.46%) harbored SMAD4 mutations, followed by five patients (38.46%) with CKDN2A, (one patient with an additional BRAF mutation and one patient with an additional ATM mutation), and three patients with an APC, CTNNB1/ERBB2 or PIK3CA mutation, respectively (each 7.69%). In 13 (92.86%) and 9 (64.29%) patients, an additional KRAS and TP53 mutation was found, respectively. In the correlation analysis, patients with or without KRAS and TP53 mutations showed similar tendencies for a further driver mutation (Supplemental Tables S3 and S4). A distribution analysis was performed between KRAS, TP53 and the third driver mutational status and the following variables: clinicopathological variables, histomorphology and immunohistochemical expression status (Table 2). All incorporated variables were homogenously distributed in patients, independently from the KRAS and TP53 mutational status as well as in patients with or without further driver mutations (Table 2).

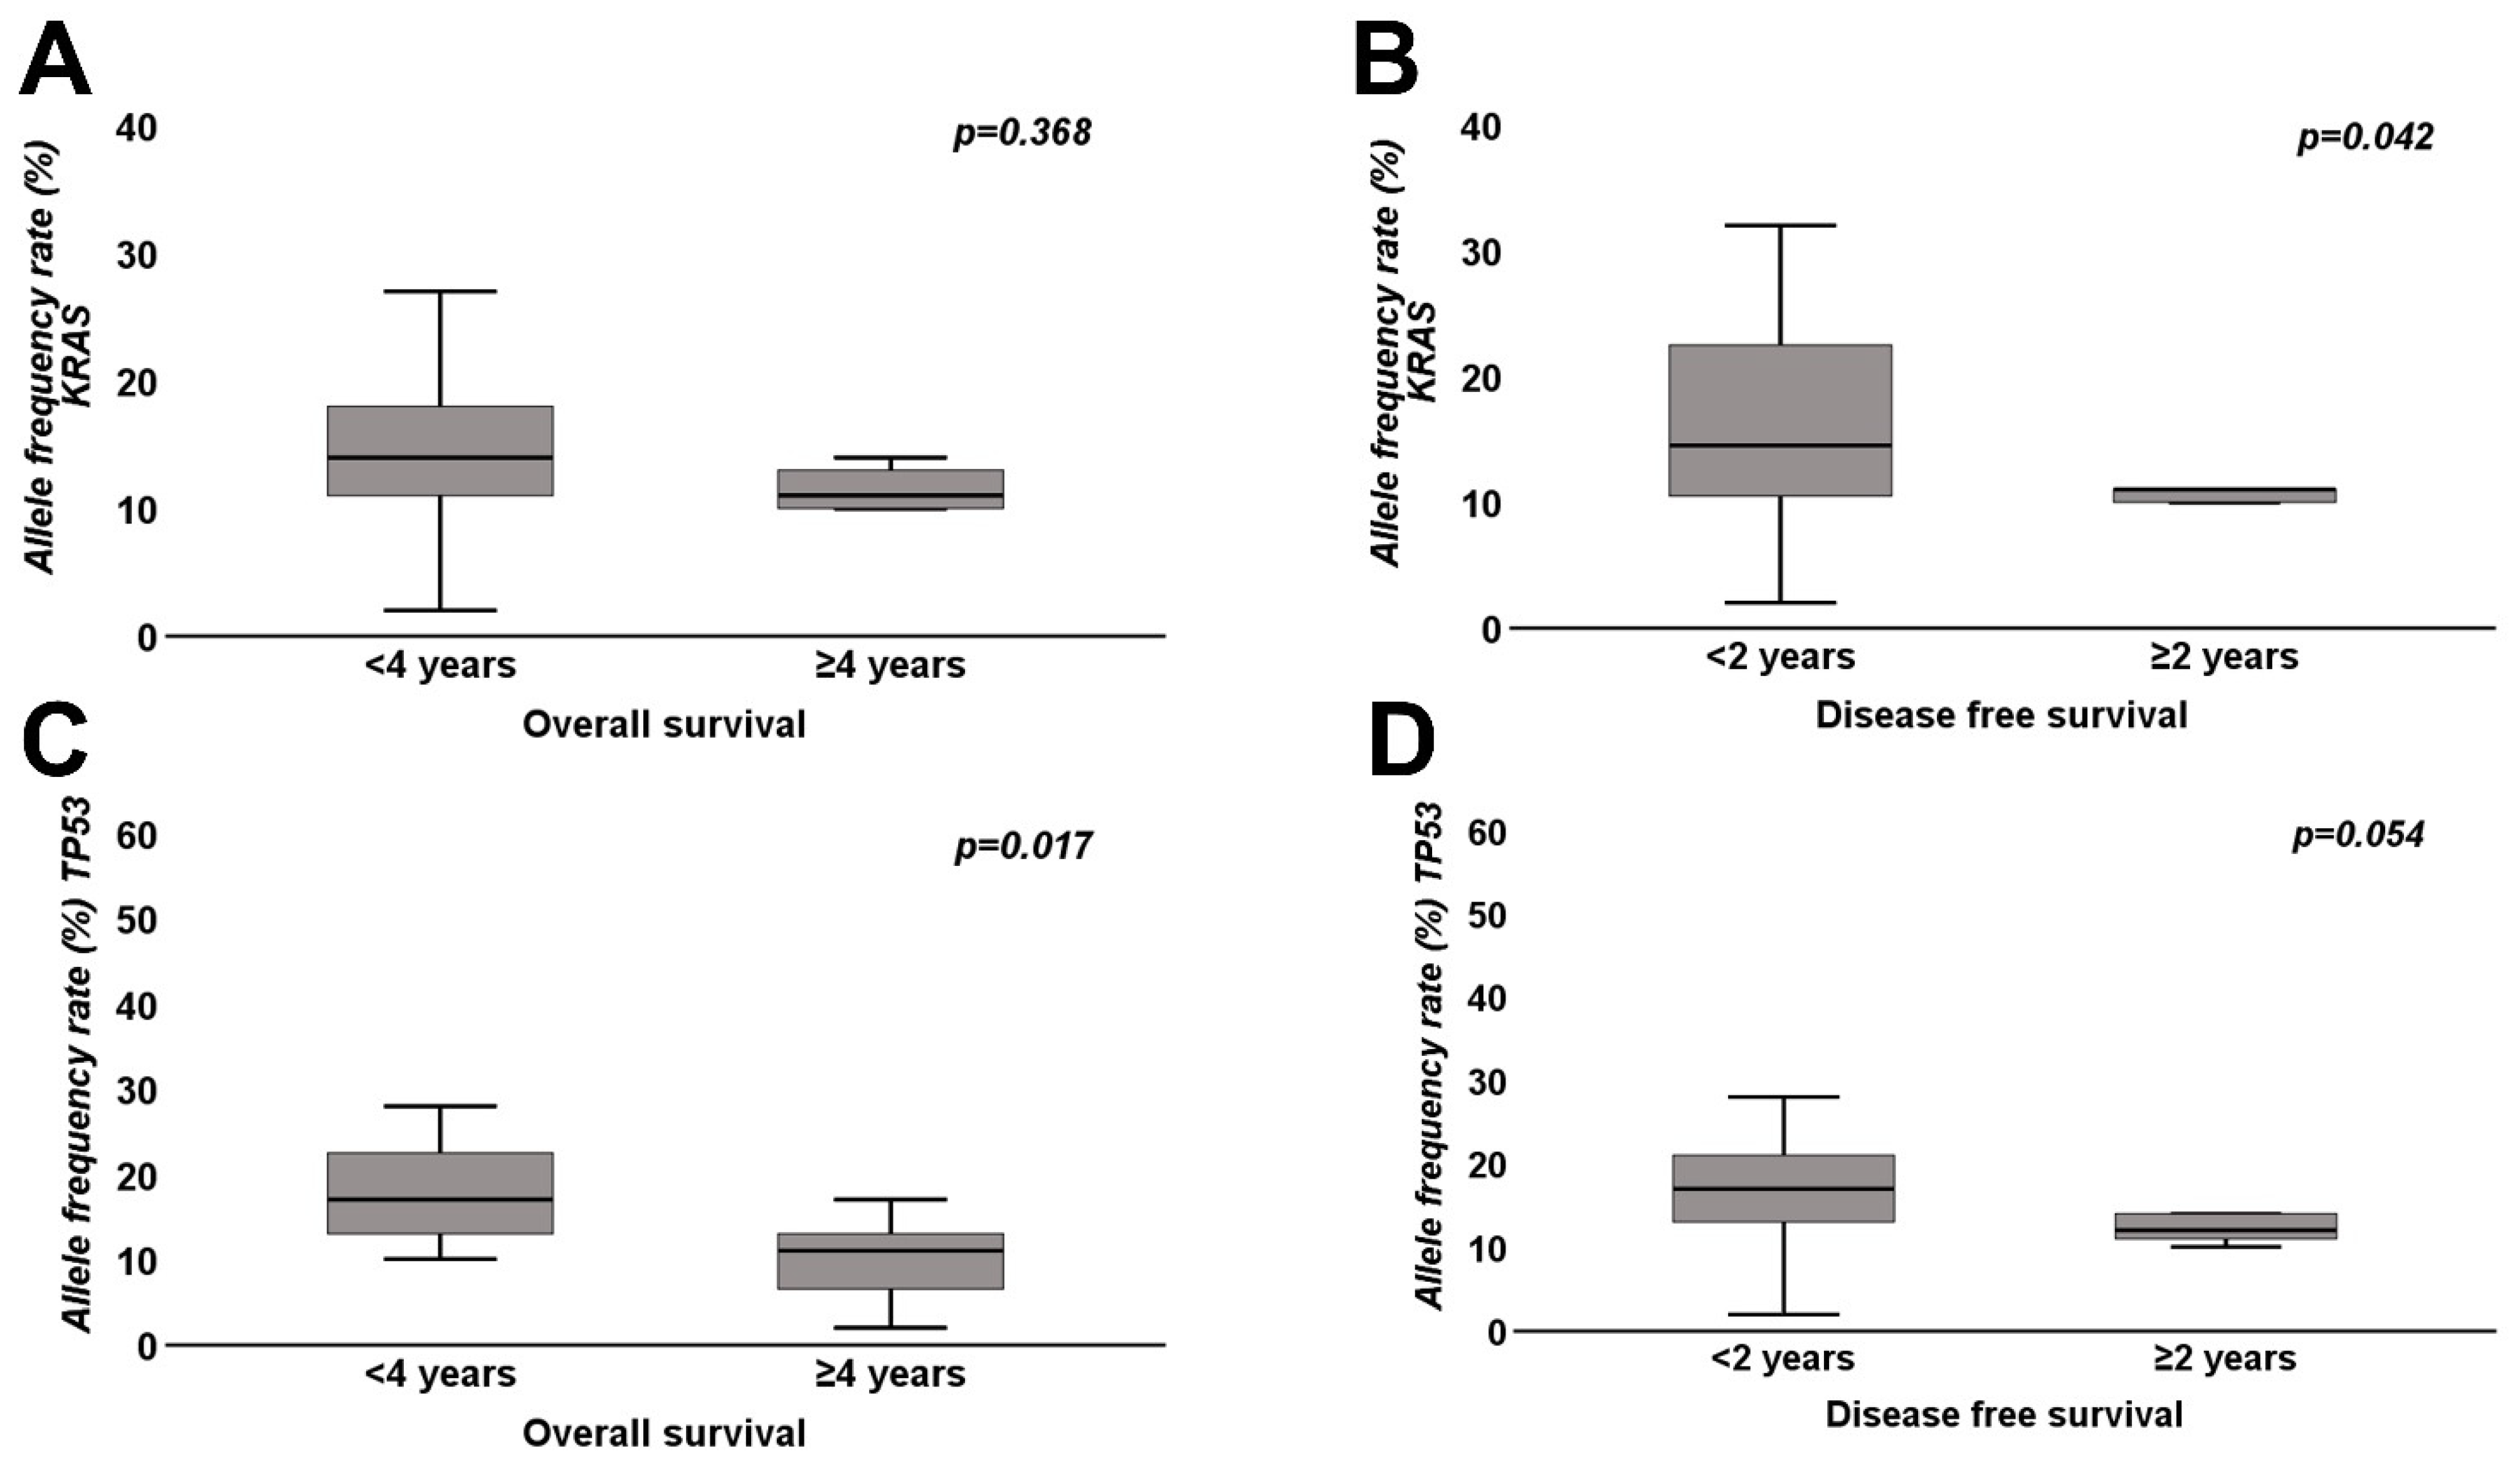
3.3. Allele Frequency Rates of Pathogenic KRAS and TP53 Variants

The allele frequency rates were analyzed in the 35 patients with pathogenic KRAS mutations and in the 25 patients with pathogenic TP53 mutations. The median allele frequency rate of pathogenic KRAS mutations was 12% (range: 2–32%), while the median allele frequency rate of pathogenic TP53 mutations was 14% (range: 2–66%).
The median allele frequency rate of KRAS variants in patients with KRAS G12D mutation was higher when compared to patients with other KRAS mutations, but the difference did not reach statistical significance (p = 0.854). In patients with nonsense and frameshift/splice-site mutations of TP53 and in patients with missense mutations of TP53, the median allele frequency rate of pathogenic TP53 mutations was 14% and without statistical significance (p = 0.705). Patients with poorly differentiated (G3) PDACs had higher median allele frequency rate of pathogenic TP53 mutations when compared to patients with G1/G2 PDACs (p = 0.029).
All other analyzed subgroups (e.g., depending on histomorphology, immunohistochemical profile or stage) did not show significant differences in the allele frequency of KRAS and TP53 mutations (Supplemental Table S5).

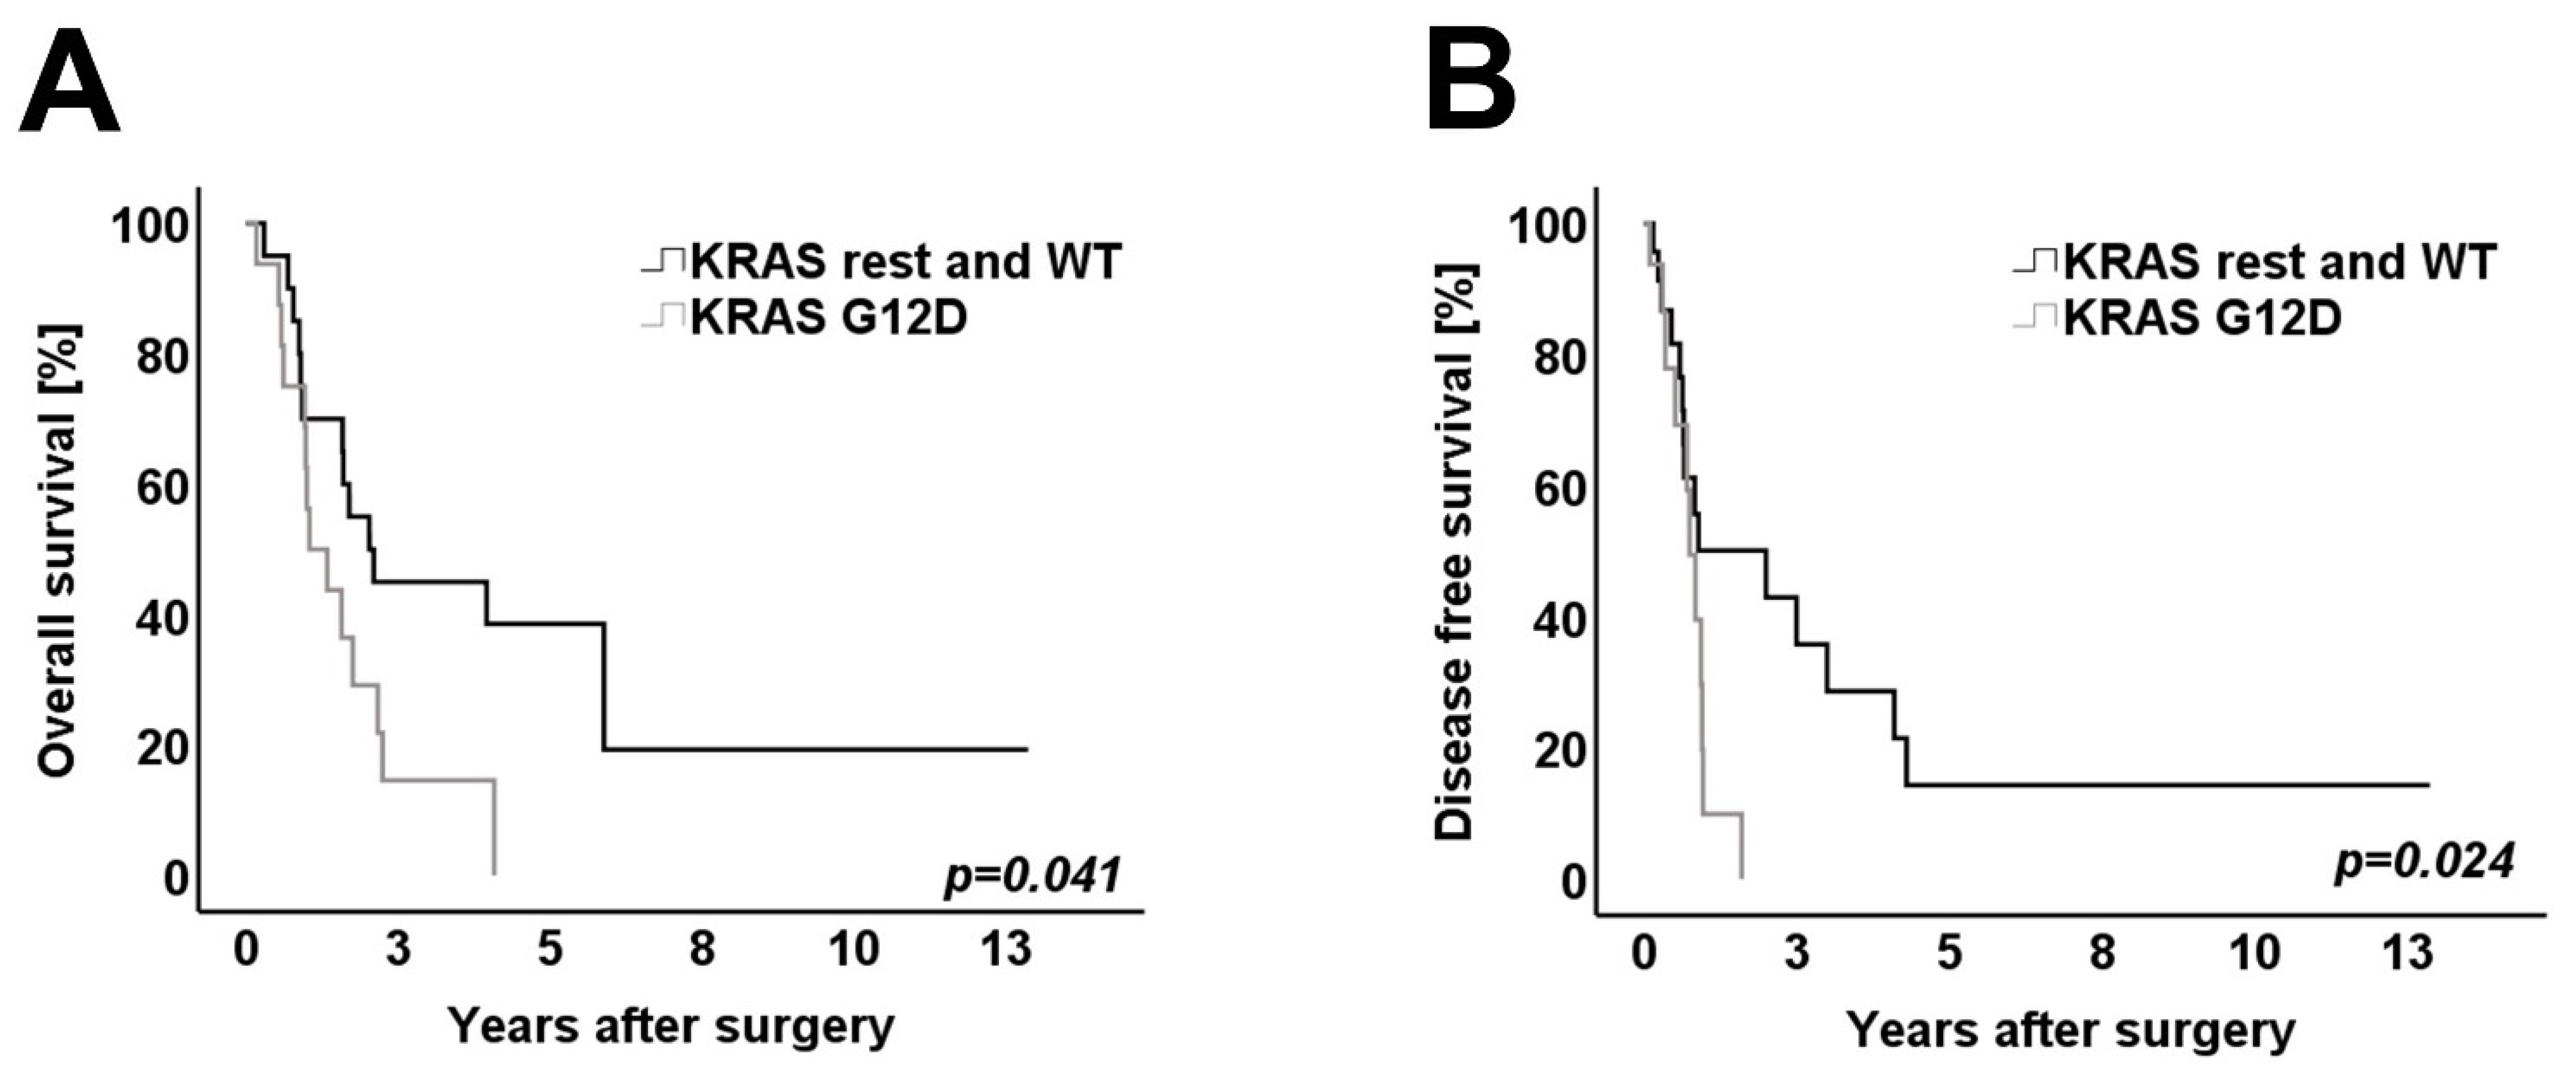
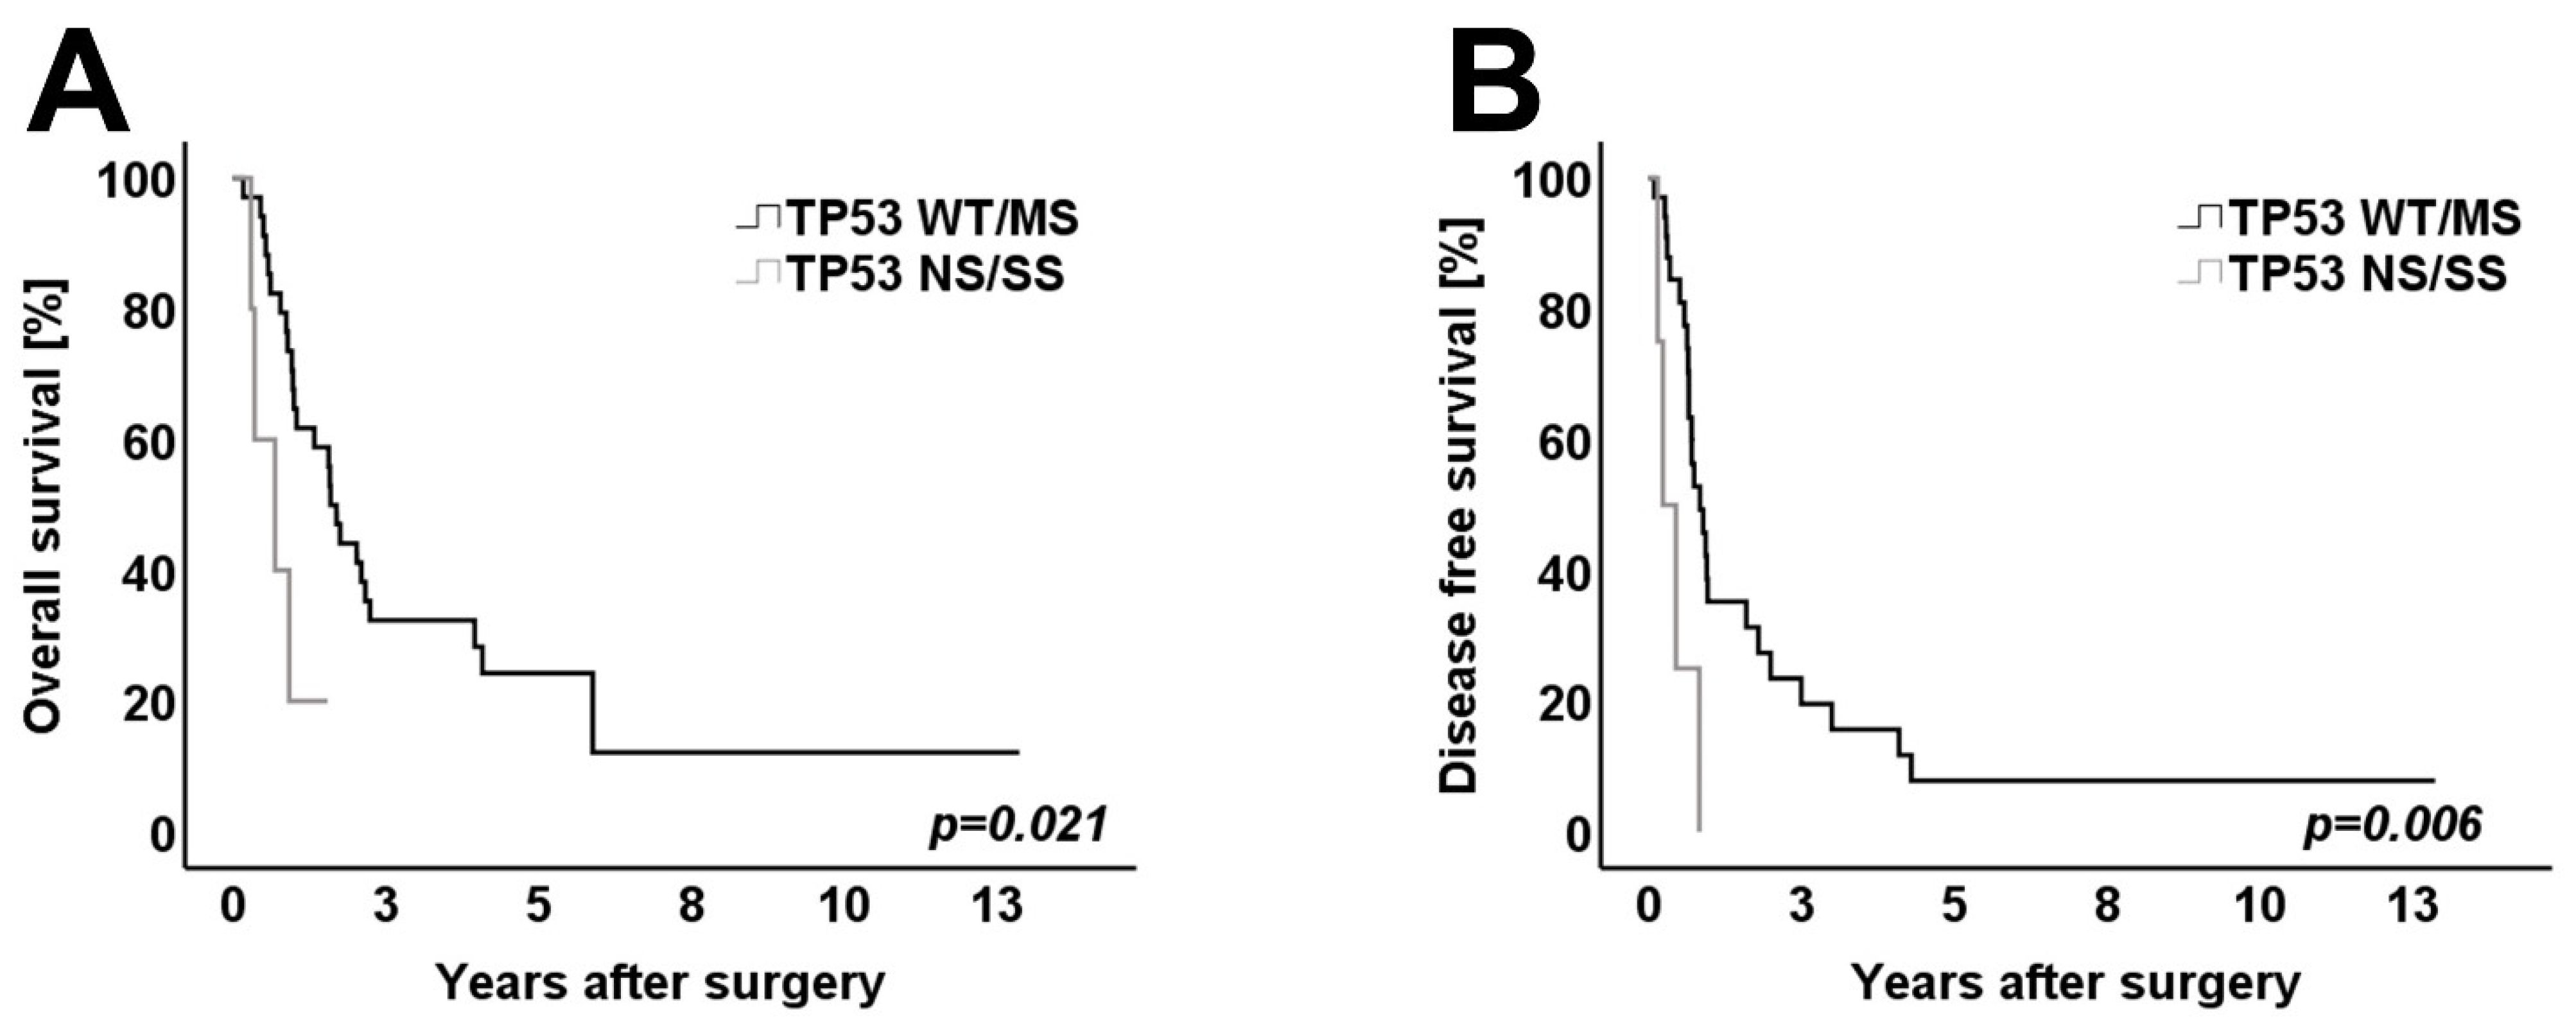
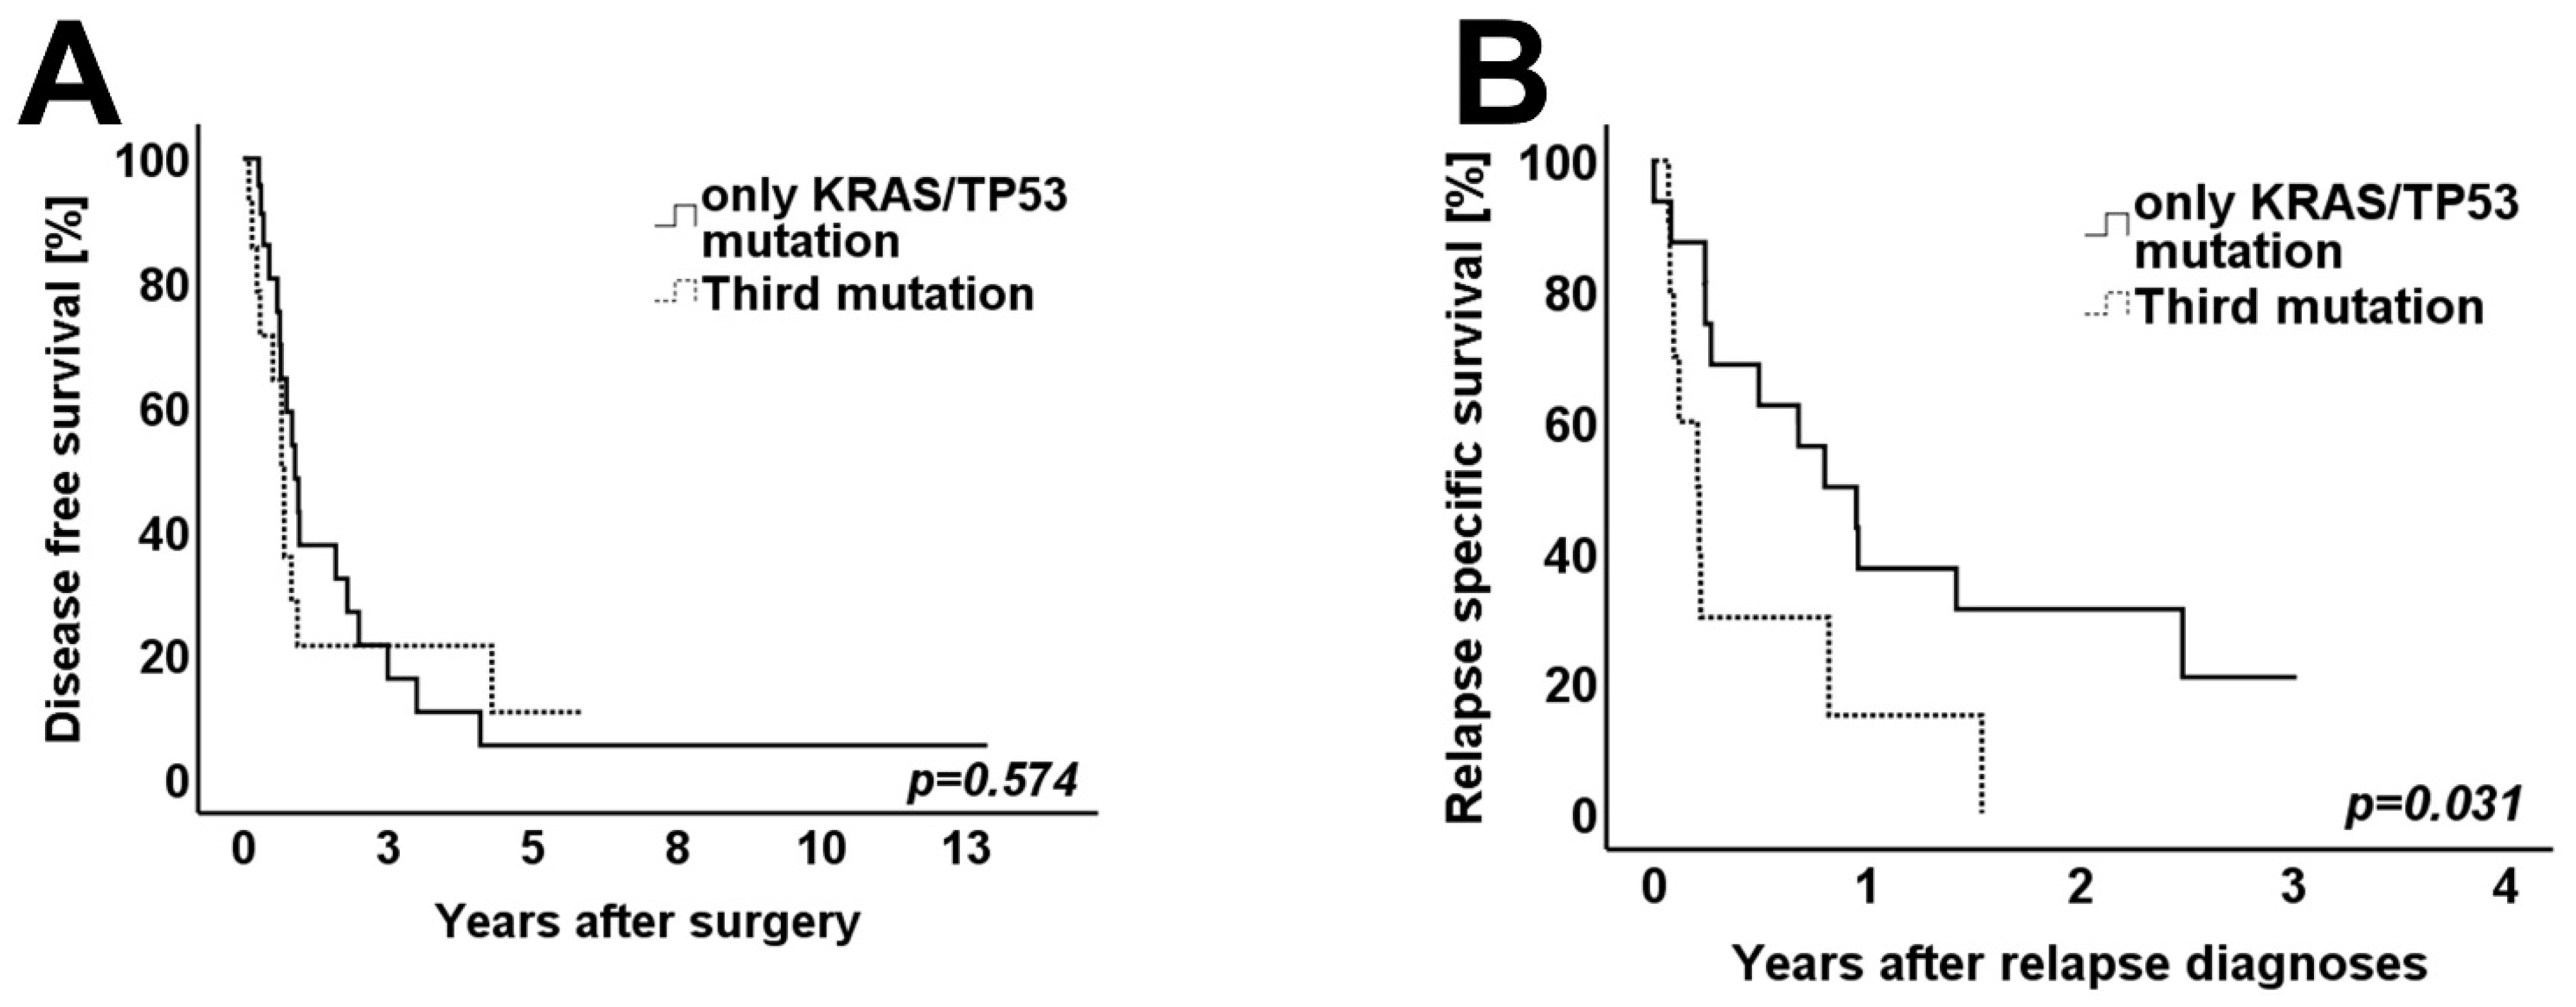
3.4. Survival Analysis

Overall survival, disease-free survival and relapse-specific survival were analyzed for all 39 patients. First, a univariate survival analysis was performed considering all studied clinicopathological variables. None of the studied variables correlated significantly with worse overall survival. For the survival analysis of KRAS mutational status, a subgroup analysis was performed. Patients with a KRAS G12D mutation (n = 14) were compared to patients with KRAS wild-type or other pathogenic KRAS mutations (n = 25). Clinicopathological variables and histomorphology were distributed homogenously between both KRAS subgroups. In the univariate analysis, patients with a KRAS G12D mutation showed significantly worse OS and DFS when compared to patients with KRAS wild-type and patients with different pathogenic KRAS mutations (p = 0.041 for OS and p = 0.024 for DFS) (Figure 3A,B).
The TP53 mutational status was subgrouped into TP53 nonsense and frameshift/splice-site mutations (n = 5) vs. TP53 wild-type or TP53 missense mutations (n = 34). Again, clinicopathological variables and histomorphology were distributed homogenously between both groups. In the univariate analysis, patients with nonsense, frameshift/splice-site TP53 mutations showed a significantly worse OS and DFS when compared to patients with TP53 wild-type or TP53 missense mutations (p = 0.021 for OS and p = 0.006 for DFS) (Figure 4A,B). Patients with a third driver mutation other than KRAS and TP53 showed a similar DFS when compared to patients harboring only either KRAS and/or TP53 mutations (p = 0.574) (Figure 5A). However, when considering the 26 patients with metachronous relapse, patients with a third driver mutation showed a significantly worse RSS when compared to patients in which only KRAS and TP53 mutations were detected (p = 0.031) (Figure 5B).
Subgroup analysis was performed between short-term and long-term overall survivors and short-term and long-term disease-free survivors (Table 3). Again, clinicopathological and histomorphological variables were distributed homogenously between groups. KRAS G12D mutation, nonsense and frameshift/splice-site mutations of TP53, evident third or SMAD4 mutations were solely or mostly found in short-term overall or disease-free survivors (<4 years), whereas rare the KRAS mutations Q61H and D57N were only found in long-term overall or disease-free survivors (p = 0.015 and p = 0.029) (Table 3).
A correlation analysis of median allele frequency rates of pathogenic KRAS and TP53 mutations in overall and disease-free survival subgroups was performed (Table 4, Figure 6A–D). The median allele frequency rates of pathogenic KRAS and TP53 was higher in poor overall and disease-free survivors. The higher median allele frequency rate of KRAS reached statistical significance only in poor disease-free survivors, whereas the higher median allele frequency rate of TP53 reached statistical significance in poor overall survivors (Table 4, Figure 6A–D).

4. Discussion

PDAC is an extremely aggressive malignancy with a five-year survival rate that has been stagnant around 10% for decades despite substantial research efforts regarding early diagnosis, adequate patient stratification and improvement of therapy. The concept of PDAC as a uniform disease has already been abandoned, as not only distinct histomorphological subtypes, but also molecular subtypes of PDAC have emerged in studies using a high-throughput molecular analysis of PDAC [28,29,30,31]. The proposed molecular and histomorphological subtypes seem to be linked to patient survival and, in part, to therapy response [28,29,30,31]. However, molecular subtyping of PDAC is still in need of validation and further optimization. For example, the molecular subtypes proposed by different authors show certain similarities, but do not overlap perfectly. In addition, the molecular and histomorphological subtypes also only correspond partially [17].
In this study, we aimed for a thorough histomorphological, molecular and survival analysis of PDAC in a clinically and pathologically well-characterized cohort of patients after a multimodal therapy for hPDAC, with focus on short- vs. long-term survival of pancreatic cancer.
Pathological staging variables as well as histomorphological subgroups were evenly distributed between short- and long-term survivors in this study. Interestingly, the G12D KRAS mutation, nonsense/frameshift/splice-site TP53 mutation, SMAD4 mutation or any other third mutations were solely present in short-term survivors. On the other hand, two rare KRAS mutations, Q61H and D57N, were found only in long-term survivors. As the tumor cellularity was carefully assessed before DNA isolation, we were also able to compare the allele frequency rates of pathogenic KRAS and TP53 mutations. KRAS mutations showed a significantly higher median allele frequency rate in patients with shorter DFS when compared to patients with a longer DFS, and TP53 mutations showed a significantly higher median allele frequency rate in patients with a shorter OS when compared to patients with a longer OS.
Genome-based sequencing of resected PDACs has already been performed extensively in the past and revealed undisputedly that KRAS, TP53 and SMAD4 are the most commonly mutated genes in PDAC [32,33,34,35]. However, data regarding the question whether the mutational profile of short-term and long-term survivors of pancreatic cancers is significantly different, especially regarding the aforementioned mutations, are inconclusive. While Masetti et al. proposed that long-term survivors of PDAC generally show fewer mutations of KRAS, TP53 and SMAD4, Dal Molin and colleagues suggested that the mutational status of long-term survivors’ PDACs does not significantly differ from PDACs unselected for survival [16,32]. These differences in results may be due to methodological limitations of the studies. While in the study by Masetti et al. clinicopathological variables were heterogeneously distributed among patients, Dal Molin et al. did not include a group of PDAC short-term survivors in their analysis. In a more recent study, Yokose et al. suggested that a combination of KRAS and SMAD4 mutations is an independent prognostic factor indicating short-term-survival of pancreatic cancer. However, in this study, adjuvant therapy was only administered in 84% of the patients, only 56% of the patients had PDAC of the pancreatic head, and the R status was not evaluated according to otherwise well-established standardized protocols, resulting in limited comparability of the data [36,37,38].
KRAS mutations in PDAC are known to act as the driver for tumor formation. Studies have shown that the presence of specific KRAS mutations is influenced by the mutagenic events taking place in the tissue. For example, in PDAC, the most frequently observed pathogenic variant, the G12D KRAS mutation (the replacement of nucleotide sequence GGT with GAT in codon 12 of exon 2 of the KRAS gene), is linked to a clock-like mutational event (intrinsic, related to the patient’s age), while Q61H KRAS mutations are linked to oxidative stress [39]. In turn, different pathogenic KRAS mutations result in alternating activation cascades in the KRAS pathway [39]. It has been shown that the prognostic significance of a KRAS mutation is dependent on which specific KRAS mutation is present and thus, which activation cascade is activated [40]. A G12D KRAS mutation is generally associated with worse survival, e.g., when compared to KRAS mutations in codon 61, which, in turn, indicate a favorable prognosis [40,41]. Our study showed similar findings. Mutations resulting in subtype G12D were also the most frequent in our collective and were associated with worse OS and DFS. On the other hand, a Q61H mutation of KRAS was found only in two cases in our cohort, and these were cases of long-term PDAC survivors.
In addition to which specific pathogenic KRAS mutation was present, patient survival seemed to depend on the allele frequency of pathogenic KRAS mutations in our cohort: patients with higher allele frequency rates of pathogenic KRAS mutations showed significantly poorer DFS than patients with lower allele frequency rates of pathogenic KRAS mutations. The allele frequency in somatic tumor samples is dependent on several factors, most prominently on the presence of somatic vs. germline mutation and the proportion of tumor cells within the sample (tumor cellularity) [42]. As PDAC is driven by somatic rather than germline KRAS mutations and the tumor cellularity was ensured to be sufficient and comparable in all samples used in this study, we may hypothesize that the allele frequency may have at least some predictive value regarding the proportion of tumor cells carrying a mutation of the respective gene (i.e., percentage of tumor cell subclones with a pathogenic KRAS mutation) in this cohort. These different median allele frequency rates of pathogenic KRAS mutations between short- and long-term PDAC survivors might be explained by the role of KRAS mutations in inducing tumor progression, with tumors showing higher allele frequency rates for pathogenic KRAS mutations, i.e., tumors harboring a higher proportion of KRAS-mutated subclones, showing a faster tumor progression, hence its link to early disease recurrence in our study. The impact of the allele frequencies of pathogenic mutations on patient outcome has already been evaluated in other solid malignancies, e.g., in malignant melanoma [43].
TP53 prevents cancer formation and thus functions as a tumor suppressor gene and represents one of the most common genetic lesions in cancer [44,45]. We noticed that in 64% of cases in our study cohort, pathogenic TP53 mutations were evident. More importantly, nonsense and frameshift/splice-site mutations were solely evident in patients with a short OS and DFS, corroborating previously published results linking pathogenic mutations of TP53 to a shortened disease-free survival of pancreatic cancer [44]. The phenotypical effects of mutant TP53 in pancreatic cancer were demonstrated by Weissmueller et al. in an in vitro analysis, which showed that the sustained expression of the mutant TP53 allele is necessary to maintain the invasive phenotype of PDAC [46]. Although TP53 mutations have been suggested to play a role in a worse survival of PDAC patients, pathogenic alterations of TP53 may also be associated with gemcitabine sensitivity [44].
A loss of function of SMAD4 is known to correlate with a significantly greater chance of metastatic relapse and with overall worse prognosis [47,48]. Our data revealed similar findings since SMAD4 mutations were almost exclusively found in short-term survivors of PDAC. In addition, patients with three different driver mutations of the primary tumor, including a loss of function of SMAD4, showed a significantly worse relapse-specific survival, confirming the results of previous studies [17].
This study has several limitations. NGS analysis was only performed in a small fraction of cases. Thus, only a univariate survival analysis could be performed. Nevertheless, all survival-relevant clinicopathological variables such as T category, N category, and tumor grading, were evenly distributed across KRAS, TP53 and third driver mutation subgroups. Furthermore, DNA sequencing was not feasible in many paraffin-embedded tumor tissues stored for a long time (>2 years). Thus, a lower number of long-term survivors were evaluated compared to patients who succumbed earlier to disease progression. Hence, the future focus should be placed on prospective multicenter studies to identify long-term survivors of pancreatic cancer in order to understand mutational differences that clearly separate short-term vs. long-term survivors.

5. Conclusions

In summary, our results suggest that somatic variants in genes commonly mutated in PDAC are presumably primary determinants for superior DFS and OS in PDAC patients. Because long-term survival of surgically resected PDAC is rare, results from a single institution analysis should be validated. Multi-institutional studies are clearly warranted in order to understand mutational differences, and, if available in the future, to apply targeted therapies.

Supplementary Materials

The following are available online at https://www.mdpi.com/article/10.3390/cancers14030850/s1, Table S1: Primary antibodies used for immunohistochemistry. Table S2: Correlation analysis between immunohistochemical expression status of p53, p16 and Smad4 and clinicopathological variables. A Mann–Whitney U test was used to test for significance (p-value < 0.05 indicates significance); Table S3: Correlation analysis between clinicopathological variables, immunohistochemical expression status of p53, p16 and Smad4 and histomorphology (classical vs. rest). A Mann–Whitney U test was used to test for significance (p-value < 0.05 indicates significance); Table S4: Correlation analysis between KRAS and TP53 mutations; n = 39. Statistical significance was calculated by a Mann–Whitney U test and Fisher’s exact test (p-value < 0.05 indicates significance). The distribution of different mutations across KRAS and TP53 was similar. Correlation analysis between third mutations, KRAS and TP53 mutations; n = 39. There was a homogenous distribution between KRAS and TP53 mutations and third evident mutation. The statistical significance was calculated by a Mann–Whitney U test and Fisher’s exact test (p-value < 0.05 indicates significance); Table S5: Correlation analysis between KRAS/TP53 allele frequency rate and histomorphological as well as clinicopathological subgroups. A Mann–Whitney U test was used to test for significance (p-value < 0.05 indicates significance). Supplemental Figure S1. Histomorphology of an exemplary PDAC case from the present patient cohort. An area with adequate tumor cellularity (≥80%) was marked for manual macrodissection (yellow dotted line) (H&E, 30×); Supplemental Figure S2. Immunohistochemical (IHC) analyses. (A–C): IHC of p53. Wild-type expression pattern with staining of weak intensity in some of the tumor cell nuclei (A), aberrant expression in the form of overexpression (B) and aberrant expression in the form of complete loss of expression are shown (100×, respectively). (D,E) IHC of Smad4. Wild-type expression pattern with nuclear positivity of Smad4 in PDAC cells (D) and aberrant expression in the form of complete loss of Smad4 expression in PDAC cell nuclei (E) are shown (100×, respectively). (F,G) IHC of p16. Wild-type expression pattern with cytoplasmic and nuclear p16 positivity of PDAC cells (F, 100×) and aberrant expression in the form of complete loss of p16 expression in PDAC cells (G, 200×) are shown. In (E) and (G), Smad4- and p16-positive stromal cells serve as internal positive controls, respectively.

Author Contributions

Study conception (I.E., S.-A.S. and L.H.) and design (I.E., S.-A.S. and L.H.), statistical analysis (S.-A.S. and L.H.), interpretation of data (S.-A.S., W.G., I.E., L.H.), drafting of the manuscript (S.-A.S. and L.H.), revising the manuscript (I.E.), data acquisition (S.-A.S. and L.H.), mutational analysis (W.G.), conceptual contributions and manuscript revision (V.K., G.F., N.S., A.R. and W.T.K.). All authors have read and agreed to the published version of the manuscript.

Funding

This research received no external funding.

Institutional Review Board Statement

This study was approved by the local institutional review board (Heinrich Heine University, Duesseldorf, Germany; study-no.: 5387). All procedures performed in this study were in accordance with the ethical standards in the 1964 Declaration of Helsinki and its later amendments. Informed consent was waived because no data regarding the cases were disclosed.

Informed Consent Statement

Informed consent was waived because no data regarding the cases were disclosed.

Data Availability Statement

The datasets used and/or analyzed during the current study are available from the corresponding author on reasonable request.

Conflicts of Interest

The authors declare no conflict of interest.

References

  1. Rahib, L.; Smith, B.D.; Aizenberg, R.; Rosenzweig, A.B.; Fleshman, J.M.; Matrisian, L.M. Projecting cancer incidence and deaths to 2030: The unexpected burden of thyroid, liver, and pancreas cancers in the United States. Cancer Res. 2014, 74, 2913–2921. [Google Scholar] [CrossRef] [Green Version]
  2. Quante, A.S.; Ming, C.; Rottmann, M.; Engel, J.; Boeck, S.; Heinemann, V.; Westphalen, C.B.; Strauch, K. Projections of cancer incidence and cancer-related deaths in Germany by 2020 and 2030. Cancer Med. 2016, 5, 2649–2656. [Google Scholar] [CrossRef]
  3. Oettle, H.; Post, S.; Neuhaus, P.; Gellert, K.; Langrehr, J.; Ridwelski, K.; Schramm, H.; Fahlke, J.; Zuelke, C.; Burkart, C.; et al. Adjuvant Chemotherapy With Gemcitabine vs Observation in Patients Undergoing Curative-Intent Resection of Pancreatic Cancer. JAMA 2007, 297, 267–277. [Google Scholar] [CrossRef] [PubMed]
  4. Neoptolemos, J.P.; Palmer, D.H.; Ghaneh, P.; Psarelli, E.E.; Valle, J.W.; Halloran, C.M.; Faluyi, O.; O’Reilly, D.A.; Cunningham, D.; Wadsley, J.; et al. Comparison of adjuvant gemcitabine and capecitabine with gemcitabine monotherapy in patients with resected pancreatic cancer (ESPAC-4): A multicentre, open-label, randomised, phase 3 trial. Lancet 2017, 389, 1011–1024. [Google Scholar] [CrossRef]
  5. Ryan, D.P.; Hong, T.S.; Bardeesy, N. Pancreatic adenocarcinoma. N. Engl. J. Med. 2014, 371, 2140–2141. [Google Scholar] [CrossRef]
  6. Safi, S.A.; Lehwald-Tywuschik, N.; Rehders, A.; Fluegen, G.; Haeberle, L.; Keitel, V.; Knoefel, W.T. Site of relapse of ductal adenocarcinoma of the pancreas affects survival after multimodal therapy. BMC Surg. 2021, 21, 1–9. [Google Scholar] [CrossRef]
  7. Siegel, R.L.; Miller, K.D.; Jemal, A. Cancer statistics, 2020. CA A Cancer J. Clin. 2020, 70, 7–30. [Google Scholar] [CrossRef]
  8. Werner, J.; Combs, S.; Springfeld, C.; Hartwig, W.; Hackert, T.; Büchler, M.W. Advanced-stage pancreatic cancer: Therapy options. Nat. Rev. Clin. Oncol. 2013, 10, 323–333. [Google Scholar] [CrossRef]
  9. Conroy, T.; Hammel, P.; Hebbar, M.; Ben Abdelghani, M.; Wei, A.C.; Raoul, J.-L.; Choné, L.; Francois, E.; Artru, P.; Biagi, J.J.; et al. FOLFIRINOX or Gemcitabine as Adjuvant Therapy for Pancreatic Cancer. N. Engl. J. Med. 2018, 379, 2395–2406. [Google Scholar] [CrossRef]
  10. Haeberle, L.; Esposito, I. Pathology of pancreatic cancer. Transl. Gastroenterol. Hepatol. 2019, 4, 50. [Google Scholar] [CrossRef]
  11. Demir, I.E.; Jäger, C.; Schlitter, A.M.; Konukiewitz, B.; Stecher, L.; Schorn, S.; Tieftrunk, E.; Scheufele, F.; Calavrezos, L.; Schirren, R.; et al. R0 Versus R1 Resection Matters after Pancreaticoduodenectomy, and Less after Distal or Total Pancreatectomy for Pancreatic Cancer. Ann. Surg. 2018, 268, 1058–1068. [Google Scholar] [CrossRef]
  12. Safi, S.-A.; Haeberle, L.; Fluegen, G.; Lehwald-Tywuschik, N.; Krieg, A.; Keitel, V.; Luedde, T.; Esposito, I.; Rehders, A.; Knoefel, W. Mesopancreatic excision for pancreatic ductal adenocarcinoma improves local disease control and survival. Pancreatology 2021, 21, 787–795. [Google Scholar] [CrossRef]
  13. Jones, S.; Zhang, X.; Parsons, D.W.; Lin, J.C.-H.; Leary, R.J.; Angenendt, P.; Mankoo, P.; Carter, H.; Kamiyama, H.; Jimeno, A.; et al. Core Signaling Pathways in Human Pancreatic Cancers Revealed by Global Genomic Analyses. Science 2008, 321, 1801–1806. [Google Scholar] [CrossRef] [PubMed] [Green Version]
  14. Waters, A.M.; Der, C.J. KRAS: The Critical Driver and Therapeutic Target for Pancreatic Cancer. Cold Spring Harb. Perspect. Med. 2018, 8, 267–277. [Google Scholar] [CrossRef] [PubMed]
  15. Isobe, M.; Emanuel, B.S.; Givol, D.; Oren, M.; Croce, C.M. Localization of gene for human p53 tumour antigen to band 17p13. Nature 1986, 320, 84–85. [Google Scholar] [CrossRef]
  16. Masetti, M.; Acquaviva, G.; Visani, M.; Tallini, G.; Fornelli, A.; Ragazzi, M.; Vasuri, F.; Grifoni, D.; Di Giacomo, S.; Fiorino, S.; et al. Long-term survivors of pancreatic adenocarcinoma show low rates of genetic alterations in KRAS, TP53 and SMAD4. Cancer Biomarkers 2018, 21, 323–334. [Google Scholar] [CrossRef] [PubMed]
  17. Schlitter, A.M.; Segler, A.; Steiger, K.; Michalski, C.W.; Jäger, C.; Konukiewitz, B.; Pfarr, N.; Endris, V.; Bettstetter, M.; Kong, B.; et al. Molecular, morphological and survival analysis of 177 resected pancreatic ductal adenocarcinomas (PDACs): Identification of prognostic subtypes. Sci. Rep. 2017, 7, srep41064. [Google Scholar] [CrossRef] [Green Version]
  18. Adham, M.; Jaeck, D.; Le Borgne, J.; Oussoultzouglou, E.; Chenard-Neu, M.-P.; Mosnier, J.-F.; Scoazec, J.-Y.; Mornex, F.; Partensky, C. Long-Term Survival (5–20 Years) After Pancreatectomy for Pancreatic Ductal Adenocarcinoma. Pancreas 2008, 37, 352–357. [Google Scholar] [CrossRef]
  19. Ferrone, C.R.; Brennan, M.F.; Gonen, M.; Coit, D.G.; Fong, Y.; Chung, S.; Tang, L.; Klimstra, D.; Allen, P.J. Pancreatic adenocarcinoma: The actual 5-year survivors. J. Gastrointest. Surg. 2008, 12, 701–706. [Google Scholar] [CrossRef]
  20. Ferrone, C.R.; Pieretti-Vanmarcke, R.; Bloom, J.P.; Zheng, H.; Szymonifka, J.; Wargo, J.A.; Thayer, S.P.; Lauwers, G.Y.; Deshpande, V.; Mino-Kenudson, M.; et al. Pancreatic ductal adenocarcinoma: Long-term survival does not equal cure. Surgery 2012, 152, S43–S49. [Google Scholar] [CrossRef] [Green Version]
  21. El Nakeeb, A.; El Sorogy, M.; Ezzat, H.; Said, R.; El Dosoky, M.; El Gawad, M.A.; Elsabagh, A.M.; El Hanafy, E. Predictors of long-term survival after pancreaticoduodenectomy for peri-ampullary adenocarcinoma: A retrospective study of 5-year survivors. Hepatobiliary Pancreat. Dis. Int. 2018, 17, 443–449. [Google Scholar] [CrossRef]
  22. Nakagawa, K.; Akahori, T.; Nishiwada, S.; Nagai, M.; Nakamura, K.; Tanaka, T.; Tamamoto, T.; Ohbayashi, C.; Hasegawa, M.; Kichikawa, K.; et al. Prognostic factors for actual long-term survival in the era of multidisciplinary treatment for pancreatic ductal adenocarcinoma. Langenbeck’s Arch. Surg. 2018, 403, 693–700. [Google Scholar] [CrossRef] [PubMed]
  23. Balachandran, V.P.; Łuksza, M.; Zhao, J.N.; Makarov, V.; Moral, J.A.; Remark, R.; Herbst, B.; Askan, G.; Bhanot, U.; Sendabaoglu, Y.; et al. Identification of unique neoantigen qualities in long-term survivors of pancreatic cancer. Nature 2017, 551, 512–516. [Google Scholar] [CrossRef]
  24. Bertero, L.; Massa, F.; Metovic, J.; Zanetti, R.; Castellano, I.; Ricardi, U.; Papotti, M.; Cassoni, P. Eighth Edition of the UICC Classification of Malignant Tumours: An overview of the changes in the pathological TNM classification criteria-What has changed and why? Virchows Arch. 2018, 472, 519–531. [Google Scholar] [CrossRef] [PubMed]
  25. Nagtegaal, I.D.; Odze, R.D.; Klimstra, D.; Paradis, V.; Rugge, M.; Schirmacher, P.; Washington, K.M.; Carneiro, F.; Cree, I.A.; The WHO Classification of Tumours Editorial Board. The 2019 WHO classification of tumours of the digestive system. Histopathology 2020, 76, 182–188. [Google Scholar] [CrossRef] [PubMed] [Green Version]
  26. Robinson, J.T.; Thorvaldsdóttir, H.; Winckler, W.; Guttman, M.; Lander, E.S.; Getz, G.; Mesirov, J.P. Integrative genomics viewer. Nat. Biotechnol. 2011, 29, 24–26. [Google Scholar] [CrossRef] [PubMed] [Green Version]
  27. Thorvaldsdóttir, H.; Robinson, J.T.; Mesirov, J.P. Integrative Genomics Viewer (IGV): High-performance genomics data visualization and exploration. Brief. Bioinform. 2013, 14, 178–192. [Google Scholar] [CrossRef] [Green Version]
  28. Collisson, E.A.; Sadanandam, A.; Olson, P.; Gibb, W.J.; Truitt, M.; Gu, S.; Cooc, J.; Weinkle, J.; Kim, G.E.; Jakkula, L.; et al. Subtypes of pancreatic ductal adenocarcinoma and their differing responses to therapy. Nat. Med. 2011, 17, 500–503. [Google Scholar] [CrossRef]
  29. Bailey, P.; Chang, D.K.; Nones, K.; Johns, A.L.; Patch, A.-M.; Gingras, M.-C.; Miller, D.K.; Christ, A.N.; Bruxner, T.J.C.; Quinn, M.C.; et al. Genomic analyses identify molecular subtypes of pancreatic cancer. Nature 2016, 531, 47–52. [Google Scholar] [CrossRef]
  30. Waddell, N.; Pajic, M.; Patch, A.-M.; Chang, D.K.; Kassahn, K.S.; Bailey, P.; Johns, A.L.; Miller, D.; Nones, K.; Quek, K.; et al. Whole genomes redefine the mutational landscape of pancreatic cancer. Nature 2015, 518, 495–501. [Google Scholar] [CrossRef] [Green Version]
  31. Moffitt, R.A.; Marayati, R.; Flate, E.L.; Volmar, K.E.; Loeza, S.G.H.; Hoadley, K.A.; Rashid, N.U.; Williams, L.A.; Eaton, S.C.; Chung, A.H.; et al. Virtual microdissection identifies distinct tumor- and stroma-specific subtypes of pancreatic ductal adenocarcinoma. Nat. Genet. 2015, 47, 1168–1178. [Google Scholar] [CrossRef]
  32. Molin, M.D.; Zhang, M.; De Wilde, R.F.; Ottenhof, N.A.; Rezaee, N.; Wolfgang, C.L.; Blackford, A.; Vogelstein, B.; Kinzler, K.W.; Papadopoulos, N.; et al. Very Long-term Survival Following Resection for Pancreatic Cancer Is Not Explained by Commonly Mutated Genes: Results of Whole-Exome Sequencing Analysis. Clin. Cancer Res. 2015, 21, 1944–1950. [Google Scholar] [CrossRef] [Green Version]
  33. Goldstein, J.B.; Zhao, L.; Wang, X.; Ghelman, Y.; Overman, M.J.; Javle, M.M.; Shroff, R.T.; Varadhachary, G.R.; Wolff, R.A.; McAllister, F.; et al. Germline DNA Sequencing Reveals Novel Mutations Predictive of Overall Survival in a Cohort of Patients with Pancreatic Cancer. Clin. Cancer Res. 2019, 26, 1385–1394. [Google Scholar] [CrossRef] [PubMed]
  34. Singh, P.; Srinivasan, R.; Wig, J.D. SMAD4 Genetic Alterations Predict a Worse Prognosis in Patients With Pancreatic Ductal Adenocarcinoma. Pancreas 2012, 41, 541–546. [Google Scholar] [CrossRef]
  35. Cicenas, J.; Kvederaviciute, K.; Meskinyte, I.; Meskinyte-Kausiliene, E.; Skeberdyte, A.; Cicenas, J. KRAS, TP53, CDKN2A, SMAD4, BRCA1, and BRCA2 Mutations in Pancreatic Cancer. Cancers 2017, 9, 42. [Google Scholar] [CrossRef] [Green Version]
  36. Yokose, T.; Kitago, M.; Matsuda, S.; Sasaki, Y.; Masugi, Y.; Nakamura, Y.; Shinoda, M.; Yagi, H.; Abe, Y.; Oshima, G.; et al. Combination of KRAS and SMAD4 mutations in formalin-fixed paraffin-embedded tissues as a biomarker for pancreatic cancer. Cancer Sci. 2020, 111, 2174–2182. [Google Scholar] [CrossRef] [PubMed]
  37. Esposito, I.; Kleeff, J.; Bergmann, F.; Reiser, C.; Herpel, E.; Friess, H.; Schirmacher, P.; Büchler, M.W. Most Pancreatic Cancer Resections are R1 Resections. Ann. Surg. Oncol. 2008, 15, 1651–1660. [Google Scholar] [CrossRef]
  38. Häberle, L.; Esposito, I. Circumferential resection margin (CRM) in pancreatic cancer. Surg. Pract. Sci. 2020, 1, 100006. [Google Scholar] [CrossRef]
  39. Cook, J.H.; Melloni, G.E.M.; Gulhan, D.C.; Park, P.J.; Haigis, K.M. The origins and genetic interactions of KRAS mutations are allele- and tissue-specific. Nat. Commun. 2021, 12, 1–14. [Google Scholar] [CrossRef]
  40. Witkiewicz, A.K.; McMillan, E.A.; Balaji, U.; Baek, G.; Lin, W.-C.; Mansour, J.; Mollaee, M.; Wagner, K.-U.; Koduru, P.; Yopp, A.; et al. Whole-exome sequencing of pancreatic cancer defines genetic diversity and therapeutic targets. Nat. Commun. 2015, 6, 6744. [Google Scholar] [CrossRef]
  41. Bournet, B.; Muscari, F.; Buscail, C.; Assenat, E.; Barthet, M.; Hammel, P.; Selves, J.; Guimbaud, R.; Cordelier, P.; Buscail, L. KRAS G12D Mutation Subtype Is A Prognostic Factor for Advanced Pancreatic Adenocarcinoma. Clin. Transl. Gastroenterol. 2016, 7, e157. [Google Scholar] [CrossRef]
  42. Strom, S.P. Current practices and guidelines for clinical next-generation sequencing oncology testing. Cancer Biol. Med. 2016, 13, 3–11. [Google Scholar] [CrossRef] [PubMed] [Green Version]
  43. Berrino, E.; Balsamo, A.; Pisacane, A.; Gallo, S.; Becco, P.; Miglio, U.; Caravelli, D.; Poletto, S.; Paruzzo, L.; Debernardi, C.; et al. High BRAF variant allele frequencies are associated with distinct pathological features and responsiveness to target therapy in melanoma patients. ESMO Open 2021, 6, 100133. [Google Scholar] [CrossRef] [PubMed]
  44. Sinn, M.; Sinn, B.V.; Treue, D.; Keilholz, U.; Damm, F.; Schmuck, R.B.; Lohneis, P.; Klauschen, F.; Striefler, J.K.; Bahra, M.; et al. TP53 mutations predict sensitivity to adjuvant gemcitabine in patients with pancreatic ductal adenocarcinoma: Next-generation sequencing results from the CONKO-001 trial. Clin. Cancer Res. 2020, 26, 3732–3739. [Google Scholar] [CrossRef] [PubMed] [Green Version]
  45. Freed-Pastor, W.A.; Prives, C. Mutant p53: One name, many proteins. Genes Dev. 2012, 26, 1268–1286. [Google Scholar] [CrossRef] [PubMed] [Green Version]
  46. Weissmueller, S.; Manchado, E.; Saborowski, M.; Morris, J.P., IV; Wagenblast, E.; Davis, C.A.; Moon, S.-H.; Pfister, N.T.; Tschaharganeh, D.F.; Kitzing, T.; et al. Mutant p53 Drives Pancreatic Cancer Metastasis through Cell-Autonomous PDGF Receptor β Signaling. Cell 2014, 157, 382–394. [Google Scholar] [CrossRef] [Green Version]
  47. Yachida, S.; White, C.M.; Naito, Y.; Zhong, Y.; Brosnan, J.A.; Macgregor-Das, A.M.; Morgan, R.A.; Saunders, T.; Laheru, D.A.; Herman, J.M.; et al. Clinical Significance of the Genetic Landscape of Pancreatic Cancer and Implications for Identification of Potential Long-term Survivors. Clin. Cancer Res. 2012, 18, 6339–6347. [Google Scholar] [CrossRef] [Green Version]
  48. Iacobuzio-Donahue, C.A.; Fu, B.; Yachida, S.; Luo, M.; Abe, H.; Henderson, C.M.; Vilardell, F.; Wang, Z.; Keller, J.W.; Banerjee, P.; et al. DPC4 Gene Status of the Primary Carcinoma Correlates With Patterns of Failure in Patients With Pancreatic Cancer. J. Clin. Oncol. 2009, 27, 1806–1813. [Google Scholar] [CrossRef] [Green Version]
Figure 1. Flow chart of study cohort (CRM: circumferential resection margin; DFS: disease-free survival; IHC: immunohistochemical; NGS: next generation sequencing; OS: overall survival).
Cancers 14 00850 g001
Figure 2. Oncoprint with an overview of all cases in this study whose next generation panel sequencing (NGS) was successfully performed. Rare pathogenic mutations of KRAS were only noted in long-term survivors.
Cancers 14 00850 g002
Figure 3. Kaplan–Meier survival curves for: (A) Overall survival of patients with a KRAS G12D mutation and patients with other KRAS mutations and WT (n = 39). (B) Disease-free survival of patients with KRAS G12D mutation and patients with other KRAS mutation and WT (n = 39). Log-rank test was used to test for significance. p-value < 0.05 indicates significance. Patients with KRAS G12D mutations showed a significantly worse OS and DFS when compared to patients with all other KRAS mutations or WT.
Cancers 14 00850 g003
Figure 4. Kaplan–Meier survival curves for (A) overall survival of patients and (B) disease-free survival of patients with NS/FS/SS TP53 mutations and patients with MS mutations of TP53 or WT (n = 39). Log-rank test was used to test for significance. p-value < 0.05 indicates significance. Patients with TP53 nonsense and splice-site mutations showed a significantly worse OS and DFS survival when compared to patients with TP miss-sense mutations or WT.
Cancers 14 00850 g004
Figure 5. Kaplan–Meier survival curves for: (A) Disease-free survival of patients with any third mutation and patients harboring KRAS mutation and/or TP53 mutations (n = 39). (B) Relapse-specific survival of patients with any third mutation and patients harboring KRAS mutation and/or TP53 mutations (n = 39). Log-rank test was used to test for significance. p-value < 0.05 indicates significance.
Cancers 14 00850 g005
Figure 6. Box plots of (A) KRAS allele frequency rate and overall survival (n = 39). (B) KRAS allele frequency rate and disease-free survival (n = 39). (C) TP53 allele frequency rate and overall survival (n = 39). (D) TP53 allele frequency rate and disease-free survival (n = 39). Mann–Whitney U tests were used to test for significance (p-value < 0.05 indicates significance).
Cancers 14 00850 g006
Table 1. Demographic data of the patient cohort from 2004–2016; n = 39. Most patients were diagnosed with an advanced stage of disease.
Age in YearsPatients (Total)Patients (Percentage)
Median (Range)66 (47–88)
n%
Gender
Male2461.5
Female1538.5
T stage
T137.7
T21846.2
T31641.0
T425.1
N stage
N0717.9
N12359.0
N2923.1
Grading
G22769.2
G31230.8
Pn
Pn01025.6
Pn12974.4
L
L01641.0
L12359.0
V
V02769.2
V11230.8
R status
R11641.0
R0CRM+615.4
R0CRM−1743.6
CRM: circumferential resection margin; Pn: perineural invasion; L: lymphatic invasion; V: venous invasion.
Table 2. Correlation analysis between clinicopathological variables and mutations. Chi-squared test (p-value < 0.05 indicates significance). There was a homogenous distribution of clinicopathological, histomorphological and immunohistochemical variables across mutation subgroups.
NGS KRAS G12D
vs. Rest and WT
NGS TP53 NS/FS/SS
vs. Rest and WT
3rd Mutation vs. Only KRAS/TP53 Mutation
n = 39n = 39n = 39
Chi-squared testp-valuep-valuep-value
Median Age0.4710.8231.000
Gender0.9440.4010.740
T stage0.9210.8870.337
N stage0.9210.6690.864
G0.2880.2390.824
Pn0.3260.0660.052
L0.4920.8010.510
V0.6090.5350.728
Resection status0.2750.9510.855
Relapse location0.1140.1840.733
Histomorphology0.6730.5330.643
p53 IHC0.5610.3690.489
p16 IHC0.9240.6250.716
Smad4 IHC0.1610.7140.143
IHC: immunohistochemistry; L: lymphatic invasion; NGS: next generation sequencing; NS/FS/SS: nonsense/frameshift/splice-site; Pn: perineural invasion V: venous invasion, WT: wild-type.
Table 3. Correlation analysis between survivor subgroups and oncogenic mutation; n = 39. Fisher’s exact test was used to test for significance (p-value < 0.05 indicates significance).
Mutational StatusOSOS DFSDFS
<4 Years≥4 Yearsp-Value<2 Years≥2 Yearsp-Value
n = 31n = 8 n = 32n = 7
KRAS NGS
G12D1310.0151400.005
G12V/R/C and WT184 184
Q61H/D57N03 03
TP53 NGS
NS + SS500.563500.563
WT + MS268 277
SMAD4 NGS
Yes411.000500.898
No277 --
Other 3rd driver mutation
Yes1120.7511120.884
No206 215
p53 IHC
Aberrant1551.0001641.000
Normal123 123
p16 IHC
Normal821.000821.000
Loss206 215
Smad4 IHC
Normal830.672740.163
Loss215 233
DFS: disease-free survival; IHC: immunohistochemistry; NGS: next generation sequencing; NS: nonsense; MS: missense; OS: overall survival; SS: splice site; WT: wild type.
Table 4. Correlation analysis between survivor subgroups and median allele frequency rates of pathogenic KRAS and TP53 mutations. A Mann–Whitney U test was used to test for significance (p-value < 0.05 indicates significance).
OSOS DFSDFS
<4 Years≥4 Yearsp-Value<2 Years≥2 Yearsp-Value
n = 31n = 8 n = 32n = 7
Median (range)
allele
frequency rate
KRAS
14%
(2–32%)
11%
(4–30%)
0.36814.5%
(2–32%)
11.0%
(4–13%)
0.042
Median (range)
allele
frequency rate
TP53
17%
(10–54%)
11%
(2–17%)
0.01717%
(2–54%)
12%
(10–14%)
0.054
DFS: disease-free survival; OS: overall survival.
Publisher’s Note: MDPI stays neutral with regard to jurisdictional claims in published maps and institutional affiliations.

