Article

VISTA in Soft Tissue Sarcomas: A Perspective for Immunotherapy?

1
Department of General, Visceral and Transplantation Surgery, University Hospital, Ludwig-Maximilians-Universität (LMU) Munich, 81377 Munich, Germany
2
Department of General, Visceral and Vascular Surgery, Friedrich-Schiller Universität Jena, 07747 Jena, Germany
3
Department of Internal Medicine III, University Hospital, Ludwig-Maximilians-Universität (LMU), 81377 Munich, Germany
4
Musculoskeletal Oncology, Department of Orthopaedic Surgery, Physical Medicine and Rehabilitation, University Hospital, Ludwig-Maximilians-Universität (LMU) Munich, 81377 Munich, Germany
5
Institute of Pathology, Ludwig-Maximilians-Universität (LMU) Munich, 81377 Munich, Germany
6
Department of Pathology, Memorial Sloan Kettering Cancer Center (MSKCC), New York, NY 10065, USA
*
Authors to whom correspondence should be addressed.
Cancers 2022, 14(4), 1006; https://doi.org/10.3390/cancers14041006
Submission received: 18 January 2022 / Revised: 10 February 2022 / Accepted: 14 February 2022 / Published: 16 February 2022
(This article belongs to the Special Issue Feature Paper from Journal Reviewers)

Abstract

:

Simple Summary

V domain immunoglobulin suppressor of T cell activation (VISTA) has recently been described as a protein expressed on immune cells and tumour cells and a possible target for immunotherapy. We show for the first time that VISTA is broadly expressed across subtypes of soft tissue sarcoma. We found VISTA related to other immunopathological parameters such as tumour-infiltrating lymphocytes and observed improved survival in patients with non-T-cell-inflamed tumours expressing VISTA. Our research supports the notion of VISTA as a potential target for immunotherapy in soft tissue sarcoma.

Abstract

(1) Background: V domain immunoglobulin suppressor of T cell activation (VISTA) plays a critical role in antitumor immunity and may be a valuable target in cancer immunotherapy. To date, it has never been studied in a large and well-characterised cohort of soft tissue sarcomas (STS). (2) Methods: Using immunohistochemistry, we examined VISTA expression in tumour tissues of 213 high-risk STS. We then analysed whether VISTA was associated with other clinicopathological parameters, including tumour-infiltrating lymphocyte (TIL) counts, programmed death receptor-1 (PD1), programmed death ligand-1 (PDL1), CD3, grading, and long-term survival. (3) Results: We observed VISTA expression in 96 (45%) of 213 specimens with distinct patterns ranging from 26 to 63% for histological subtypes. VISTA was associated with higher grade (G3 vs. G2, p = 0.019), higher TIL counts (p = 0.033), expression of PD1 (p = 0.046), PDL1 (p = 0.031), and CD3+ (p = 0.023). In patients without CD3+ TILs, 10-year survival was higher when VISTA was expressed compared to when there was no VISTA expression (p = 0.013). In a multivariate analysis, VISTA expression was independently associated with prolonged survival (p = 0.043). (4) Conclusions: VISTA is expressed in different STS subtypes and is associated with increased TILs, PD-1, PD-L1, and CD3 expression. Patients with VISTA+ tumours show improved survival. These results may help define future immunotherapeutic approaches in STS.

1. Introduction

Malignant soft tissue sarcomas (STS) are a group of more than 100 rare but histopathologically distinct tumours. Originating from mesenchymal tissue, their clinical behaviour ranges from slow growth in grade 1 liposarcoma to local aggressiveness with high recurrence rates in undifferentiated pleomorphic sarcoma or frequent distant metastases in leiomyosarcoma. We regularly apply systemic therapy in high-risk, recurrent, and metastatic patients. Still, the choice of treatment is sometimes difficult due to a paucity of specific recommendations [1,2], and the prognosis of advanced cases remains limited. Following advances in other cancers and the identification of potential targets in STS, different immunotherapeutic approaches have been proposed, including immune checkpoint inhibition, adoptive cell transfer, and tumour vaccinations [3,4]. In clinical trials, however, the efficacy of such strategies was often found to be limited, and novel approaches need to be investigated [5].
V-domain Ig-containing suppressor of T-cell activation (VISTA) is an immune checkpoint gene highly expressed in the environment of malignant tumours that suppresses T-cell activation and induces Foxp3 expression [6]. As a negative checkpoint regulator that shares homology with PD-L1, tumour cells may exploit VISTA to oppose an attack from anti-tumour T-cells. Like PD-1 and PD-L1-directed immunotherapy, VISTA blockade offers a potential immunotherapeutic strategy against cancer. To our knowledge, VISTA has not been described in STS. Therefore, we attempted to analyse the expression of VISTA in a large cohort of mixed STS on the protein level and correlate our results to clinic-pathological parameters and survival in STS patients.

2. Materials and Methods

2.1. Patients

We identified 213 STS cases from the archives of the Institute of Pathology at Ludwig-Maximilians-Universität (LMU) Munich, Germany. Patients had been diagnosed with high-risk STS (G2/G3 FNCLCC grading, size > 5 cm, deep tumour location) between 1989 and 2012 and received neoadjuvant multimodal treatment at LMU University Hospital and partnering institutions. From the database of the previously published EORTC-STBSG 62961 trial (NCT00003052) [7] and original pathology reports, we retrieved basic clinical data and tumour-related information, such as histological subtype, grading, primary site, size, presence of metastatic disease, and surgical outcome. In addition, we recorded whether chemotherapy, regional hyperthermia, or radiotherapy had been performed as a part of multimodal treatment. We followed patients in outpatient clinics or contacted their general practitioner, updating clinical data until December 2019. The ethics committee at LMU Munich approved this study (protocol code 21-0216).

2.2. Histopathology and Tissue Microarray Construction

Whenever possible, we used biopsies that had been taken before the initiation of neoadjuvant treatment from areas of the tumour that appeared dedifferentiated on preoperative cross-sectional imaging (n = 165, 77.5%); in 48 patients (22.5%), only tissue samples from surgical specimens were available for this analysis. Two investigators (E.K. and T.K.) reassessed the microscopic findings of the original pathology report, such as tumour type, according to the current WHO classification and degree of differentiation.
For tissue microarray (TMA) assembly, we marked representative tumour areas on H&E-stained slides of formalin-fixed, paraffin-embedded tumour probes, as described previously [8], and took two 0.6 mm punch biopsies from each sample. Samples from tonsils were added as controls. Standard 5 µm TMA sections were prepared for further analysis.

2.3. VISTA Immunohistochemistry

We defined VISTA expression on tumour cells as the primary outcome of this study. Following morphological evaluation, we used D1L2G antibodies (Cell Signaling Technologies, Danvers, MA, USA; dilution 1:200) for the immunohistochemical staining of TMAs. We performed all assays on a Leica Bond-3 automated stainer platform (Leica, Buffalo Groves, IL, USA). Antigens were retrieved with heat employing a high-pH buffer (ER2, Leica) before applying the primary antibody. A polymeric secondary antibody kit (Refine, Leica) was used to detect the primary antibody. Two investigators blinded to the clinical data (M.A. and T.K.) evaluated and semi-quantitatively scored immunostaining on a four-tier scale: 0, negative; 1, weak; 2, moderate; and 3, strongly positive. This scale was reduced to a 2-tier system (no expression vs. expression) for statistical analysis. We scored five fields in each sample and selected the higher score for analysis from duplicate probes. Samples with discrepant scores from the two investigators (n = 10) were jointly reviewed, reaching a consensus.

2.4. TILs, CD3, PD-1 and PD-L1

Recently, TILs, PD-1, and PD-L1 were investigated in this STS cohort [9]. We used those results to explore the relationship between VISTA and the PD-1/PD-L1 pathway in STS. TILs between tumour cells were counted per high-power field (HPF) (400× magnification, field of view 0.237 mm2) in H&E-stained TMA slides, as routinely carried out by the pathologist.
As described previously [9], slides were pre-treated with heat and Target Retrieval solution (S1699, Agilent, Santa Clara, CA, USA) before incubation with the monoclonal primary anti-PD-1 mouse antibody (315M; 1:80; Cell Marque, Rocklin, CA, USA) for 60 min at room temperature. The Vectastain Elite ABC HRP Kit (Vector Laboratories, Burlingame, CA, USA) and the chromogen DAB+ (Agilent) were used for detection and Hematoxylin (Vector Laboratories) for counterstaining.
For PD-L1 staining, slides were pre-treated with heat and the Epitope Retrieval Solution pH8 Novocastra (Leica Biosystems, Wetzlar, Germany) before incubation with the monoclonal primary anti-PD-L1 rabbit antibody (E1L3N; 1:50; Cell Signalling Technology) for 60 min at room temperature.
For CD3 staining, a monoclonal antibody raised in rabbit (SP7; 1:150; Zytomed, Berlin, Germany) was employed according to standard procedures. We used the SignalStain Boost IHC Detection Reagent (Cell Signalling Technology) and the chromogen DAB+ (Agilent) for detection.

2.5. Statistical Analysis

Data are reported as rates and proportions where applicable. Categorical variables were tested for independence using the Chi-square test; continuous variables were tested with the Kruskal–Wallis test for independent samples or Friedman two-way analysis of variance by ranks, as indicated. Factors associated with VISTA expression were examined in a logistic regression analysis using a stepwise forward approach. We calculated survival from the date when sarcoma was first diagnosed and chose overall survival (death without regard for the cause of death) for estimating prognosis. The Kaplan–Meier method was used to create survival curves, and differences in survival were assessed using the log-rank test. We used the SPSS 26.0 software (IBM, Chicago, IL, USA) for statistical analysis. Statistical significance was defined as a p-value < 0.05 for all analyses.

3. Results

3.1. Patients

The study included 213 patients (108 female, 105 male) with intermediate (G2, n = 102) or high-grade (G3, n = 111) STS. Their median age at the time of diagnosis was 56 years (range 19 to 79 years). Table 1 reports the clinical parameters related to tumour disease (histological subtype, location, grading, size, presence of metastases) and treatment (surgical outcome, radiotherapy, and regional hyperthermia). All patients received neoadjuvant anthracycline-based systemic therapy. Most patients (n = 195, 92%) had primary tumours, while a minority had been referred to us for an early recurrence following ineffective prior treatment. Metastatic disease, if present, had been judged as surgically resectable at initial evaluation. Nearly all patients (n = 194, 91%) underwent surgical resection, and about one in five patients received additional radiotherapy.

3.2. VISTA Expression in STS and Histopathological Subtypes

We observed VISTA expression in 96 (45%) of 213 samples. Examples of immunohistochemistry staining for VISTA are shown in Figure 1. Dedifferentiated liposarcoma showed lower expression (11/42, 26% positive) compared to other histopathological subtypes (Table 2). In 43 patients for whom tissues samples from both a preoperative biopsy and the surgical specimen were available, we found no difference in VISTA expression before and after neoadjuvant chemotherapy (p = 0.251; related-sample Friedman’s two-way analysis of variance on ranks).

3.3. VISTA Expression Is Associated with TILs, PD-1, PD-L1 and Grading

The expression of VISTA was related to other immuno-pathological parameters (Table 3). Specifically, VISTA expression was associated with higher TIL counts (p = 0.033), increased numbers of CD3+ cells (p = 0.023), as well as higher expression of PD1 (p = 0.046) and PD-L1, (p = 0.031). We found no association between VISTA and metastatic disease or tumour location but observed VISTA to be more frequent in patients with higher FNCLCC grade (G3 vs. G2, p = 0.019).
We performed a multiple logistic regression analysis of VISTA expression using a stepwise forward inclusion approach with the parameters sex; age; histological subtype; tumour grade; size; surgical margin; metastatic disease; TILs; PD-1, PD-L1, and CD3 expression. Only CD3 expression remained in the final model (OR 3.208 (1.216–8.465), p = 0.019). An alternative logistic regression model including most of these parameters is reported in Supplemental Table S1.

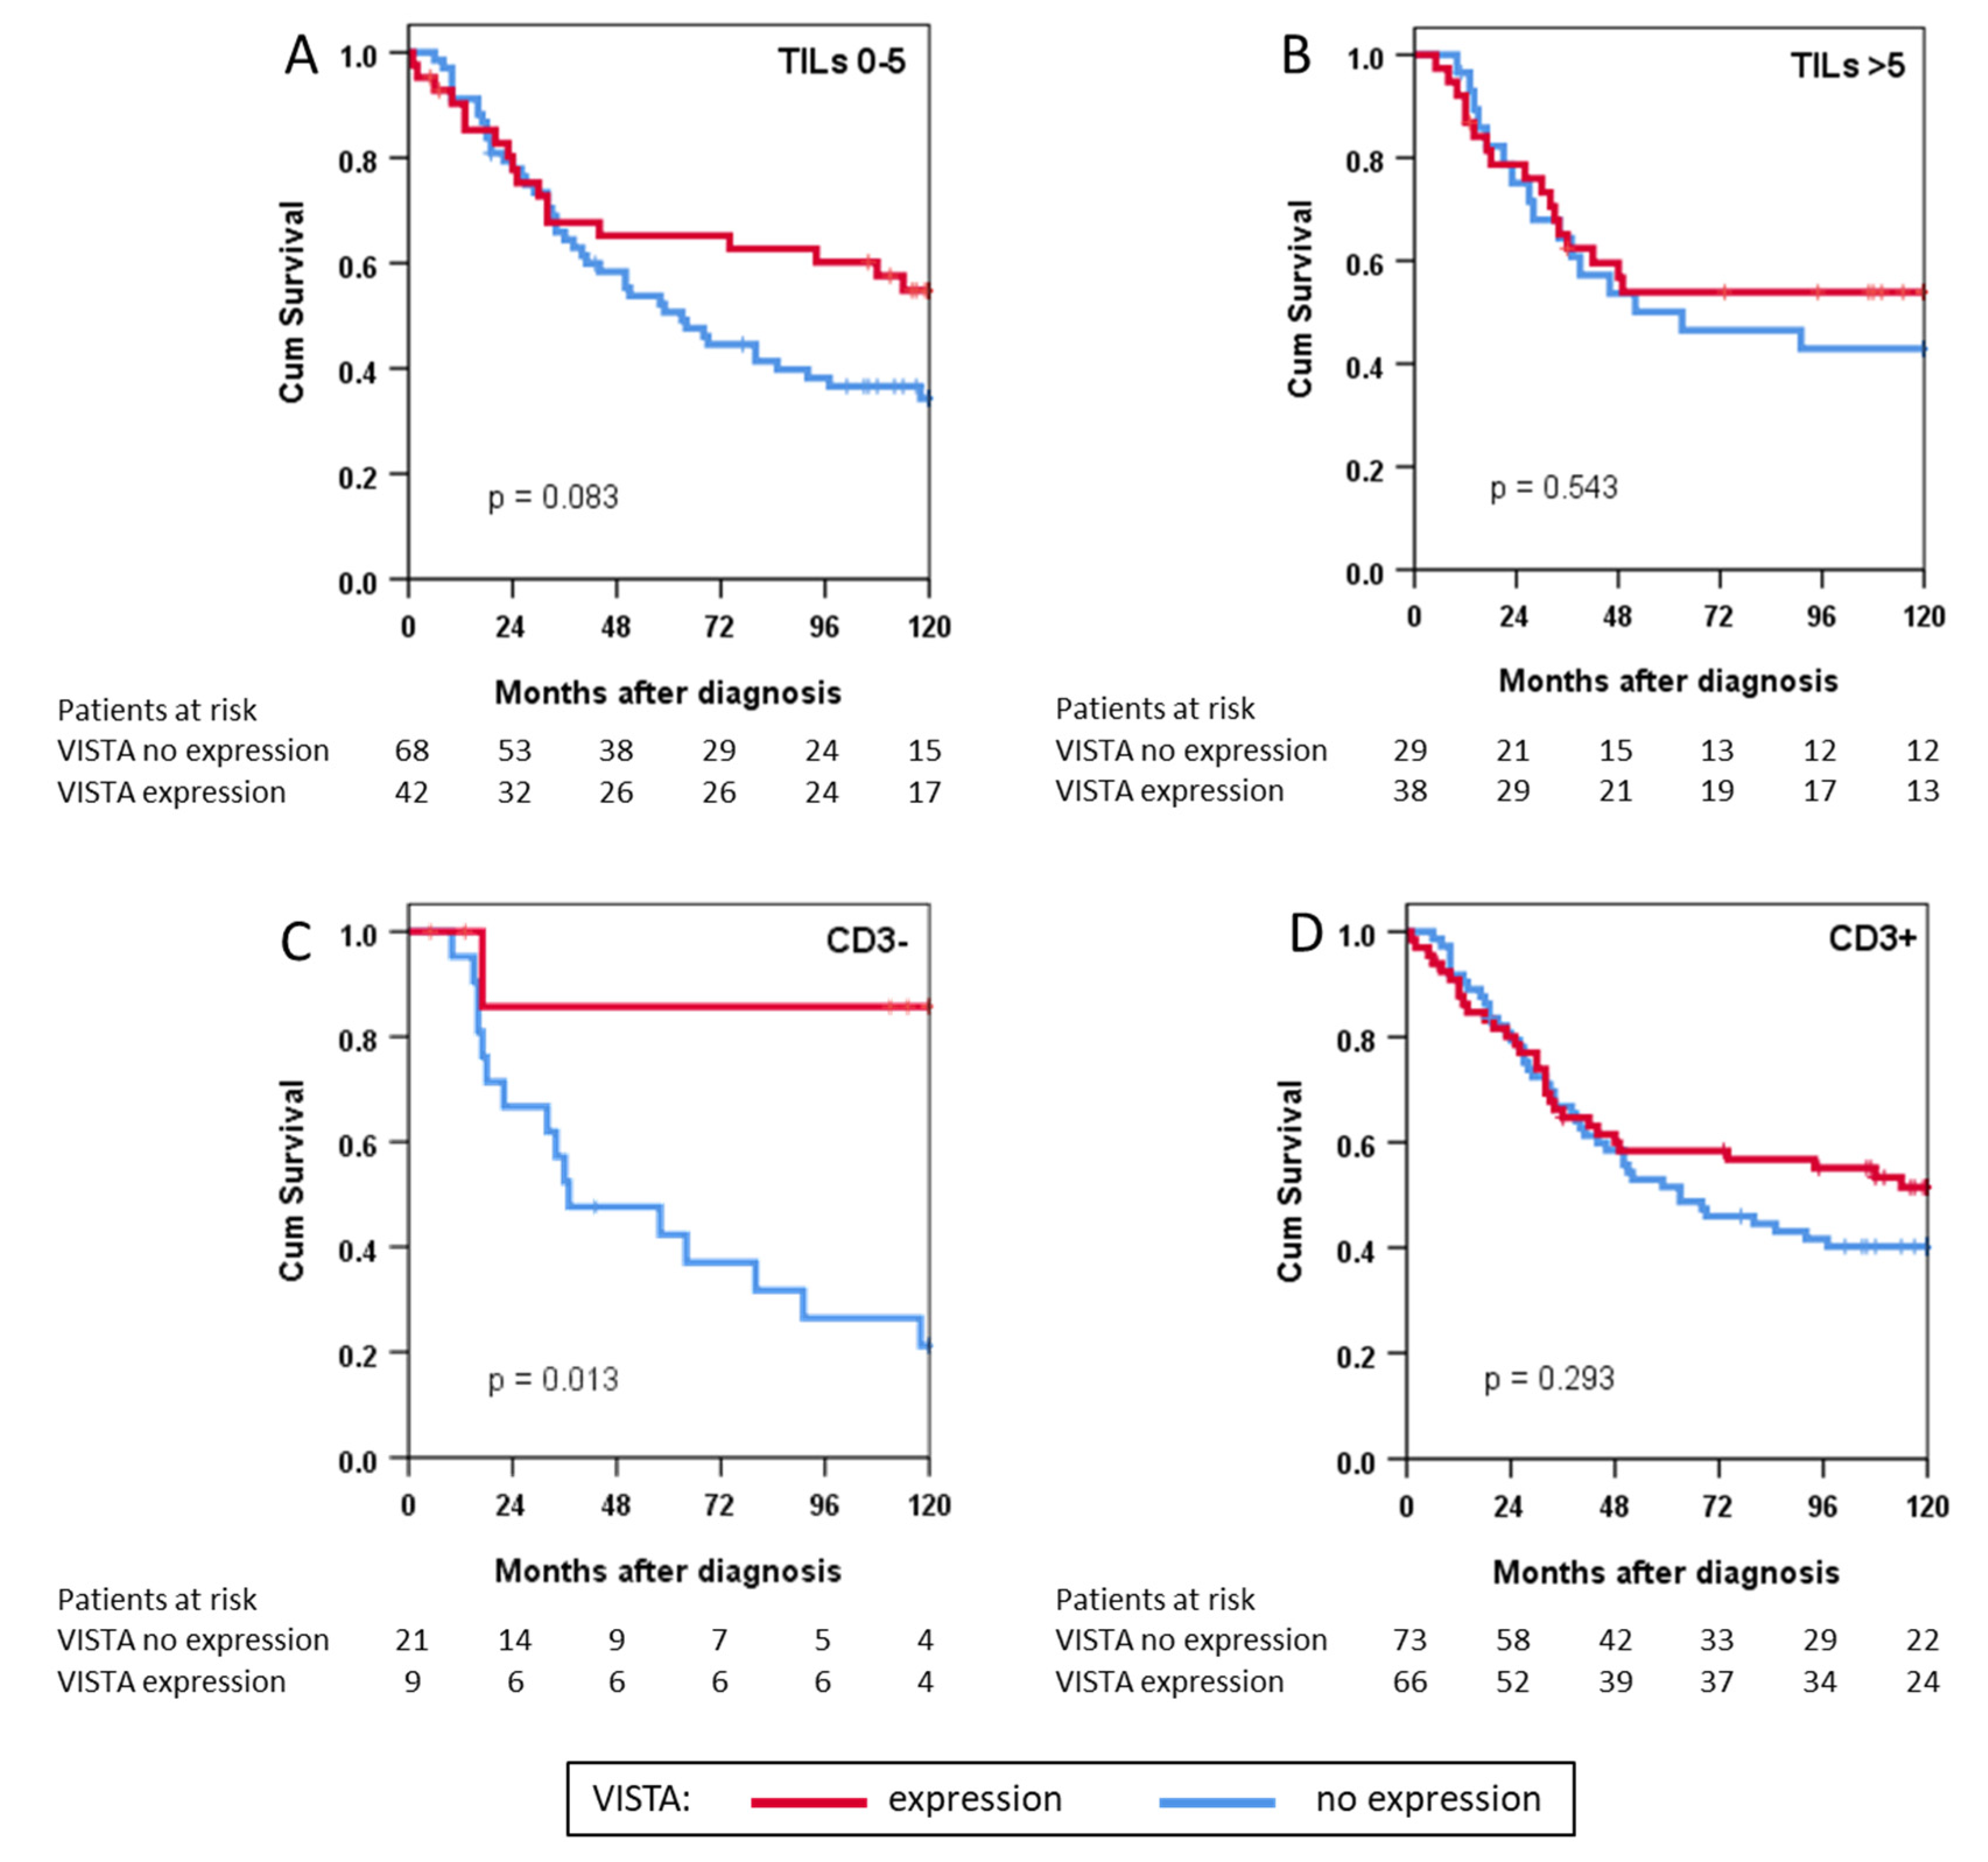
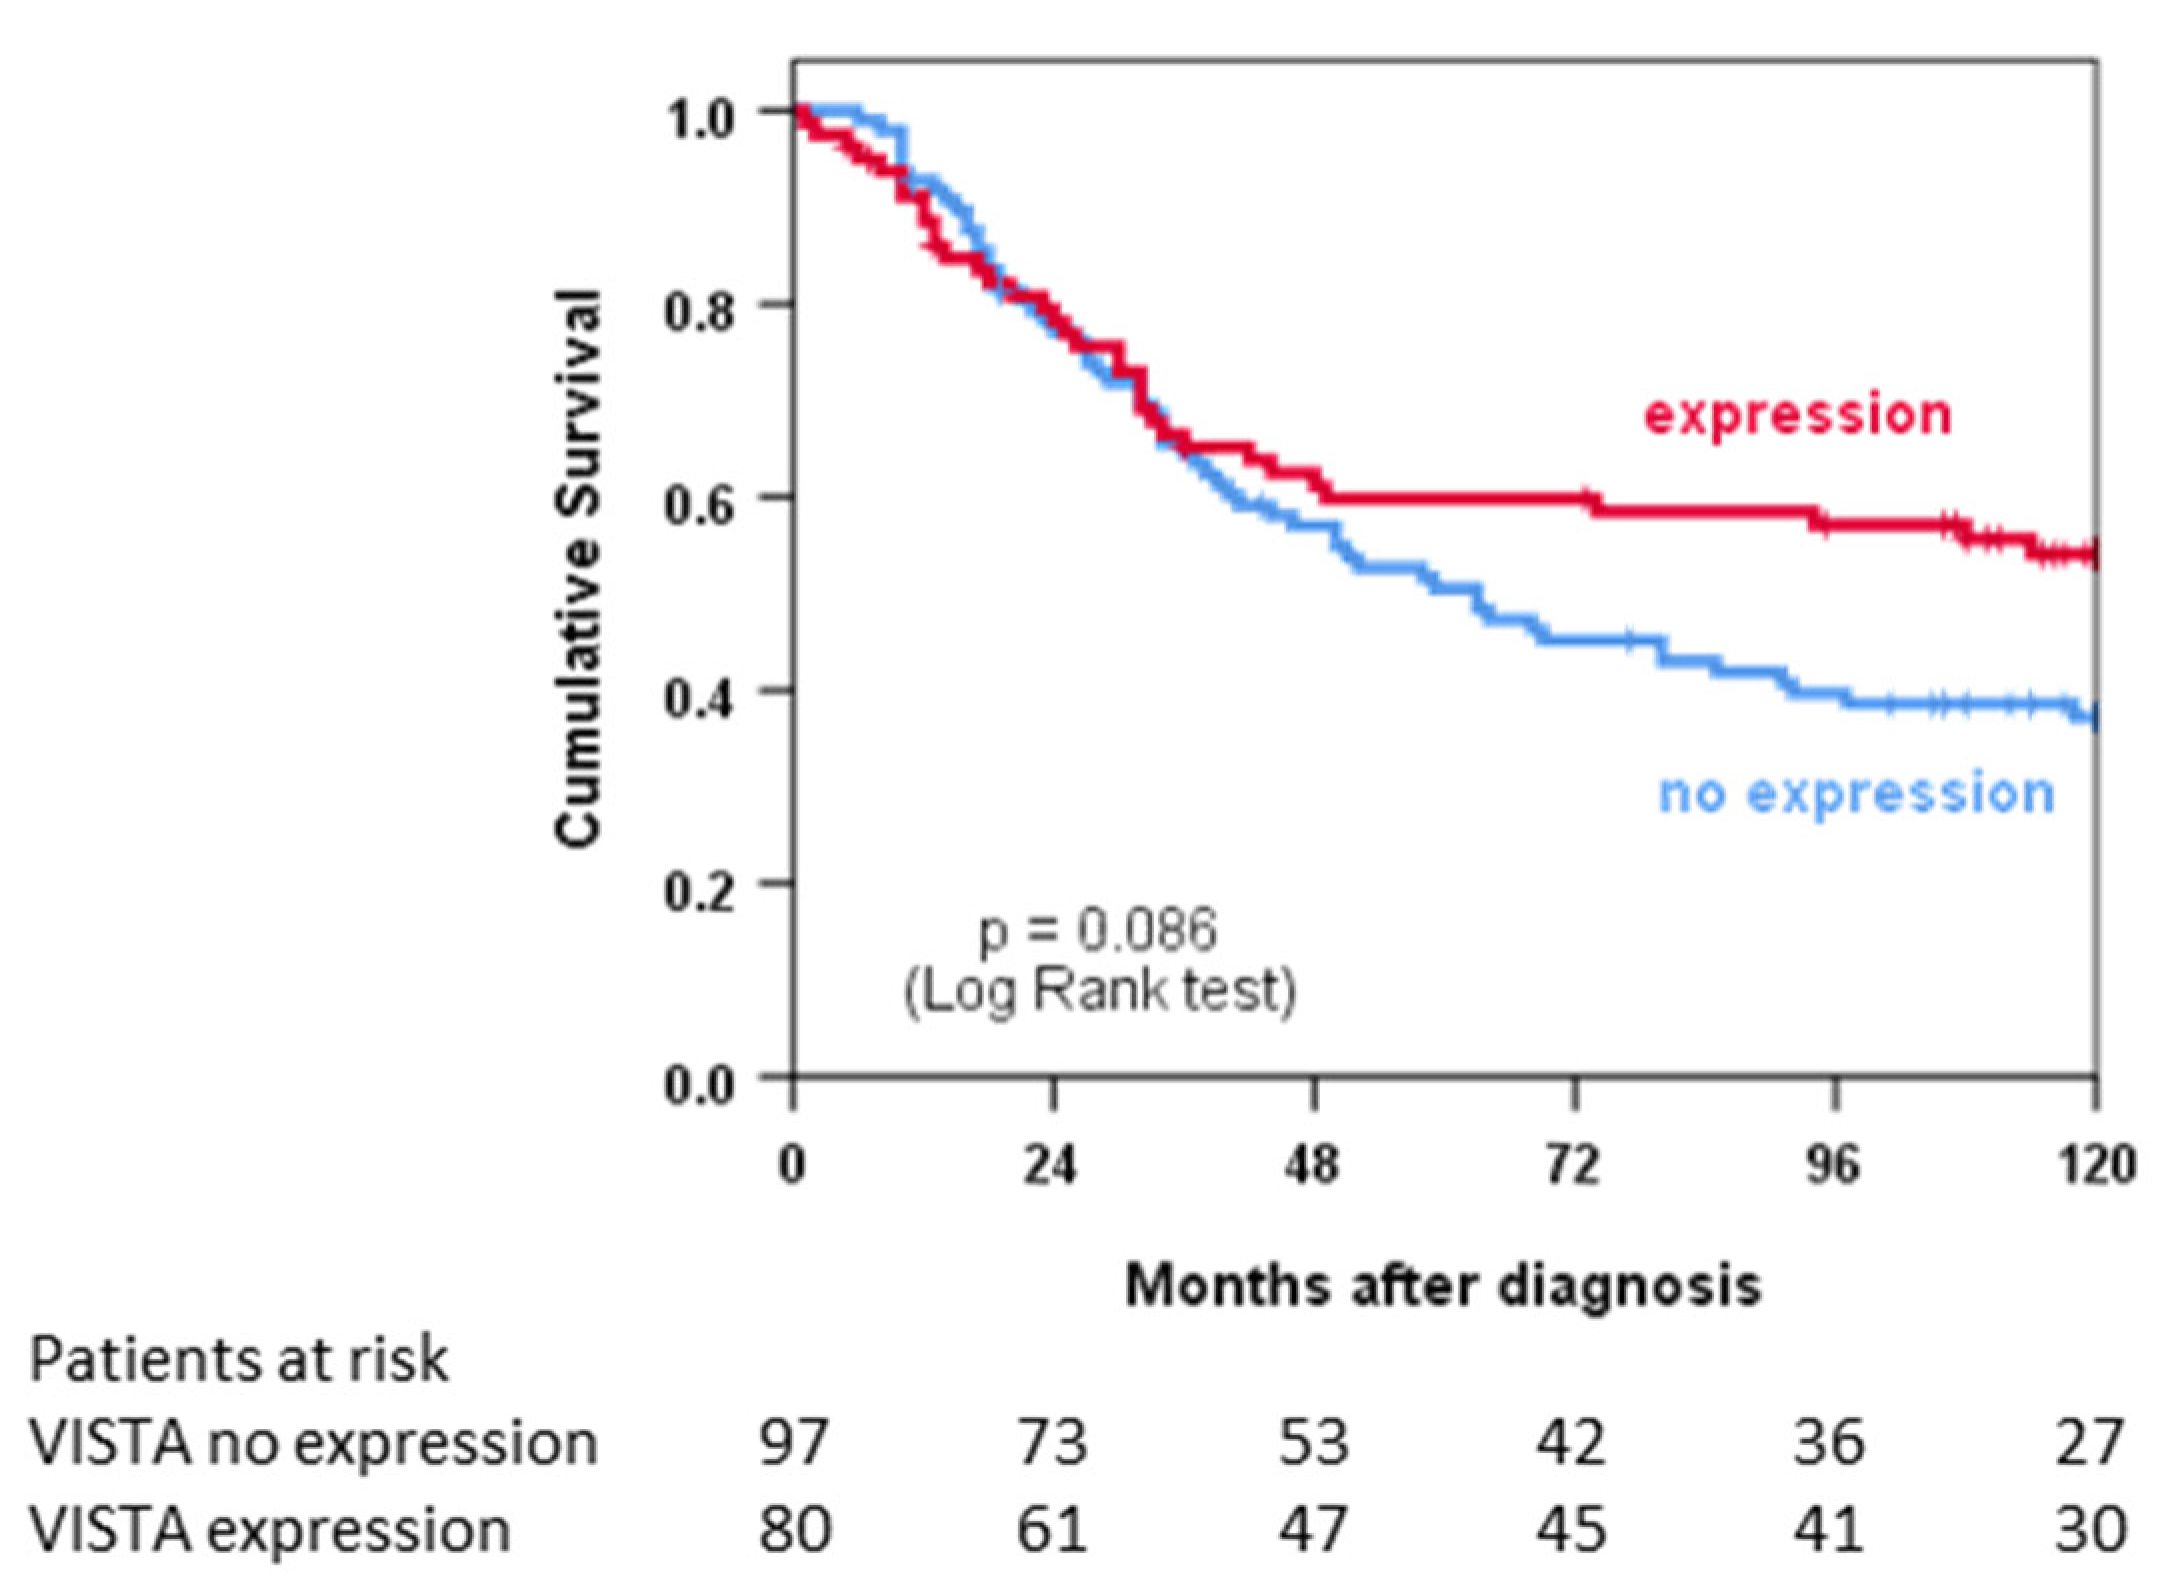
3.4. VISTA Expression and Survival

The median follow-up duration was 120 months for all patients (IQR 115–120 months). A total of 116 (55%) of the 213 patients died within 10 years of their diagnosis.
We assessed local recurrences and distant metastases after primary therapy only for patients with complete resection of their primary tumour and without distant metastases at diagnosis (n = 174). Within this group, 60 patients (35%) developed metastatic disease and 81 patients (47%) developed local recurrence.
Figure 2 shows an analysis of overall survival using the Kaplan–Meier method for patients with primary tumours and without metastatic disease (n = 177). In univariate analysis, the survival of patients with VISTA+ tumours was statistically not significantly different from patients with VISTA tumours (p = 0.086). However, graphical analysis suggests a survival advantage for patients with VISTA+ tumours after 48 months. In multivariate analysis, VISTA expression was independently associated with improved survival (p = 0.043), while metastatic disease and incomplete resections as well as angiosarcoma and MPNST histotypes were statistically significant risk factors for an unfavourable outcome (Table 4).
In subgroup analyses, we did not observe a statistically significant effect of VISTA expression in histological subtypes (Figure 3). There appeared, however, to be a trend towards improved survival in VISTA-positive patients with dedifferentiated liposarcoma (p = 0.096).
Finally, we analysed survival for the subgroups of patients with low TILs vs. high TILs and those with CD3 tumours vs. CD3+ tumours (Figure 4). We found no statistically significant association of survival with VISTA expression in patients with high or low TILs but observed better survival in patients with VISTA+CD3 tumours compared to VISTA+CD3+ patients (p = 0.013).

4. Discussion

This study shows that VISTA is frequently expressed across different histological subtypes of STS and that VISTA expression may be associated with improved survival. To the best of our knowledge, this is the first analysis of VISTA on the protein level in a large and well-characterised cohort of STS patients. A strength of this study cohort is the quality and length of patient follow-up. In one study based on the pan-cancer TCGA dataset, sarcomas were among those tumours with the highest VISTA expression [10]. Therefore, protein-level confirmation and the analysis of prognostic relevance in immunologically defined subgroups are valuable contributions to the study of immune checkpoint regulators.
Our study has some limitations. First, the low number of patients per histological subgroup requires the confirmation of the prognostic relevance of VISTA expression in a larger cohort. Second, tumour heterogeneity has been shown to confound measurements of PD-L1 expression in lung cancer [11,12] and may play a role in our analysis of VISTA accordingly, as STS are characterised by substantial intratumoral heterogeneity with distinguishable areas of differentiation [13] co-existing in one tumour. We addressed this problem by taking biopsies from dedifferentiated areas whenever possible. Finally, tissue samples in 22.5% of patients were available only from the surgical specimen after neoadjuvant treatment. Preoperative chemotherapy and regional hyperthermia may have confounded our results [14], although we found no difference in VISTA expression before and after surgery.
VISTA appears to play both suppressive and stimulatory roles in tumour immunology with varying effects and clinical relevance in different tumour types [15]. In an analysis of sarcoma patients from the TCGA database, VISTA expression was associated with prolonged survival [15]. Although the mechanisms leading to this diverse behaviour have only partly been understood, it appears that the tissue (tumour vs. immune cells) and the precise cell type that predominantly expresses VISTA does play a role. In this regard, some studies have described VISTA as an immune checkpoint receptor primarily expressed on TILs and myeloid cells, leading to a suppression of T cell activation, proliferation, and cytokine production. In pancreatic cancer, for example, VISTA appears to be predominantly expressed on CD86+ macrophages, and the expression of inhibitory immune checkpoint genes (VISTA and others combined) was associated with shorter survival [16].
Other studies show that VISTA is overexpressed in tumour tissues, suggesting that it acts as a co-stimulatory molecule inhibiting tumour proliferation and progression—e.g., in ovarian cancer [17], oesophageal adenocarcinoma [18], gastric cancer [19], and hepatocellular carcinoma [20]. Unlike these studies, where VISTA was associated with favourable clinical features, we found that VISTA was more frequently expressed in FNCLCC G3 STS but unrelated to metastatic disease. Specifically, VISTA expressed by ovarian cancer cells has been shown to suppress T-cell functions, thus limiting the tumour-directed activity of CD8+ TILs and potentially promoting tumour growth [21]. In contrast to this mechanism of action yet in line with previous results [15,17,22], we found VISTA expression on sarcoma cells to be associated with the expression of CD3 (univariate and in a logistic regression model) as well as the presence of TILs and the expression of PD-1 and PD-L1 (univariate), suggesting that VISTA may play a role in the inflamed tumour microenvironment.
In this context, our finding that survival was improved in patients with CD3VISTA+ tumours should be interpreted with caution, as this exploratory analysis was not planned. Nonetheless, our results suggest a T-cell-independent influence of VISTA on the tumour microenvironment. Hypothetically, the absence of T-cells directed against the tumour, which VISTA would regulate, might allow VISTA’s assumed direct anti-tumour effects to outweigh cell-mediated tumour growth (VISTA+ in Figure 4C,D). However, as the relevant biological aspects concerning its molecular interactions remain unclear, a better understanding of its mechanisms and functions is necessary to establish VISTA as a biomarker for immunotherapy [20,23], especially in STS.
The overexpression of VISTA on tumour cells and the possible survival benefit for patients with CD3VISTA+ tumours support VISTA as a target for immunotherapy in STS. Moreover, it has been demonstrated that VISTA is upregulated following PD-1/PD-L1 blockade in various tumours [19,22,24,25,26]. In this regard, the overlapping expression of both checkpoint regulators may open a therapeutic opportunity for tumours that have developed resistance to PD-1/PD-L1 blockade.
Patient selection for immune checkpoint inhibitor therapy is not straightforward due to the complex pathways involved. The experience gained in recent years with melanoma, non-small cell lung cancer, and metastatic colorectal cancer patients points to the existence of additional risk factors that need to be incorporated [27], such as tumour-mutational burden or TILs in melanoma. We propose the investigation of VISTA as a predictive marker in STS patients treated with immune checkpoint inhibitor therapy.

5. Conclusions

In summary, the results of our study indicate that VISTA is expressed in various sarcoma subgroups. VISTA expression on tumour cells is associated with elevated TILs; the expression of PD-1, PD-L1, and CD3; and higher FNCLCC grading. Patients with VISTA+ tumours appear to survive longer than VISTA patients. The analysis of VISTA expression may guide future immunotherapeutic approaches to STS.

Supplementary Materials

The following supporting information can be downloaded at: https://www.mdpi.com/article/10.3390/cancers14041006/s1. Table S1: Multiple logistic regression model of clinicopathological parameters.

Author Contributions

Conceptualization, M.A., A.A.J. and T.K.; Data curation, L.H.L., R.D.I. and E.K.; Formal analysis, M.A., A.A.-H. and T.K.; Investigation, M.A., A.A.-H., R.D.I., E.K., A.A.J. and T.K.; Methodology, M.A., A.A.-H., E.K., A.A.J. and T.K.; Project administration, M.A., E.K., M.K.A., and T.K.; Resources, L.H.L., R.D.I., F.K., J.W. and T.K.; Software, A.A.-H.; Supervision, L.H.L., H.-R.D., M.K.A., F.K. and J.W.; Validation, A.A.-H., L.H.L., E.K. and H.-R.D.; Visualization, M.A., A.A.-H. and T.K.; Writing—original draft, M.A.; Writing—review and editing, L.H.L., H.-R.D., M.K.A., F.K., J.W., A.A.J. and T.K. All authors have read and agreed to the published version of the manuscript.

Funding

This research received no external funding.

Institutional Review Board Statement

The study was conducted according to the guidelines of the Declaration of Helsinki and approved by the Ethics Committee of Ludwig-Maximilians-Univeristät Munich (protocol code 21-0216, approved 30 March 2021).

Informed Consent Statement

Patient consent was waived for this analysis due to its retrospective design and previously given broad consent for future research by patients included in this analysis.

Data Availability Statement

The data presented in this study are available on specific request from the corresponding author. The data are not publicly available for reasons of data protection and data economy.

Acknowledgments

The authors thank Sultan Abdel-Rahman for clinical data consolidation and Gabriele Schubert-Fritschle for updating the patient follow-up.

Conflicts of Interest

The authors declare no conflict of interest.

References

  1. Ratan, R.; Patel, S.R. Chemotherapy for soft tissue sarcoma. Cancer 2016, 122, 2952–2960. [Google Scholar] [CrossRef] [Green Version]
  2. Gronchi, A.; Ferrari, S.; Quagliuolo, V.; Broto, J.M.; Pousa, A.L.; Grignani, G.; Basso, U.; Blay, J.Y.; Tendero, O.; Beveridge, R.D.; et al. Histotype-tailored neoadjuvant chemotherapy versus standard chemotherapy in patients with high-risk soft-tissue sarcomas (ISG-STS 1001): An international, open-label, randomised, controlled, phase 3, multicentre trial. Lancet Oncol. 2017, 18, 812–822. [Google Scholar] [CrossRef]
  3. Hoang, N.T.; Acevedo, L.A.; Mann, M.J.; Tolani, B. A review of soft-tissue sarcomas: Translation of biological advances into treatment measures. Cancer Manag. Res. 2018, 10, 1089–1114. [Google Scholar] [CrossRef] [PubMed] [Green Version]
  4. Klemen, N.D.; Kelly, C.M.; Bartlett, E.K. The emerging role of immunotherapy for the treatment of sarcoma. J. Surg. Oncol. 2021, 123, 730–738. [Google Scholar] [CrossRef] [PubMed]
  5. Dufresne, A.; Lesluyes, T.; Ménétrier-Caux, C.; Brahmi, M.; Darbo, E.; Toulmonde, M.; Italiano, A.; Mir, O.; Le Cesne, A.; Le Guellec, S.; et al. Specific immune landscapes and immune checkpoint expressions in histotypes and molecular subtypes of sarcoma. OncoImmunology 2020, 9, 1792036. [Google Scholar] [CrossRef] [PubMed]
  6. Lines, J.L.; Pantazi, E.; Mak, J.; Sempere, L.F.; Wang, L.; O’Connell, S.; Ceeraz, S.; Suriawinata, A.A.; Yan, S.; Ernstoff, M.S.; et al. VISTA Is an Immune Checkpoint Molecule for Human T Cells. Cancer Res. 2014, 74, 1924–1932. [Google Scholar] [CrossRef] [Green Version]
  7. Issels, R.D.; Lindner, L.H.; Verweij, J.; Wust, P.; Reichardt, P.; Schem, B.C.; Abdel-Rahman, S.; Daugaard, S.; Salat, C.; Wendtner, C.M.; et al. Neo-adjuvant chemotherapy alone or with regional hyperthermia for localised high-risk soft-tissue sarcoma: A randomised phase 3 multicentre study. Lancet Oncol. 2010, 11, 561–570. [Google Scholar] [CrossRef] [Green Version]
  8. Knösel, T.; Emde, A.; Schluns, K.; Chen, Y.; Jurchott, K.; Krause, M.; Dietel, M.; Petersen, I. Immunoprofiles of 11 biomarkers using tissue microarrays identify prognostic subgroups in colorectal cancer. Neoplasia 2005, 7, 741–747. [Google Scholar] [CrossRef] [Green Version]
  9. Orth, M.F.; Buecklein, V.L.; Kampmann, E.; Subklewe, M.; Noessner, E.; Cidre-Aranaz, F.; Romero-Perez, L.; Wehweck, F.S.; Lindner, L.; Issels, R.; et al. A comparative view on the expression patterns of PD-L1 and PD-1 in soft tissue sarcomas. Cancer Immunol. Immunother. CII 2020, 69, 1353–1362. [Google Scholar] [CrossRef]
  10. Hmeljak, J.; Sanchez-Vega, F.; Hoadley, K.A.; Shih, J.; Stewart, C.; Heiman, D.; Tarpey, P.; Danilova, L.; Drill, E.; Gibb, E.A.; et al. Integrative Molecular Characterization of Malignant Pleural Mesothelioma. Cancer Discov. 2018, 8, 1548–1565. [Google Scholar] [CrossRef] [Green Version]
  11. Mansfield, A.S.; Murphy, S.J.; Peikert, T.; Yi, E.S.; Vasmatzis, G.; Wigle, D.A.; Aubry, M.C. Heterogeneity of Programmed Cell Death Ligand 1 Expression in Multifocal Lung Cancer. Clin. Cancer Res. 2016, 22, 2177–2182. [Google Scholar] [CrossRef] [Green Version]
  12. McLaughlin, J.; Han, G.; Schalper, K.A.; Carvajal-Hausdorf, D.; Pelekanou, V.; Rehman, J.; Velcheti, V.; Herbst, R.; Lorusso, P.; Rimm, D.L. Quantitative Assessment of the Heterogeneity of PD-L1 Expression in Non–Small-Cell Lung Cancer. JAMA Oncol. 2016, 2, 46. [Google Scholar] [CrossRef] [PubMed]
  13. Coindre, J.-M. Grading of Soft Tissue Sarcomas: Review and Update. Arch. Pathol. Lab. Med. 2006, 130, 1448–1453. [Google Scholar] [CrossRef]
  14. Issels, R.D.; Noessner, E.; Lindner, L.H.; Schmidt, M.; Albertsmeier, M.; Blay, J.Y.; Stutz, E.; Xu, Y.; Buecklein, V.; Altendorf-Hofmann, A.; et al. Immune infiltrates in patients with localised high-risk soft tissue sarcoma treated with neoadjuvant chemotherapy without or with regional hyperthermia: A translational research program of the EORTC 62961-ESHO 95 randomised clinical trial. Eur. J. Cancer 2021, 158, 123–132. [Google Scholar] [CrossRef]
  15. Huang, X.; Zhang, X.; Li, E.; Zhang, G.; Wang, X.; Tang, T.; Bai, X.; Liang, T. VISTA: An immune regulatory protein checking tumor and immune cells in cancer immunotherapy. J. Hematol. Oncol. 2020, 13, 83. [Google Scholar] [CrossRef] [PubMed]
  16. Blando, J.; Sharma, A.; Higa, M.G.; Zhao, H.; Vence, L.; Yadav, S.S.; Kim, J.; Sepulveda, A.M.; Sharp, M.; Maitra, A.; et al. Comparison of immune infiltrates in melanoma and pancreatic cancer highlights VISTA as a potential target in pancreatic cancer. Proc. Natl. Acad. Sci. USA 2019, 116, 1692–1697. [Google Scholar] [CrossRef] [PubMed] [Green Version]
  17. Zong, L.; Zhou, Y.; Zhang, M.; Chen, J.; Xiang, Y. VISTA expression is associated with a favorable prognosis in patients with high-grade serous ovarian cancer. Cancer Immunol. Immunother. CII 2020, 69, 33–42. [Google Scholar] [CrossRef] [Green Version]
  18. Loeser, H.; Kraemer, M.; Gebauer, F.; Bruns, C.; Schröder, W.; Zander, T.; Persa, O.-D.; Alakus, H.; Hoelscher, A.; Buettner, R.; et al. The expression of the immune checkpoint regulator VISTA correlates with improved overall survival in pT1/2 tumor stages in esophageal adenocarcinoma. Oncoimmunology 2019, 8, e1581546. [Google Scholar] [CrossRef]
  19. Böger, C.; Behrens, H.-M.; Krüger, S.; Röcken, C. The novel negative checkpoint regulator VISTA is expressed in gastric carcinoma and associated with PD-L1/PD-1: A future perspective for a combined gastric cancer therapy? Oncoimmunology 2017, 6, e1293215. [Google Scholar] [CrossRef]
  20. Zhang, M.; Pang, H.-J.; Zhao, W.; Li, Y.-F.; Yan, L.-X.; Dong, Z.-Y.; He, X.-F. VISTA expression associated with CD8 confers a favorable immune microenvironment and better overall survival in hepatocellular carcinoma. BMC Cancer 2018, 18, 511. [Google Scholar] [CrossRef]
  21. Mulati, K.; Hamanishi, J.; Matsumura, N.; Chamoto, K.; Mise, N.; Abiko, K.; Baba, T.; Yamaguchi, K.; Horikawa, N.; Murakami, R.; et al. VISTA expressed in tumour cells regulates T cell function. Br. J. Cancer 2019, 120, 115–127. [Google Scholar] [CrossRef] [PubMed] [Green Version]
  22. He, H.-X.; Gao, Y.; Fu, J.-C.; Zhou, Q.-H.; Wang, X.-X.; Bai, B.; Li, P.-F.; Huang, C.; Rong, Q.-X.; Ping, L.-Q.; et al. VISTA and PD-L1 synergistically predict poor prognosis in patients with extranodal natural killer/T-cell lymphoma. OncoImmunology 2021, 10, 1907059. [Google Scholar] [CrossRef] [PubMed]
  23. Tagliamento, M.; Agostinetto, E.; Borea, R.; Brandão, M.; Poggio, F.; Addeo, A.; Lambertini, M. VISTA: A Promising Target for Cancer Immunotherapy? ImmunoTargets Ther. 2021, 10, 185–200. [Google Scholar] [CrossRef] [PubMed]
  24. Gao, J.; Ward, J.F.; Pettaway, C.A.; Shi, L.Z.; Subudhi, S.K.; Vence, L.M.; Zhao, H.; Chen, J.; Chen, H.; Efstathiou, E.; et al. VISTA is an inhibitory immune checkpoint that is increased after ipilimumab therapy in patients with prostate cancer. Nat. Med. 2017, 23, 551–555. [Google Scholar] [CrossRef] [PubMed] [Green Version]
  25. Kakavand, H.; Jackett, L.A.; Menzies, A.M.; Gide, T.N.; Carlino, M.S.; Saw, R.P.M.; Thompson, J.F.; Wilmott, J.S.; Long, G.V.; Scolyer, R.A. Negative immune checkpoint regulation by VISTA: A mechanism of acquired resistance to anti-PD-1 therapy in metastatic melanoma patients. Mod. Pathol. 2017, 30, 1666–1676. [Google Scholar] [CrossRef]
  26. Wu, L.; Deng, W.-W.; Huang, C.-F.; Bu, L.-L.; Yu, G.-T.; Mao, L.; Zhang, W.-F.; Liu, B.; Sun, Z.-J. Expression of VISTA correlated with immunosuppression and synergised with CD8 to predict survival in human oral squamous cell carcinoma. Cancer Immunol. Immunother. CII 2017, 66, 627–636. [Google Scholar] [CrossRef]
  27. Signorelli, D.; Giannatempo, P.; Grazia, G.; Aiello, M.M.; Bertolini, F.; Mirabile, A.; Buti, S.; Vasile, E.; Scotti, V.; Pisapia, P.; et al. Patients Selection for Immunotherapy in Solid Tumors: Overcome the Naïve Vision of a Single Biomarker. BioMed Res. Int. 2019, 2019, 9056417. [Google Scholar] [CrossRef] [Green Version]
Figure 1. Tissue microarray stained for V domain immunoglobulin suppressor of T cell activation (VISTA). The figure shows core micrographs representative of semiquantitative immunostaining scores: 0, negative; 1, weak; 2, moderate; and 3, strongly positive. Magnification 20×.
Cancers 14 01006 g001
Figure 2. Univariate survival analysis depicted as Kaplan–Meier curves stratified according to VISTA expression.
Cancers 14 01006 g002
Figure 3. Survival analysis in histotype subgroups depicted as Kaplan–Meier curves stratified according to VISTA expression. UPS: undifferentiated pleomorphic sarcoma; LMS: leiomyosarcoma; SS: synovial sarcoma; LPS: liposarcoma; AS: angiosarcoma; MPNST: malignant peripheral nerve sheath tumour; Cum: cumulative.
Cancers 14 01006 g003
Figure 4. Survival depicted as Kaplan-Meier curves in immunophenotype subgroups of patients with either (A) low or (B) high tumour-infiltrating lymphocyte (TIL) counts and with (C) negative or (D) positive CD3 expression; Cum: cumulative.
Cancers 14 01006 g004
Table 1. Patients’ baseline characteristics. UPS: undifferentiated pleomorphic sarcoma; MPNST: malignant peripheral nerve sheath tumour.
Variationn%
Total 213100
SexMale10549
Female10851
Histological
subtype
UPS7736
Leiomyosarcoma4722
Synovial sarcoma2713
Dedifferentiated liposarcoma3416
Myxoid liposarcoma94
Angiosarcoma84
MPNST115
LocationExtremities7133
Retroperitoneal4521
Abdominal/visceral3517
Trunk5526
Other73
GradingIntermediate (G2)10248
High (G3)11152
Size<50 mm178
50–79 mm4822
80–120 mm6229
>120 mm6330
Missing2311
Primary tumour/
recurrence
Primary tumour19592
Recurrence188
Metastatic diseaseM019592
M1188
Surgical
margins
R0/R118687
R2 or no resection2713
RadiotherapyDone16879
Not done4521
Regional
hyperthermia
Done16477
Not done4923
ChemotherapyNeoadjuvant/perioperative213100
Adjuvant only00
Table 2. V domain immunoglobulin suppressor of T cell activation (VISTA) expression and TILs for different histologic subtypes: The table shows the number and percentage of patients with different VISTA expression scores (0 to 3) and positive expression (score 1 to 3) and high tumour-infiltrating lymphocyte (TIL) infiltration (≥6 TILs per HPF). UPS: undifferentiated pleomorphic sarcoma; DDLPS: dedifferentiated liposarcoma; MPNST: malignant peripheral nerve sheath tumour.
VariationVISTA ExpressionTILs
Histological0123PositivePositiveTotal
Subtypen%n%n%n%n%n%n
UPS3849%3140%79%11%3951%3748%77
Leiomyosarcoma2553%2145%12%00%2247%1634%47
Synovial sarcoma1452%1348%00%00%1348%311%27
Liposarcoma3274%1023%12%00%1126%1740%43
DDLPS2574%824%13%00%926%1544%34
Myxoid778%222%00%00%222%222%9
Angiosarcoma338%450%113%00%563%450%8
MPNST545%655%00%00%655%327%11
Total11755%8540%105%10%9645%8038%213
Table 3. Association between V domain immunoglobulin suppressor of T cell activation (VISTA) expression and clinicopathological parameter grading: TILs, tumour-infiltrating lymphocytes. The Chi-square test was used to test for the independence of variables.
VariationVISTA
TotalExpressionNo Expressionp
TILs0–51335239%8161%0.033
≥ 6804455%3645%
Total2139645%11755%
CD3No expression34926%2574%0.023
Expression1708248%8852%
Total2049145%11355%
PD-10–31455840%8760%0.046
≥ 4613456%2744%
Total2069245%11455%
PD-L1No expression1717343%9857%0.031
Expression312065%1135%
Total2029346%10954%
MetastasisM01958544%11056%0.215
M1181161%739%
Total2139645%11755%
LocationExtremities733751%3649%0.249
Non-extremities1405942%8158%
Total2139645%11755%
GradeIntermediate1023736%6564%0.019
High1115953%5247%
Total2139645%11755%
Table 4. Multivariate survival analysis using a Cox regression model. TILs, tumour-infiltrating lymphocytes; UPS: undifferentiated pleomorphic sarcoma; MPNST: malignant peripheral nerve sheath tumour.
VariationHR (95% CI)p-Value
AgeIncrease by 1 year1.015 (0.999–1.031)0.059
SexFemale (vs. male)0.800 (0.525–1.218)0.298
VISTANo expression (vs. expression)1.014 (1.014–2.363)0.043
TILs≥6 (vs. 0–5)1.125 (0.726–1.743)0.597
CD3No expression (vs. expression)0.982 (0.525–1.838)0.956
PD-1≥4 (vs. 0–3) 1.104 (0.696–1.750)0.674
PD-L1No expression (vs. expression) 0.890 (0.488–1.622)0.703
Size≥8 cm (vs. <8 cm)1.358 (0.866–2.129)0.183
MetastasisM1 (vs. M0) 1.986 (1.008–3.912)0.047
GradeGrade 1/2 (vs. Grade 3)1.446 (0.937–2.231)0.095
Surgical outcomeR2/not resected (vs. R0/1)5.936 (3.390–10.393)<0.001
HistotypeUPS (Reference) 0.075
Leiomyosarcoma1.246 (0.727–2.135)0.424
Synovial sarcoma1.012 (0.474–2.159)0.975
Liposarcoma0.800 (0.450–1.423)0.447
Angiosarcoma3.992 (1.099–14.497)0.035
MPNST2.461 (1.010–5.995)0.047
Publisher’s Note: MDPI stays neutral with regard to jurisdictional claims in published maps and institutional affiliations.

