

Feasibility of Breast Cancer Metastasis Assessment of Ex Vivo Sentinel Lymph Nodes through a p-H&E Optical Coherence Microscopic Imaging System

 ,
, 
Simple Summary
Abstract
1. Introduction
2. Materials and Methods
2.1. Study Participants
2.2. Study Design
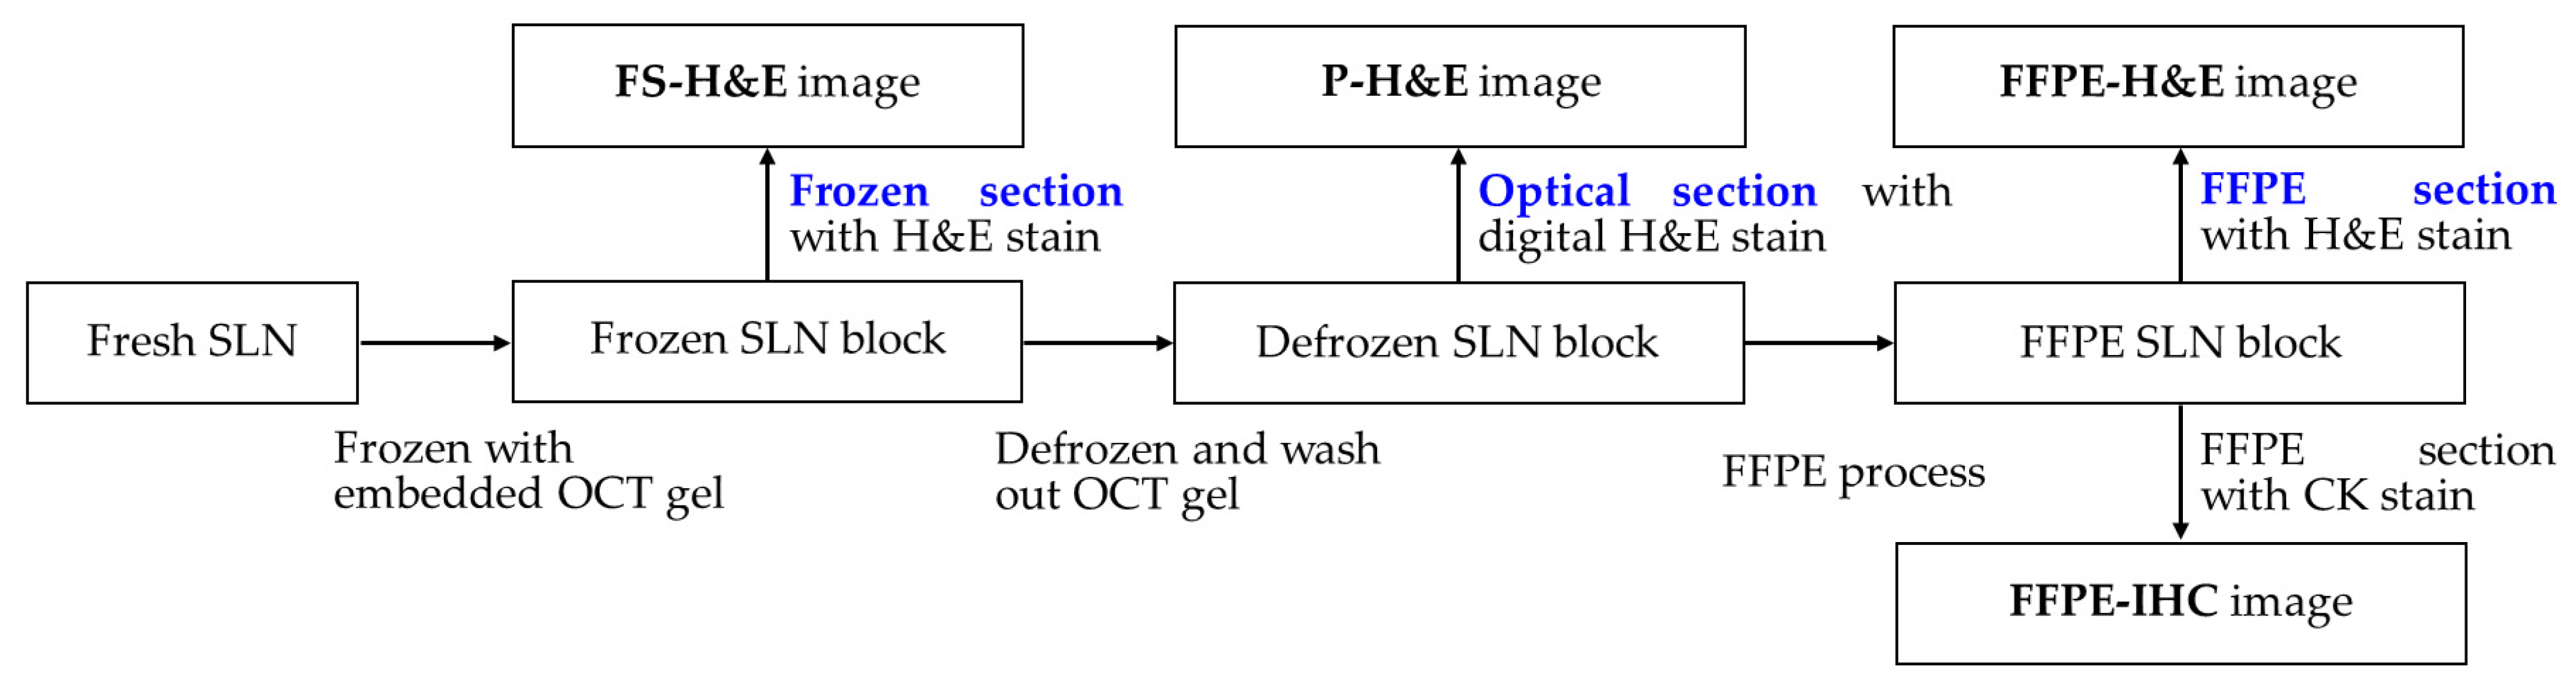
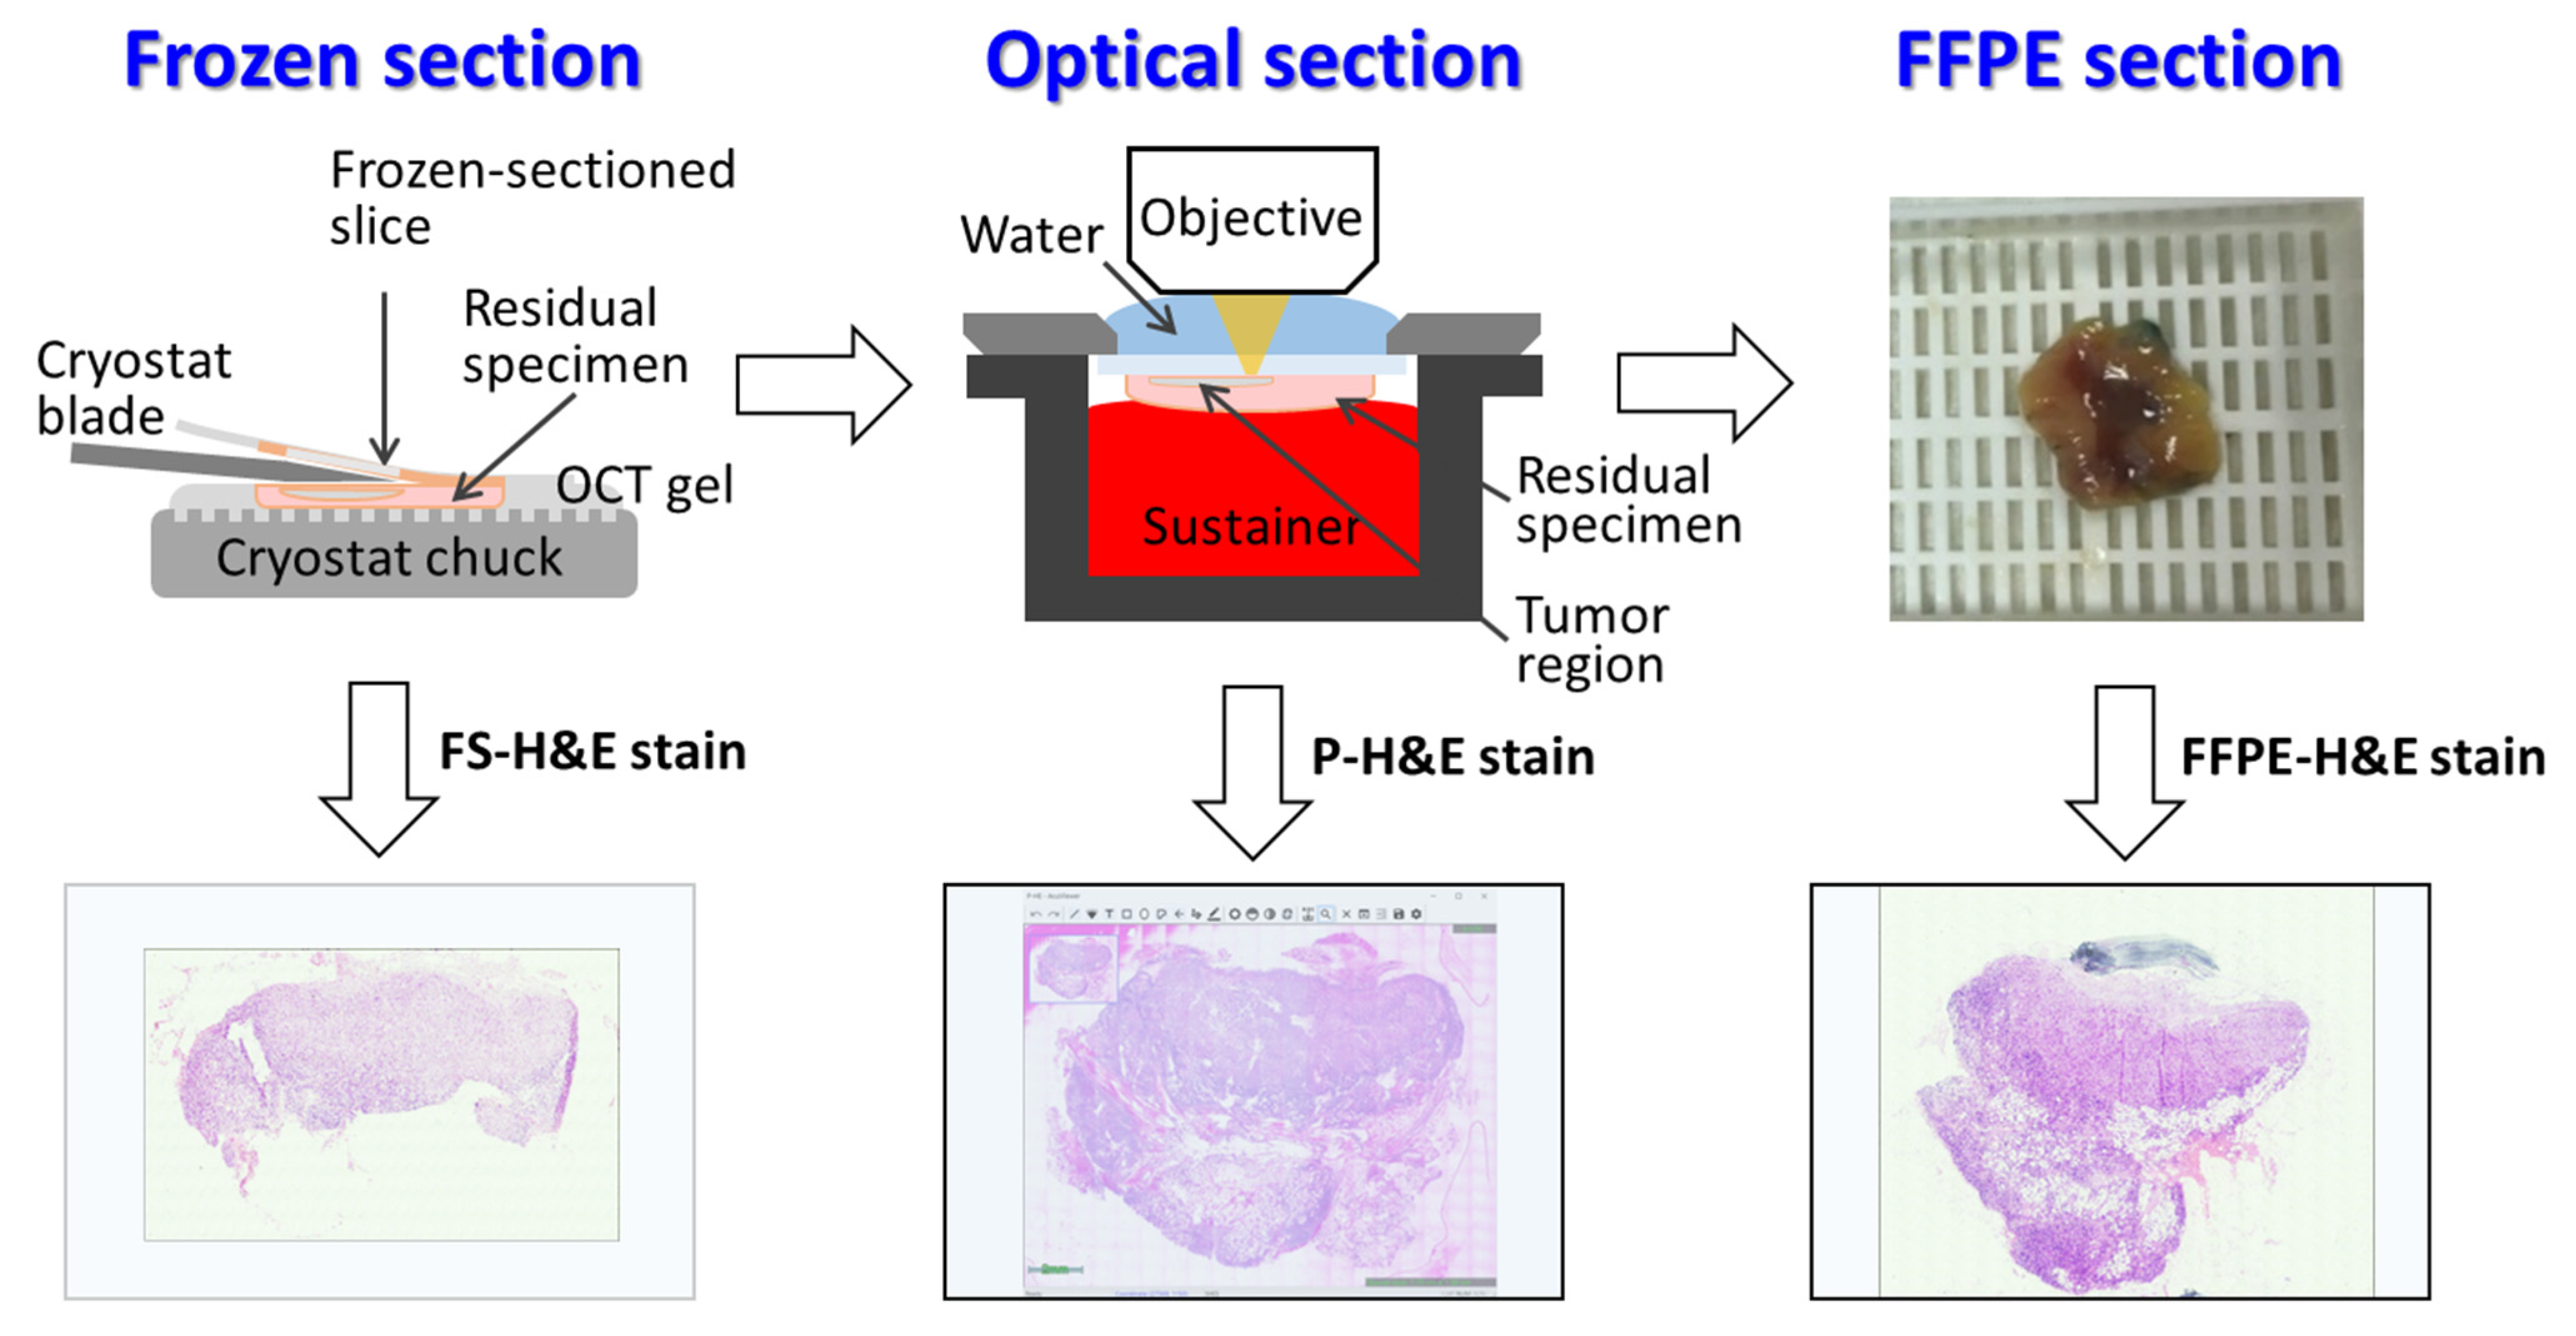
2.3. Tissue Processing and OCMIS Image Acquisition
2.4. Ex Vivo Fluorescence-in-Built OCMIS
2.5. Histological Classification
2.6. Data Collection and Statistical Analysis
3. Results
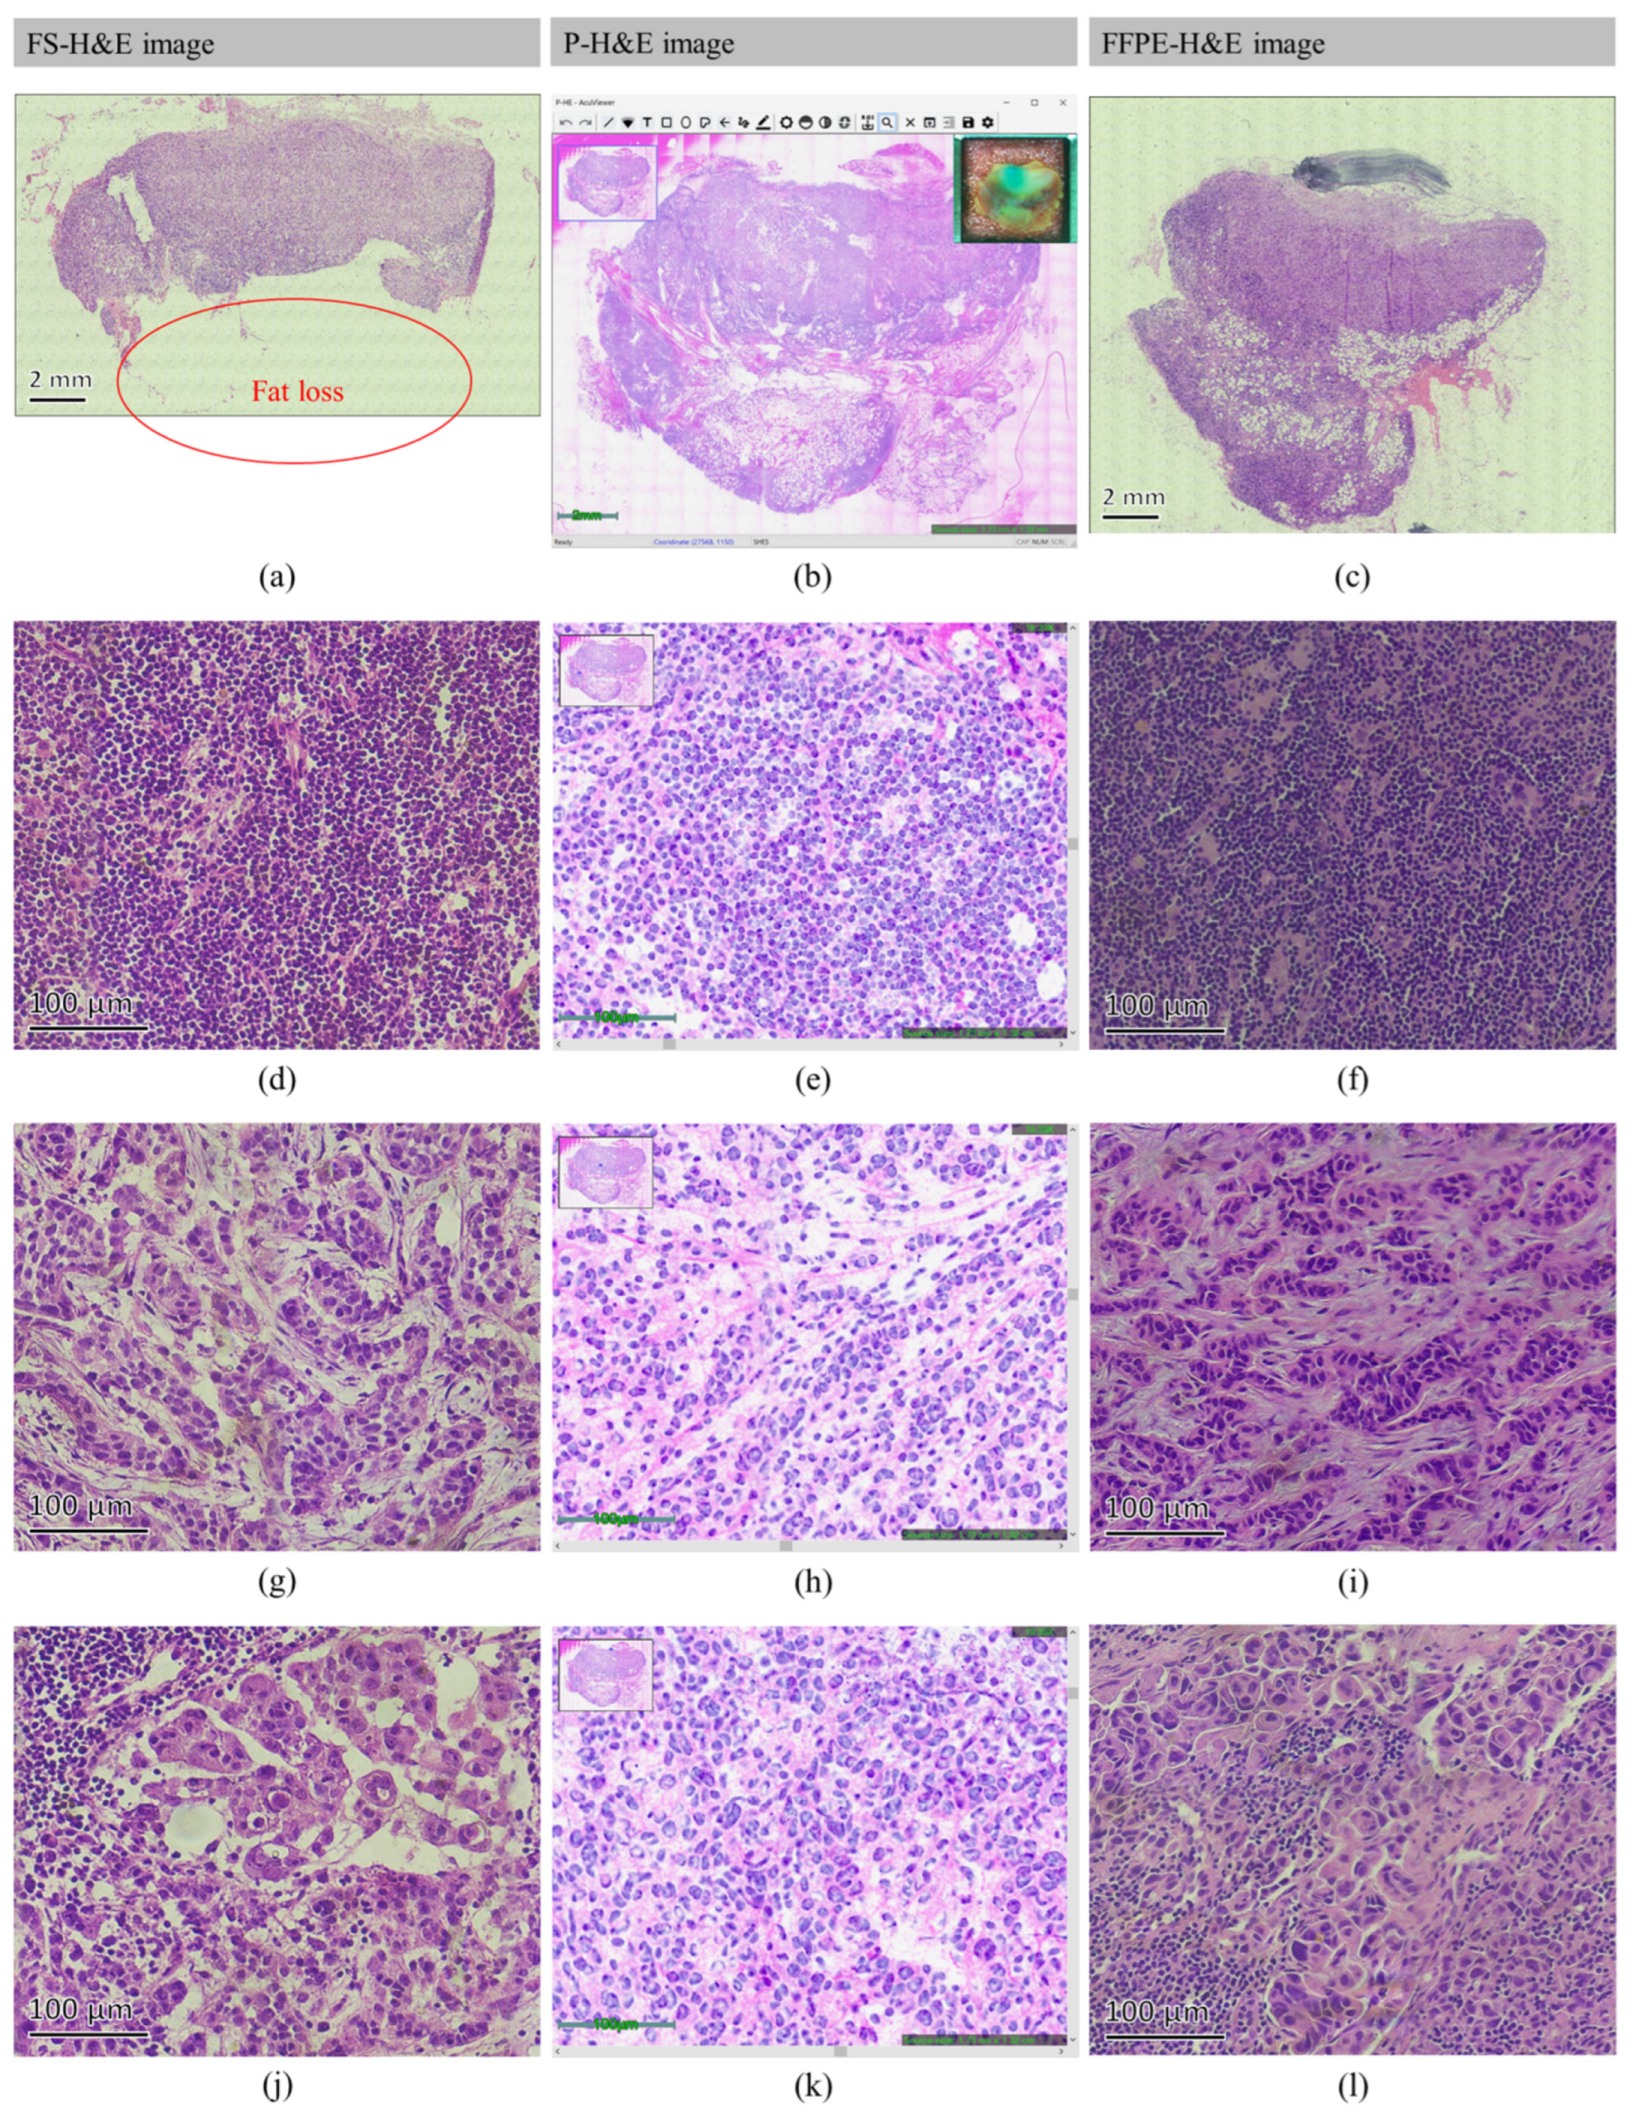
3.1. Normal SLN
3.2. Metastatic SLN
3.3. Processing Time Comparison
3.4. Data Assessment
4. Discussion
5. Conclusions
Author Contributions
Funding
Institutional Review Board Statement
Informed Consent Statement
Data Availability Statement
Acknowledgments
Conflicts of Interest
References
- Jatoi, I.; Hilsenbeck, S.G.; Clark, G.M.; Osborne, C.K. Significance of axillary lymph node metastasis in primary breast cancer. J. Clin. Oncol. 1999, 17, 2334–2340. [Google Scholar] [CrossRef] [PubMed]
- Lumachi, F.; Basso, S.M.; Bonamini, M.; Marino, F.; Marzano, B.; Milan, E.; Waclaw, B.U.; Chiara, G.B. Incidence of arm lymphoedema following sentinel node biopsy, axillary sampling and axillary dissection in patients with breast cancer. Vivo 2009, 23, 1017–1020. [Google Scholar]
- Weigelt, B.; Peterse, J.L.; van‘t Veer, L.J. Breast cancer metastasis: Markers and models. Nat. Rev. Cancer 2005, 5, 591–602. [Google Scholar] [CrossRef] [PubMed]
- Olivia, J.S.; Bay, B.H.; Yip, G.; Yu, Y. Breast cancer metastasis. Cancer Genom. Proteom. 2012, 9, 311–320. [Google Scholar]
- Weaver, D.L. Pathology evaluation of sentinel lymph nodes in breast cancer: Protocol recommendations and rationale. Mod. Pathol. 2010, 23, S26–S32. [Google Scholar] [CrossRef] [PubMed]
- McMasters, K.M.; Tuttle, T.M.; Carlson, D.J.; Brown, C.M.; Noyes, R.D.; Glaser, R.L.; Vennekotter, D.J.; Turk, P.S.; Tate, P.S.; Sardi, A.; et al. Sentinel lymph node biopsy for breast cancer: A suitable alternative to routine axillary dissection in multi-institutional practice when optimal technique is used. J. Clin. Oncol. 2000, 18, 2560–2566. [Google Scholar] [CrossRef] [PubMed]
- Ali, R.; Hanly, A.M.; Naughton, P.; Castineira, C.F.; Landers, R.; Cahill, R.A.; Watson, R.G. Intraoperative frozen section assessment of sentinel lymph nodes in the operative management of women with symptomatic breast cancer. World J. Surg. Oncol. 2008, 6, 1–6. [Google Scholar] [CrossRef]
- Jaafar, H. Intra-operative frozen section consultation: Concepts, applications and limitations. Malays. J. Med. Sci. 2008, 13, 4–12. [Google Scholar]
- White, V.A.; Trotter, M.J. Intraoperative consultation/final diagnosis correlation-relationship to tissue type and pathologic process. Arch. Pathol Lab Med. 2008, 132, 29–36. [Google Scholar] [CrossRef]
- Hashmi, A.A.; Faridi, N.; Khurshid, A.; Naqvi, H.; Malik, B.; Malik, F.R.; Fida, Z.; Mujtuba, S. Accuracy of frozen section analysis of sentinel lymph nodes for the detection of Asian breast cancer micrometastasis—Experience from Pakistan. Asian Pac. J. Cancer Prev. 2013, 14, 2657–2662. [Google Scholar] [CrossRef]
- Liu, L.C.; Lang, J.E.; Lu, Y.; Roe, D.; Hwang, S.E.; Ewing, C.A.; Esserman, L.J.; Morita, E.; Treseler, P.; Leong, S.P. Intraoperative frozen section analysis of sentinel lymph nodes in breast cancer patients. Cancer 2011, 117, 250–258. [Google Scholar] [CrossRef] [PubMed]
- Holck, S.; Galatius, H.; Engel, U.; Wagner, F.; Hoffmann, J. False-negative frozen section of sentinel lymph node biopsy for breast cancer. Breast 2004, 13, 42–48. [Google Scholar] [CrossRef] [PubMed]
- Wong, J.; Yong, W.S.; Thike, A.A.; Iqbal, J.; Salahuddin, A.S.; Ho, G.H.; Madhukumar, P.; Tan, B.K.; Ong, K.W.; Tan, P.H. False negative rate for intraoperative sentinel lymph node frozen section in patients with breast cancer: A retrospective analysis of patients in a single Asian institution. J. Clin. Pathol. 2015, 68, 536–540. [Google Scholar] [CrossRef] [PubMed]
- Qiao, G.; Cong, Y.; Zou, H.; Lin, J.; Wang, X.; Li, X.; Li, Y.; Zhu, S. False-negative frozen section of sentinel lymph node biopsy in a Chinese population with breast cancer. Anticancer. Res. 2016, 36, 1331–1337. [Google Scholar] [PubMed]
- Luo, W.; Nguyen, F.T.; Zysk, A.M.; Ralston, T.S.; Brockenbrough, J.; Marks, D.L.; Oldenburg, A.L.; Boppart, S.A. Optical biopsy of lymph node morphology using optical coherence tomograph. Technol. Cancer Res. Treat. 2005, 4, 539–548. [Google Scholar] [CrossRef]
- Nguyen, F.T.; Zysk, A.M.; Chaney, E.J.; Adie, S.G.; Kotynek, J.G.; Oliphant, U.J.; Bellafiore, F.J.; Rowland, K.M.; Johnson, P.A.; Boppart, S.A. Optical coherence tomography: The intraoperative assessment of lymph nodes in breast cancer. IEEE Eng. Med. Biol. Mag. 2010, 29, 63–70. [Google Scholar] [CrossRef]
- Beaurepaire, E.; Boccara, A.C.; Lebec, M.; Blanchot, L.; Saint-Jalmes, H. Full-field optical coherence microscopy. Opt. Lett. 1998, 23, 244–246. [Google Scholar] [CrossRef]
- Dubois, A.; Vabre, L.; Boccara, A.C.; Beaurepaire, E. High-resolution full-field optical coherence tomography with a Linnik microscope. Appl. Opt. 2002, 41, 805–812. [Google Scholar] [CrossRef]
- Jain, M.; Shukla, N.; Manzoor, M.; Nadolny, S.; Mukherjee, S. Modified full-field optical coherence tomography: A novel tool for rapid histology of tissues. J. Pathol. Inform. 2011, 2, 28. [Google Scholar] [CrossRef]
- Grieve, K.; Mouslim, K.; Assayag, O.; Dalimier, E.; Harms, F.; Bruhat, A.; Boccara, C.; Antoine, M. Assessment of sentinel node biopsies with full-field optical coherence tomography. Technol. Cancer Res. Treat. 2015, 15, 266–274. [Google Scholar] [CrossRef]
- Thouvenin, O.; Apelian, C.; Nahas, A.; Fink, M.; Boccara, C. Full-field optical coherence tomography as a diagnosis tool: Recent progress with multimodal imaging. Appl. Sci. 2017, 7, 236. [Google Scholar] [CrossRef]
- Matsumoto, T.; Niioka, H.; Kumamoto, Y.; Sato, J.; Inamori, O.; Nakao, R.; Harada, Y.; Konishi, E.; Otsuji, E.; Tanaka, H.; et al. Deep-UV excitation fluorescence microscopy for detection of lymph node metastasis using deep neural network. Sci. Rep. 2019, 9, 16912. [Google Scholar] [CrossRef] [PubMed]
- Suo, Y.; Yang, W.; Lu, F.; Xie, X.S. Label-free imaging of lymph nodes with stimulated Raman scattering microscopy. In Proceedings of the Optics in Health Care and Biomedical Optics IX, Hangzhou, China, 29 November 2019; p. 111900J. [Google Scholar]
- Yang, H.; Zhang, S.; Liu, P.; Cheng, L.; Tong, F.; Liu, H.; Wang, S.; Liu, M.; Wang, C.; Peng, Y.; et al. Use of high-resolution full-field optical coherence tomography and dynamic cell imaging for rapid intraoperative diagnosis during breast cancer surgery. Cancer 2020, 126, 3847–3856. [Google Scholar] [CrossRef] [PubMed]
- Tao, Y.K.; Shen, D.; Sheikine, Y.; Ahsen, O.O.; Wang, H.H.; Schmolze, D.B.; Johnson, N.B.; Brooker, J.S.; Cable, A.E.; Connolly, J.L.; et al. Assessment of breast pathologies using nonlinear microscopy. Proc. Natl. Acad. Sci. USA 2014, 111, 15304–15309. [Google Scholar] [CrossRef] [PubMed]
- Gareau, D.S. The feasibility of digitally stained multimodal confocal mosaics to simulate histopathology. J. Biomed. Opt. 2009, 14, 034050. [Google Scholar] [CrossRef]
- Giacomelli, M.G.; Husvogt, L.; Vardeh, H.; Faulkner-Jones, B.E.; Hornegger, J.; Connolly, J.L.; Fujimoto, J.G. Virtual Hematoxylin and Eosin Transillumination Microscopy Using Epi-Fluorescence Imaging. PLoS ONE 2016, 11, e0159337. [Google Scholar] [CrossRef]
- Tsai, C.C.; Hsu, K.Y. Optical Sectioning Apparatus Using Advanced Optical Interference Microscopy. US Patent 10,151,572B1, 11 December 2018. [Google Scholar]
- Tsai, C.C.; Hsu, K.Y.; Jheng, D.Y.; Lin, S.E. Pseudo H and E image producing method and optical system using same. U.S. Patent 10,665,000B2, 26 May 2020. [Google Scholar]
- Lin, S.E.; Jheng, D.Y.; Hsu, K.Y.; Liu, Y.R.; Huang, W.H.; Lee, H.C.; Tsai, C.C. Rapid pseudo-H&E imaging using a fluorescence-inbuilt optical coherence microscopic imaging system. Biomed. Opt. Express 2021, 12, 5139–5158. [Google Scholar]
- Liu, T.J. Validity of sentinel lymph node biopsy in Taiwanese breast cancer patients. J. Formos. Med. Assoc. 2007, 106, 126–133. [Google Scholar] [CrossRef][Green Version]
- Thompson, M.; Korourian, S.; Henry-Tillman, R.; Adkins, L.; Mumford, S.; Westbrook, K.C.; Klimberg, V.S. Axillary reverse mapping (ARM): A new concept to identify and enhance lymphatic preservation. Ann. Surg. Oncol. 2007, 14, 1890–1895. [Google Scholar] [CrossRef]
- Krag, D.N.; Weaver, D.L.; Alex, J.C.; Fairbank, J.T. Surgical resection and radiolocalization of the sentinel lymph node in breast cancer using a gamma probe. Surg. Oncol. 1993, 2, 335–339. [Google Scholar] [CrossRef]
- Giuliano, A.E.; Kirgan, D.M.; Guenther, J.M.; Morton, D.L. Lymphatic mapping and sentinel lymphadenectomy for breast cancer. Ann. Surg. 1994, 220, 398–401. [Google Scholar] [CrossRef] [PubMed]
- Albertini, J.J.; Lyman, G.H.; Cox, C.; Yeatman, T.; Balducci, L.; Ku, N.; Shivers, S.; Berman, C.; Wells, K.; Rapaport, D.; et al. Lymphatic mapping and sentinel node biopsy in the patient with breast cancer. JAMA 1996, 276, 1818–1822. [Google Scholar] [CrossRef] [PubMed]
- Ferrucci, M.; Franceschini, G.; Douek, M. New techniques for sentinel node biopsy in breast cancer. Transl. Cancer Res. 2018, 7, S405–S417. [Google Scholar] [CrossRef]
- Borgstein, P.J.; Meijer, S.; Pijpers, R. Intradermal blue dye to identify sentinel lymph-node in breast cancer. Lancent 1999, 349, 1668–1669. [Google Scholar] [CrossRef] [PubMed]
- East, J.M.; Valentine, C.S.; Kanchev, E.; Blake, G.O. Sentinel lymph node biopsy for breast cancer using methylene blue dye manifests a short learning curve among experienced surgeons: A prospective tabular cumulative sum (CUSUM) analysis. BMC Surg. 2009, 9, 2. [Google Scholar] [CrossRef]
- Guo, J.; Yang, H.; Wang, S.; Cao, Y.; Liu, M.; Xie, F.; Liu, P.; Zhou, B.; Tong, F.; Cheng, L.; et al. Comparison of sentinel lymph node biopsy guided by indocyanine green, blue dye, and their combination in breast cancer patients: A prospective cohort study. World, J. Surg. Onc. 2017, 15, 196. [Google Scholar] [CrossRef]
- Karimi, M.; Mathieu, M.-C.; Rouffiac, V.; De Leeuw, F.; Michiels, S.; Laplace-Builhé, C.; Mazouni, C. Near-Infrared Fluorescence Axillary Reverse Mapping (ARM) Procedure in Invasive Breast Cancer: Relationship between Fluorescence Signal in ARM Lymph Nodes and Clinical Outcomes. Cancers 2022, 14, 2614–2628. [Google Scholar]
- Makki, J. Diversity of Breast Carcinoma: Histological Subtypes and Clinical Relevance. Clin. Med. Insights Pathol. 2015, 8, 23–31. [Google Scholar] [CrossRef]
- McCart Reed, A.E.; Kutasovic, J.R.; Lakhani, S.R.; Simpson, P.T. Invasive lobular carcinoma of the breast: Morphology, biomarkers and ’omics. Breast Cancer Res. 2015, 17, 12. [Google Scholar] [CrossRef]
- Liang, C.; Li, L.; Zhu, M.; Hu, J.; Yu, Y. The Guiding Significance of the Number of Positive Sentinel Lymph Nodes in Frozen Section for Intraoperative Axillary Dissection in Early Breast Cancer. Cancer Manag. Res. 2021, 13, 4803–4810. [Google Scholar] [CrossRef]
- Jain, D.; Allen, T.C.; Aisner, D.L.; Beasley, M.B.; Cagle, P.T.; Capelozzi, V.L.; Hariri, L.P.; Lantuejoul, S.; Miller, R.; Mino-Kenudson, M.; et al. Rapid On-Site Evaluation of Endobronchial Ultrasound-Guided Transbronchial Needle Aspirations for the Diagnosis of Lung Cancer: A Perspective From Members of the Pulmonary Pathology Society. Arch. Pathol. Lab. Med. 2018, 142, 253–262. [Google Scholar] [CrossRef] [PubMed]
- Roy-Chowdhuri, S.; Chen, H.; Singh, R.R.; Krishnamurthy, S.; Patel, K.P.; Routbort, M.J.; Manekia, J.; Barkoh, B.A.; Yao, H.; Sabir, S.; et al. Concurrent fine needle aspirations and core needle biopsies: A comparative study of substrates for next-generation sequencing in solid organ malignancies. Mod. Pathol. 2017, 30, 499–508. [Google Scholar] [CrossRef] [PubMed]
- Grabenstetter, A.; Moo, T.A.; Hajiyeva, S.; Schüffler, P.J.; Khattar, P.; Friedlander, M.A.; McCormack, M.A.; Raiss, M.; Zabor, E.C.; Barrio, A.; et al. Accuracy of Intraoperative Frozen Section of Sentinel Lymph Nodes After Neoadjuvant Chemotherapy for Breast Carcinoma. Am. J. Surg. Pathol. 2019, 43, 1377–1383. [Google Scholar] [CrossRef] [PubMed]


| Patient | Sex | Age | Laterality | Category | Final Histology | SLN | |||
|---|---|---|---|---|---|---|---|---|---|
| T | N | Stage | Quantity | Mean Size (cm2) | |||||
| 1 | F | 58 | L | Tis | N0 | 0 | DCIS | 2 | 1.2 × 0.8 |
| 2 | F | 56 | R | Tis | N0 | 0 | LCIS | 3 | 1.2 × 1.0 |
| 3 | F | 60 | R | T1c | N0 | IA | IDC | 5 | 1.0 × 1.0 |
| 4 | F | 67 | R | T1c | N0 | IA | IDC | 2 | 0.7 × 0.7 |
| 5 | F | 70 | L | Tis | N0 | 0 | DCIS | 1 | 0.8 × 0.8 |
| 6 | F | 49 | L | T1b | N0 | IA | IDC | 3 | 1.0 × 0.5 |
| 7 | F | 66 | R | T1a | N0 | IA | IDC | 6 | N/A |
| 8 | F | 40 | L | Tis | N0 | 0 | DCIS | 2 | 1.0 × 1.0 |
| 9 | F | 42 | R | Tis | N0 | 0 | DCIS | 2 | 0.6 × 0.4 |
| 10 | F | 53 | L | T1c | N0 | IA | IDC | 1 | 1.2 × 1.1 |
| 11 | F | 49 | R | T2 | N0 | IIA | ILC | 3 | 1.4 × 1.4 |
| 12 | F | 73 | R | T1mic | N0 | IA | IDC | 4 | 1.6 × 1.0 |
| 13 | F | 34 | R | T1b | N0 | IA | IDC | 4 | 1.2 × 0.7 |
| 14 | F | 66 | L | T1c | N0 | IA | IDC | 5 | 1.5 × 0.7 |
| 15 | F | 60 | R | T2 | N0 | IIA | IDC | 1 | 0.8 × 0.8 |
| 16 | F | 58 | L | T2 | N0 | IIA | ILC | 6 | 1.5 × 1.5 |
| 17 | F | 68 | R | Tis | N0 | 0 | DCIS | 2 | N/A |
| 18 | F | 85 | L | T2 | N0 | IIB | ILC | 2 | 1.5 × 1.5 |
| 19 | F | 51 | R | T1c | N0 | IA | IDC | 4 | 1.8 × 1.5 |
| 20 | F | 49 | L | Tis | N0 | 0 | DCIS | 2 | 1.1 × 0.5 |
| 21 | F | 76 | L | T2 | N1a | IIB | IDC | 6 | 1.8 × 1.8 |
| 22 | F | 48 | L | T2 | N1mi | IIB | IDC | 3 | 1.9 × 1.9 |
| 23 | F | 87 | R | T1c | N1a | IA | IDC | 2 | 0.9 × 0.5 |
| 24 | F | 68 | L | T2 | N1 | IIB | IDC | 2 | 1.5 × 0.8 |
| 25 | F | 48 | L | T1c | N0 | IA | IDC | 3 | 0.6 × 0.6 |
| 26 | F | 53 | L | T2 | N0 | IIA | IDC | 3 | 1.6 × 1.0 |
| 27 | F | 54 | L | T1c | N1a | IIA | IDC | 1 | 3.4 × 1.4 |
| 28 | F | 37 | R | T2 | N1a | IIB | IDC | 2 | 1.3 × 1.1 |
| 29 | F | 48 | L | Tis | N0 | 0 | DCIS | 1 | 1.2 × 0.8 |
| Average | 58 ± 13 | 2.9 ± 1.6 | 1.3 ± 0.6 × 1.0 ± 0.5 | ||||||
| Time (min) | FS-H&E Image | p-H&E Image |
|---|---|---|
| Tissue dissection 1 | 4 | |
| PM #1 soak 2 | 5 | |
| Specimen setting 3 | 2 | |
| Specimen scanning 4 | 11.5 | |
| Image processing 5 | 4 | |
| Tissue Processing 6 | 29 | |
| Image assessment 7 | 12 | 8 |
| SLN number 8 | 2.9 ± 1.6 | |
| Total time | 45 | 56 |
| FS-H&E Image | P-H&E Image | FFPE-H&E Image | |
|---|---|---|---|
| SLN number (n) | 85 | 83 | 95 |
| Positive metastasis | 8 | 8 | 9 |
| ITCs in SLN 1 | 0 | 1 | 4 |
| Positive rate (%) | 9.4 | 9.6 | 9.5 |
| TP | 8 | 8 | 9 |
| TN | 76 | 74 | 86 |
| FP | 0 | 0 | 0 |
| FN | 1 | 1 | 0 |
| Specificity (%) | 100 | 100 | 100 |
| Sensitivity (%) | 88.9 | 88.9 | 100 |
| Accuracy (%) | 98.8 | 98.8 | 100 |
Publisher’s Note: MDPI stays neutral with regard to jurisdictional claims in published maps and institutional affiliations. |
© 2022 by the authors. Licensee MDPI, Basel, Switzerland. This article is an open access article distributed under the terms and conditions of the Creative Commons Attribution (CC BY) license (https://creativecommons.org/licenses/by/4.0/).
Share and Cite
Lin, S.-E.; Chang, W.-W.; Hsiao, P.-K.; Hsieh, M.-C.; Chen, W.-Y.; Fang, C.-L.; Tsai, C.-C. Feasibility of Breast Cancer Metastasis Assessment of Ex Vivo Sentinel Lymph Nodes through a p-H&E Optical Coherence Microscopic Imaging System. Cancers 2022, 14, 6081. https://doi.org/10.3390/cancers14246081
Lin S-E, Chang W-W, Hsiao P-K, Hsieh M-C, Chen W-Y, Fang C-L, Tsai C-C. Feasibility of Breast Cancer Metastasis Assessment of Ex Vivo Sentinel Lymph Nodes through a p-H&E Optical Coherence Microscopic Imaging System. Cancers. 2022; 14(24):6081. https://doi.org/10.3390/cancers14246081
Chicago/Turabian StyleLin, Sey-En, Wei-Wen Chang, Ping-Kun Hsiao, Mao-Chih Hsieh, Wei-Yu Chen, Chia-Lang Fang, and Chien-Chung Tsai. 2022. "Feasibility of Breast Cancer Metastasis Assessment of Ex Vivo Sentinel Lymph Nodes through a p-H&E Optical Coherence Microscopic Imaging System" Cancers 14, no. 24: 6081. https://doi.org/10.3390/cancers14246081
APA StyleLin, S.-E., Chang, W.-W., Hsiao, P.-K., Hsieh, M.-C., Chen, W.-Y., Fang, C.-L., & Tsai, C.-C. (2022). Feasibility of Breast Cancer Metastasis Assessment of Ex Vivo Sentinel Lymph Nodes through a p-H&E Optical Coherence Microscopic Imaging System. Cancers, 14(24), 6081. https://doi.org/10.3390/cancers14246081