

ERK MAP Kinase Signaling Regulates RAR Signaling to Confer Retinoid Resistance on Breast Cancer Cells
 , , and
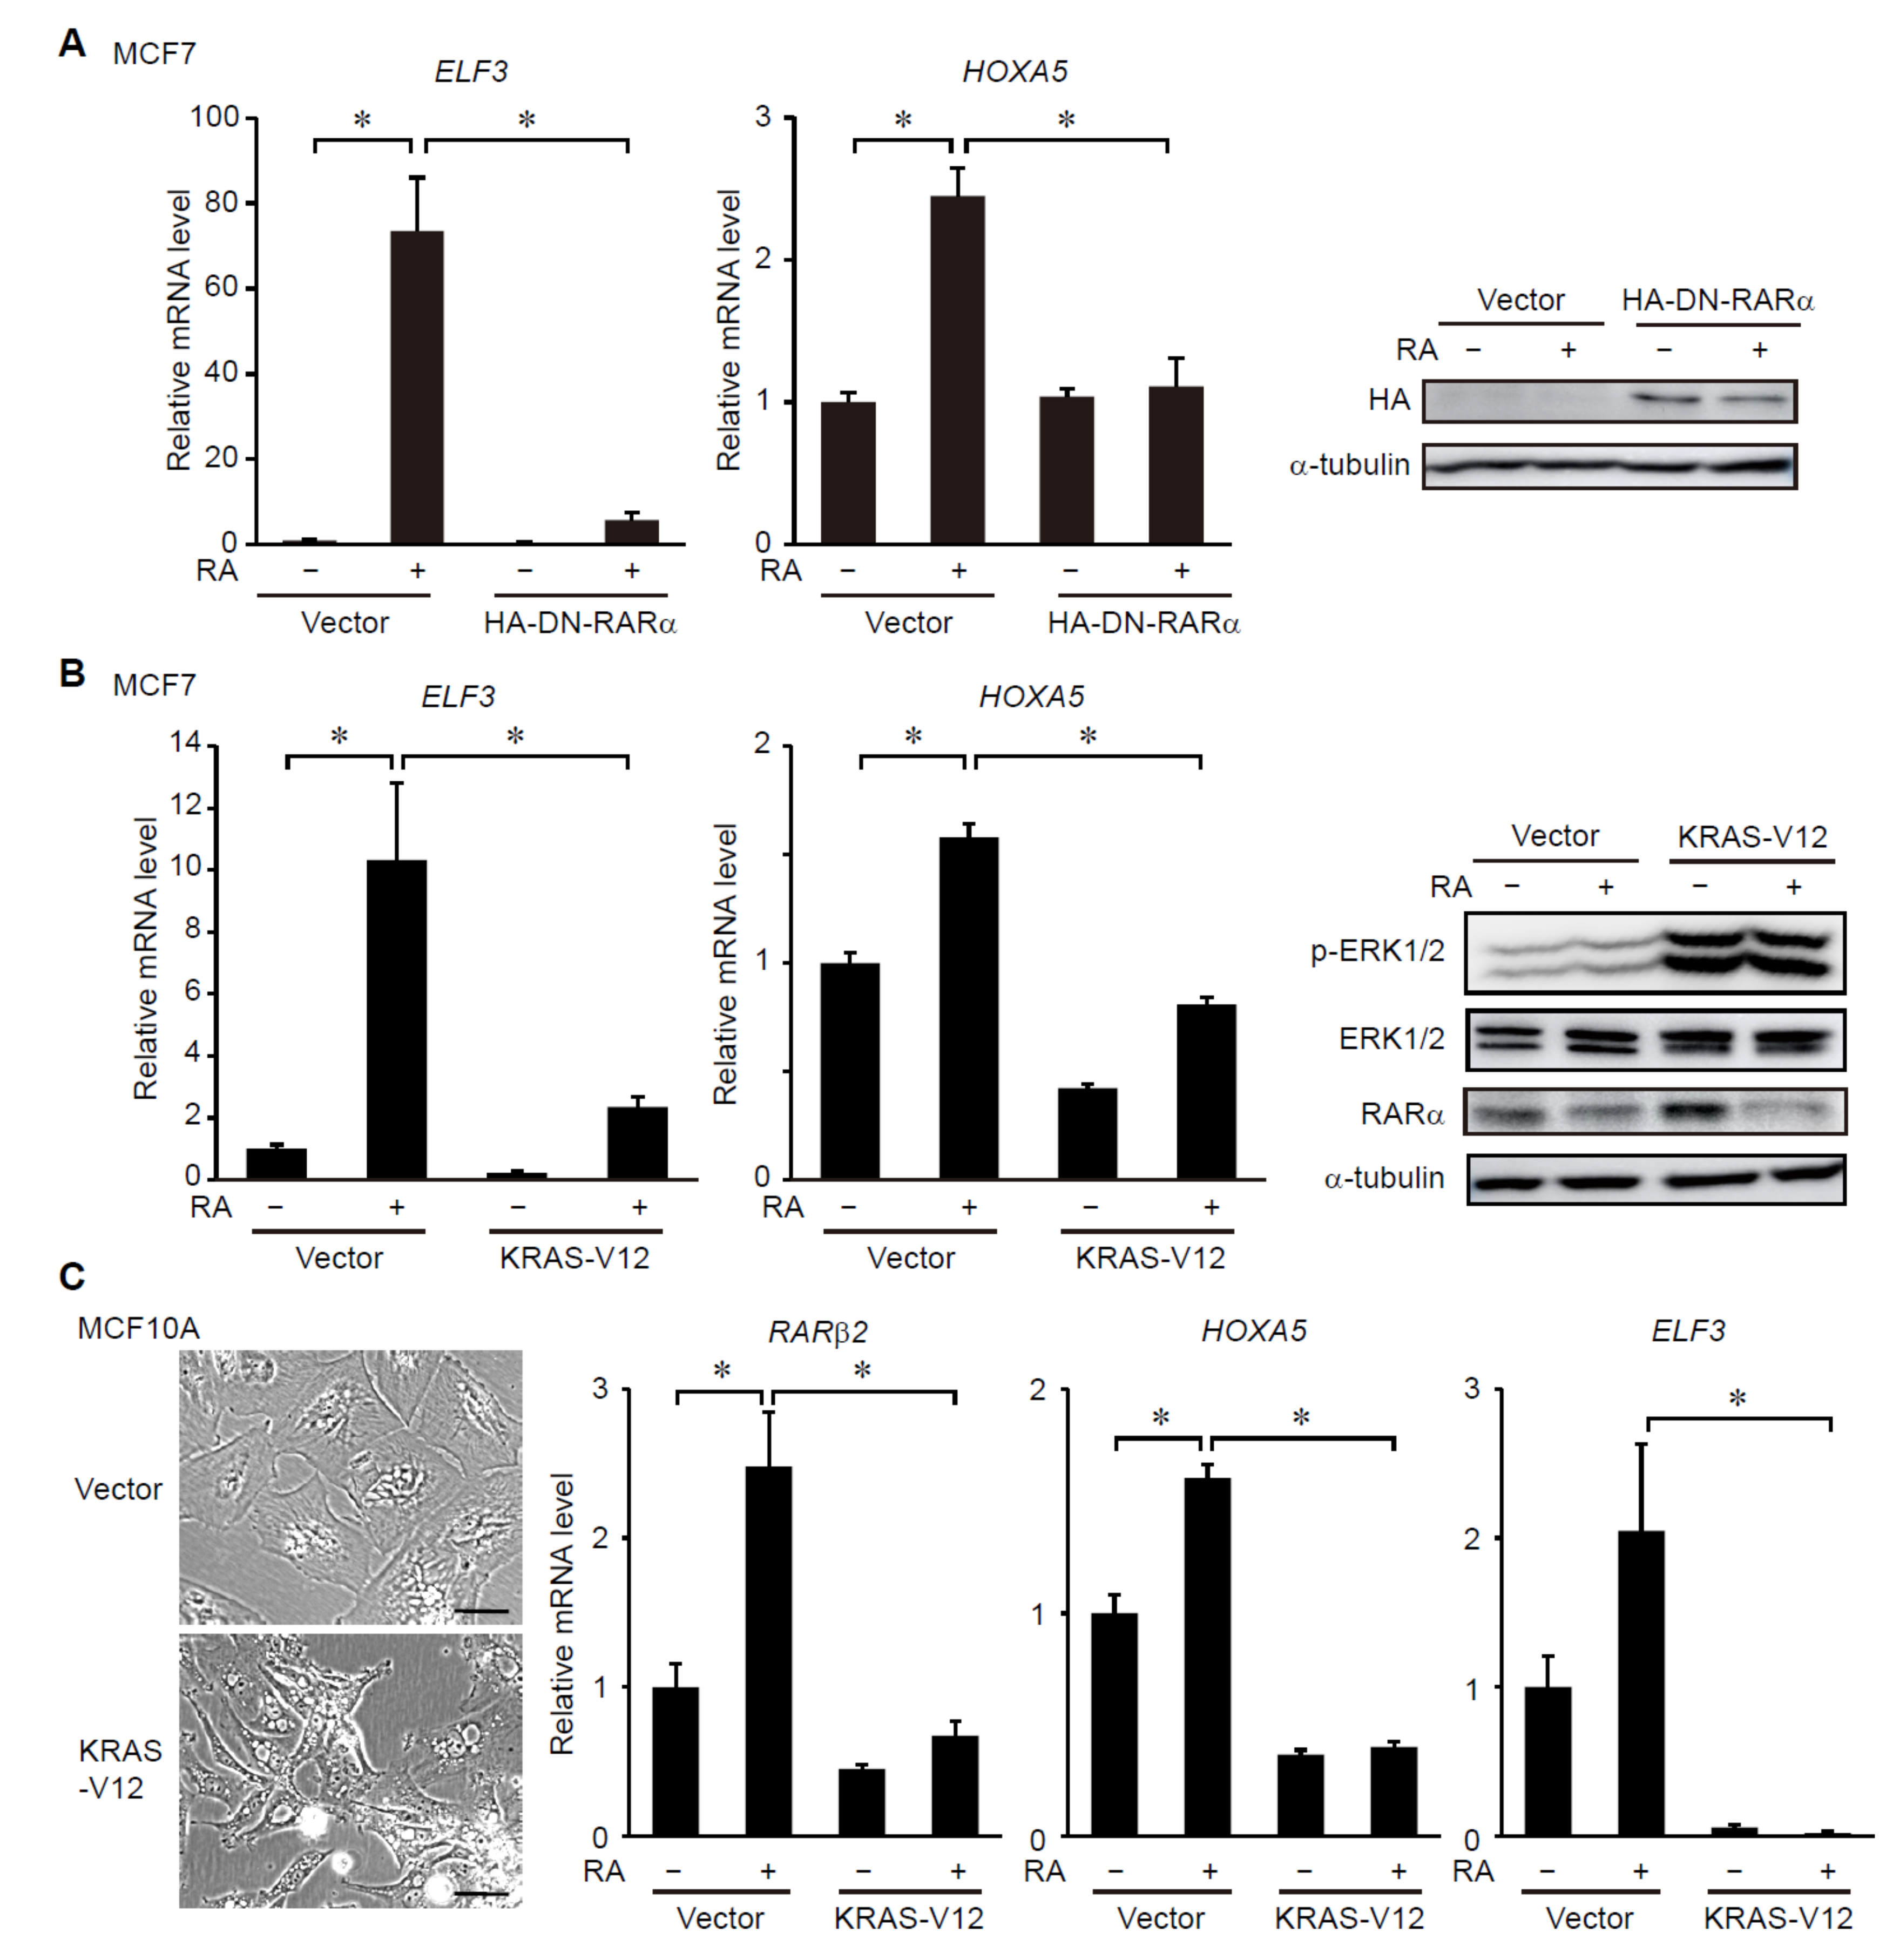
Abstract
Simple Summary
Abstract
1. Introduction
2. Materials and Methods
2.1. Cell Culture
2.2. Plasmids, Antibodies and Reagents
2.3. RT-PCR Analysis
2.4. Luciferase Assay
2.5. Synthesis of Poly(DMAAm-co-APTMA) Hydrogels
2.6. RNA-Sequencing Analysis
2.7. Analysis of Human Breast Cancer Microarray and RNA-Sequencing Datasets
2.8. Xenograft Mouse Model of Breast Cancers
3. Results
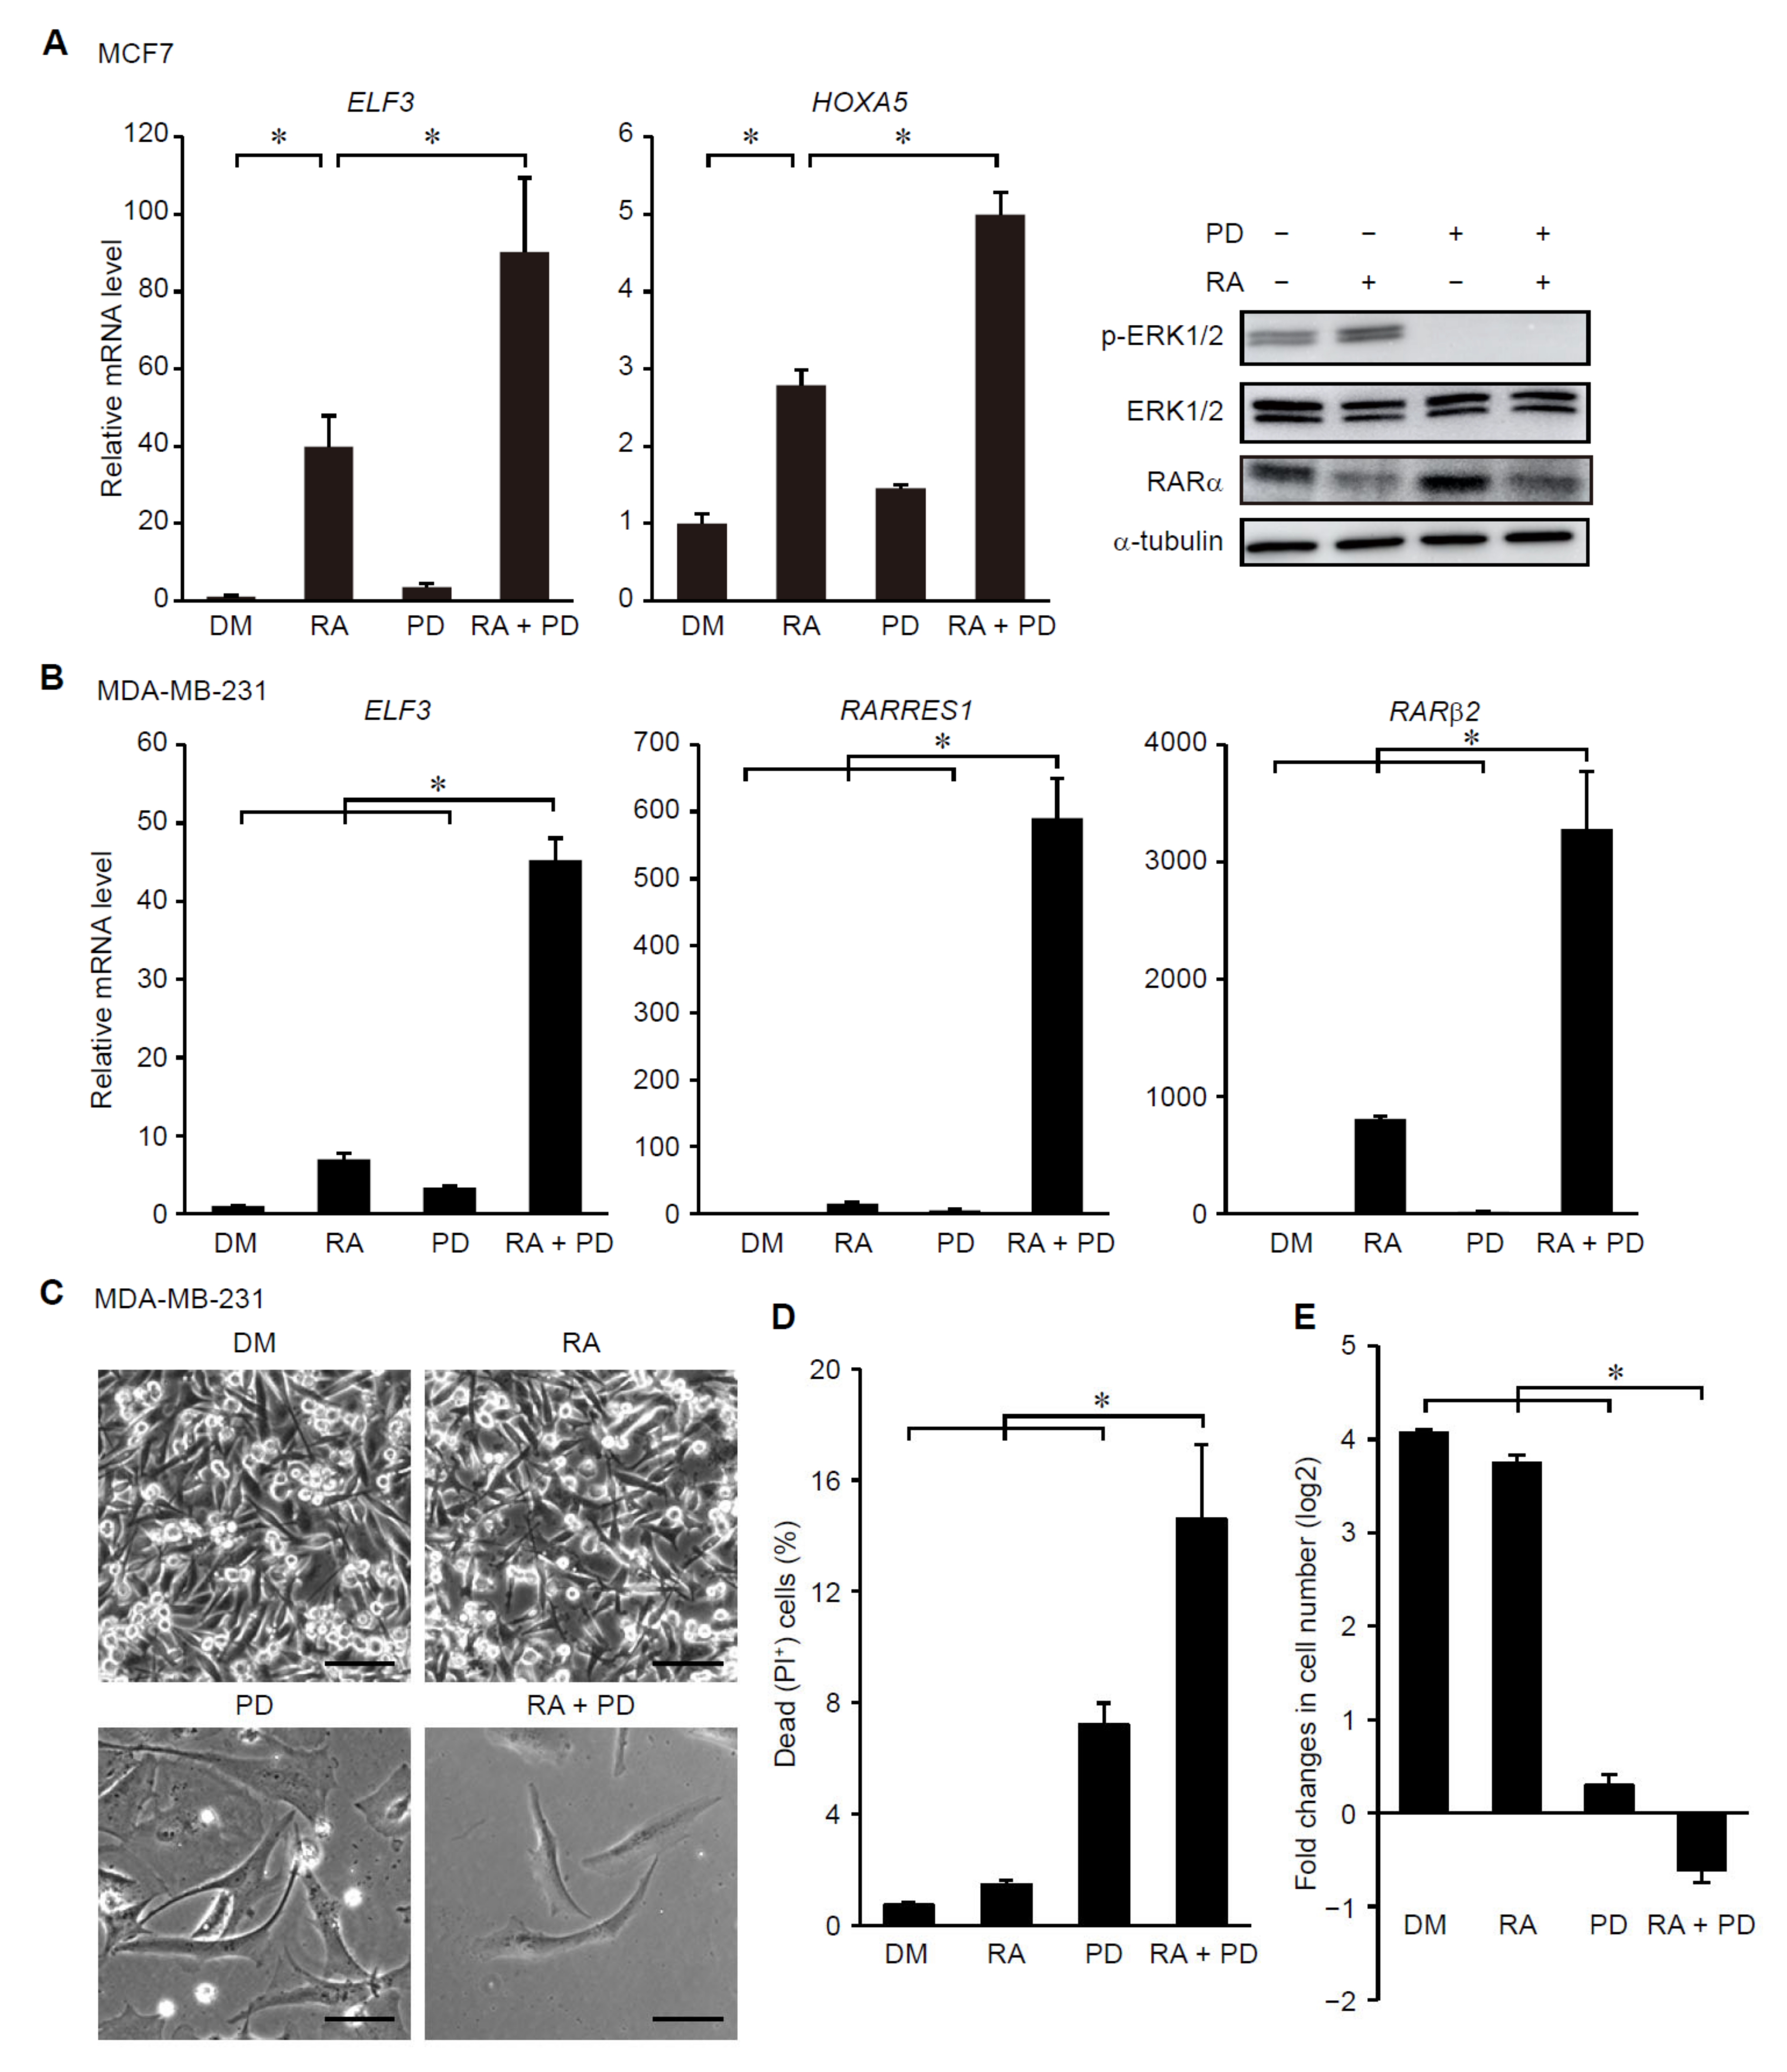
3.1. ERK Signaling Regulates RAR-Target Gene Expression in Breast Cancer Cells
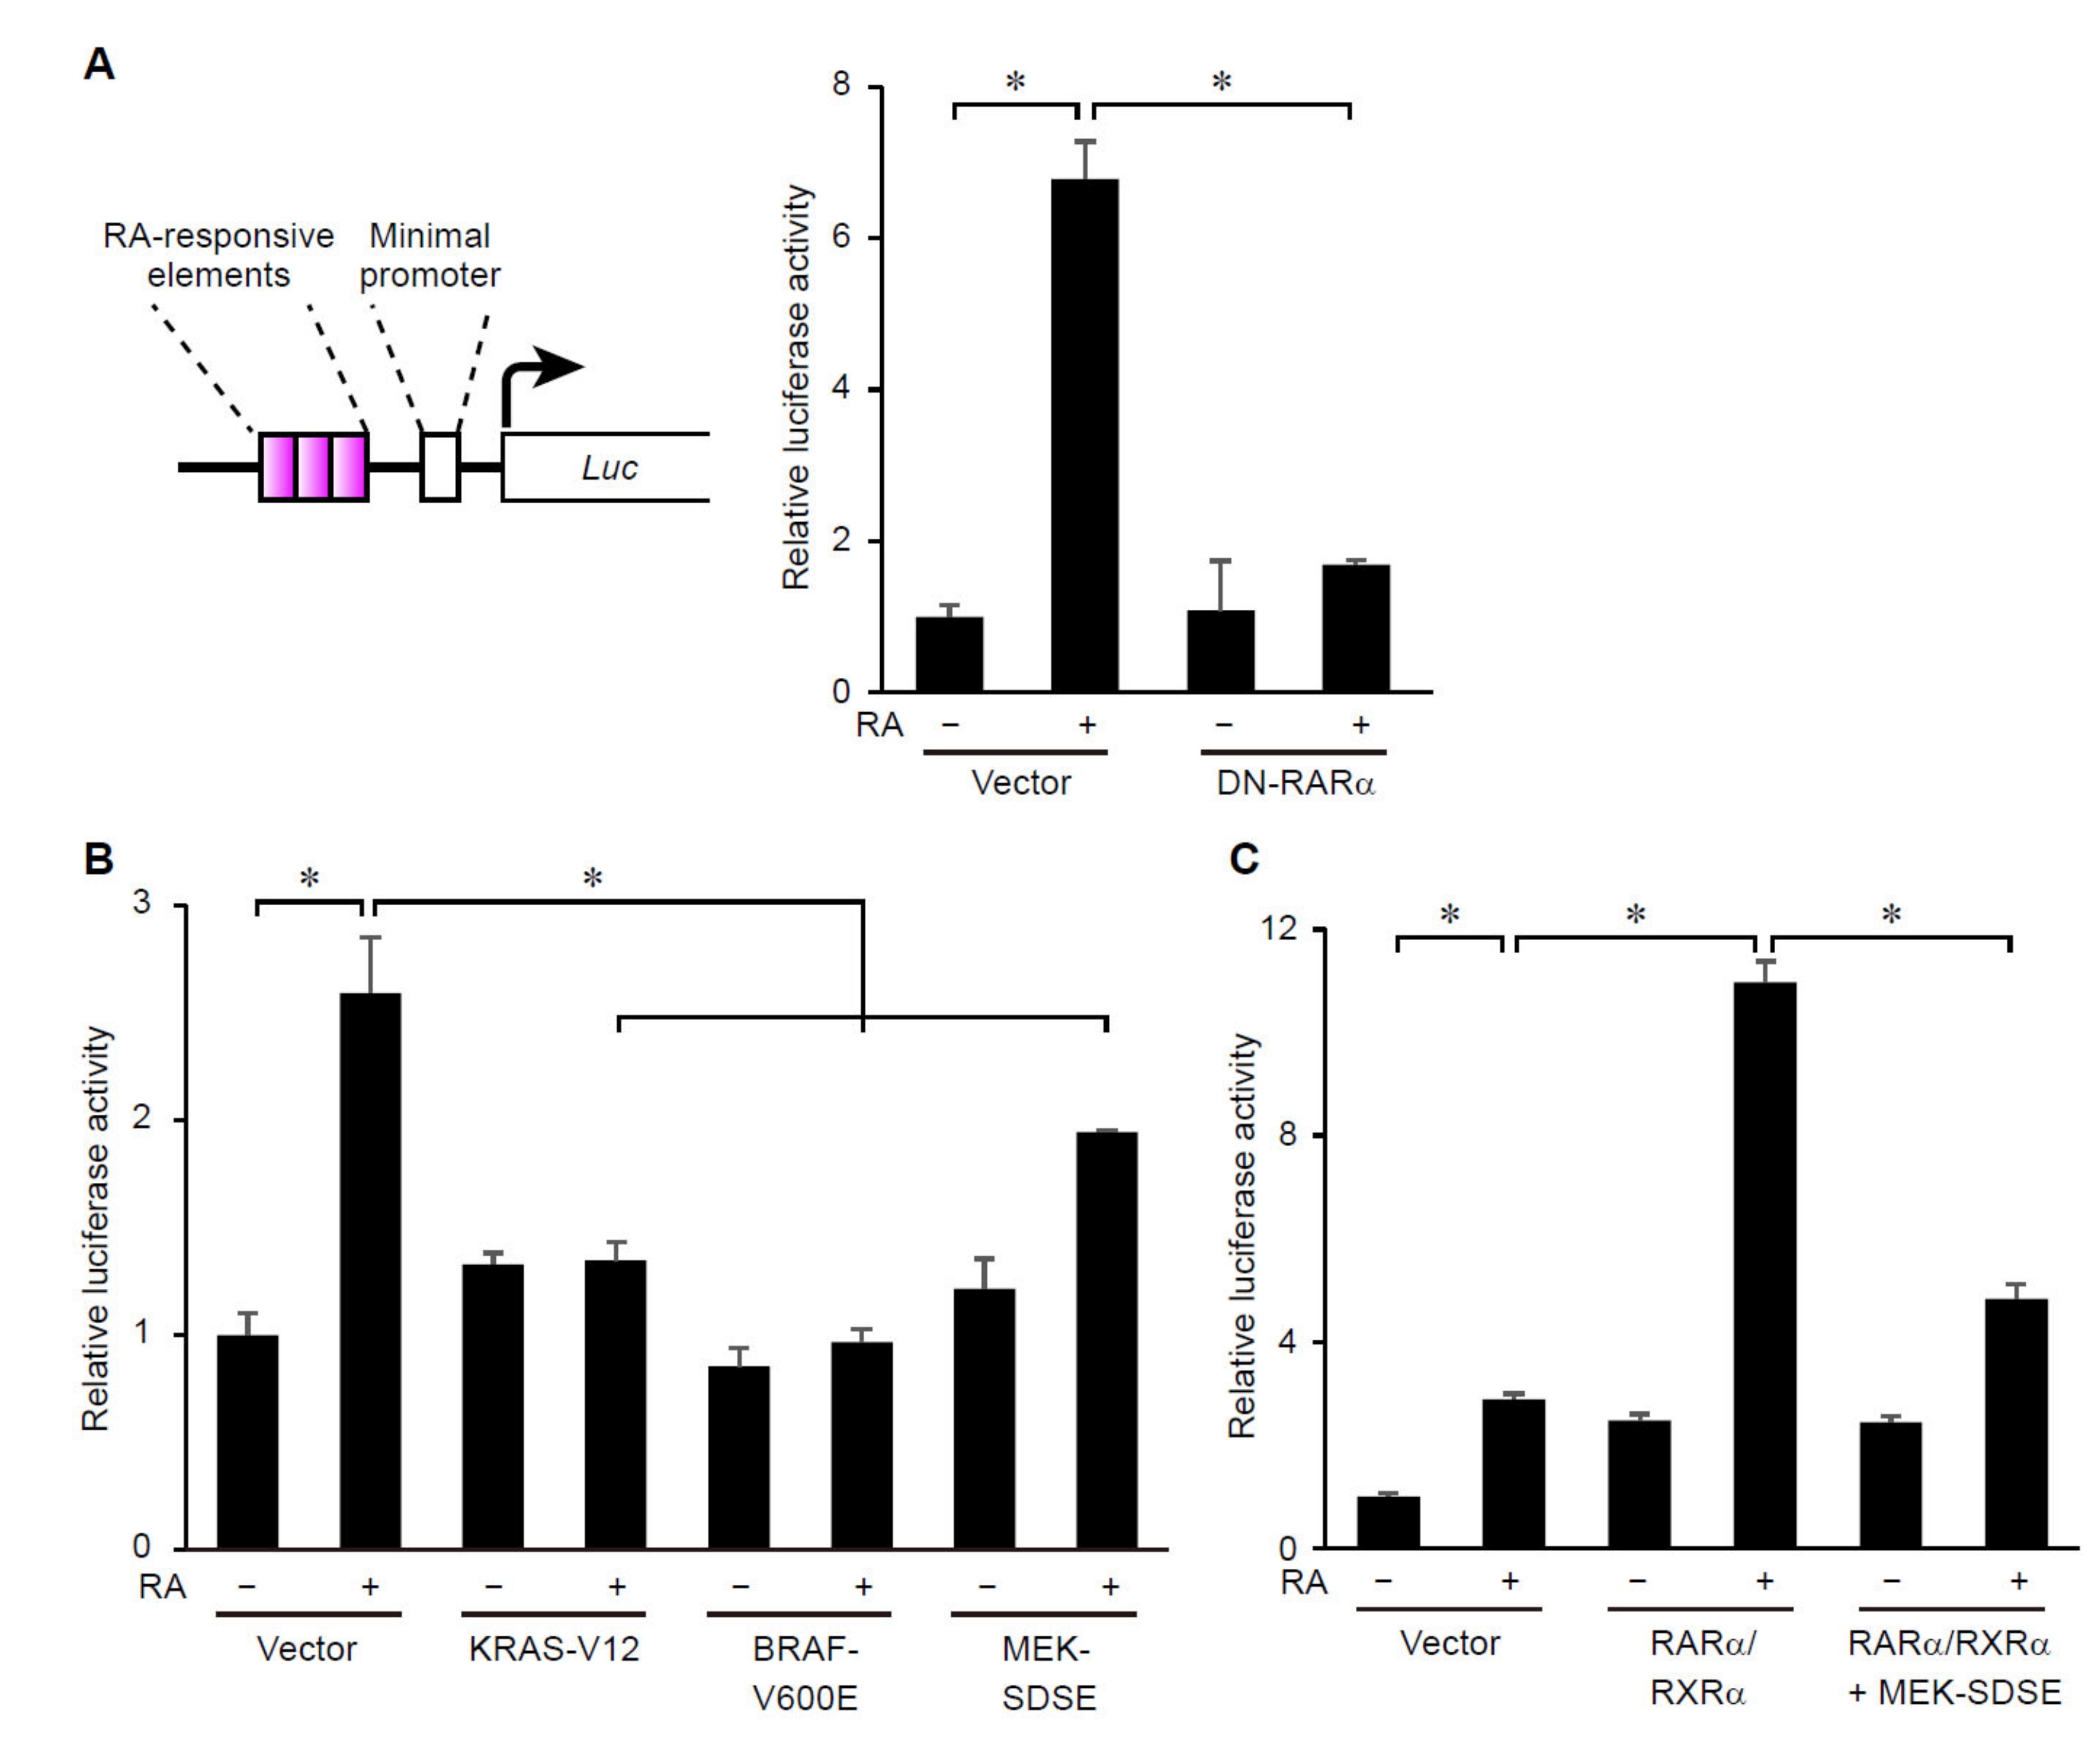
3.2. ERK Signaling Regulates Transcriptional Activity of RARs
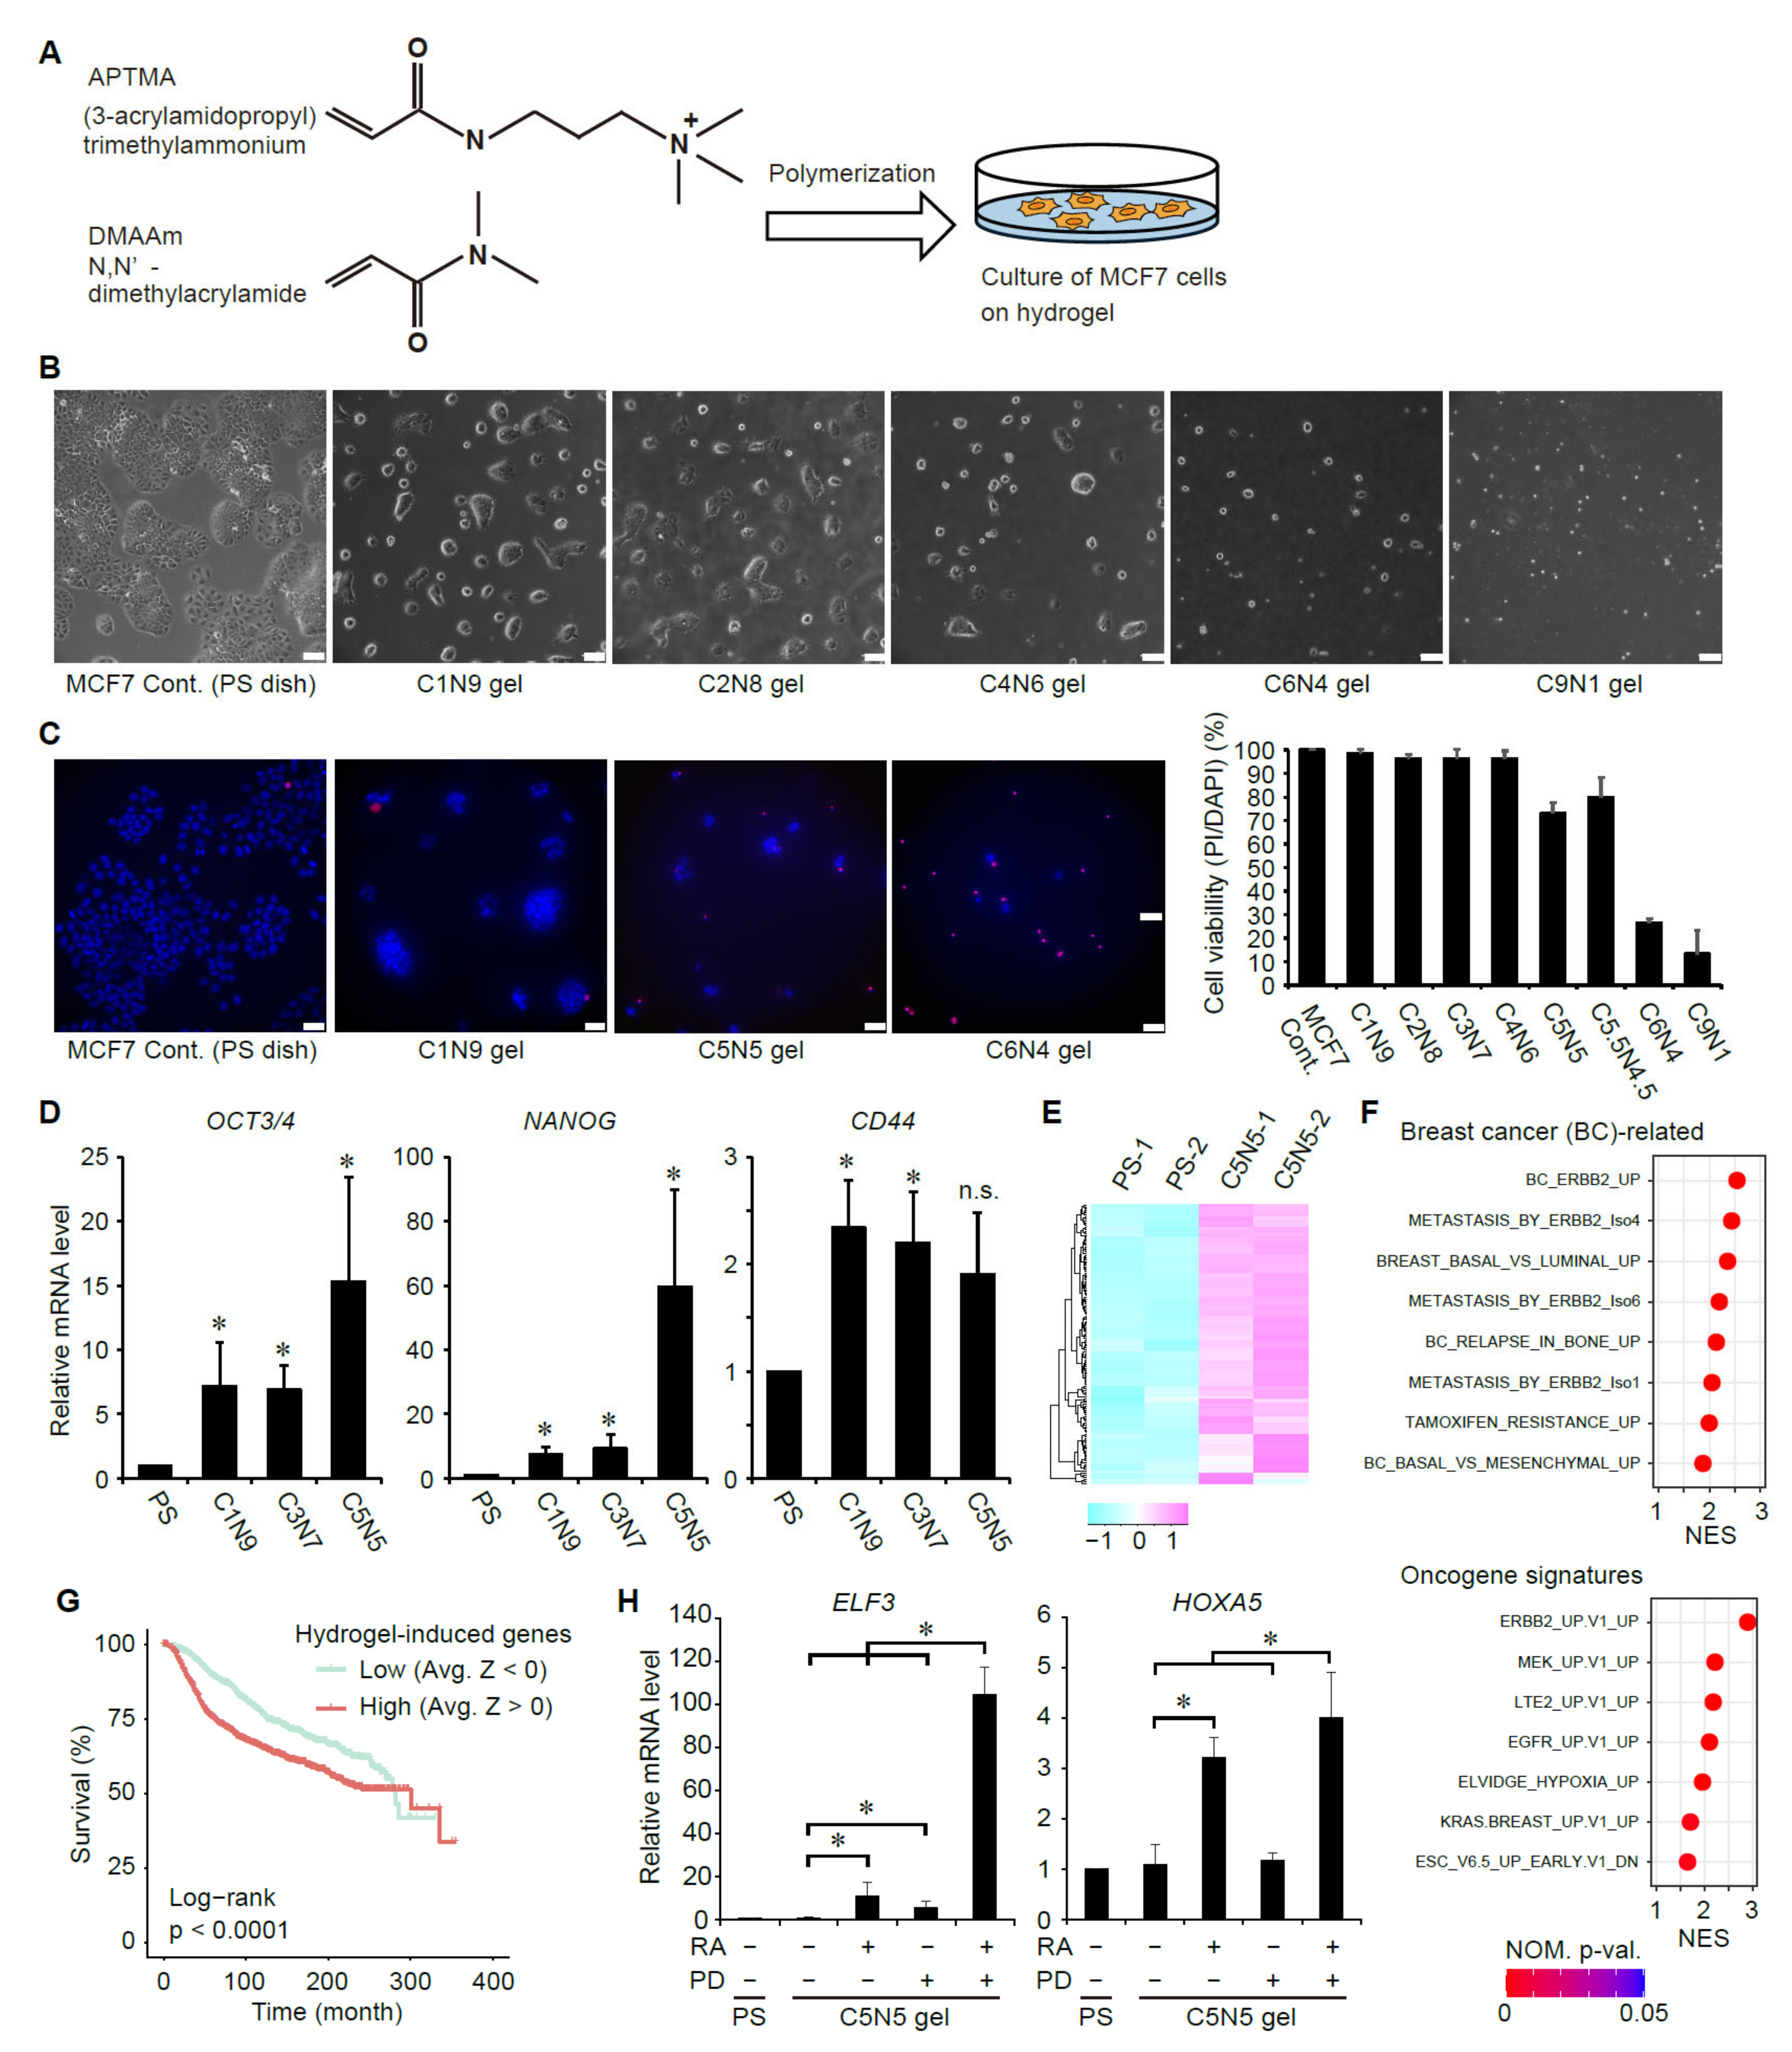
3.3. Suppression of ERK Signaling Enhances Ligand-Dependent Activation of RAR Signaling in Breast Cancer Cells with Elevated Cancer Stem Cell Properties
3.4. Treatment with RA and a MEK Inhibitor Synergistically Decreases Tumorigenicity of Breast Cancer Cells
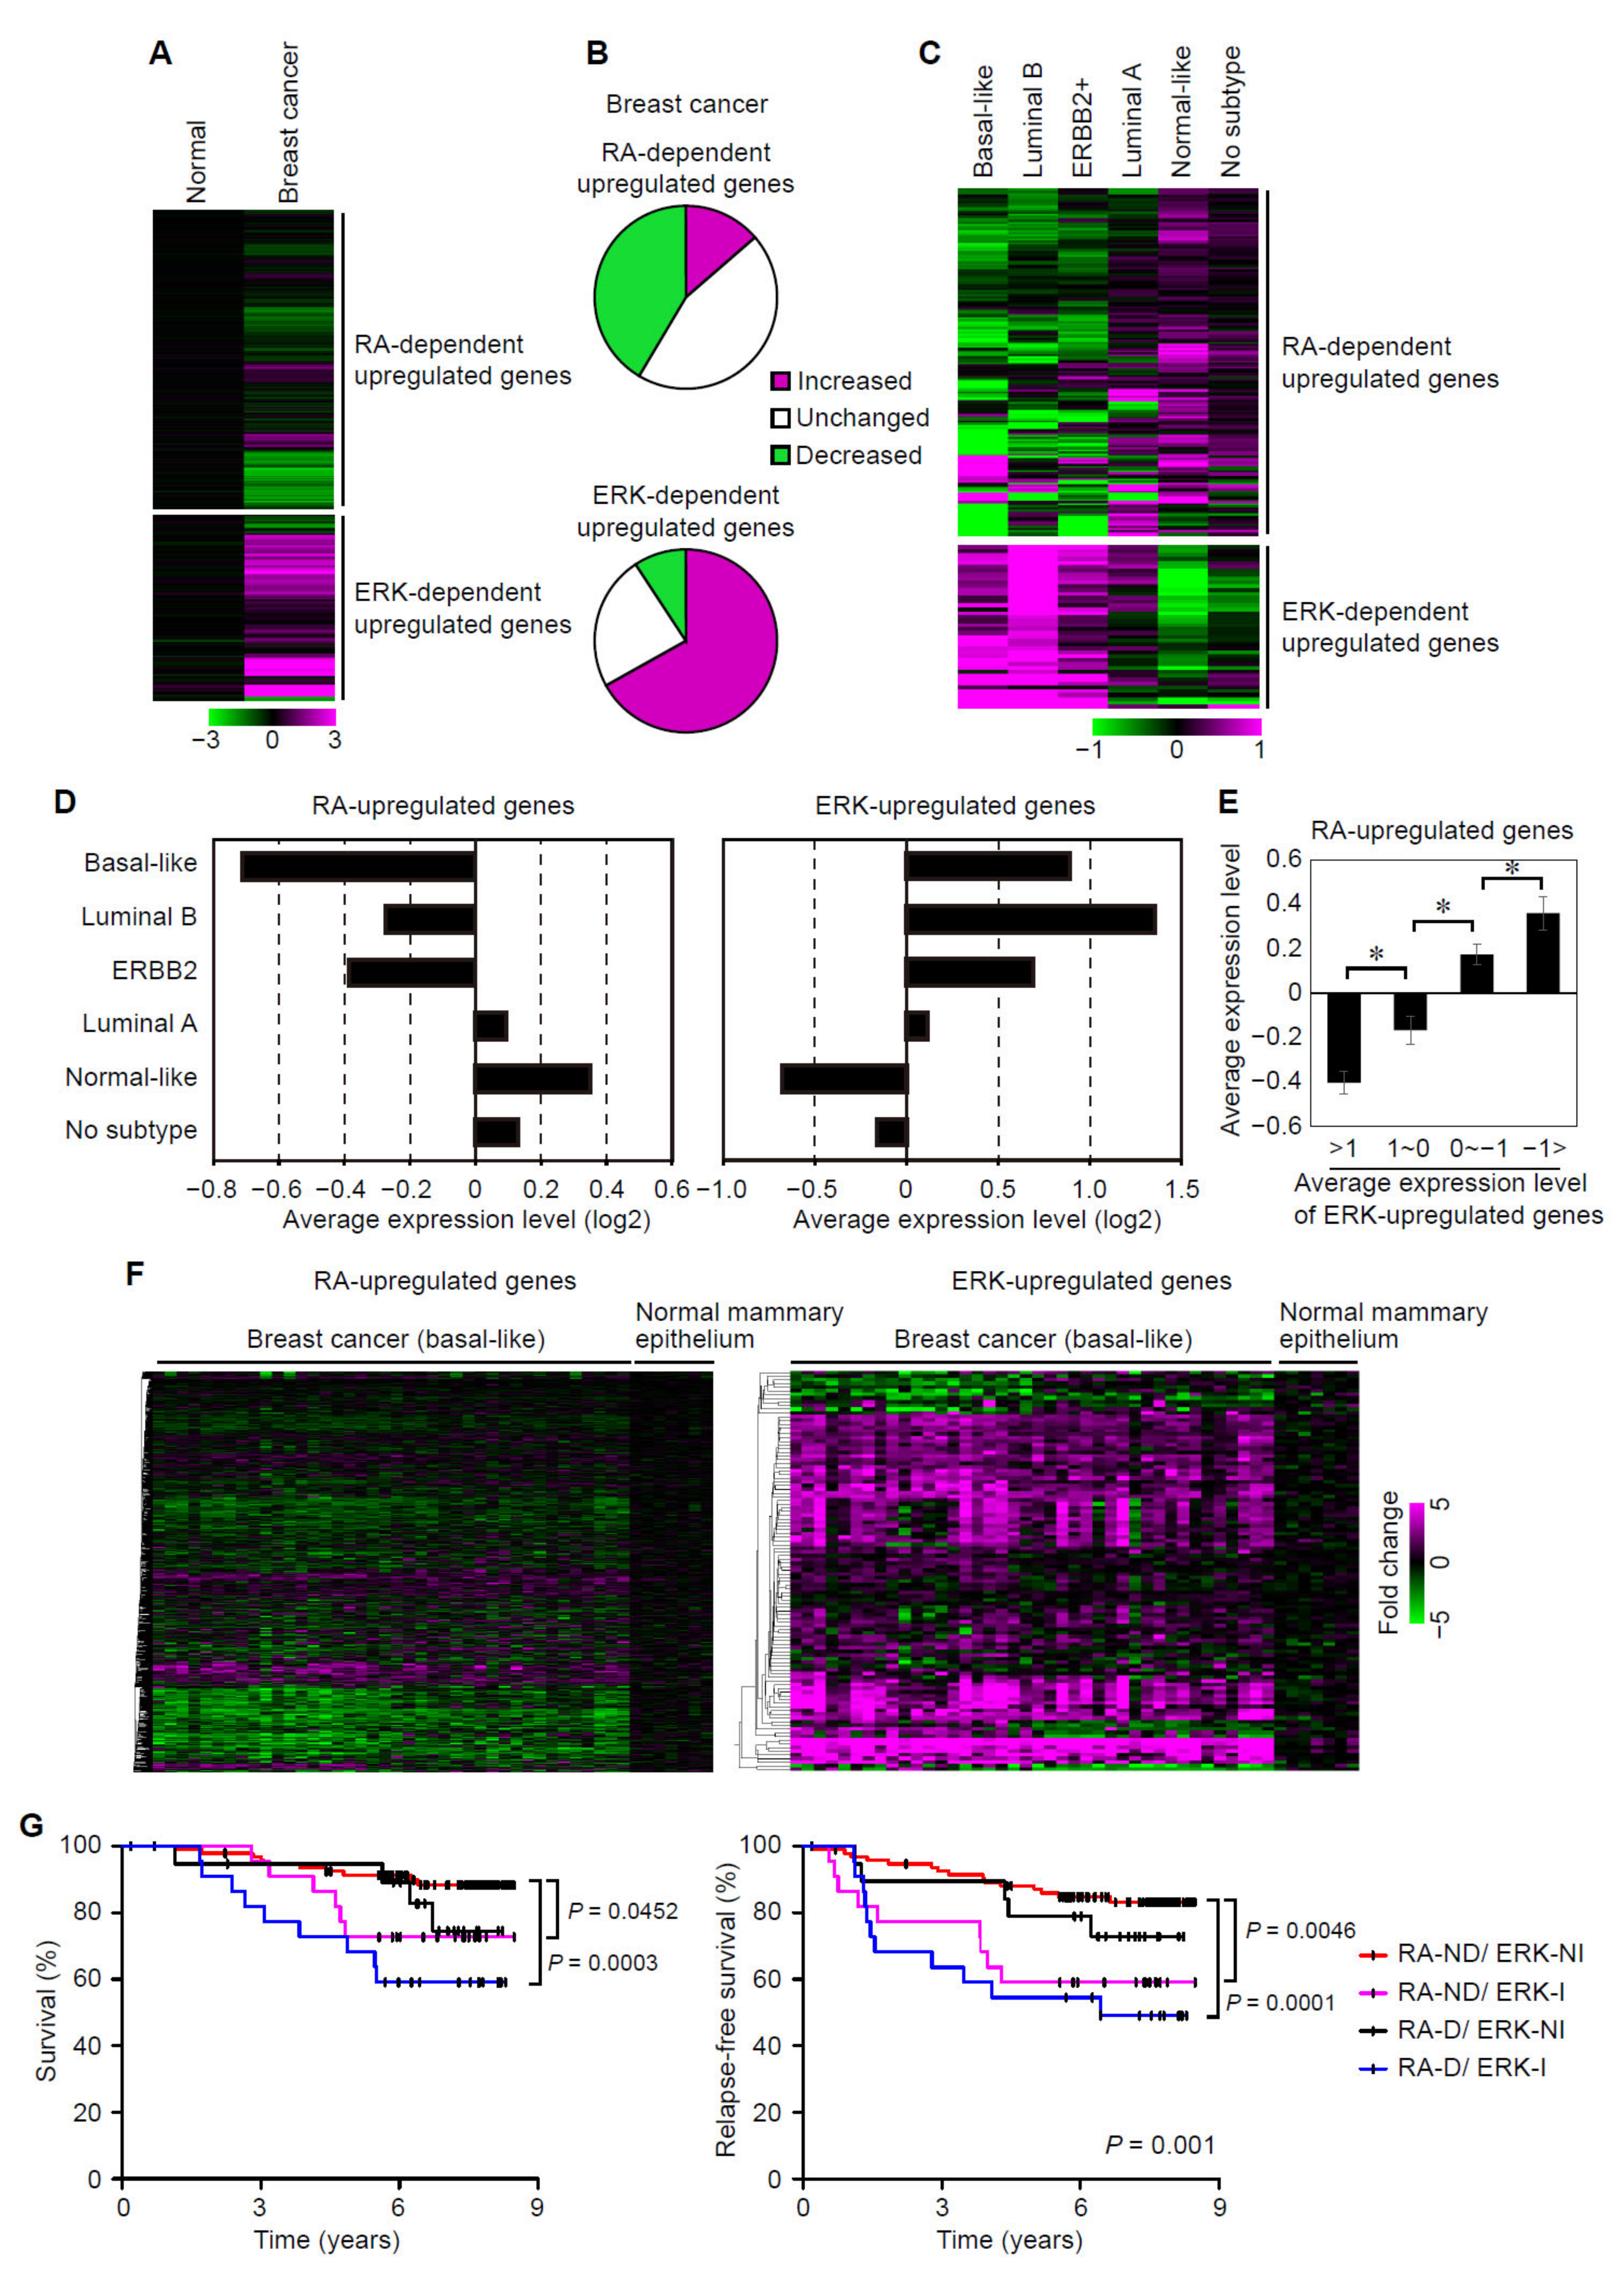
3.5. Suppression of RAR Signaling Coincides with Activation of ERK Signaling in Human Breast Cancers
3.6. Suppression of RAR Signaling and Activation of ERK Signaling Are Associated with Prognoses of Breast Cancer Patients
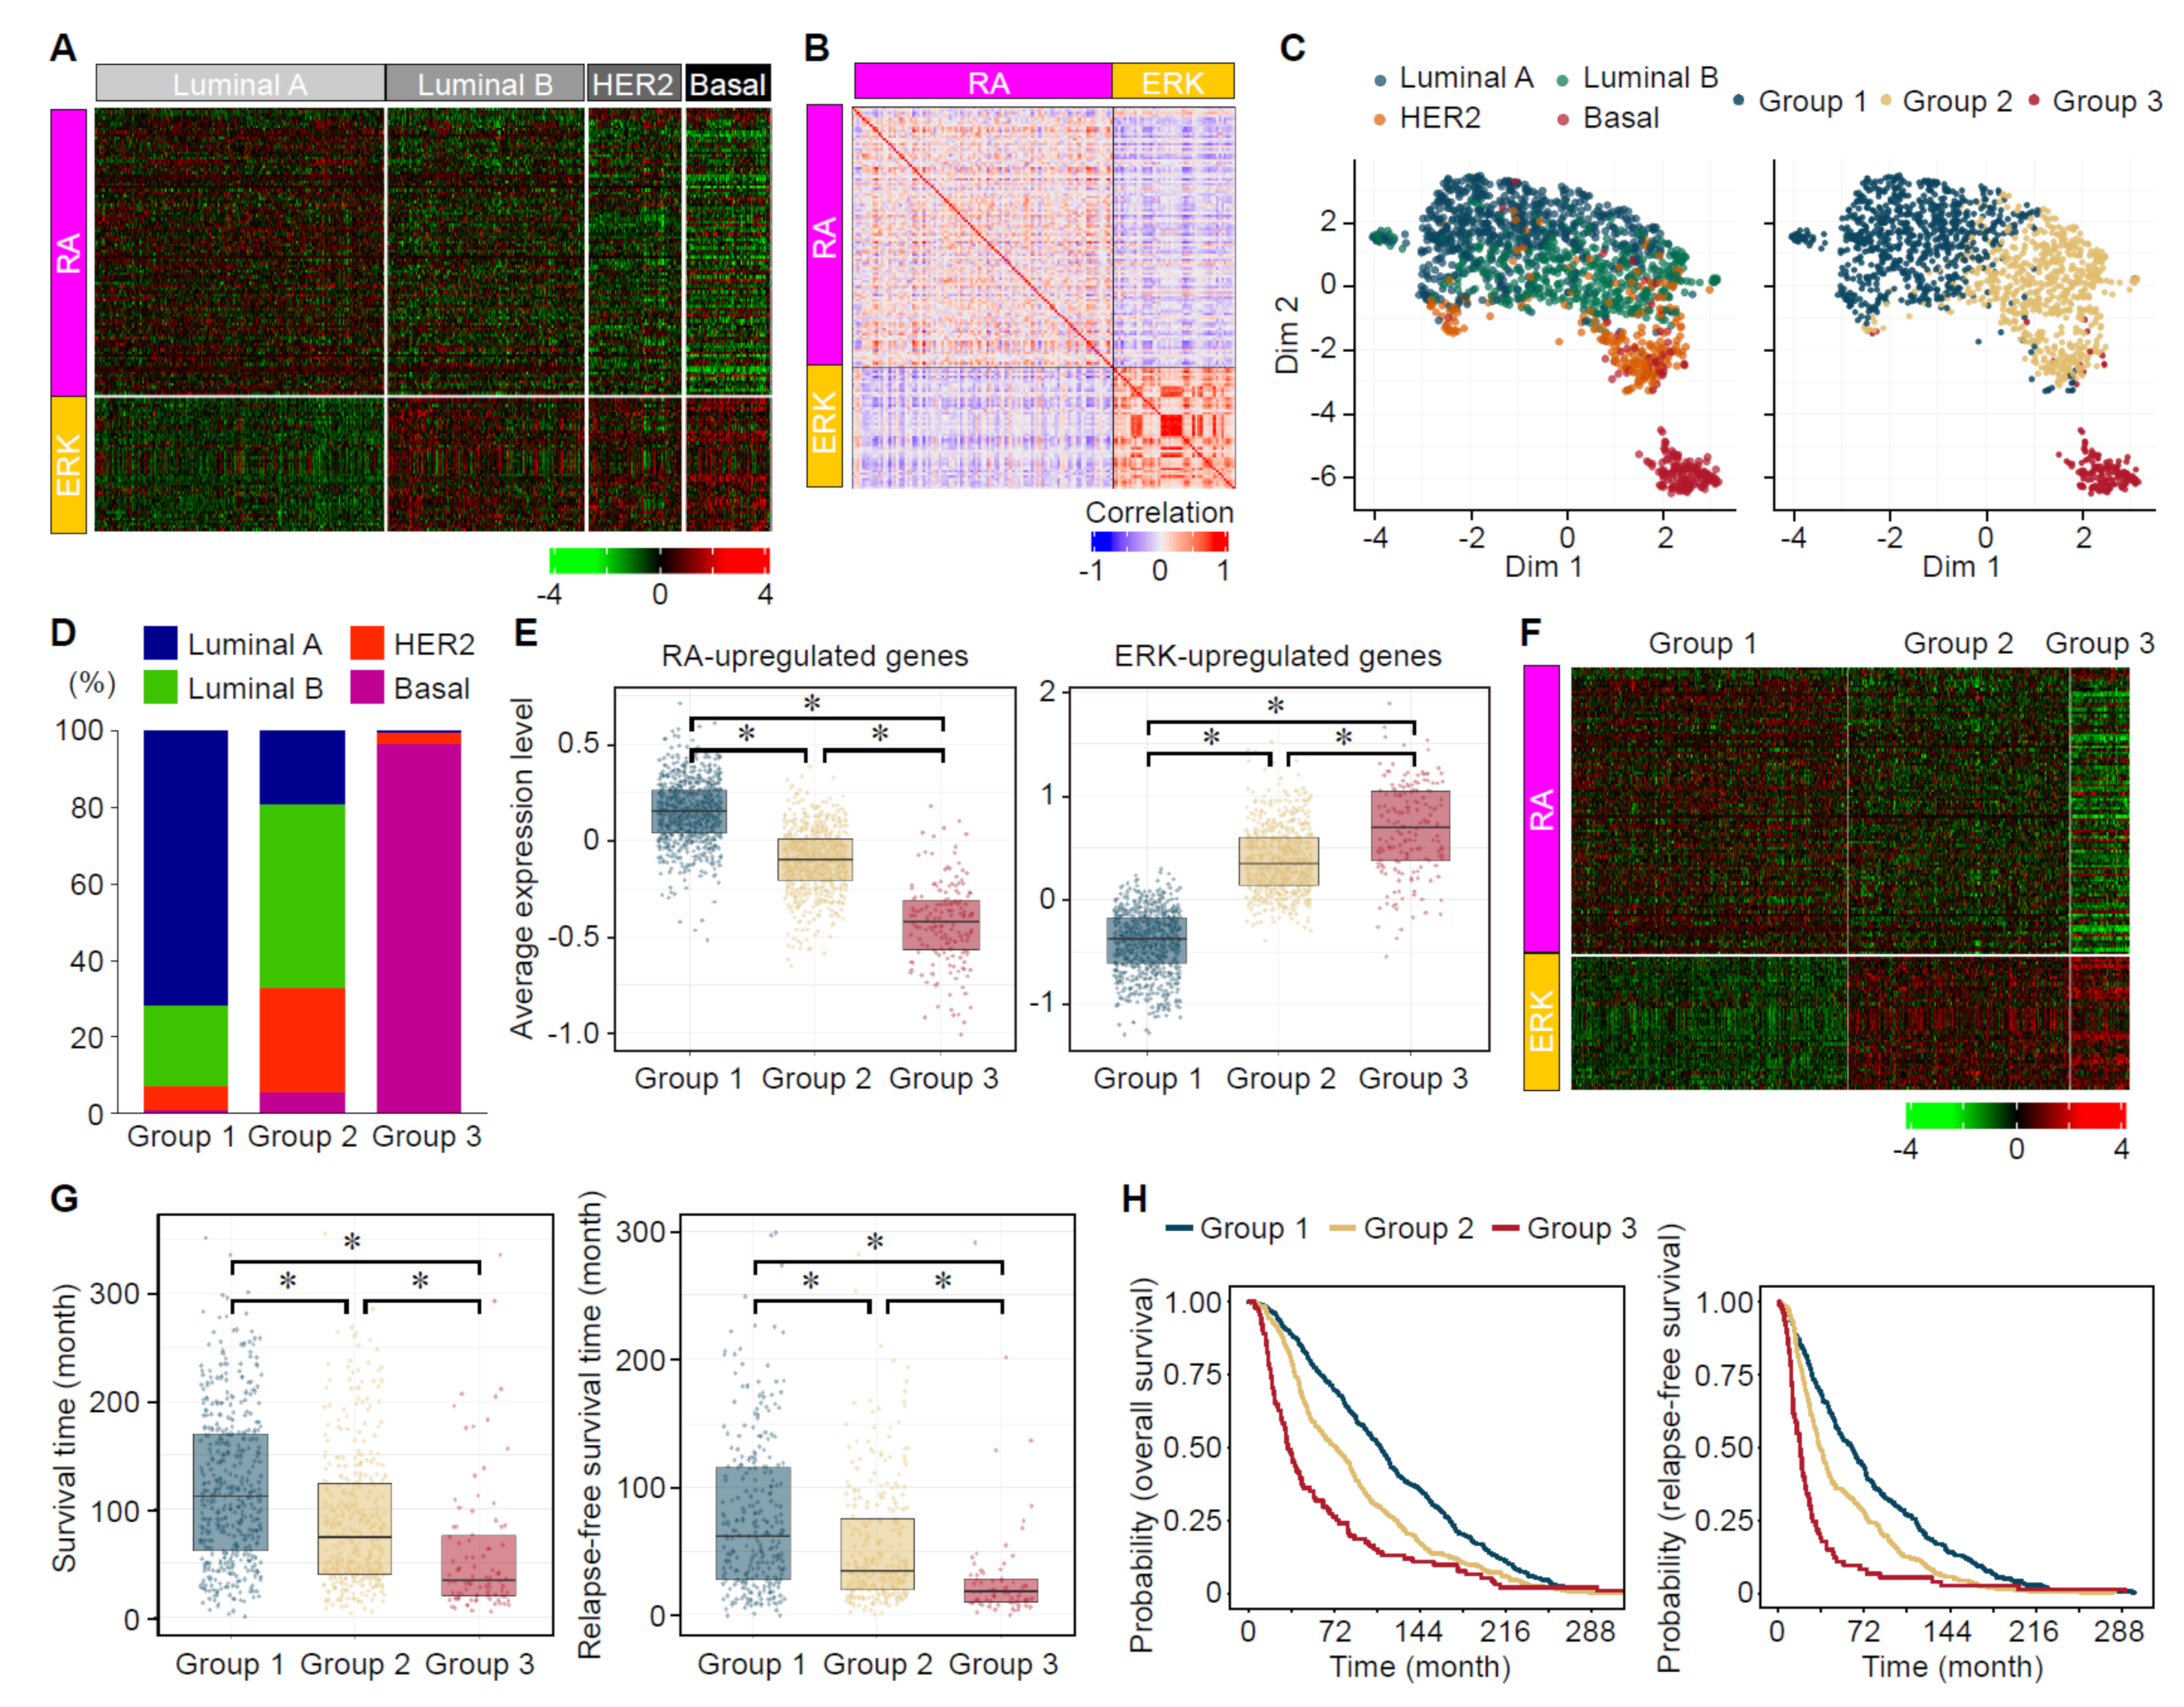
3.7. Analyses of the Expression Status of ERK- and RA-Upregulated Genes in Large-Scale Gene Expression Datasets of Human Breast Cancers
4. Discussion
5. Conclusions
Supplementary Materials
Author Contributions
Funding
Institutional Review Board Statement
Informed Consent Statement
Data Availability Statement
Conflicts of Interest
References
- Sung, H.; Ferlay, J.; Siegel, R.L.; Laversanne, M.; Soerjomataram, I.; Jemal, A.; Bray, F. Global cancer statistics 2020: GLOBOCAN es.timates of incidence and mortality worldwide for 36 cancers in 185 countries. CA Cancer J. Clin. 2021, 71, 209–249. [Google Scholar] [CrossRef] [PubMed]
- Sorlie, T.; Perou, C.M.; Tibshirani, R.; Aas, T.; Geisler, S.; Johnsen, H.; Hastie, T.; Eisen, M.B.; Van De Rijn, M.; Jeffrey, S.S.; et al. Gene expression patterns of breast carcinomas distinguish tumor subclasses with clinical implications. Proc. Natl. Acad. Sci. USA 2001, 98, 10869–10874. [Google Scholar] [CrossRef] [PubMed]
- Perou, C.M.; Sørlie, T.; Eisen, M.B.; Van De Rijn, M.; Jeffrey, S.S.; Rees, C.A.; Pollack, J.R.; Ross, D.T.; Johnsen, H.; Akslen, L.A.; et al. Molecular portraits of human breast tumours. Nature 2000, 406, 747–752. [Google Scholar] [CrossRef] [PubMed]
- Goldhirsch, A.; Wood, W.C.; Coates, A.S.; Gelber, R.D.; Thürlimann, B.; Senn, H.J. Strategies for subtypes—Dealing with the diversity of breast cancer: Highlights of the St. Gallen International Expert Consensus on the Primary Therapy of Early Breast Cancer 2011. Ann. Oncol. 2011, 22, 1736–1747. [Google Scholar] [CrossRef] [PubMed]
- Fan, M.; Chen, J.; Gao, J.; Xue, W.; Wang, Y.; Li, W.; Zhou, L.; Li, X.; Jiang, C.; Sun, Y.; et al. Triggering a switch from basal- to luminal-like breast cancer subtype by the small-molecule diptoindonesin G via induction of GABARAPL1. Cell Death Dis. 2020, 11, 635. [Google Scholar] [CrossRef]
- Mark, M.; Ghyselinck, N.B.; Chambon, P. Function of retinoid nuclear receptors: Lessons from genetic and pharmacological dissections of the retinoic acid signaling pathway during mouse embryogenesis. Annu. Rev. Pharmacol. Toxicol. 2006, 46, 451–480. [Google Scholar] [CrossRef]
- Bastien, J.; Rochette-Egly, C. Nuclear retinoid receptors and the transcription of retinoid-target genes. Gene 2004, 328, 1–16. [Google Scholar] [CrossRef]
- Kopf, E.; Plassat, J.L.; Vivat, V.; de The, H.; Chambon, P.; Rochette-Egly, C. Dimerization with retinoid X receptors and phosphorylation modulate the retinoic acid-induced degradation of retinoic acid receptors alpha and gamma through the ubiquitin-proteasome pathway. J. Biol. Chem. 2000, 275, 33280–33288. [Google Scholar] [CrossRef]
- Altucci, L.; Gronemeyer, H. The promise of retinoids to fight against cancer. Nat. Rev. Cancer 2001, 1, 181–193. [Google Scholar] [CrossRef]
- Freemantle, S.J.; Spinella, M.J.; Dmitrovsky, E. Retinoids in cancer therapy and chemoprevention: Promise meets resistance. Oncogene 2003, 22, 7305–7315. [Google Scholar] [CrossRef]
- Simeone, A.M.; Tari, A.M. How retinoids regulate breast cancer cell proliferation and apoptosis. Cell. Mol. Life Sci. 2004, 61, 1475–1484. [Google Scholar] [CrossRef]
- Shilkaitis, A.; Green, A.; Christov, K. Retinoids induce cellular senescence in breast cancer cells by RAR-β dependent and independent pathways: Potential clinical implications (Review). Int. J. Oncol. 2015, 47, 35–42. [Google Scholar] [CrossRef]
- Chen, H.; Zhang, H.; Lee, J.; Liang, X.; Wu, X.; Zhu, T.; Lo, P.-K.; Zhang, X.; Sukumar, S. HOXA5 Acts Directly Downstream of Retinoic Acid Receptor β and Contributes to Retinoic Acid–Induced Apoptosis and Growth Inhibition. Cancer Res. 2007, 67, 8007–8013. [Google Scholar] [CrossRef]
- Merino, V.F.; Nguyen, N.; Jin, K.; Sadik, H.; Cho, S.; Korangath, P.; Han, L.; Foster, Y.M.N.; Zhou, X.C.; Zhang, Z.; et al. Combined Treatment with Epigenetic, Differentiating, and Chemotherapeutic Agents Cooperatively Targets Tumor-Initiating Cells in Triple-Negative Breast Cancer. Cancer Res. 2016, 76, 2013–2024. [Google Scholar] [CrossRef]
- Garattini, E.; Bolis, M.; Garattini, S.K.; Fratelli, M.; Centritto, F.; Paroni, G.; Gianni’, M.; Zanetti, A.; Pagani, A.; Fisher, J.N.; et al. Retinoids and breast cancer: From basic studies to the clinic and back again. Cancer Treat. Rev. 2014, 40, 739–749. [Google Scholar] [CrossRef]
- Dobrotkova, V.; Chlapek, P.; Mazanek, P.; Sterba, J.; Veselska, R. Traffic lights for retinoids in oncology: Molecular markers of retinoid resistance and sensitivity and their use in the management of cancer differentiation therapy. BMC Cancer 2018, 18, 1059. [Google Scholar] [CrossRef]
- Imajo, M.; Kondoh, K.; Yamamoto, T.; Nakayama, K.; Nakajima-Koyama, M.; Nishida, E. Antagonistic Interactions between Extracellular Signal-Regulated Kinase Mitogen-Activated Protein Kinase and Retinoic Acid Receptor Signaling in Colorectal Cancer Cells. Mol. Cell. Biol. 2017, 37, e00012-17. [Google Scholar] [CrossRef]
- Imajo, M.; Tsuchiya, Y.; Nishida, E. Regulatory mechanisms and functions of MAP kinase signaling pathways. IUBMB Life 2006, 58, 312–317. [Google Scholar] [CrossRef]
- Samatar, A.A.; Poulikakos, P.I. Targeting RAS–ERK signalling in cancer: Promises and challenges. Nat. Rev. Drug Discov. 2014, 13, 928–942. [Google Scholar] [CrossRef]
- Davies, H.; Bignell, G.R.; Cox, C.; Stephens, P.; Edkins, S.; Clegg, S.; Teague, J.; Woffendin, H.; Garnett, M.J.; Bottomley, W.; et al. Mutations of the BRAF gene in human cancer. Nature 2002, 417, 949–954. [Google Scholar] [CrossRef]
- Rajagopalan, H.; Bardelli, A.; Lengauer, C.; Kinzler, K.W.; Vogelstein, B.; Velculescu, V.E. RAF/RAS oncogenes and mismatch-repair status. Nature 2002, 418, 934. [Google Scholar] [CrossRef] [PubMed]
- Fukuda, M.; Gotoh, I.; Adachi, M.; Gotoh, Y.; Nishida, E. A Novel Regulatory Mechanism in the Mitogen-activated Protein (MAP) Kinase Cascade. J. Biol. Chem. 1997, 272, 32642–32648. [Google Scholar] [CrossRef] [PubMed]
- Kim, D.; Langmead, B.; Salzberg, S.L. HISAT: A fast spliced aligner with low memory requirements. Nat. Methods 2015, 12, 357–360. [Google Scholar] [CrossRef] [PubMed]
- Langmead, B.; Salzberg, S.L. Fast gapped-read alignment with Bowtie 2. Nat. Methods 2012, 9, 357–359. [Google Scholar] [CrossRef] [PubMed]
- Love, M.I.; Huber, W.; Anders, S. Moderated estimation of fold change and dispersion for RNA-seq data with DESeq2. Genome Biol. 2014, 15, 550. [Google Scholar] [CrossRef]
- Subramanian, A.; Tamayo, P.; Mootha, V.K.; Mukherjee, S.; Ebert, B.L.; Gillette, M.A.; Paulovich, A.; Pomeroy, S.L.; Golub, T.R.; Lander, E.S.; et al. Gene set enrichment analysis: A knowledge-based approach for interpreting genome-wide expression profiles. Proc. Natl. Acad. Sci. USA 2005, 102, 15545–15550. [Google Scholar] [CrossRef]
- Curtis, C.; Shah, S.P.; Chin, S.F.; Turashvili, G.; Rueda, O.M.; Dunning, M.J.; Speed, D.; Lynch, A.G.; Samarajiwa, S.; Yuan, Y.; et al. The genomic and transcriptomic architecture of 2,000 breast tumours reveals novel subgroups. Nature 2012, 486, 346–352. [Google Scholar] [CrossRef]
- Pereira, B.; Chin, S.F.; Rueda, O.M.; Vollan, H.K.; Provenzano, E.; Bardwell, H.A.; Pugh, M.; Jones, L.; Russell, R.; Sammut, S.J.; et al. The somatic mutation profiles of 2,433 breast cancers refines their genomic and transcriptomic landscapes. Nat. Commun. 2016, 7, 11479. [Google Scholar] [CrossRef]
- Hua, S.; Kittler, R.; White, K.P. Genomic Antagonism between Retinoic Acid and Estrogen Signaling in Breast Cancer. Cell 2009, 137, 1259–1271. [Google Scholar] [CrossRef]
- Hennig, C. Cluster-wise assessment of cluster stability. Comput. Stat. Data Anal. 2007, 52, 258–271. [Google Scholar] [CrossRef]
- Hennig, C. Dissolution point and isolation robustness: Robustness criteria for general cluster analysis methods. J. Multivar. 2008, 99, 1154–1176. [Google Scholar] [CrossRef]
- Ye, X.; Chan, K.C.; Waters, A.M.; Bess, M.; Harned, A.; Wei, B.R.; Loncarek, J.; Luke, B.T.; Orsburn, B.C.; Hollinger, B.D.; et al. Comparative proteomics of a model MCF10A-KRasG12V cell line reveals a distinct molecular signature of the KRasG12V cell surface. Oncotarget 2016, 7, 86948–86971. [Google Scholar] [CrossRef]
- Hollestelle, A.; Elstrodt, F.; Nagel, J.H.; Kallemeijn, W.W.; Schutte, M. Phosphatidylinositol-3-OH kinase or RAS pathway mutations in human breast cancer cell lines. Mol. Cancer Res. 2007, 5, 195–201. [Google Scholar] [CrossRef]
- De The, H.; Del Mar Vivanco-Ruiz, M.; Tiollais, P.; Stunnenberg, H.; Dejean, A. Identification of a retinoic acid responsive element in the retinoic acid receptor & beta;gene. Nature 1990, 343, 177–180. [Google Scholar] [CrossRef]
- Bonnet, D.; Dick, J.E. Human acute myeloid leukemia is organized as a hierarchy that originates from a primitive hematopoietic cell. Nat. Med. 1997, 3, 730–737. [Google Scholar] [CrossRef]
- Singh, S.K.; Clarke, I.D.; Terasaki, M.; Bonn, V.E.; Hawkins, C.; Squire, J.; Dirks, P.B. Identification of a cancer stem cell in human brain tumors. Cancer Res. 2003, 63, 5821–5828. [Google Scholar]
- Richardson, G.D. CD133, a novel marker for human prostatic epithelial stem cells. J. Cell Sci. 2004, 117, 3539–3545. [Google Scholar] [CrossRef]
- Ricci-Vitiani, L.; Lombardi, D.G.; Pilozzi, E.; Biffoni, M.; Todaro, M.; Peschle, C.; De Maria, R. Identification and expansion of human colon-cancer-initiating cells. Nature 2007, 445, 111–115. [Google Scholar] [CrossRef]
- Al-Hajj, M.; Wicha, M.S.; Benito-Hernandez, A.; Morrison, S.J.; Clarke, M.F. Prospective identification of tumorigenic breast cancer cells. Proc. Natl. Acad. Sci. USA 2003, 100, 3983–3988. [Google Scholar] [CrossRef]
- Dean, M.; Fojo, T.; Bates, S. Tumour stem cells and drug resistance. Nat. Rev. Cancer 2005, 5, 275–284. [Google Scholar] [CrossRef]
- Zhou, H.-M.; Zhang, J.-G.; Zhang, X.; Li, Q. Targeting cancer stem cells for reversing therapy resistance: Mechanism, signaling, and prospective agents. Signal Transduct. Target. Ther. 2021, 6, 62. [Google Scholar] [CrossRef] [PubMed]
- Dontu, G. In vitro propagation and transcriptional profiling of human mammary stem/progenitor cells. Genes Dev. 2003, 17, 1253–1270. [Google Scholar] [CrossRef] [PubMed]
- Ponti, D.; Costa, A.; Zaffaroni, N.; Pratesi, G.; Petrangolini, G.; Coradini, D.; Pilotti, S.; Pierotti, M.A.; Daidone, M.G. Isolation and In vitro Propagation of Tumorigenic Breast Cancer Cells with Stem/Progenitor Cell Properties. Cancer Res. 2005, 65, 5506–5511. [Google Scholar] [CrossRef] [PubMed]
- Suzuka, J.; Tsuda, M.; Wang, L.; Kohsaka, S.; Kishida, K.; Semba, S.; Sugino, H.; Aburatani, S.; Frauenlob, M.; Kurokawa, T.; et al. Rapid reprogramming of tumour cells into cancer stem cells on double-network hydrogels. Nat. Biomed. Eng. 2021, 5, 914–925. [Google Scholar] [CrossRef] [PubMed]
- Filardo, E.J.; Quinn, J.A.; Bland, K.I.; Frackelton, A.R. Estrogen-Induced Activation of Erk-1 and Erk-2 Requires the G Protein-Coupled Receptor Homolog, GPR30, and Occurs via Trans-Activation of the Epidermal Growth Factor Receptor through Release of HB-EGF. Mol. Endocrinol. 2000, 14, 1649–1660. [Google Scholar] [CrossRef]
- Hoeflich, K.P.; O’Brien, C.; Boyd, Z.; Cavet, G.; Guerrero, S.; Jung, K.; Januario, T.; Savage, H.; Punnoose, E.; Truong, T.; et al. In vivo Antitumor Activity of MEK and Phosphatidylinositol 3-Kinase Inhibitors in Basal-Like Breast Cancer Models. Clin. Cancer Res. 2009, 15, 4649–4664. [Google Scholar] [CrossRef]
- Richardson, A.L.; Wang, Z.C.; De Nicolo, A.; Lu, X.; Brown, M.; Miron, A.; Liao, X.; Iglehart, J.D.; Livingston, D.M.; Ganesan, S. X chromosomal abnormalities in basal-like human breast cancer. Cancer Cell 2006, 9, 121–132. [Google Scholar] [CrossRef]
- Hu, Z.; Fan, C.; Oh, D.S.; Marron, J.; He, X.; Qaqish, B.F.; Livasy, C.; Carey, L.A.; Reynolds, E.; Dressler, L.; et al. The molecular portraits of breast tumors are conserved across microarray platforms. BMC Genom. 2006, 7, 96. [Google Scholar] [CrossRef]
- Pawitan, Y.; Bjöhle, J.; Amler, L.; Borg, A.-L.; Egyhazi, S.; Hall, P.; Han, X.; Holmberg, L.; Huang, F.; Klaar, S.; et al. Gene expression profiling spares early breast cancer patients from adjuvant therapy: Derived and validated in two population-based cohorts. Breast Cancer Res. 2005, 7, R953. [Google Scholar] [CrossRef]
- Mansouri, S.; Farahmand, L.; Hosseinzade, A.; Eslami, S.Z.; Majidzadeh, A.K. Estrogen can restore Tamoxifen sensitivity in breast cancer cells amidst the complex network of resistance. Biomed. Pharmacother. 2017, 93, 1320–1325. [Google Scholar] [CrossRef]
- Kohno, M.; Pouyssegur, J. Targeting the ERK signaling pathway in cancer therapy. Ann. Med. 2006, 38, 200–211. [Google Scholar] [CrossRef]
- You, K.S.; Yi, Y.W.; Cho, J.; Seong, Y.S. Dual Inhibition of AKT and MEK Pathways Potentiates the Anti-Cancer Effect of Gefitinib in Triple-Negative Breast Cancer Cells. Cancers 2021, 13, 1205. [Google Scholar] [CrossRef]
- McCormick, D.L.; Moon, R.C. Retinoid-tamoxifen interaction in mammary cancer chemoprevention. Carcinogenesis 1986, 7, 193–196. [Google Scholar] [CrossRef]
- Kronblad, A.; Hedenfalk, I.; Nilsson, E.; Pahlman, S.; Landberg, G. ERK1/2 inhibition increases antiestrogen treatment efficacy by interfering with hypoxia-induced downregulation of ERalpha: A combination therapy potentially targeting hypoxic and dormant tumor cells. Oncogene 2005, 24, 6835–6841. [Google Scholar] [CrossRef]


Publisher’s Note: MDPI stays neutral with regard to jurisdictional claims in published maps and institutional affiliations. |
© 2022 by the authors. Licensee MDPI, Basel, Switzerland. This article is an open access article distributed under the terms and conditions of the Creative Commons Attribution (CC BY) license (https://creativecommons.org/licenses/by/4.0/).
Share and Cite
Hirota, A.; Clément, J.-E.; Tanikawa, S.; Nonoyama, T.; Komatsuzaki, T.; Gong, J.P.; Tanaka, S.; Imajo, M. ERK MAP Kinase Signaling Regulates RAR Signaling to Confer Retinoid Resistance on Breast Cancer Cells. Cancers 2022, 14, 5890. https://doi.org/10.3390/cancers14235890
Hirota A, Clément J-E, Tanikawa S, Nonoyama T, Komatsuzaki T, Gong JP, Tanaka S, Imajo M. ERK MAP Kinase Signaling Regulates RAR Signaling to Confer Retinoid Resistance on Breast Cancer Cells. Cancers. 2022; 14(23):5890. https://doi.org/10.3390/cancers14235890
Chicago/Turabian StyleHirota, Akira, Jean-Emmanuel Clément, Satoshi Tanikawa, Takayuki Nonoyama, Tamiki Komatsuzaki, Jian Ping Gong, Shinya Tanaka, and Masamichi Imajo. 2022. "ERK MAP Kinase Signaling Regulates RAR Signaling to Confer Retinoid Resistance on Breast Cancer Cells" Cancers 14, no. 23: 5890. https://doi.org/10.3390/cancers14235890
APA StyleHirota, A., Clément, J.-E., Tanikawa, S., Nonoyama, T., Komatsuzaki, T., Gong, J. P., Tanaka, S., & Imajo, M. (2022). ERK MAP Kinase Signaling Regulates RAR Signaling to Confer Retinoid Resistance on Breast Cancer Cells. Cancers, 14(23), 5890. https://doi.org/10.3390/cancers14235890