Simple Summary
Pembrolizumab, an immune checkpoint inhibitor, has shown therapeutic benefit for advanced urothelial carcinoma (aUC) patients, but only a limited population achieves a long-term response. Prediction of treatment outcomes for aUC patients receiving immune checkpoint inhibitors is a clinical challenge. We assessed the associations between the expression of multiple immune markers in the tumor microenvironment using immunohistochemistry of tumor tissues obtained from 26 aUC patients who received second-line pembrolizumab treatment. We found that high infiltration of CD8-positive lymphocytes was significantly associated with a favorable objective response and overall and progression-free survival. Furthermore, expression of interferon-gamma (IFNγ) showed a significant positive correlation with post-progression survival. Finally, we demonstrated that the coincidence of low infiltration of CD8-positive lymphocytes and low IFNγ expression was an independent prognostic factor for an unfavorable response to pembrolizumab.
Abstract
Although immune checkpoint inhibitors have shown benefit for advanced urothelial carcinoma (aUC) patients, prognostication of treatment efficacy and response duration remains a clinical challenge. We evaluated the expression of immune markers in the tumor microenvironment and assessed their associations with response to and survival after pembrolizumab treatment in 26 aUC patients. High levels of CD8+ tumor-infiltrating lymphocytes (TILs) were associated with favorable objective responses (23.0% vs. 15.3%, p = 0.0425), progression-free survival (median, 8.8 vs 2.1 months; hazard ratio (HR), 0.24; 95% confidence interval (CI), 0.07–0.66, p = 0.0060), and overall survival (median, >24.0 vs. 5.3 months; HR, 0.17; 95% CI, 0.04–0.56, p = 0.0034) compared with low levels. High interferon-gamma (IFNγ) expression levels were associated with longer post-progression survival (median, 4.9 vs. 1.0 months; HR, 0.18; 95% CI, 0.04–0.59, p = 0.0027) compared with low expression. Multivariate analysis incorporating clinical prognosticators demonstrated that the coincidence of low CD8+ T cells/IFNγ was an independent factor for unfavorable overall survival after pembrolizumab treatment (HR, 4.07; 95% CI, 1.36–12.73; p = 0.0125). The combination of low CD8+ TILs and IFNγ expression was an independent prognostic factor with predictive ability equivalent to previously reported clinical prognosticators.
1. Introduction
Advanced urothelial carcinoma (aUC) that is locally advanced, unresectable, or metastatic has a poor prognosis [1]. Cisplatin-based chemotherapy has been used mainly as the first-line therapy for aUC over the past several decades with an overall survival (OS) rate of 9–15 months. However, in aUC patients with resistance to platinum therapy, the median OS is only 5–7 months [2,3]. In addition, approximately 50% of aUC patients are ineligible for cisplatin therapy [4], and there are few treatment options for chemo-resistant or cisplatin-ineligible aUC patients.
Over the last several years, results of multiple clinical trials have led the U.S. Food and Drug Administration to approve five immune checkpoint inhibitors (ICIs) for aUC [5,6,7]. The appearance of novel immunotherapies has changed the treatment landscape substantially for aUC. However, the population who can benefit from a prolonged OS after ICI treatment is limited. For example, in the phase 3 KEYNOTE-045 trial using second-line pembrolizumab, the >2-year follow-up period showed an OS of 44.2% and an objective response rate of 21.2% at 24 months [8,9]. Furthermore, pembrolizumab treatment resulted in serious adverse events in 12% of patients, such as colitis, pneumonitis, and interstitial lung disease. Additionally, 6.8% of patients receiving pembrolizumab discontinued the study treatment because of these treatment-related adverse events. Thus, there is an urgent unmet need to develop methods for predicting the treatment efficacy and safety of ICIs for aUC patients.
One of the most frequently reported potential biomarkers in tumor tissues is programmed cell death-ligand 1 (PD-L1). Multiple studies have investigated the role of PD-L1 protein expression as a predictive marker for the efficacy of ICIs [7]. These previous studies were consistent in reporting an association between high expression of PD-L1 and a favorable response to ICIs. However, the protocols for staining, evaluation, and reporting PD-L1 expression have not been standardized, and highly diverse protocols, antibodies, and cutoff values have been reported. Additionally, concerns have arisen regarding the predictive ability of PD-L1 expression for ICI treatment responses [9]. Indeed, the clinical use of PD-L1 tumor expression as a companion diagnostic marker for efficacy of ICIs is limited for first-line ICI application in cisplatin-ineligible patients [5,6].
Tumor-infiltrating lymphocytes (TILs), particularly CD8+ T cells, are considered to be key effectors of the anti-tumor immune activities of ICIs. Several studies have reported a correlation between tumor-infiltrating CD8+ T cells and a favorable response to ICIs [10,11]. CD8+ T cells within the tumor microenvironment (TME) interact with various other immune cells, including helper T cells, regulatory T cells, dendritic cells, and macrophages [12].
Recently, interferon-gamma (IFNγ) has attracted increasing attention as a key factor that modulates the TME [13]. IFNγ was first identified as a cytokine that evoked an immune response to viral infection [14] and played an important role in cancer immunity. IFNγ contributes to recruitment of T lymphocytes, activates TILs by promoting dendritic cell-mediated antigen presentation, and directly induces apoptosis of cancer cells [15,16,17]. Several studies have reported that treatment with ICIs increased the production of IFNγ in the TME, which enhanced tumor regression [18,19]. Another study reported that defects in IFNγ signaling conferred ICI resistance [20]. These findings imply that the anti-tumor effect of ICIs may be mediated by IFNγ secretion in the TME. However, the clinical significance of IFNγ expression in the TME and its use as a predictive biomarker for ICI treatment response in aUC patients have not been well described. In this study, we evaluated multiple immune markers in the TME, including CD8+ T cells and IFNγ, and determined correlations between expression levels and treatment outcomes in aUC patients who received second-line pembrolizumab.
2. Materials and Methods
2.1. Cases and Specimens
We included 26 urothelial carcinoma patients with metastatic or unresectable tumors who had progressed after platinum-based chemotherapy and received subsequent pembrolizumab treatment from 2018 to 2020 at Kyoto University Hospital. The study was approved by the Institutional Review Board at Kyoto University Graduate School of Medicine (#G0052-17). Disease stage was determined according to the staging system from the 8th Union for International Cancer Control. Treatment effects were assessed according to the Response Evaluation Criteria in Solid Tumors (RECIST), ver. 1.1. Treatment effects were determined clinically in some cases where the RECIST criteria could not be applied.
2.2. Immunohistochemical (IHC) Staining
Formalin-fixed, paraffin-embedded histological sections were prepared from primary tumors obtained by transurethral resection of the bladder, total cystectomy, or nephroureterectomy. These surgeries were performed prior to systemic therapy from 2014 to 2020 at Kyoto University Hospital. IHC staining was performed as described previously [21]. Briefly, after deparaffinization and antigen retrieval, endogenous peroxidase activity was quenched using 0.3% H2O2 in methyl alcohol for 30 min. The glass slides were washed six times in phosphate-buffered saline (PBS) and blocked with 1% normal serum in PBS for 30 min. Subsequently, primary antibodies were applied overnight at 4 °C. The slides were then incubated for 40 min with biotinylated secondary antibody diluted at 1:300 in PBS. Avidin–biotin–peroxidase complex (ABC-Elite, Vector Laboratories) diluted at 1:100 in bovine serum albumin was applied for 50 min. After washing in PBS, the color reaction was initiated with 3,3′-diaminobenzidine tetrahydrochloride, and the nuclei were counterstained with hematoxylin.
CD8, CD4, and IFNγ were stained to confirm the immune response of the host patient in the primary tumor, and PD-L1 and TIGIT were selected to confirm the expression status of immune checkpoint molecules in the tumor microenvironment. The primary antibodies were as follows: anti-CD8 (M7103; DAKO; Carpenteria, CA, USA; 1:100), anti-CD4 (NCL-CD4-1F6; Leica Biosystems; Wetzlar, Germany; 1:100), anti-PD-L1 (ab228462; Abcam; Cambridge, UK; 1:100), anti-T cell immunoreceptor with Ig and ITIM domains (TIGIT) (ab243903; Abcam, 1:100), and anti-IFNγ (ab9657; Abcam, 1:400). Stained slides were reviewed and scored by two independent investigators under the supervision of a pathologist. To quantify antibody-positive cells, the numbers of stained cells were counted using three high-power fields per slide (×400 magnification).
Our quantitative evaluation protocol was as follows: CD8+, CD4+, and TIGIT+ TIL densities were defined as the percentage of the total number of immune-shaped cells present within the tumor. A density of CD8+ and CD4+ TILs at <20% was considered to be low, whereas ≥20% was considered high infiltration, as previously reported [22]. For TIGIT+ TILs, a density < the median was considered low infiltration, and a density ≥ the median was considered a high infiltrate.
The level of expression of PD-L1 in tumor cells (TC) and infiltrating immune cells (IC) was stratified to four groups based on the scores of 0, 1, 2, and 3, which were defined as previously described—score 0 ≤ 1%, 1% < score 1 ≤ 5%, 5% < score 2 ≤ 30%, and 30% < score 3 [23]. We divided the TCs and ICs into two groups each—a low expression group with a score of 0 or 1 and a high expression group with a score of 2 or 3.
IFNγ expression in the tumor tissue was evaluated based on a combination of both the percentage and intensity of positively stained cells to generate H-scores according to a previous report [24]. A total score consisted of 3× the percentage of strongly stained cells, 2× the percentage of moderately stained cells, and 1× the percentage of weakly stained cells in the TME. A final score had a range of 0 to 300 [25]. Subsequently, an H-score < the median was low expression and an H-score ≥ the median was considered to be high expression.
2.3. Statistical Analysis
Associations between categorical variables were assessed with Fisher’s exact test. Spearman’s rank correlation coefficients were used to test associations between IFNγ expression and the other immunological biomarkers. OS was defined as the interval from the date of the initiation of pembrolizumab treatment to death or last contact. Progression-free survival (PFS) was defined as the interval from the date of the initiation of pembrolizumab to the date of disease progression. Post-progression survival (PPS) was defined as the interval from the date of disease progression during or after pembrolizumab treatment to death or last contact. Survival was analyzed using the Kaplan–Meier method and Cox regression analysis. The correlations among OS, PFS, and PPS were assessed by Spearman’s rank correlation coefficients and linear regression analyses without censored cases as described previously [26]. The correlations for survival were also tested using data from 450 metastatic urothelial carcinoma cases treated with pembrolizumab in another study cohort [27]. Some parameters that had clinical importance for immunotherapy at the time of pembrolizumab treatment were evaluated by multivariate tests to compare the predictive capacity of candidate immune biomarkers found in this study [27,28]. All statistical analyses were performed using JMP® Pro 14.0.0 (SAS Institute; Cary, NC, USA) and R PredictABEL package, R version 4.1.2. p values < 0.05 were considered statistically significant.
3. Results
3.1. Baseline Characteristics
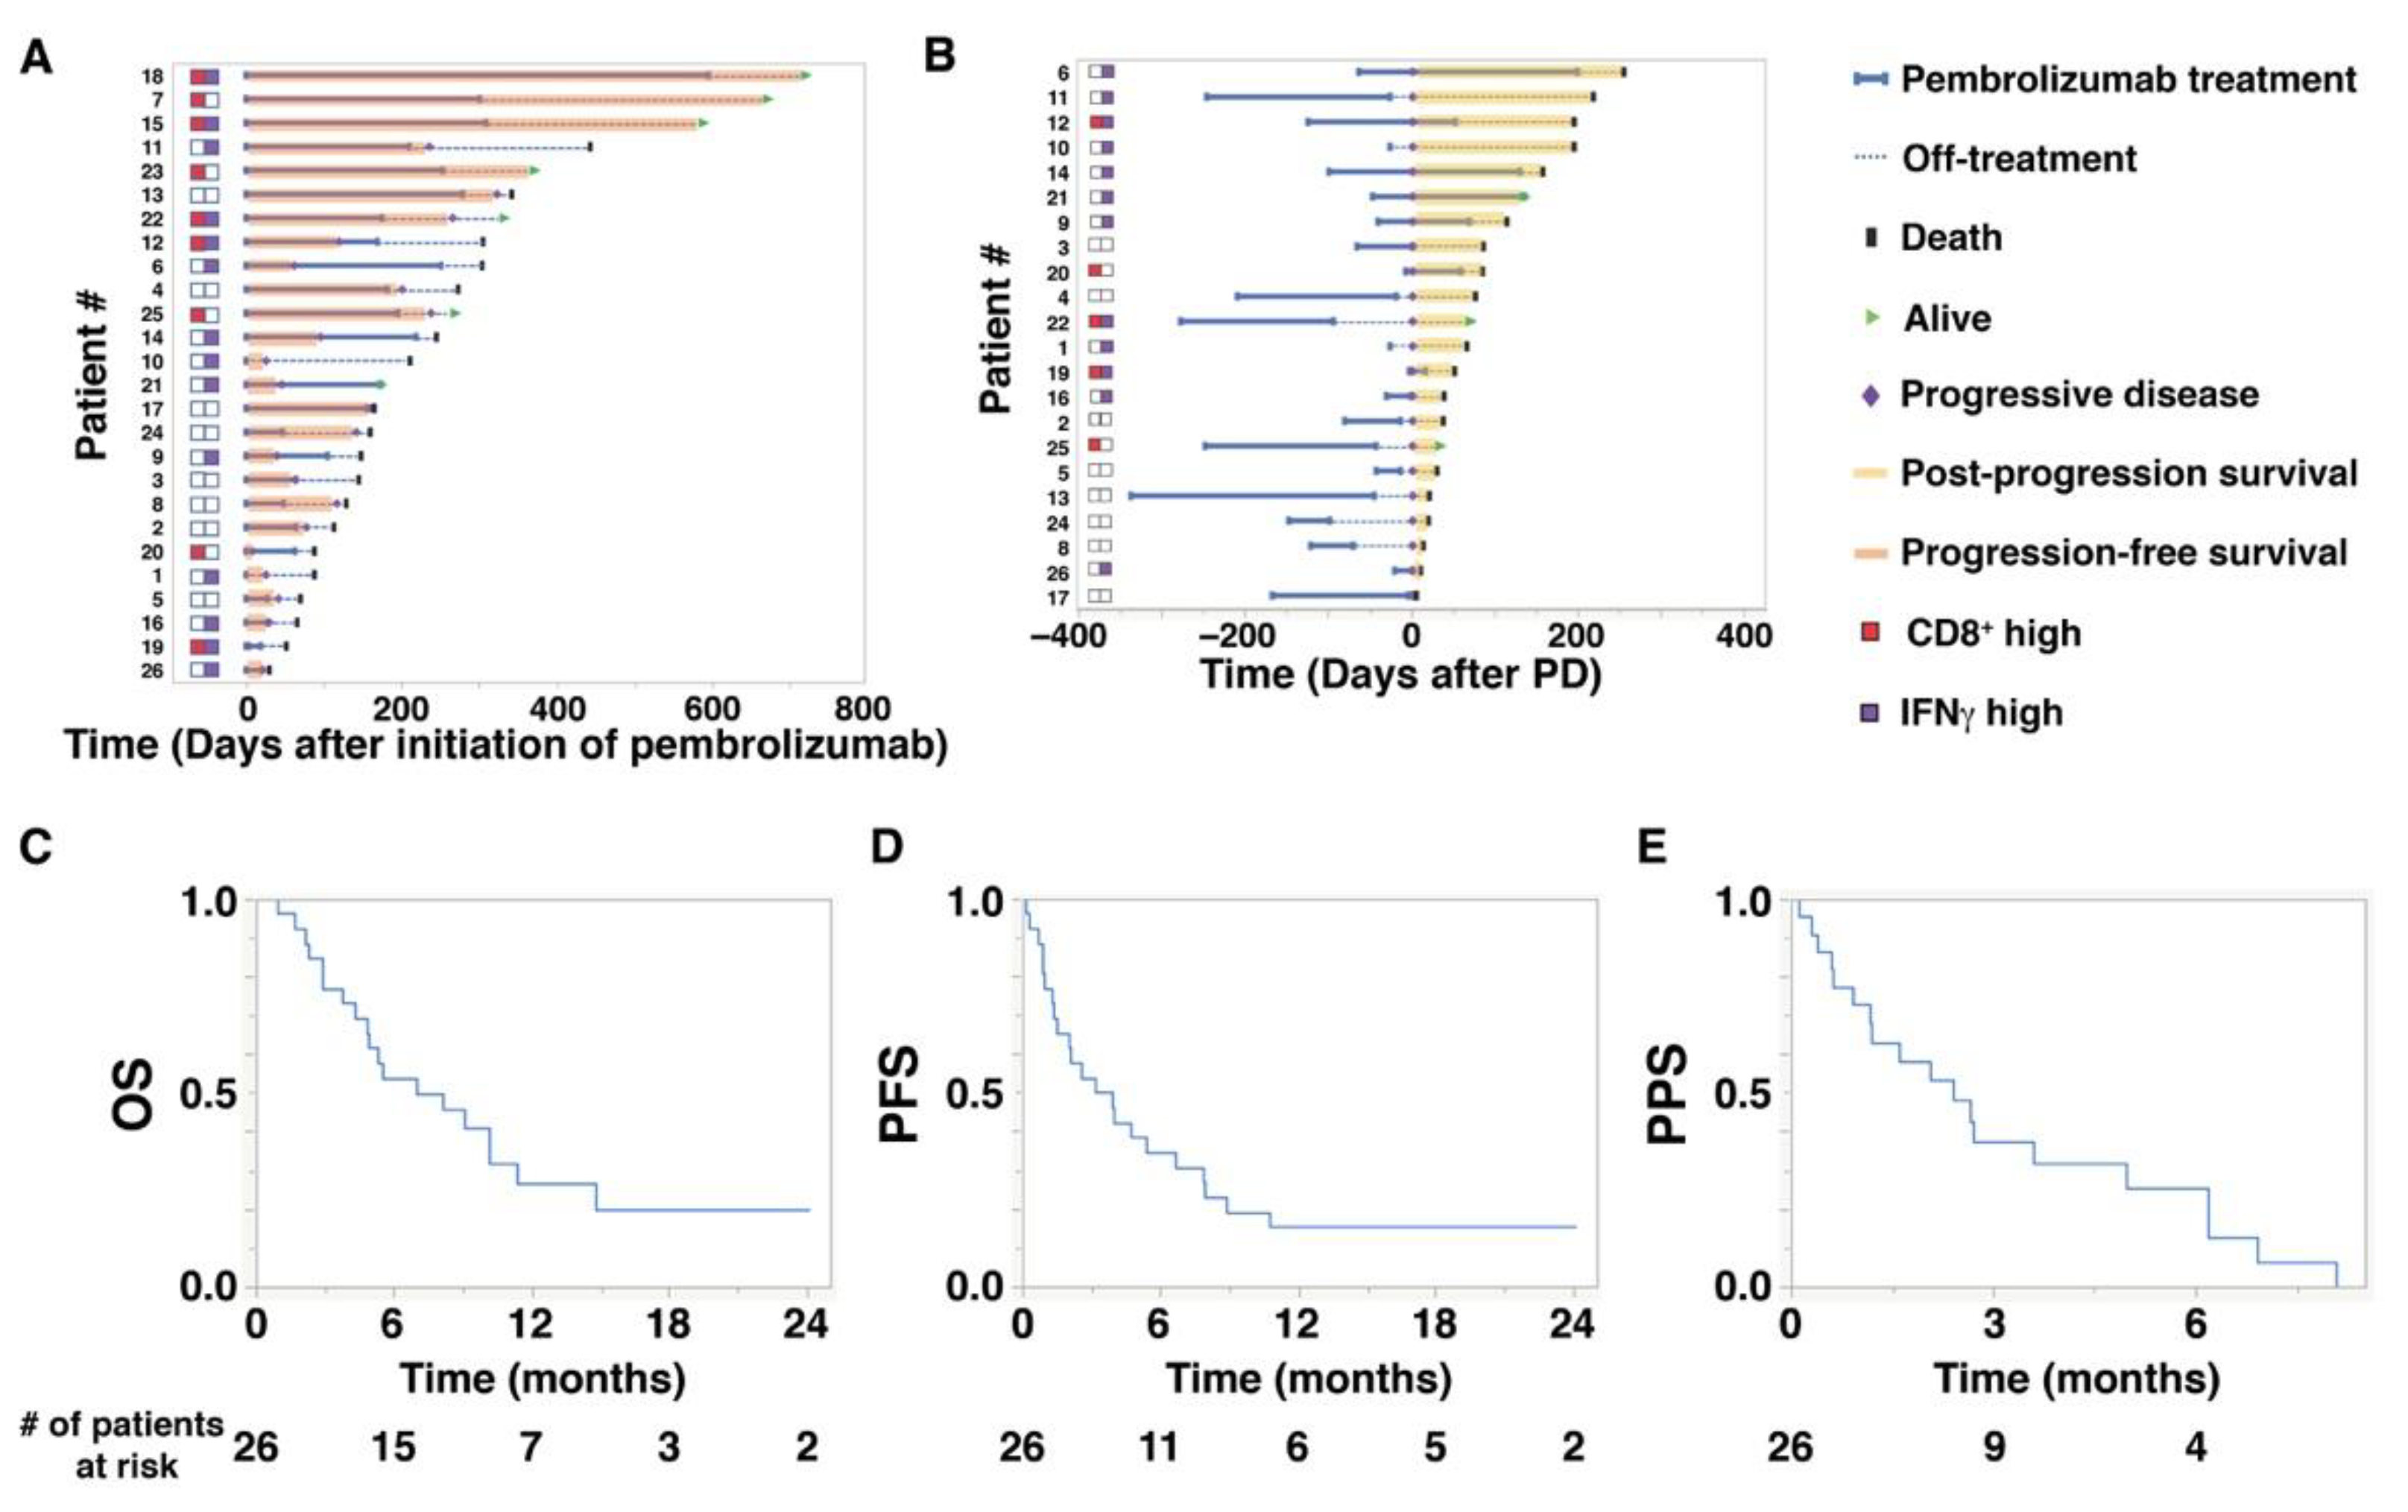
Baseline characteristics of the 26 study patients are shown in Table 1. The median (range) age at the initiation of pembrolizumab treatment was 72.5 (47–87) years. The median follow-up period from the initiation of pembrolizumab treatment to the date of the last follow-up was 6.4 (1.0–24.0) months. The median number of administrations of pembrolizumab was 5.5 cycles (1–25). The median OS of the 26 study patients was 7.0 (1.0–24.0) months, while PFS was 3.5 (0.1–24.0) months, and PPS was 2.4 (0.1–8.0) months (Figure 1C–E). As shown in Figure 1A,B, there were wide individual variations in PFS and PPS. Notably, in Figure 1B, high expression of IFNγ was related to longer PPS. The objective response rates were 0% for complete response, 38.5% for partial response, and 61.5% for stable or progressive disease (PD) (Table 2).

Table 1.
Baseline characteristics of patients treated with second-line pembrolizumab for advanced urothelial carcinoma.
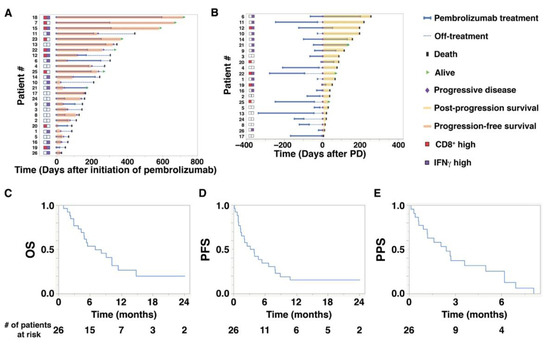
Figure 1.
Overall survival (OS), progression-free survival (PFS), and post-progression survival (PPS) of aUC patients treated with pembrolizumab. (A) A swimmer plot illustrates OS and PFS (orange bars) of 26 patients who received pembrolizumab treatment. The status of CD8+ T cells (red squares) and interferon gamma (IFNγ) expression (purple squares) is indicated on the left. (B) A swimmer plot illustrates PPS (yellow bars) of 22 patients who eventually developed progressive disease (PD) during or after pembrolizumab treatment. The horizontal axis shows the number of days after the initiation of PD. (C–E) Kaplan–Meier plots for (C) OS, (D) PFS, and (E) PPS of 26 patients who received pembrolizumab treatment.
Table 2.
Correlations between high and low biomarker expression and ORR.
3.2. Correlations among Immune Biomarkers
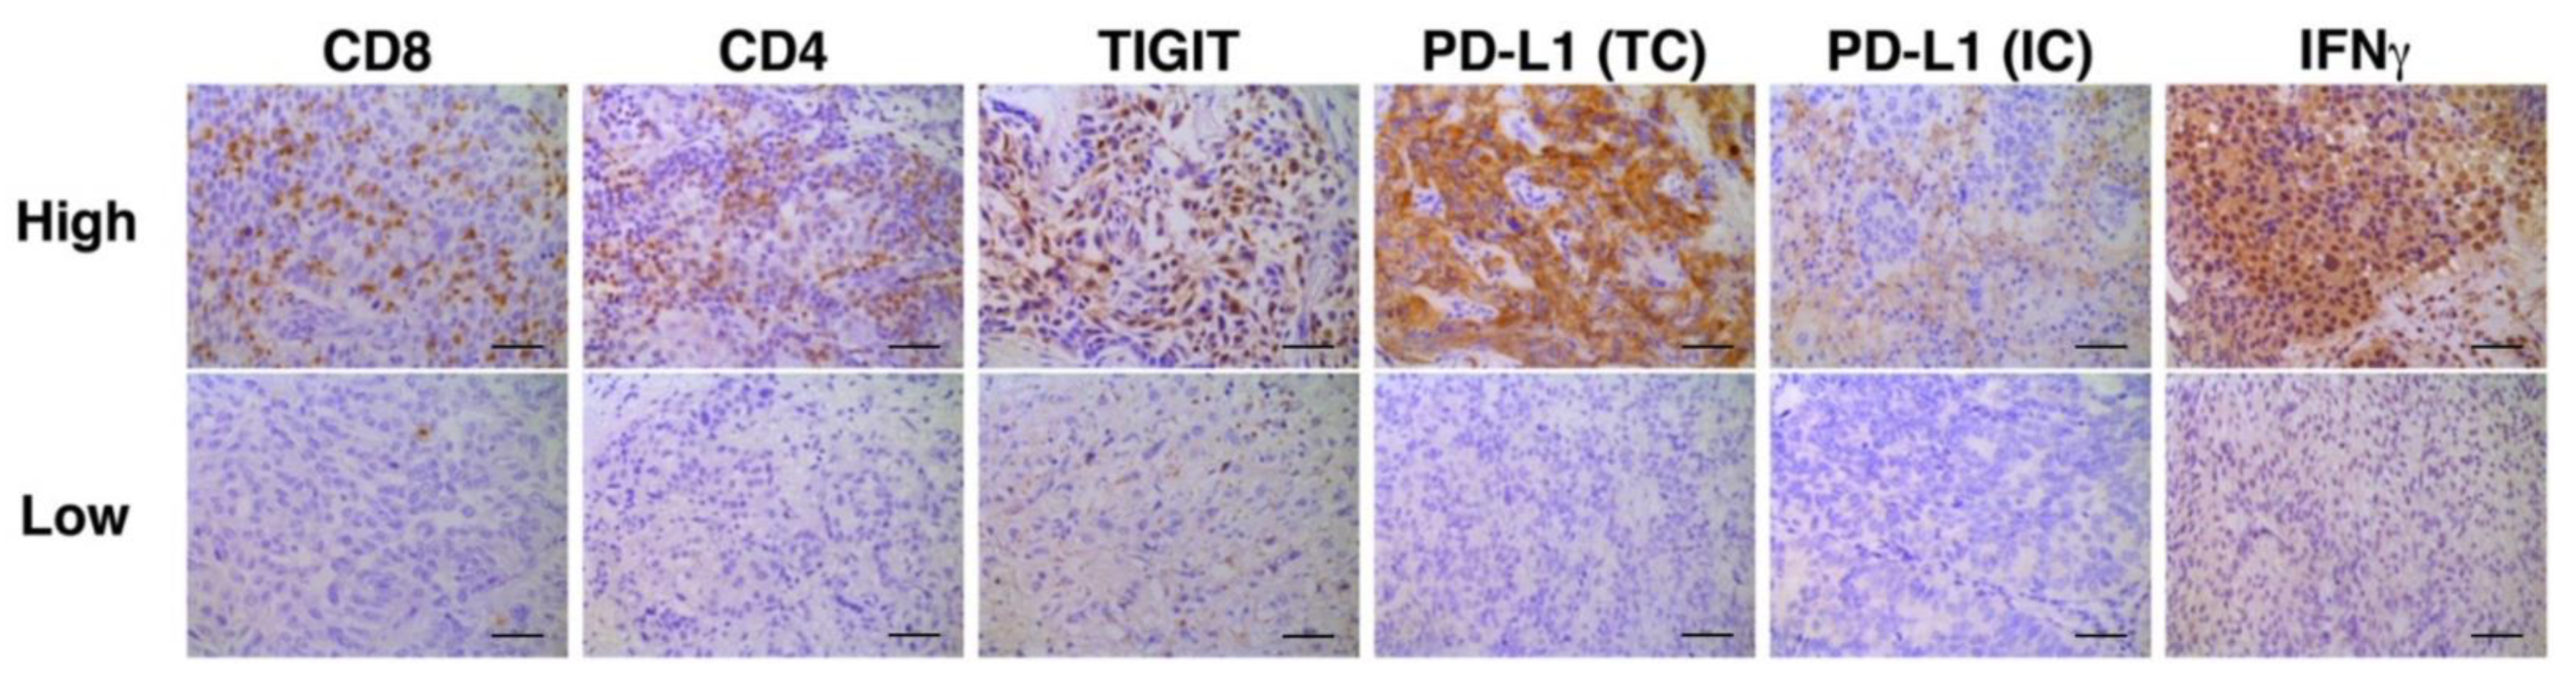
Representative photomicrographic images of IHC are shown in Figure 2. Correlation analyses of multiple immune biomarkers revealed that the expression of IFNγ was inversely correlated with that of TIGIT (Spearman’s rho = −0.4218, p = 0.0318, Table 3).
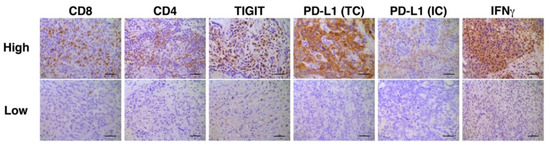
Figure 2.
Representative immunohistochemistry stains for high and low expression of each biomarker. Bars represent 100 μm. PD-L1 staining in TC was defined as either partial or complete membranous staining of any intensity in tumor cells. PD-L1 staining in IC was defined as cytoplasmic or membranous staining of any intensity in immune cells. Only tumor-infiltrating ICs and the ICs which infiltrate surrounding the tumor area within the peritumoral stroma were included in IC scoring.
Table 3.
Correlations between IFNγ expression and other immune biomarkers.
3.3. Correlations among Survival Outcomes
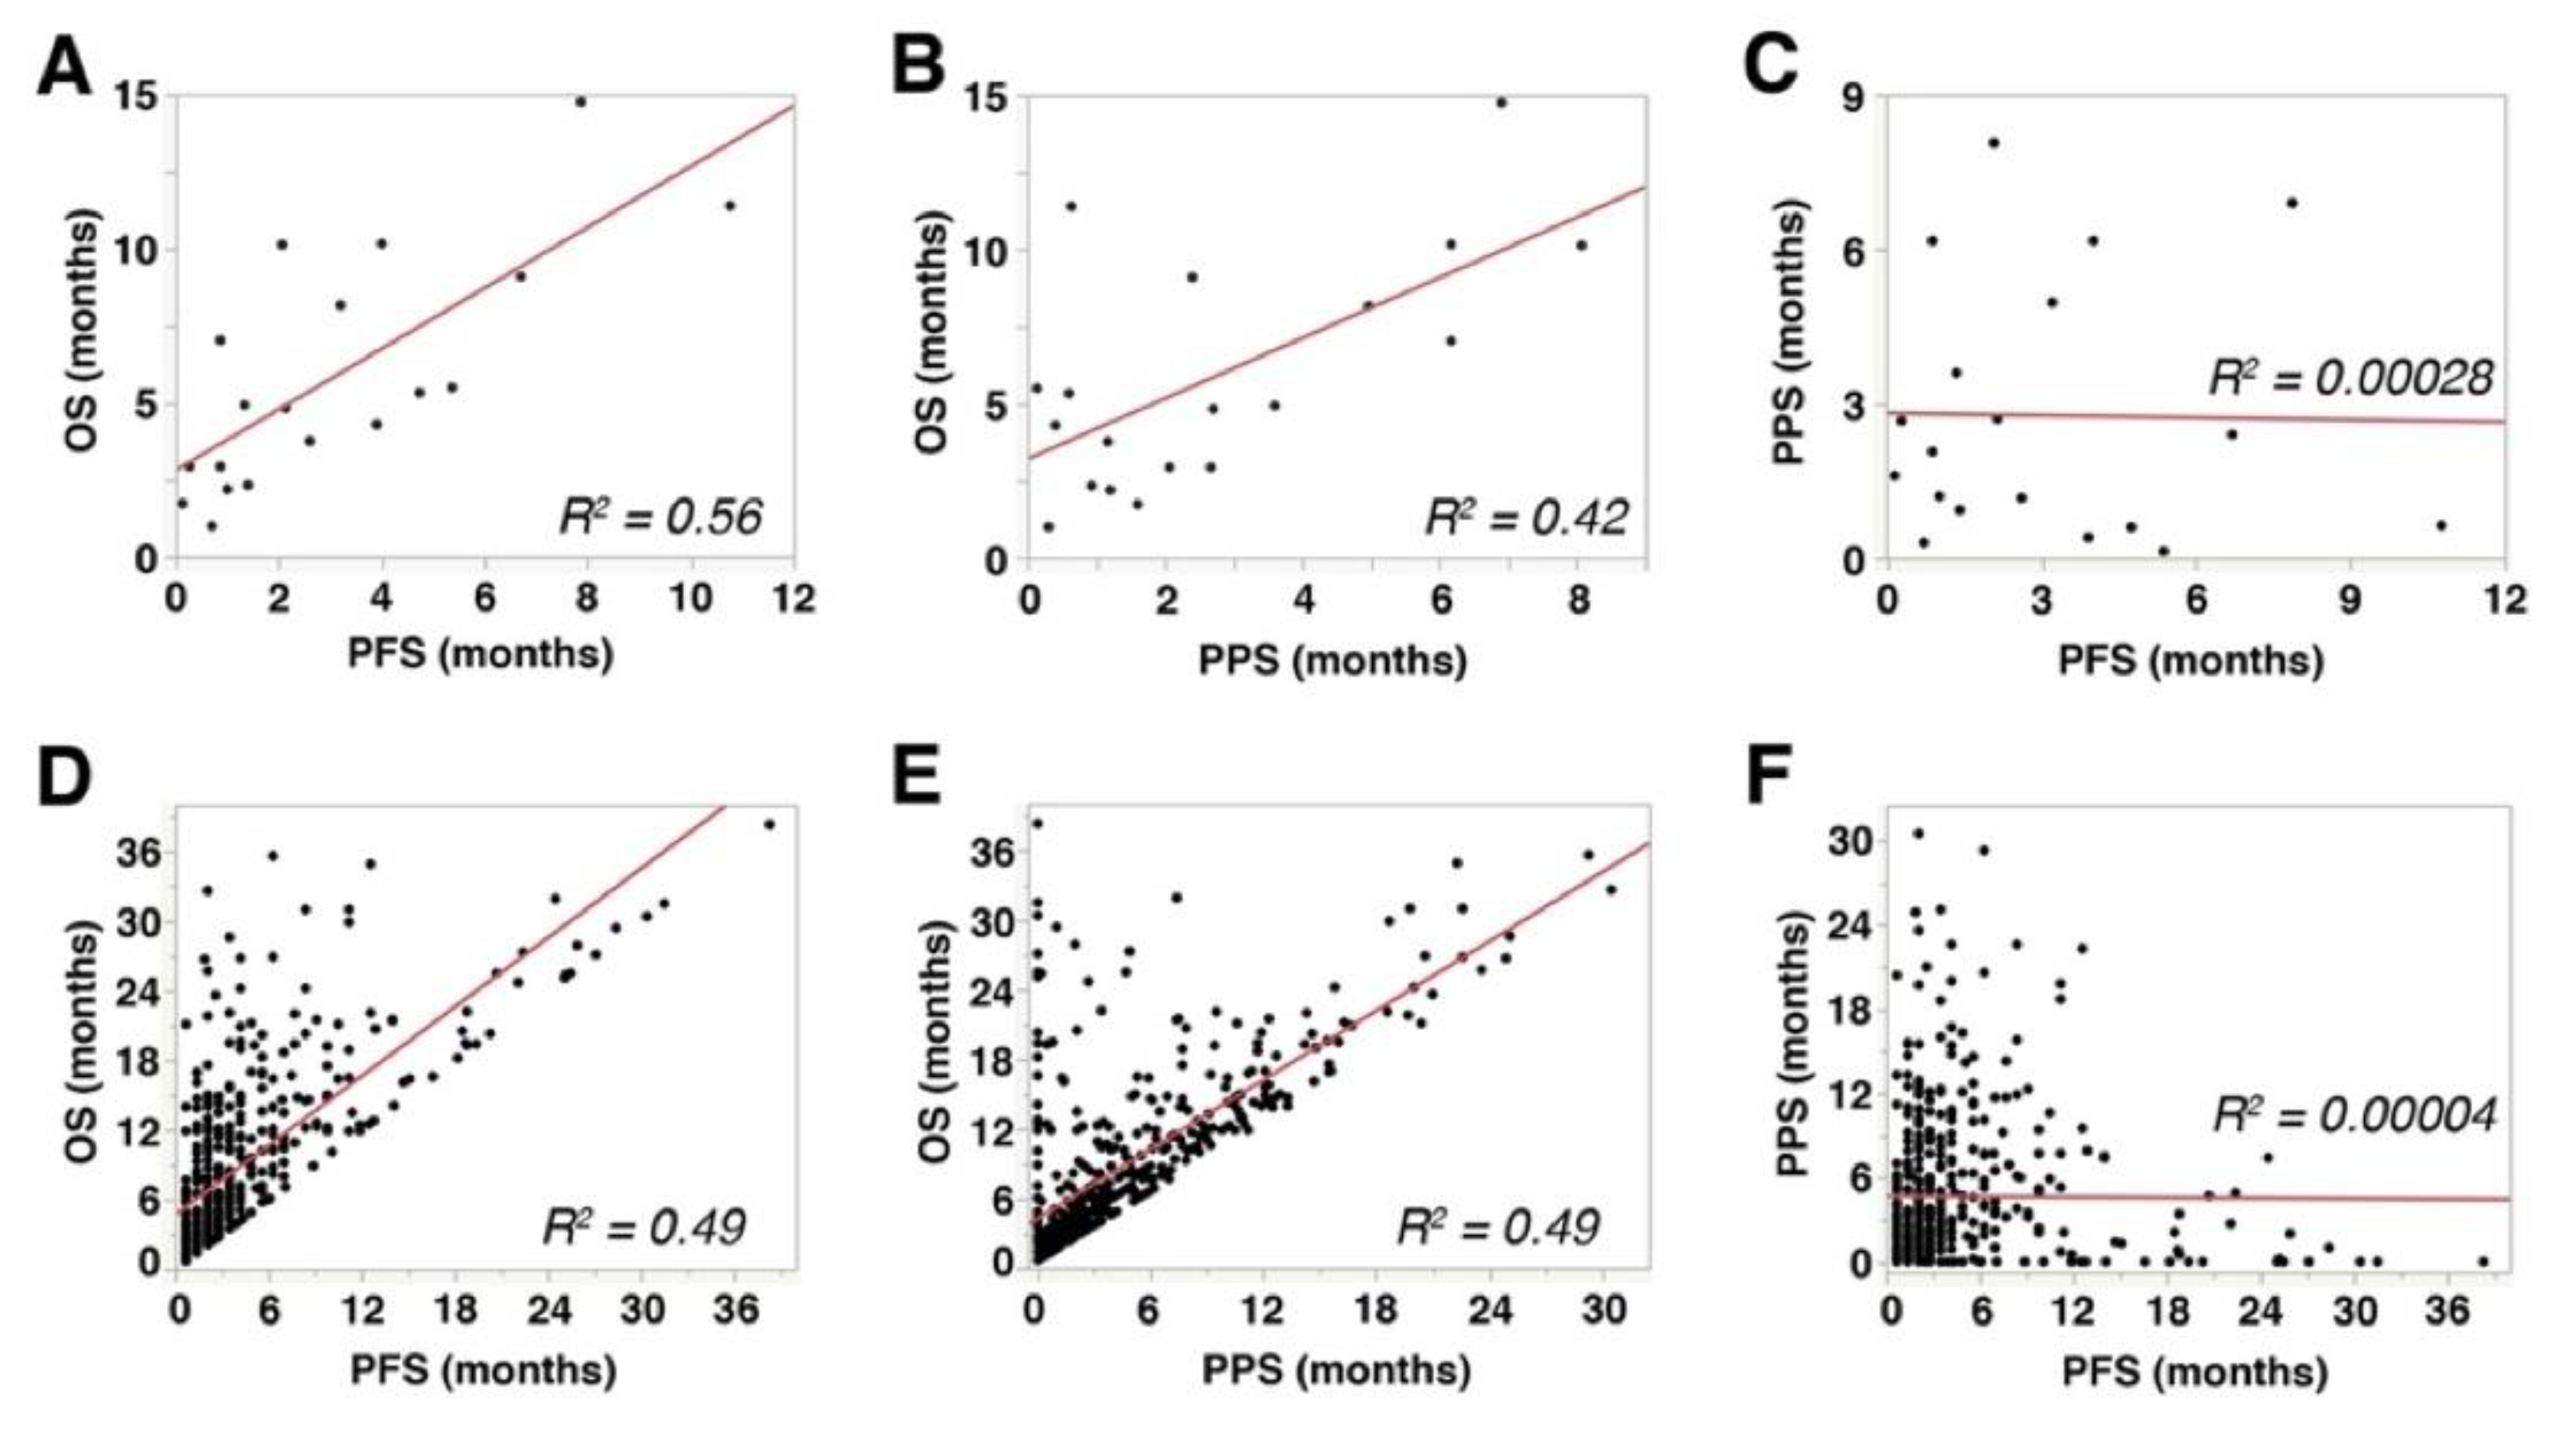
PFS showed a significant and strong correlation with OS (Spearman’s rho = 0.766, p = 0.0001, R2 = 0.56, Figure 3A), while PPS showed a significant but mild correlation with OS (Spearman’s rho = 0.493, p = 0.0318, R2 = 0.42, Figure 3B). These data indicated that both PFS and PPS had significant impact on OS of aUC patients receiving pembrolizumab therapy. No significant correlation was observed between PFS and PPS (Spearman’s rho = −0.0663, p = 0.9463, R2 = 0.00028, Figure 3C). Similar correlations were observed in the 450-patient cohort described above [27] (PFS with OS: Spearman’s rho = 0.7299, p < 0.0001, R2 = 0.49, Figure 3D; PPS with OS: Spearman’s rho = 0.7022, p < 0.0001, R2 = 0.49, Figure 3E; PFS with PPS: Spearman’s rho = 0.2033, p = 0.8977, R2 = 0.00004, Figure 3F). Multiple linear regression analyses showed that both PFS (p < 0.0001) and PPS (p < 0.0001) were independently correlated with OS.
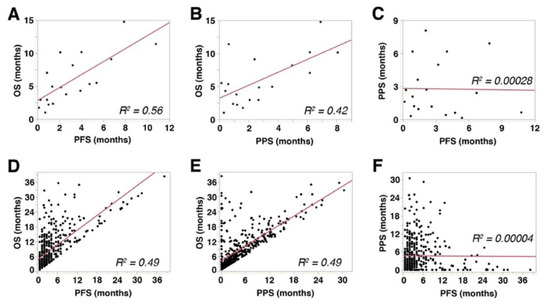
Figure 3.
Correlations among overall survival (OS), progression-free survival (PFS), and post-progression survival (PPS): (A–C) The results from the cohort of 26 patients included in the present study. (D–F) The results from a separate cohort that comprised 450 metastatic urothelial carcinoma patients treated with pembrolizumab [27]. R2 represents linear regression.
3.4. Correlations between the Expression of Immune Biomarkers and Survival Outcomes
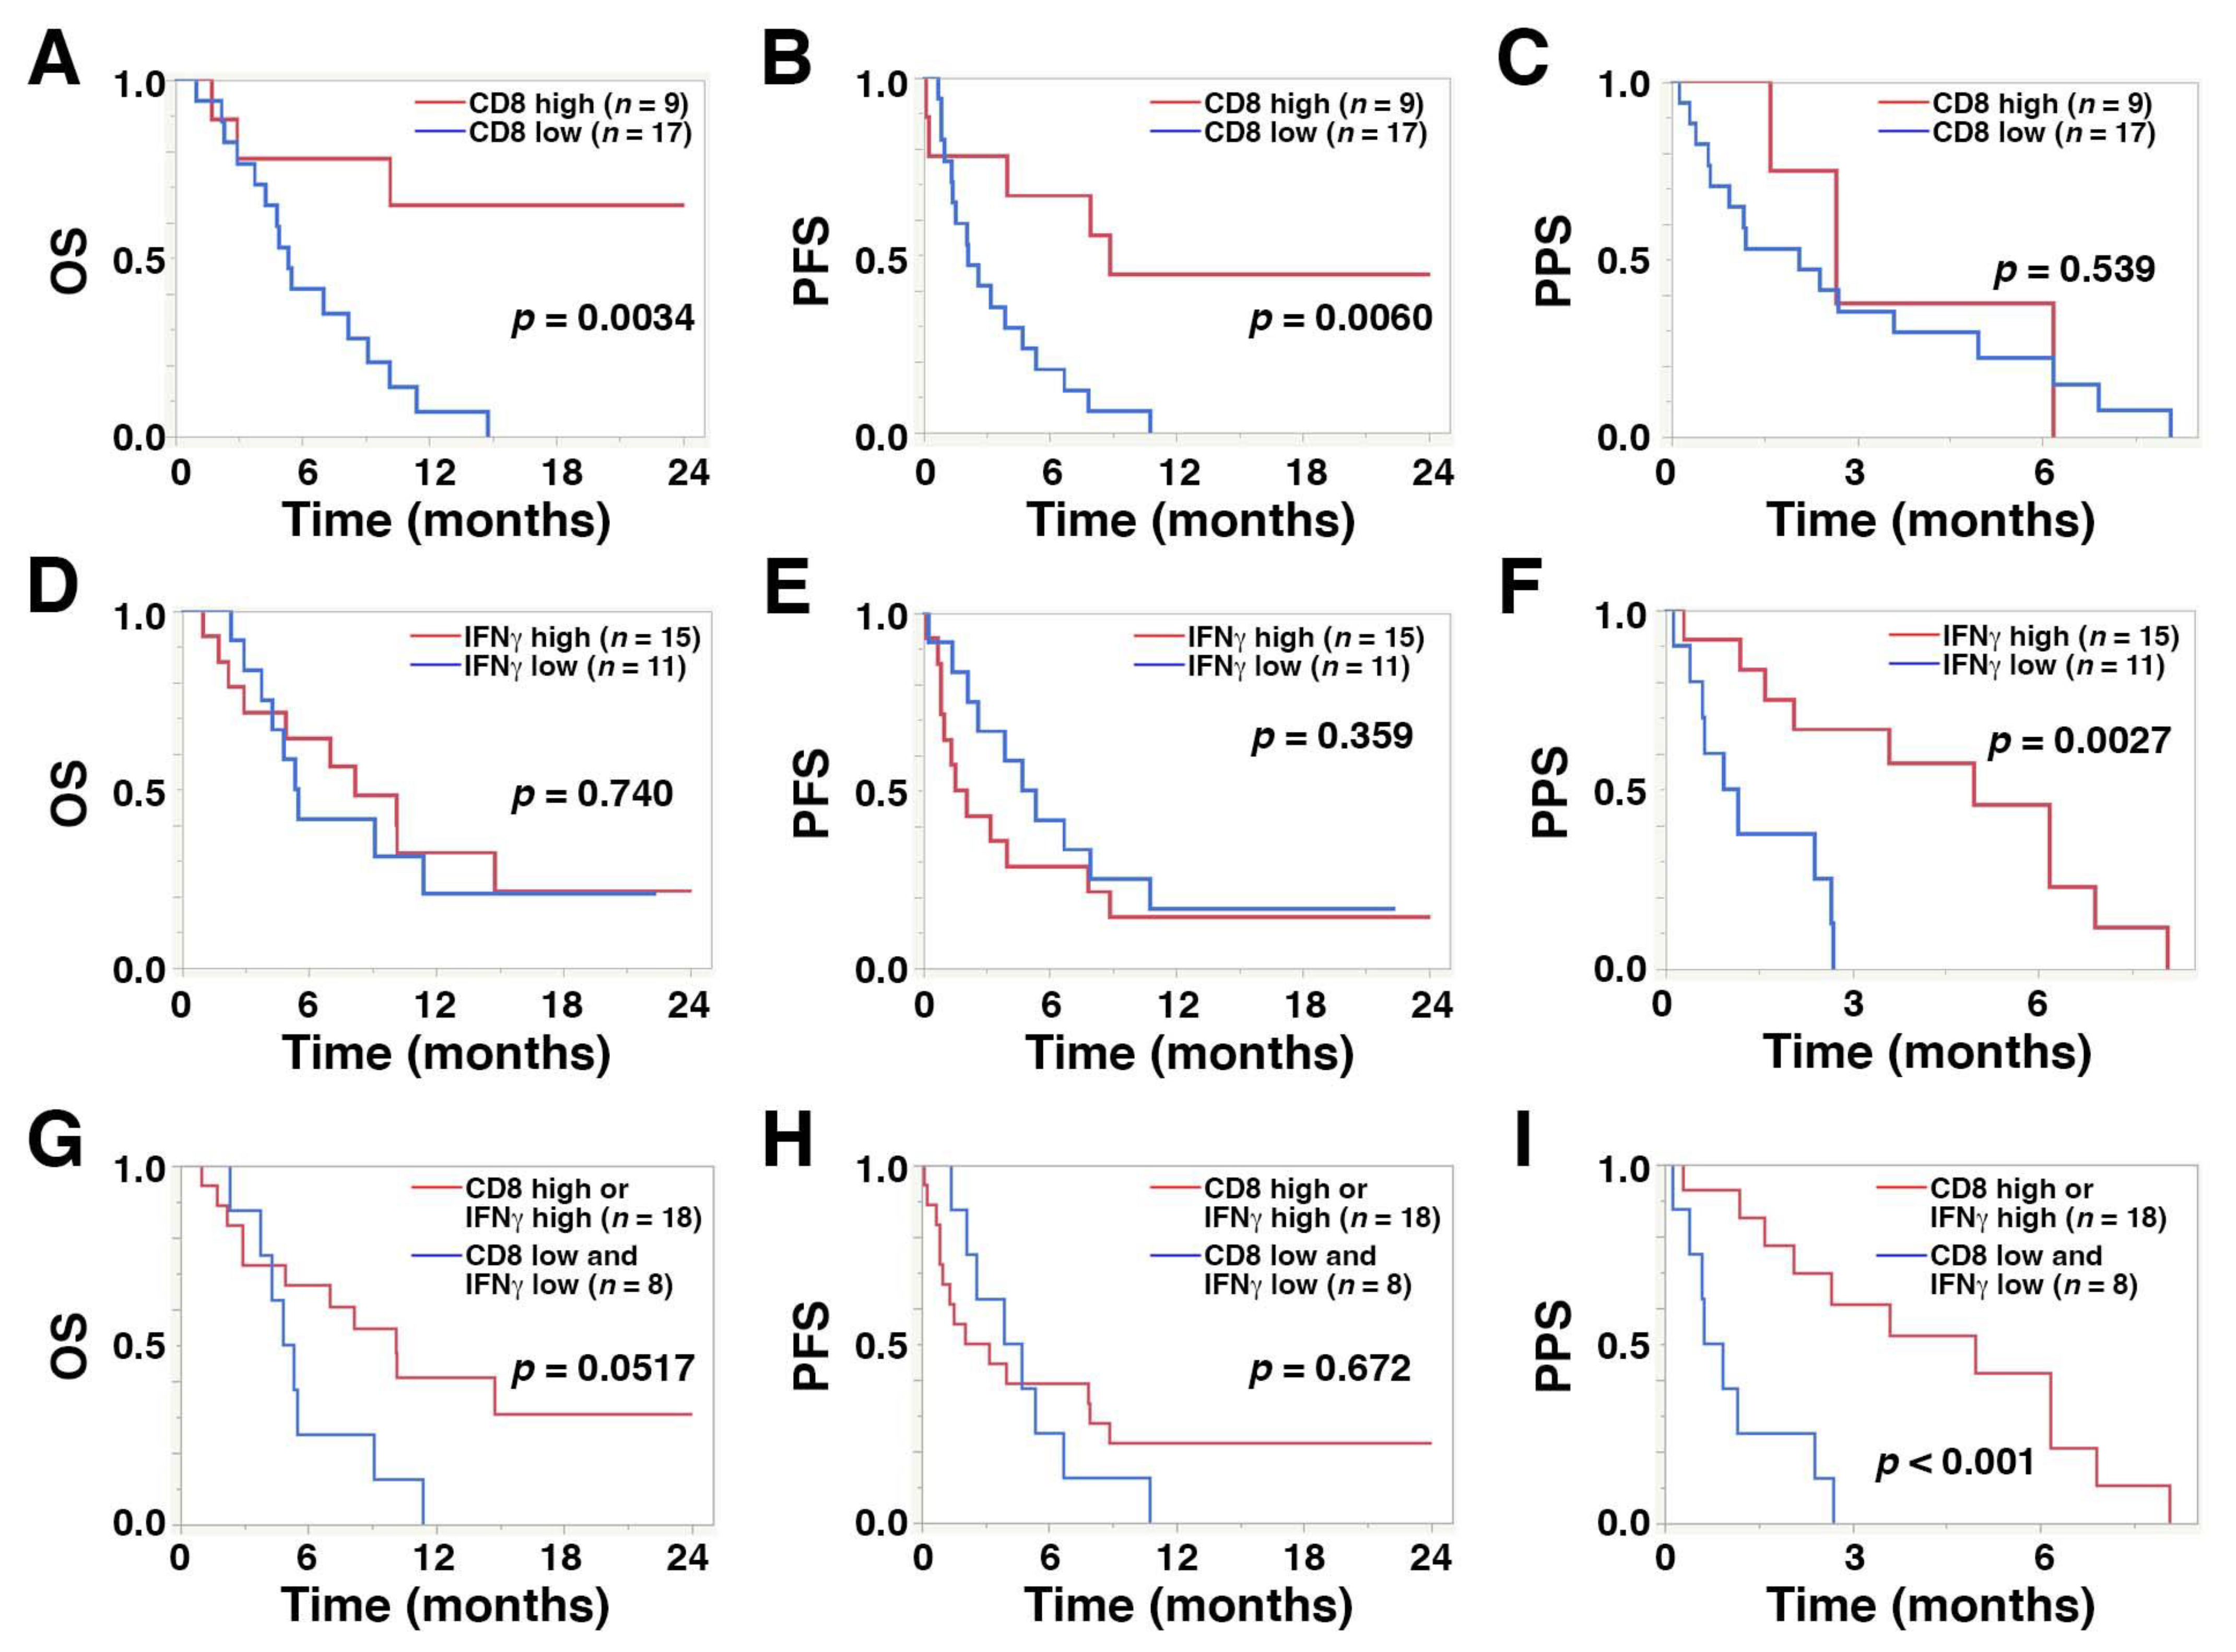
A high level of CD8+ TILs was significantly correlated with longer PFS (median, 8.8 vs. 2.1 months; hazard ratio (HR), 0.24; 95% confidence interval (CI), 0.07–0.66; p = 0.0060) and OS (median, >24.0 vs. 5.3 months; HR, 0.17; 95% CI, 0.04–0.56; p = 0.0034) compared with low CD8+ TIL levels, while high IFNγ expression was significantly associated with longer PPS compared with low expression levels (median, 4.9 vs. 1.0 months; HR, 0.18; 95% CI, 0.04–0.59; p = 0.0027) (Figure 4A–F and Table 4). A high level of CD8+ TILs was also significantly associated with a favorable objective response rate compared with low levels (23.0% vs. 15.3%, p = 0.0425, Table 2). PD-L1 expression in TCs or ICs was not associated with survival outcome after pembrolizumab treatment.
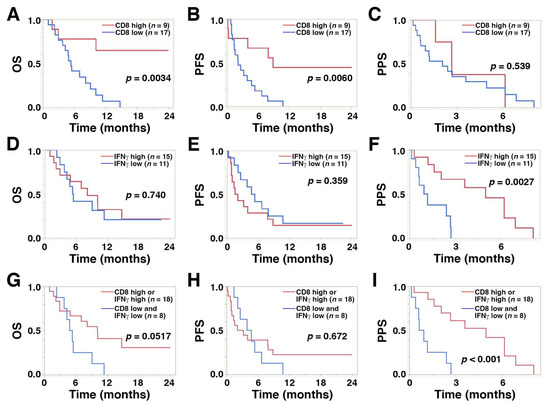
Figure 4.
Kaplan–Meier plots displaying overall survival (OS), progression-free survival (PFS), and post-progression survival (PPS) for the 26 study patients with regard to high and low levels of (A–C) CD8+ T cells, (D–F) IFNγ, and (G–I) the combination of CD8+ T cells and IFNγ.
Table 4.
Univariate Cox regression analysis of various biomarkers for OS, PFS, and PPS after pembrolizumab treatment.
3.5. Predictive Capacity of Concurrently Low CD8+ T Cell Infiltration and IFNγ Expression for Survival Outcome in aUC Patients Treated with Pembrolizumab as a Second-Line Therapy
Multivariate Cox proportional hazard analyses incorporated clinical prognostic factors, performance status ≥2, the presence of liver metastasis, and neutrophil-to-lymphocyte ratios (NLR) at the time of pembrolizumab treatment [27,28]. These analyses revealed that the coincidence of low CD8+ T cells and IFNγ expression (HR, 4.07; 95% CI, 1.36–12.73; p = 0.0125) as well as high NLR (HR, 14.45; 95% CI, 2.12–108.06; p = 0.0067) were independent factors for unfavorable OS after pembrolizumab treatment. In PFS, only the NLR was an independent factor for an unfavorable outcome (HR, 26.451; 95% CI, 3.76–202.62; p = 0.0011). For PPS, concurrently low CD8+ T cells and IFNγ expression (HR, 7.20; 95% CI, 2.13–27.88; p = 0.0014) and the presence of liver metastasis (HR, 4.84; 95% CI, 1.29–18.16; p = 0.020) were independent factors for unfavorable outcomes (Table 5).
Table 5.
Multivariate Cox regression analysis incorporating several clinical factors to evaluate the predictive capacity of the combination of low CD8+ T cells and IFNγ levels.
Kaplan–Meier curves revealed that the coincidence of low CD8+ T cells and low IFNγ was significantly associated with shorter PPS (median, 0.78 vs. 4.96 months; HR, 5.94; 95% CI, 1.91–20.23; p < 0.001) compared with high levels. However, the association with shorter OS did not reach statistical significance (median, 5.08 vs. 10.13 months; HR, 2.49; 95% CI, 0.93–6.47; p = 0.0517) (Figure 4G–I).
Although NRI and IDI analyses did not show statistically significant difference between IFNγ alone and in combination with CD8, the potential of the combination as a prognosticator should be further studied in the future large-scale studies.
4. Discussion
We determined the correlations between IFNγ expression, infiltration of immune cells, and expression of checkpoint molecules in the TME of primary tumors from aUC patients. We demonstrated that high levels of CD8+ TILs were significantly associated with a favorable objective response and longer OS, while high IFNγ expression in the tumor was significantly correlated with longer PPS. Furthermore, coincidence of low CD8 infiltration and low IFNγ secretion was associated with an unfavorable prognosis. These data suggest that the combinatorial evaluation of CD8+ TILs and IFNγ expression may provide a novel prognostic biomarker for patients receiving pembrolizumab treatment for chemorefractory aUC.
Tumor infiltration by effector T cells is considered to be mandatory for effective treatment with ICIs [29,30]. Indeed, recent studies have demonstrated that a high level of infiltrating CD8+ T cells was associated with favorable radiological response and oncological outcomes after ICI treatment [10,11,31], which is consistent with our results.
Not surprisingly, PFS was strongly correlated with OS; additionally, PPS was another factor that correlated with OS in this study using two independent cohorts. Although the significance of PPS in aUC after pembrolizumab treatment is not well understood, the significant correlations between PPS and OS in the two independent cohorts analyzed in the present study strongly suggest the potential importance of PPS in addition to PFS. In the phase 3 OAK trial, a post-hoc analysis of atezolizumab versus docetaxel in advanced non-small-cell lung cancer (NSCLC) demonstrated that PPS in the atezolizumab group varied widely [32]. Specifically, PPS was 12.7 months (95% CI, 9.3–14.9) in patients continuing atezolizumab treatment, 8.8 months (95% CI, 6.0–12.1) in those switching to other anticancer therapy, and 2.2 months (95% CI, 1.9–3.4) for those receiving no further therapy. These results suggested that continuation of anti-PD-1/PD-L1 treatment until loss of clinical benefit contributed to favorable PPS. Another possible explanation was better clinical status at the time of PD, allowing for atezolizumab treatment beyond PD or subsequent anticancer treatment. Additionally, in our cohort, PPS was 4.97 months (95% CI, 1.60–8.07) in patients with persistent pembrolizumab as long as possible after PD (n = 7) and PPS was 1.2 months (95% CI, 0.4–2.7) in patients with no treatment after PD (n = 15). Continuation of pembrolizumab tended to correlate with favorable PPS (p = 0.053) although the difference did not reach a statistical significance. This could have been a β error due to the small sample size and should be further validated in a future study.
Factors that may affect PPS in patients with advanced cancer receiving anti-PD-1/PD-L1 treatment have not been fully elucidated. Our results suggest that the prediction of PPS may be possible by using a biomarker, such as IFNγ expression, and this predictive potential would be useful for clinical decision-making and/or patient counseling in aUC management. Further investigations will be required to understand the biological and clinical determinants of PPS in aUC patients receiving pembrolizumab.
The interaction between IFNγ and CD8+ T cells in the TME plays an important role in anti-tumor immune responses induced by ICIs. In the CheckMate-275 phase 2 clinical trial, 270 patients with platinum-resistant metastatic UC were treated with the anti-PD-1 antibody nivolumab; the presence of higher tumor infiltration by CD8+ T cells prior to treatment was associated with favorable PFS and OS after nivolumab treatment [33]. Furthermore, enrichment of a 25-gene IFNγ signature was associated with the response to nivolumab in aUC patients after the platinum-based chemotherapy. Another study reported RNA sequencing results for tumor tissues obtained from 62 locally advanced or metastatic UC patients and 97 advanced NSCLC patients. This study demonstrated that a 4-gene IFNγ signature was associated with a favorable response to durvalumab treatment in both types of cancer [34]. Additionally, IFNγ has been reported to enhance the expression of major histocompatibility class 1 molecules and promote the presentation of tumor-specific antigens [35]. Enhancement of anti-tumor immunity by upregulating antigen recognition and tumor infiltration by T cells then stimulates CD8+ T cells to secrete IFNγ, which forms a positive feedback loop [36].
TIGIT is a co-inhibitory receptor mainly expressed on the surface of CD8+ T cells, NK cells, and regulatory T cells [37,38]. TIGIT has been reported to contribute to immune evasion and to be correlated with poor prognosis in several cancers [39,40]. This study showed that the expression of TIGIT in TILs was inversely correlated with the expression of IFNγ in the TME. Our results were consistent with a recent study demonstrating that TIGIT expression was inversely correlated with the expression of cytotoxic cytokines, including IFNγ, from CD8+ T cells infiltrating colorectal cancer [41]. The previous study also showed that other co-inhibitory receptors, such as PD-1, T cell immunoglobulin and mucin domain-containing protein 3, and lymphocyte activating gene-3 were expressed on the surface of TIGIT+ CD8+ T cells.
In this study, PD-L1 expression in TCs or ICs was not associated with favorable clinical outcomes after second-line pembrolizumab treatment. This result is in contrast to several clinical trials that showed a correlation between PD-L1 expression and prolonged OS [42] or benefit of anti-PD-1/PD-L1 treatment [9]. The contradictory results may be explained by the use of different antibodies and cutoff values for PD-L1 positivity. In the present study, we used the Abcam SP142 assay for PD-L1 IHC, which is different from the Dako 22C3 antibody used in the KEYNOTE-045 and KEYNOTE-052 studies [9,42].
There were several limitations in this study that should be acknowledged in addition to the retrospective design and small sample size. One limitation was that PPS was not tested in a control group that did not receive pembrolizumab, such as a group of patients treated with chemotherapy alone or not treated. Additionally, no patient received subsequent systemic therapy after pembrolizumab in this study. It is desirable to evaluate the correlation between the profile of additional therapy and the expression patterns of biomarkers to better understand the clinical roles of PPS. Furthermore, a cutoff value for IFNγ was not externally validated. A gene-expression signature was not evaluated, and, therefore, it is unclear whether high IFNγ expression represents an enriched IFNγ gene signature. Nonetheless, we believe that the present study demonstrates a novel combinatorial prognostic factor using CD8+ TIL levels and IFNγ expression and provides new insight into the mechanism of resistance of aUC to ICIs. Our results warrant further investigations including consistency of our findings with other ICIs and validation using gene-expression profiling data in larger-scale studies.
5. Conclusions
High tumor infiltration by CD8+ lymphocytes was associated with longer OS and PFS of patients with aUC treated with pembrolizumab, and high expression of IFNγ in the TME was significantly correlated with favorable PPS. The coincidence of low expression of CD8+ TILs and IFNγ was an independent prognostic factor that yielded a predictive ability equivalent to previously reported clinical prognostic factors.
Author Contributions
Conceptualization, T.S. (Toru Sakatani), Y.K. and T.K.; methodology, T.S. (Toru Sakatani), Y.K. and T.K.; software, T.S. (Toru Sakatani), Y.K. and T.K.; formal analysis, T.S. (Toru Sakatani), Y.K., M.F. and T.K.; resources, T.S. (Toru Sakatani), Y.K. and T.K.; data curation, T.S. (Toru Sakatani), Y.K., M.F. and T.K.; writing—original draft preparation, T.S. (Toru Sakatani), Y.K. and T.K.; writing—review and editing, T.S. (Toru Sakatani), Y.K., M.F, T.S. (Takeshi Sano), A.H., K.N., H.T., T.G., A.S., S.A. and T.K.; visualization, T.S. (Toru Sakatani), Y.K. and T.K.; supervision, Y.K. and T.K.; project administration, T.S. (Toru Sakatani), Y.K. and T.K.; funding acquisition, T.K. All authors have read and agreed to the published version of the manuscript.
Funding
This research received no external funding.
Institutional Review Board Statement
The study was conducted according to the guidelines of the Declaration of Helsinki and approved by the Institutional Review Board at Kyoto University Graduate School of Medicine (#G0052-27, 22/09/2021).
Informed Consent Statement
Informed consent was obtained from all subjects involved in the study.
Data Availability Statement
The data underlying this article cannot be shared publicly to maintain the privacy of individuals that participated in the study. The data will be shared upon reasonable request to the corresponding author.
Acknowledgments
The authors thank Susan Zunino from Edanz for editing a draft of this manuscript.
Conflicts of Interest
The authors declare no conflict of interest. The funders had no role in the design of the study; in the collection, analyses, or interpretation of data; in the writing of the manuscript, or in the decision to publish the results.
References
- Bellmunt, J.; von der Maase, H.; Mead, G.M.; Skoneczna, I.; De Santis, M.; Daugaard, G.; Boehle, A.; Chevreau, C.; Paz-Ares, L.; Laufman, L.R.; et al. Randomized phase III study comparing paclitaxel/cisplatin/gemcitabine and gemcitabine/cisplatin in patients with locally advanced or metastatic urothelial cancer without prior systemic therapy: EORTC Intergroup Study 30987. J. Clin. Oncol. 2012, 30, 1107–1113. [Google Scholar] [CrossRef] [PubMed]
- von der Maase, H.; Sengelov, L.; Roberts, J.T.; Ricci, S.; Dogliotti, L.; Oliver, T.; Moore, M.J.; Zimmermann, A.; Arning, M. Long-term survival results of a randomized trial comparing gemcitabine plus cisplatin, with methotrexate, vinblastine, doxorubicin, plus cisplatin in patients with bladder cancer. J. Clin. Oncol. 2005, 23, 4602–4608. [Google Scholar] [CrossRef]
- De Santis, M.; Bellmunt, J.; Mead, G.; Kerst, J.M.; Leahy, M.; Maroto, P.; Gil, T.; Marreaud, S.; Daugaard, G.; Skoneczna, I.; et al. Randomized phase II/III trial assessing gemcitabine/carboplatin and methotrexate/carboplatin/vinblastine in patients with advanced urothelial cancer who are unfit for cisplatin-based chemotherapy: EORTC study 30986. J. Clin. Oncol. 2012, 30, 191–199. [Google Scholar] [CrossRef] [PubMed]
- Galsky, M.D.; Hahn, N.M.; Rosenberg, J.; Sonpavde, G.; Hutson, T.; Oh, W.K.; Dreicer, R.; Vogelzang, N.; Sternberg, C.N.; Bajorin, D.F.; et al. Treatment of patients with metastatic urothelial cancer "unfit" for Cisplatin-based chemotherapy. J. Clin. Oncol. 2011, 29, 2432–2438. [Google Scholar] [CrossRef] [PubMed] [Green Version]
- Flaig, T.W.; Spiess, P.E.; Agarwal, N.; Bangs, R.; Boorjian, S.A.; Buyyounouski, M.K.; Chang, S.; Downs, T.M.; Efstathiou, J.A.; Friedlander, T.; et al. Bladder Cancer, Version 3.2020, NCCN Clinical Practice Guidelines in Oncology. J. Natl. Compr. Cancer Netw. 2020, 18, 329–354. [Google Scholar] [CrossRef] [PubMed] [Green Version]
- Witjes, J.A.; Bruins, H.M.; Cathomas, R.; Comperat, E.M.; Cowan, N.C.; Gakis, G.; Hernandez, V.; Linares Espinos, E.; Lorch, A.; Neuzillet, Y.; et al. European Association of Urology Guidelines on Muscle-invasive and Metastatic Bladder Cancer: Summary of the 2020 Guidelines. Eur. Urol. 2021, 79, 82–104. [Google Scholar] [CrossRef]
- Kobayashi, T.; Takeuchi, A.; Nishiyama, H.; Eto, M. Current status and future perspectives of immunotherapy against urothelial and kidney cancer. Jpn. J. Clin. Oncol. 2021, 51, 1481–1492. [Google Scholar] [CrossRef]
- Bellmunt, J.; de Wit, R.; Vaughn, D.J.; Fradet, Y.; Lee, J.L.; Fong, L.; Vogelzang, N.J.; Climent, M.A.; Petrylak, D.P.; Choueiri, T.K.; et al. Pembrolizumab as Second-Line Therapy for Advanced Urothelial Carcinoma. N. Engl. J. Med. 2017, 376, 1015–1026. [Google Scholar] [CrossRef] [Green Version]
- Fradet, Y.; Bellmunt, J.; Vaughn, D.J.; Lee, J.L.; Fong, L.; Vogelzang, N.J.; Climent, M.A.; Petrylak, D.P.; Choueiri, T.K.; Necchi, A.; et al. Randomized phase III KEYNOTE-045 trial of pembrolizumab versus paclitaxel, docetaxel, or vinflunine in recurrent advanced urothelial cancer: Results of >2 years of follow-up. Ann. Oncol. 2019, 30, 970–976. [Google Scholar] [CrossRef]
- Bruni, D.; Angell, H.K.; Galon, J. The immune contexture and Immunoscore in cancer prognosis and therapeutic efficacy. Nat. Rev. Cancer 2020, 20, 662–680. [Google Scholar] [CrossRef]
- Wang, L.; Saci, A.; Szabo, P.M.; Chasalow, S.D.; Castillo-Martin, M.; Domingo-Domenech, J.; Siefker-Radtke, A.; Sharma, P.; Sfakianos, J.P.; Gong, Y.; et al. EMT- and stroma-related gene expression and resistance to PD-1 blockade in urothelial cancer. Nat. Commun. 2018, 9, 3503. [Google Scholar] [CrossRef]
- Tu, M.M.; Ng, T.L.; De Jong, F.C.; Zuiverloon, T.C.M.; Fazzari, F.G.T.; Theodorescu, D. Molecular Biomarkers of Response to PD-1/ PD-L1 Immune Checkpoint Blockade in Advanced Bladder Cancer. Bladder Cancer 2019, 5, 131–145. [Google Scholar] [CrossRef] [Green Version]
- Dunn, G.P.; Koebel, C.M.; Schreiber, R.D. Interferons, immunity and cancer immunoediting. Nat. Rev. Immunol. 2006, 6, 836–848. [Google Scholar] [CrossRef]
- Wheelock, E.F. Interferon-Like Virus-Inhibitor Induced in Human Leukocytes by Phytohemagglutinin. Science 1965, 149, 310–311. [Google Scholar] [CrossRef]
- Nakajima, C.; Uekusa, Y.; Iwasaki, M.; Yamaguchi, N.; Mukai, T.; Gao, P.; Tomura, M.; Ono, S.; Tsujimura, T.; Fujiwara, H.; et al. A role of interferon-gamma (IFN-gamma) in tumor immunity: T cells with the capacity to reject tumor cells are generated but fail to migrate to tumor sites in IFN-gamma-deficient mice. Cancer Res. 2001, 61, 3399–3405. [Google Scholar]
- Ni, L.; Lu, J. Interferon gamma in cancer immunotherapy. Cancer Med. 2018, 7, 4509–4516. [Google Scholar] [CrossRef] [PubMed]
- Song, M.; Ping, Y.; Zhang, K.; Yang, L.; Li, F.; Zhang, C.; Cheng, S.; Yue, D.; Maimela, N.R.; Qu, J.; et al. Low-Dose IFNgamma Induces Tumor Cell Stemness in Tumor Microenvironment of Non-Small Cell Lung Cancer. Cancer Res. 2019, 79, 3737–3748. [Google Scholar] [CrossRef] [PubMed]
- Peng, W.; Liu, C.; Xu, C.; Lou, Y.; Chen, J.; Yang, Y.; Yagita, H.; Overwijk, W.W.; Lizee, G.; Radvanyi, L.; et al. PD-1 blockade enhances T-cell migration to tumors by elevating IFN-gamma inducible chemokines. Cancer Res. 2012, 72, 5209–5218. [Google Scholar] [CrossRef] [PubMed] [Green Version]
- Liakou, C.I.; Kamat, A.; Tang, D.N.; Chen, H.; Sun, J.; Troncoso, P.; Logothetis, C.; Sharma, P. CTLA-4 blockade increases IFNgamma-producing CD4+ICOShi cells to shift the ratio of effector to regulatory T cells in cancer patients. Proc. Natl. Acad. Sci. USA 2008, 105, 14987–14992. [Google Scholar] [CrossRef] [Green Version]
- Manguso, R.T.; Pope, H.W.; Zimmer, M.D.; Brown, F.D.; Yates, K.B.; Miller, B.C.; Collins, N.B.; Bi, K.; LaFleur, M.W.; Juneja, V.R.; et al. In vivo CRISPR screening identifies Ptpn2 as a cancer immunotherapy target. Nature 2017, 547, 413–418. [Google Scholar] [CrossRef] [Green Version]
- Toda, Y.; Kono, K.; Abiru, H.; Kokuryo, K.; Endo, M.; Yaegashi, H.; Fukumoto, M. Application of tyramide signal amplification system to immunohistochemistry: A potent method to localize antigens that are not detectable by ordinary method. Pathol. Int. 1999, 49, 479–483. [Google Scholar] [CrossRef] [PubMed]
- Holland, B.C.; Sood, A.; Delfino, K.; Dynda, D.I.; Ran, S.; Freed, N.; Alanee, S. Age and sex have no impact on expression levels of markers of immune cell infiltration and immune checkpoint pathways in patients with muscle-invasive urothelial carcinoma of the bladder treated with radical cystectomy. Cancer Immunol. Immunother. 2019, 68, 991–997. [Google Scholar] [CrossRef] [PubMed]
- Kamai, T.; Kijima, T.; Tsuzuki, T.; Nukui, A.; Abe, H.; Arai, K.; Yoshida, K.I. Increased expression of adenosine 2A receptors in metastatic renal cell carcinoma is associated with poorer response to anti-vascular endothelial growth factor agents and anti-PD-1/Anti-CTLA4 antibodies and shorter survival. Cancer Immunol. Immunother. 2021, 70, 2009–2021. [Google Scholar] [CrossRef] [PubMed]
- Mimura, K.; Teh, J.L.; Okayama, H.; Shiraishi, K.; Kua, L.F.; Koh, V.; Smoot, D.T.; Ashktorab, H.; Oike, T.; Suzuki, Y.; et al. PD-L1 expression is mainly regulated by interferon gamma associated with JAK-STAT pathway in gastric cancer. Cancer Sci. 2018, 109, 43–53. [Google Scholar] [CrossRef]
- Parra, E.R.; Behrens, C.; Rodriguez-Canales, J.; Lin, H.; Mino, B.; Blando, J.; Zhang, J.; Gibbons, D.L.; Heymach, J.V.; Sepesi, B.; et al. Image Analysis-based Assessment of PD-L1 and Tumor-Associated Immune Cells Density Supports Distinct Intratumoral Microenvironment Groups in Non-small Cell Lung Carcinoma Patients. Clin. Cancer Res. 2016, 22, 6278–6289. [Google Scholar] [CrossRef] [Green Version]
- Imai, H.; Kishikawa, T.; Minemura, H.; Yamada, Y.; Ibe, T.; Mori, K.; Yamaguchi, O.; Mouri, A.; Hamamoto, Y.; Kanazawa, K.; et al. Post-Progression Survival Influences Overall Survival among Patients with Advanced Non-Small Cell Lung Cancer Undergoing First-Line Pembrolizumab Monotherapy. Oncology 2021, 99, 562–570. [Google Scholar] [CrossRef] [PubMed]
- Kobayashi, T.; Ito, K.; Kojima, T.; Kato, M.; Kanda, S.; Hatakeyama, S.; Matsui, Y.; Matsushita, Y.; Naito, S.; Shiga, M.; et al. Risk stratification for the prognosis of patients with chemoresistant urothelial cancer treated with pembrolizumab. Cancer Sci. 2021, 112, 760–773. [Google Scholar] [CrossRef] [PubMed]
- Kobayashi, T.; Ito, K.; Kojima, T.; Maruyama, S.; Mukai, S.; Tsutsumi, M.; Miki, J.; Okuno, T.; Yoshio, Y.; Matsumoto, H.; et al. Pre-pembrolizumab neutrophil-to-lymphocyte ratio (NLR) predicts the efficacy of second-line pembrolizumab treatment in urothelial cancer regardless of the pre-chemo NLR. Cancer Immunol. Immunother. 2021. [Google Scholar] [CrossRef]
- Chen, D.S.; Mellman, I. Elements of cancer immunity and the cancer-immune set point. Nature 2017, 541, 321–330. [Google Scholar] [CrossRef]
- Herbst, R.S.; Soria, J.C.; Kowanetz, M.; Fine, G.D.; Hamid, O.; Gordon, M.S.; Sosman, J.A.; McDermott, D.F.; Powderly, J.D.; Gettinger, S.N.; et al. Predictive correlates of response to the anti-PD-L1 antibody MPDL3280A in cancer patients. Nature 2014, 515, 563–567. [Google Scholar] [CrossRef] [Green Version]
- Deng, B.; Park, J.H.; Ren, L.; Yew, P.Y.; Kiyotani, K.; Antic, T.; O’Connor, K.; O’Donnell, P.H.; Nakamura, Y. CD8 lymphocytes in tumors and nonsynonymous mutational load correlate with prognosis of bladder cancer patients treated with immune checkpoint inhibitors. Cancer Rep. 2018, 1, e1002. [Google Scholar] [CrossRef] [Green Version]
- Gandara, D.R.; von Pawel, J.; Mazieres, J.; Sullivan, R.; Helland, A.; Han, J.Y.; Ponce Aix, S.; Rittmeyer, A.; Barlesi, F.; Kubo, T.; et al. Atezolizumab Treatment Beyond Progression in Advanced NSCLC: Results From the Randomized, Phase III OAK Study. J. Thorac. Oncol. 2018, 13, 1906–1918. [Google Scholar] [CrossRef] [PubMed] [Green Version]
- Sharma, P.; Retz, M.; Siefker-Radtke, A.; Baron, A.; Necchi, A.; Bedke, J.; Plimack, E.R.; Vaena, D.; Grimm, M.-O.; Bracarda, S.; et al. Nivolumab in metastatic urothelial carcinoma after platinum therapy (CheckMate 275): A multicentre, single-arm, phase 2 trial. Lancet Oncol. 2017, 18, 312–322. [Google Scholar] [CrossRef]
- Higgs, B.W.; Morehouse, C.A.; Streicher, K.; Brohawn, P.Z.; Pilataxi, F.; Gupta, A.; Ranade, K. Interferon Gamma Messenger RNA Signature in Tumor Biopsies Predicts Outcomes in Patients with Non-Small Cell Lung Carcinoma or Urothelial Cancer Treated with Durvalumab. Clin. Cancer Res. 2018, 24, 3857–3866. [Google Scholar] [CrossRef] [PubMed] [Green Version]
- Zhang, S.; Kohli, K.; Black, R.G.; Yao, L.; Spadinger, S.M.; He, Q.; Pillarisetty, V.G.; Cranmer, L.D.; Van Tine, B.A.; Yee, C.; et al. Systemic Interferon-gamma Increases MHC Class I Expression and T-cell Infiltration in Cold Tumors: Results of a Phase 0 Clinical Trial. Cancer Immunol. Res. 2019, 7, 1237–1243. [Google Scholar] [CrossRef] [Green Version]
- Garris, C.S.; Arlauckas, S.P.; Kohler, R.H.; Trefny, M.P.; Garren, S.; Piot, C.; Engblom, C.; Pfirschke, C.; Siwicki, M.; Gungabeesoon, J.; et al. Successful Anti-PD-1 Cancer Immunotherapy Requires T Cell-Dendritic Cell Crosstalk Involving the Cytokines IFN-gamma and IL-12. Immunity 2018, 49, 1148–1161 e1147. [Google Scholar] [CrossRef] [Green Version]
- Yu, X.; Harden, K.; Gonzalez, L.C.; Francesco, M.; Chiang, E.; Irving, B.; Tom, I.; Ivelja, S.; Refino, C.J.; Clark, H.; et al. The surface protein TIGIT suppresses T cell activation by promoting the generation of mature immunoregulatory dendritic cells. Nat. Immunol. 2009, 10, 48–57. [Google Scholar] [CrossRef]
- Stanietsky, N.; Simic, H.; Arapovic, J.; Toporik, A.; Levy, O.; Novik, A.; Levine, Z.; Beiman, M.; Dassa, L.; Achdout, H.; et al. The interaction of TIGIT with PVR and PVRL2 inhibits human NK cell cytotoxicity. Proc. Natl. Acad. Sci. USA 2009, 106, 17858–17863. [Google Scholar] [CrossRef] [Green Version]
- Liu, Z.; Zhou, Q.; Wang, Z.; Zhang, H.; Zeng, H.; Huang, Q.; Chen, Y.; Jiang, W.; Lin, Z.; Qu, Y.; et al. Intratumoral TIGIT(+) CD8(+) T-cell infiltration determines poor prognosis and immune evasion in patients with muscle-invasive bladder cancer. J. Immunother. Cancer 2020, 8, e000978. [Google Scholar] [CrossRef] [PubMed]
- Johnston, R.J.; Comps-Agrar, L.; Hackney, J.; Yu, X.; Huseni, M.; Yang, Y.; Park, S.; Javinal, V.; Chiu, H.; Irving, B.; et al. The immunoreceptor TIGIT regulates antitumor and antiviral CD8(+) T cell effector function. Cancer Cell. 2014, 26, 923–937. [Google Scholar] [CrossRef] [Green Version]
- Liang, R.; Zhu, X.; Lan, T.; Ding, D.; Zheng, Z.; Chen, T.; Huang, Y.; Liu, J.; Yang, X.; Shao, J.; et al. TIGIT promotes CD8(+)T cells exhaustion and predicts poor prognosis of colorectal cancer. Cancer Immunol. Immunother. 2021, 70, 2781–2793. [Google Scholar] [CrossRef] [PubMed]
- Vuky, J.; Balar, A.V.; Castellano, D.; O’Donnell, P.H.; Grivas, P.; Bellmunt, J.; Powles, T.; Bajorin, D.; Hahn, N.M.; Savage, M.J.; et al. Long-Term Outcomes in KEYNOTE-052: Phase II Study Investigating First-Line Pembrolizumab in Cisplatin-Ineligible Patients With Locally Advanced or Metastatic Urothelial Cancer. J. Clin. Oncol. 2020, 38, 2658–2666. [Google Scholar] [CrossRef] [PubMed]
Publisher’s Note: MDPI stays neutral with regard to jurisdictional claims in published maps and institutional affiliations. |
© 2022 by the authors. Licensee MDPI, Basel, Switzerland. This article is an open access article distributed under the terms and conditions of the Creative Commons Attribution (CC BY) license (https://creativecommons.org/licenses/by/4.0/).