Article

Anticancer Activities of 9-chloro-6-(piperazin-1-yl)-11H-indeno[1,2-c] quinolin-11-one (SJ10) in Glioblastoma Multiforme (GBM) Chemoradioresistant Cell Cycle-Related Oncogenic Signatures

by
Ntlotlang Mokgautsi
1,2,†,
Yu-Cheng Kuo
3,4,†,
Sung-Ling Tang
5,
Feng-Cheng Liu
6,
Shiang-Jiun Chen
7,
Alexander T. H. Wu
8,9,10,11,* and
Hsu-Shan Huang
1,2,7,8,12,*
1
PhD Program for Cancer Molecular Biology and Drug Discovery, College of Medical Science and Technology, Taipei Medical University and Academia Sinica, Taipei 11031, Taiwan
2
Graduate Institute for Cancer Biology & Drug Discovery, College of Medical Science and Technology, Taipei Medical University, Taipei 11031, Taiwan
3
Department of Pharmacology, School of Medicine, College of Medicine, Taipei Medical University, Taipei 11031, Taiwan
4
School of Post-Baccalaureate Chinese Medicine, College of Chinese Medicine, China Medical University, Taichung 40402, Taiwan
5
Department of Pharmacy Practice, Tri-Service General Hospital, School of Pharmacy, National Defense Medical Center, Taipei 11490, Taiwan
6
Department of Rheumatology/Immunology and Allergy, Department of Medicine, Tri-Service General Hospital, National Defense Medical Center, Neihu Dist., Taipei City 114, Taiwan
7
School of Pharmacy, National Defense Medical Center, Taipei 11490, Taiwan
8
Graduate Institute of Medical Sciences, National Defense Medical Center, Taipei 11490, Taiwan
9
The PhD Program of Translational Medicine, College of Medical Science and Technology, Taipei Medical University, Taipei 11031, Taiwan
10
Clinical Research Center, Taipei Medical University Hospital, Taipei Medical University, Taipei 11031, Taiwan
11
TMU Research Center of Cancer Translational Medicine, Taipei Medical University, Taipei 11031, Taiwan
12
PhD Program in Drug Discovery and Development Industry, College of Pharmacy, Taipei Medical University, Taipei 11031, Taiwan
*
Authors to whom correspondence should be addressed.
These authors contributed equally to this work.
Cancers 2022, 14(1), 262; https://doi.org/10.3390/cancers14010262
Submission received: 12 October 2021 / Revised: 23 December 2021 / Accepted: 29 December 2021 / Published: 5 January 2022

Abstract

:

Simple Summary

Glioblastoma multiforme (GBM) remains to be the most frequent malignant tumor of the central nervous system (CNS), which accounts for approximately 54% of all primary brain gliomas. Current treatment modalities for GBM include surgical resection, followed by radiotherapy and chemotherapy with temozolomide (TMZ). However, due to its genetic heterogeneity, GBM tumors always recur, due to treatment reasistance. The aim of this study was to identify molecular gene signatures, responsible for cancer initiation, progression, resistances and to treatment, metastasis, and also evaluate the potency of our novel compounds SJ10 as potential target for CCNB1/CDC42/MAPK7/CD44 oncogenic signatures. Accordingly, we used computational simulation and identify these signatures as regulators of the cell cycle in GBM, which leads to cancer development and metastasis. We also showed the antiproliferative and cytotoxic effects of SJ10 compound against a panel of NCI-60 cancer cell lines. This suggests the potential of the compounds to inhibit CCNB1/CDC42/MAPK7/CD44 in GBM.

Abstract

Current anticancer treatments are inefficient against glioblastoma multiforme (GBM), which remains one of the most aggressive and lethal cancers. Evidence has shown the presence of glioblastoma stem cells (GSCs), which are chemoradioresistant and associated with high invasive capabilities in normal brain tissues. Moreover, accumulating studies have indicated that radiotherapy contributes to abnormalities in cell cycle checkpoints, including the G1/S and S phases, which may potentially lead to resistance to radiation. Through computational simulations using bioinformatics, we identified several GBM oncogenes that are involved in regulating the cell cycle. Cyclin B1 (CCNB1) is one of the cell cycle-related genes that was found to be upregulated in GBM. Overexpression of CCNB1 was demonstrated to be associated with higher grades, proliferation, and metastasis of GBM. Additionally, increased expression levels of CCNB1 were reported to regulate activation of mitogen-activated protein kinase 7 (MAPK7) in the G2/M phase, which consequently modulates mitosis; additionally, in clinical settings, MAPK7 was demonstrated to promote resistance to temozolomide (TMZ) and poor patient survival. Therefore, MAPK7 is a potential novel drug target due to its dysregulation and association with TMZ resistance in GBM. Herein, we identified MAPK7/extracellular regulated kinase 5 (ERK5) genes as being overexpressed in GBM tumors compared to normal tissues. Moreover, our analysis revealed increased levels of the cell division control protein homolog (CDC42), a protein which is also involved in regulating the cell cycle through the G1 phase in GBM tissues. This therefore suggests crosstalk among CCNB1/CDC42/MAPK7/cluster of differentiation 44 (CD44) oncogenic signatures in GBM through the cell cycle. We further evaluated a newly synthesized small molecule, SJ10, as a potential target agent of the CCNB1/CDC42/MAPK7/CD44 genes through target prediction tools and found that SJ10 was indeed a target compound for the above-mentioned genes; in addition, it displayed inhibitory activities against these oncogenes as observed from molecular docking analysis.

1. Introduction

Glioblastoma multiforme (GBM) is one of the most frequent malignant tumors of the central nervous system (CNS) [1,2], which accounts for approximately 54% of all primary brain gliomas, with a yearly incidence of 3.2 per 100,000 adults globally [3,4], and is classified as grade IV by the World Health Organization (WHO) [5]. It is associated with poor clinical outcomes, with fewer than 10% of patients reaching a 5-year survival rate after diagnosis [6,7]. The current treatment modalities for GBM include surgical resection, followed by radiotherapy and chemotherapy with temozolomide (TMZ) [8,9,10]. However, due to genetic heterogeneity, GBM tumors always recur mainly at the resection site, leading to an overall median survival of only 15 months following the initial diagnosis [5,11]. Therefore, understanding molecular mechanisms and invasive characteristics of GBM is pivotal as an essential strategy for developing more-effective therapeutics. Resistance to treatment in GBM is also associated with glioblastoma stem cells (GSCs), which may potentially assist GBM cancer cells to escape irradiation [11,12,13]. Studies showed that GCSs are resistant to TMZ chemotherapy, thus promoting radio resistance through DNA damage response activation [11].
One of the stem cell markers that is commonly expressed in various cancer types, including GBM is cluster of differentiation 44 (CD44), a surface adhesion receptor which promotes cancer progression and metastasis [14]; its expression in GBM cells is also crucial for GBM invasion and migration [15]. CD44-expressing cells were shown to escape exogenous DNA damage from radiation-induced double-stranded breaks (DSBs); it ultimately promoted tumor recurrence and resistance to radiation [16]. Moreover, accumulating studies indicated that radiotherapy contributes to abnormalities in cell cycle checkpoints, including the G1/S and S phases, which may potentially lead to resistance to radiation [17,18]. Cyclin B1 (CCNB1) is one of the cell cycle-related genes that was reported to be a potential biomarker in GBM [19,20]. Overexpression of CCNB1 was demonstrated to be associated with higher grades, proliferation, and metastasis of GBM [21]. Additionally, CCNB1 was shown to regulate cell mitosis at the G2/M phase through interacting with cyclin-dependent kinase 1 (CDK1) [22]. Thus, CCNB1/CDK1 may be potential diagnostic and prognostic markers of GBM [23,24,25].
Mitogen-activated protein kinase 7 (MAPK7) is a member of MAPKs, which regulate signaling transduction cascades [26] and are associated with multiple cellular processes, such as cell proliferation and survival [27,28]. High expression levels of MAPK7 were identified in GMB tumors compared to adjacent normal brain tissues. In clinical settings, MAPK7 promotes resistance to TMZ and poor patient survival; however, its role in GBM still remains to be further investigated [29]. Increased expression levels of CCNB1 were reported to regulate activation of MAPK7 in the G2/M phase, which consequently modulates mitosis [28]. Therefore, MAPK7 is a potential novel drug target due to its dysregulation and association with TMZ resistance in GBM [30,31,32]. Moreover, cell division control protein 42 homolog (CDC42) is a protein which is also involved in regulating the cell cycle through the G1 phase. Overexpression of CDC42 in GBM was demonstrated to promote tumor cell invasion and migration; additionally, CDC42 was associated with low survival rates and drug resistance in GBM patients [33,34]. This therefore suggests crosstalk among CCNB1/CDC42/MAPK7/CD44 oncogenic signatures in GBM through the cell cycle.
Integrated bioinformatics analyses have been extensively applied in the early stages of drug discovery and development and have significantly accelerated the process, as well as reduced costs. Computational simulation approaches and molecular structural analyses of ligand-protein interactions have contributed to the identification and prediction of novel diagnostic and prognostic biomarkers in cancer research [35,36]. In this study, we explored Microarray Data Extraction and predicted overexpressed and downregulated genes in GBM tumors; moreover, we utilized online prediction tools to further identify and validate expressions of our genes of interest, the CCNB1/MAPK7/CDC42/CD44 oncogenes and also predicted patients’ clinical outcomes in GBM under the same settings. To date, only bevacizumab, everolimus and TMZ are the common FDA-approved drugs for brain tumor treatment [37]. Fortunately, with our innovative lab techniques, as mentioned in previous preliminary studies in drug discovery [38,39], we synthesized 9-chloro-6-(piperazin-1-yl)-11H-indeno[1,2-c]quinolin-11-one (SJ10), a quinolone and piperazine derivative, with anticancer activities (Figure 1). In addition to our earlier studies, quinoline derivatives were demonstrated to possess anticancer activities by inducing DNA double-strand breaks and apoptosis [39,40]. Therefore, in this study, we performed drug target predictions and identified CCNB1/MAPK7/CDC42/CD44 oncogenic signatures as potential drug candidates of SJ10, and further performed ligand-protein binding simulations using in silico molecular docking, which validated CCNB1/MAPK7/CDC42/CD44 as druggable candidates of SJ10. The antiproliferative and cytotoxic effects of SJ10 were evaluated in vitro using the US National Cancer Institute (NCI)-60 central nervous system (CNS) cell lines to determine responses of single-dose and dose-dependent treatments with SJ10 [41].

2. Material and Methods

2.1. Dataset Collection

Gene expression profiles (GEPs) from GBM patient samples were downloaded from the Gene Expression Omnibus (GEO) database (http://www.ncbi.nlm.nih.gov/gds/, accessed on 4 August 2021), an international public repository for high-throughput microarray data [42]. (3) different expression profile datasets obtained, viz., GSE4290, GSE68848 and GSE30563 were further analyzed using GEO2R (https://www.ncbi.nlm.nih.gov/geo/geo2r/, accessed on 4 August 2021), an interactive online platform to identify differentially expressed genes (DEGs) [43], which was used to identify DEGs between GBM tumor samples and normal samples. The Benjamini–Hochberg adjustment was made to p values (adj. p) to control the false discovery rate (FDR) and maintain the balance between the possibility of false-positives and the detection of significant genes. The fold-change (FC) threshold was set to 1.5, and adj. p < 0.05 was considered statistically significant. Venn diagrams were constructed using the Bioinformatics & Evolutionary Genomics (BEG) online tool (http://bioinformatics.psb.ugent.be/webtools/Venn/, accessed on 4 August 2021).

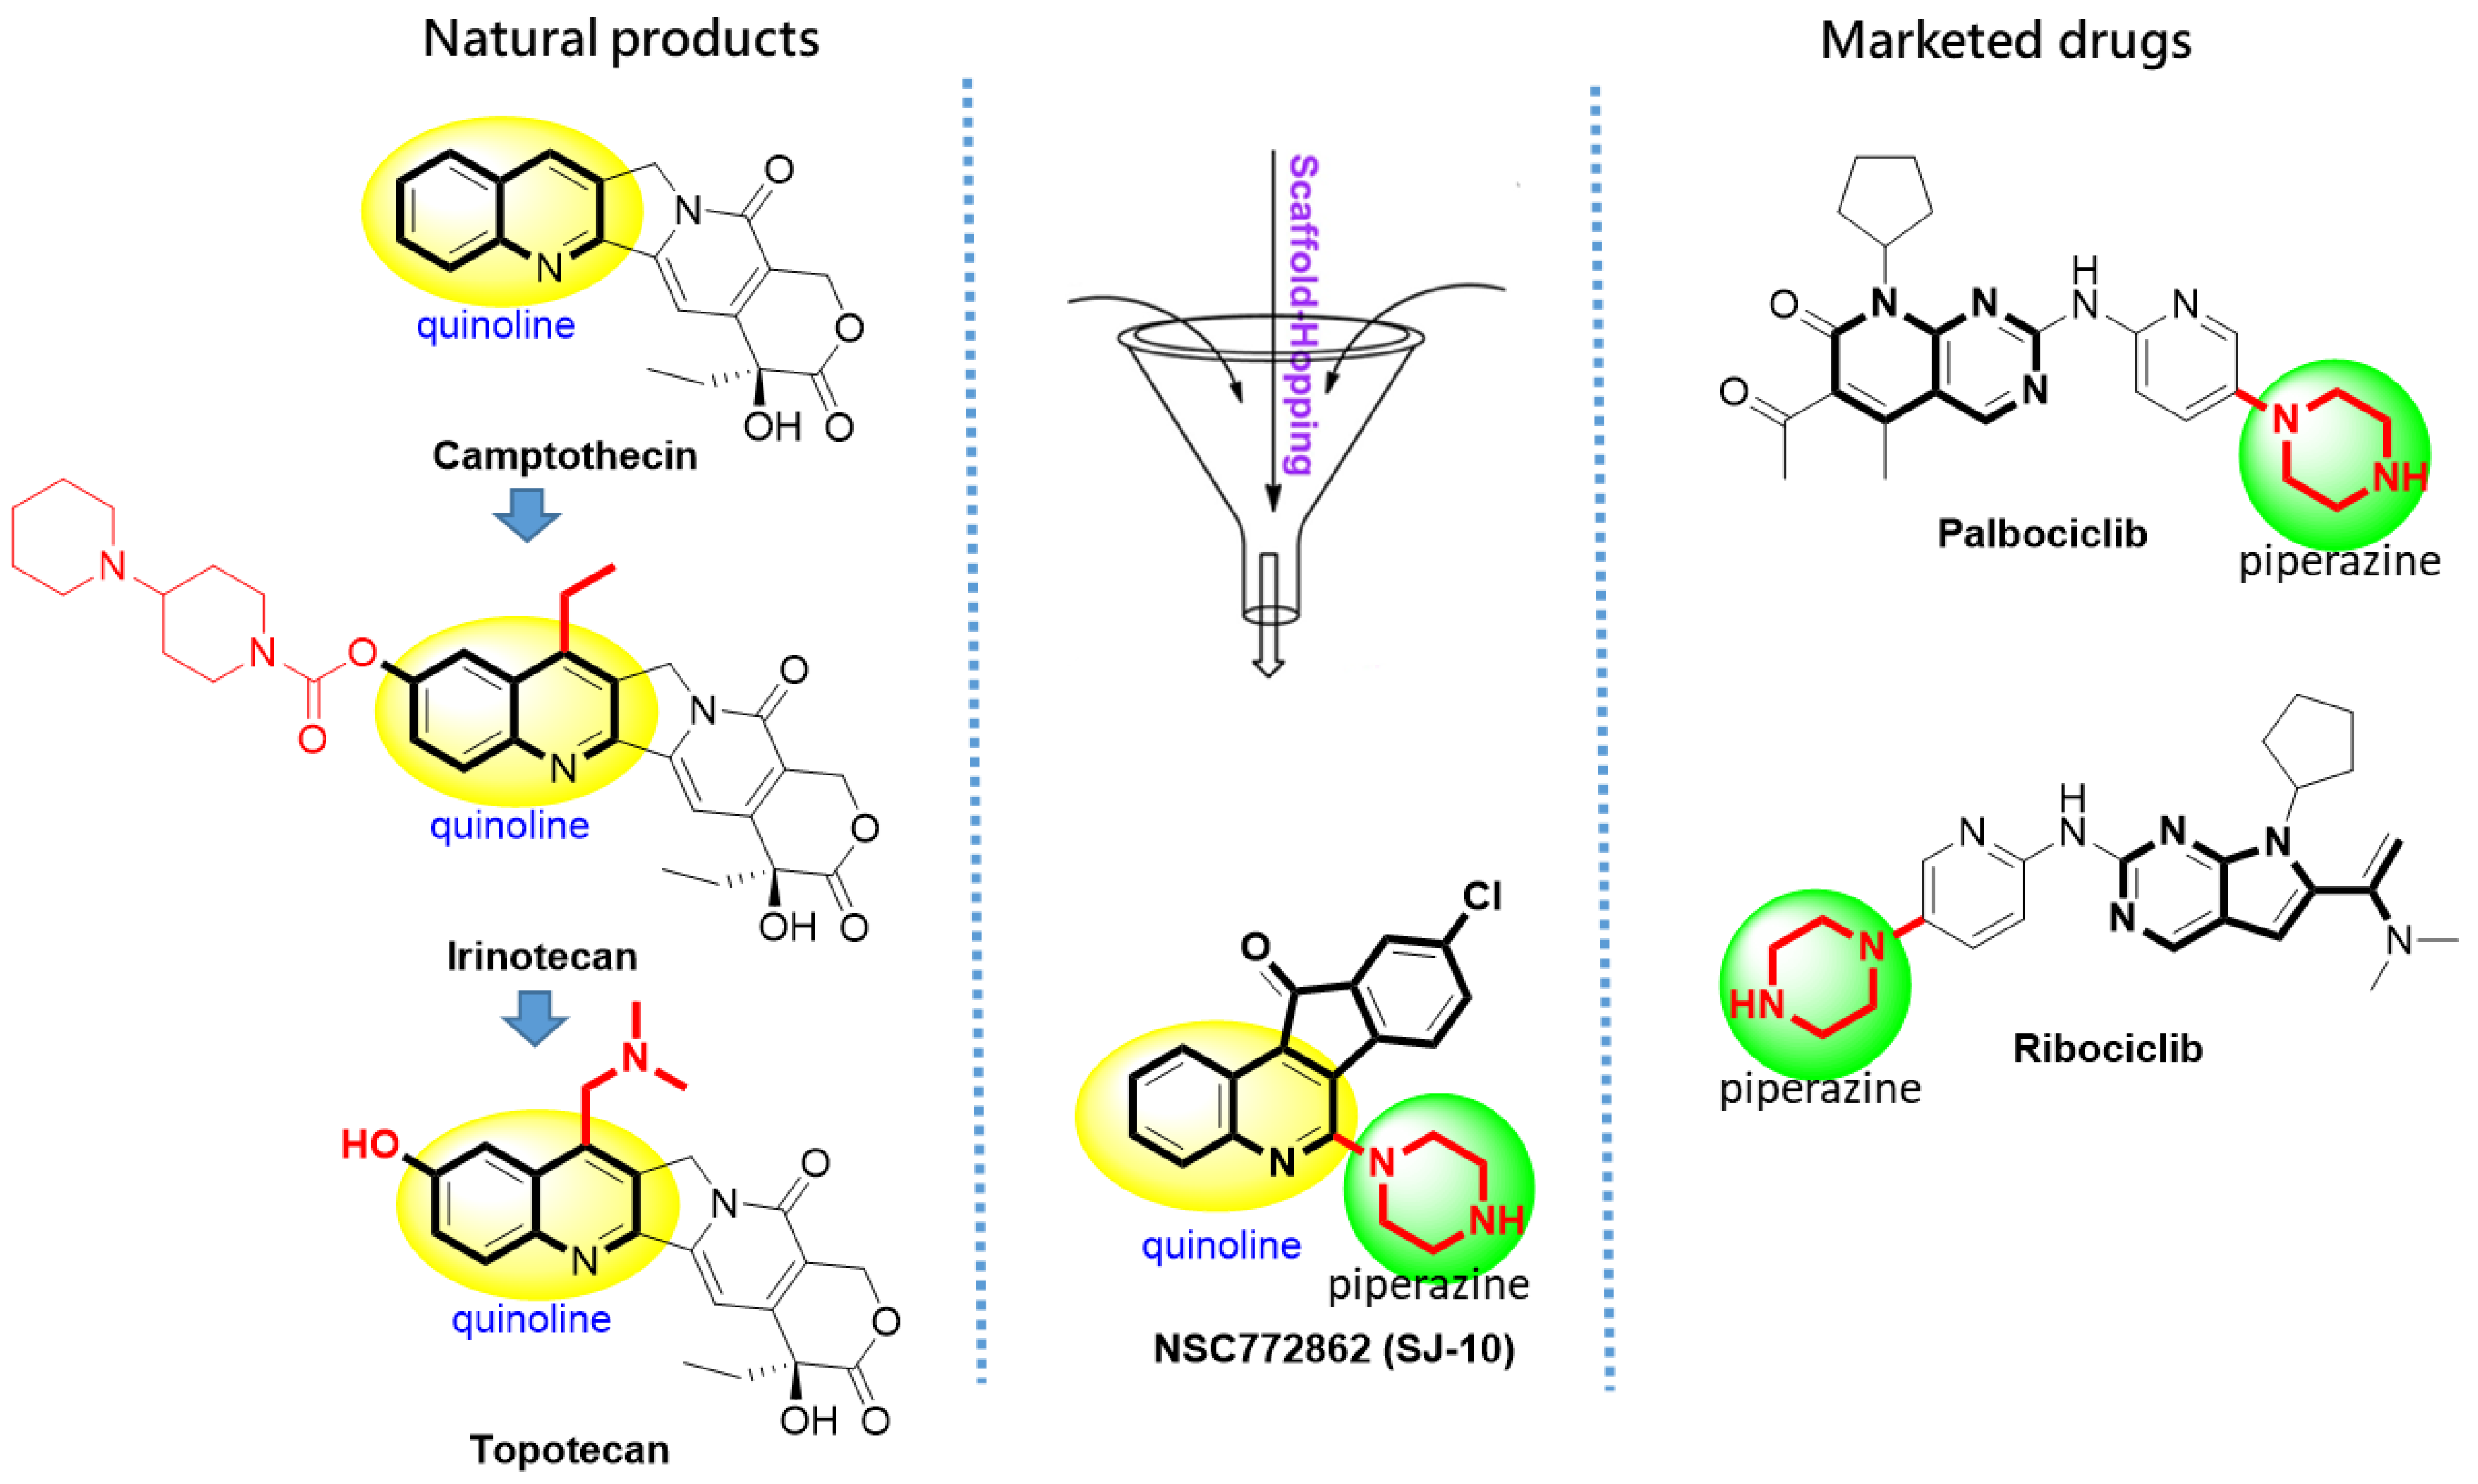
2.2. Identifying Molecular Targets and Therapeutic Classes of SJ10

Potential SJ10 target genes were predicted using an open-source web tool based on the Prediction of Biological Activity Spectra (PASS) [44] (http://www.way2drug.com/passonline/predict.php, accessed on 17 August 2021). In addition, we explored the Swiss target prediction tool (http://www.swisstargetprediction.ch/, accessed on 17 August 2021), a web-based algorithm that uses the principle of similarity to predict drug targets of bioactive small molecules [45,46] as an independent tool to further validate the predicted potential target genes of SJ10 (Table 1).

2.3. DEG Identification by the Tumor Immune Estimation Resource (TIMER)

Expression profiles of genes showing differential expression between GBM tumor and adjacent non-tumor tissues in The Cancer Genome Atlas (TCGA) database were analyzed with TIMER (https://cistrome.shinyapps.io/timer/, accessed on 9 August 2021), a web-based tool for the analysis of interactions between genes of interest and immune cells. The relative gene expression level is indicated as transcripts per million (TPM) and the expression value was normalized by log transformation. Moreover, we explored the Chinese Glioma Genome Atlas (CGGA) (http://www.cgga.org.cn/index.jsp, accessed on 16 August 2021) to analyze gene expression correlations between the two datasets into positive and negative correlations, with positive Pearson correlation coefficients and p < 0.05 considered statistically significant.

2.4. Validation of DEGs in GBM

To validate expression levels of identified DEGs in GBM, we explored the Human Protein Atlas (HPA) database for immunohistochemistry (IHC) (https://www.proteinatlas.org/, accessed on 13 September 2021) to compare expression levels between tumor samples and normal samples. The HPA database represents the protein expression in 44 major human tissues and some cancer tissues by IHC [47]. Statistical analyses were performed using the statistical package for social sciences (SPSS) vers. 21.0 (Chicago, IL, USA) and the p value was determined using the Mann–Whitney U-test. Moreover, for further analysis, the predicted genes were validated by an independent bioinformatics tool, the CGGA [48].

2.5. Protein-Protein Interaction (PPI) Network Construction and Functional Enrichment Analysis

To assess PPIs, we used the search tool for the Retrieval of Interacting Genes/Proteins database (STRING, https://string-db.org/, accessed on 21 September 2021), a web tool developed to analyze interactions of PPIs, such as physical and functional associations [49]. Functional enrichments with the clustering network were also retrieved from the STRING analysis, and they included gene ontology (GO) involving biological processes (BPs) and Kyoto Encyclopedia of Genes and Genomes (KEGG) pathways, with p < 0.05 considered significant. For further analysis, we used Network Analyst (https://www.networkanalyst.ca/, accessed on 21 September 2021), a web-based visual analytics platform for comprehensive gene and protein expression profiling [50,51]. In this platform, we used the SIGnaling Network Open Resource (SIGNOR 2.0) and selected the BP database to analyze enriched co-expressed genes.

2.6. Predictions of Patient Clinical Outcomes with Radiomics Signature Construction

To predict prognostic outcomes in GBM, radiomics signatures were constructed using the GlioVis database (http://gliovis.bioinfo.cnio.es/, accessed on 28 August 2021), an online portal used for analysis of brain tumor expression [52]. The distribution of radscores and maximally selected rank statistics of DEGs were used to determine the optimum cutoff values for the CCNB1, CDC42, MAPK7, and CD44 oncogenes, in order to evaluate overall survival (OS).

2.7. Receiver Operating Characteristic (ROC) Curves and Kaplan-Meier (KM) Analyses Were Used to Validate the Prognostic Values of the CCNB1, CDC42, MAPK7, and CD44 Oncogenic Signatures in GBM Samples

To evaluate and validate the diagnostic and prognostic significance of CCNB1, CDC42, MAPK7, and CD44 in GBM patients, we used ROC curve, which was retrieved from (https://kmplot.com/analysis/, accessed on 1 September 2021), and further explored the GlioVis database for the KM analysis. The ROC curve was based on true positive (sensitivity) and false positive (specificity) rates in GBM patients. We evaluated whether the test measurement had a specific condition. We assessed the area under the curve (AUC), and an AUC of 0.5 indicated no discrimination, while an AUC of 1.0 indicated discrimination of the curve that includes all possible decision thresholds from a diagnostic test result, which were patients who experienced disease onset and individuals who did not.

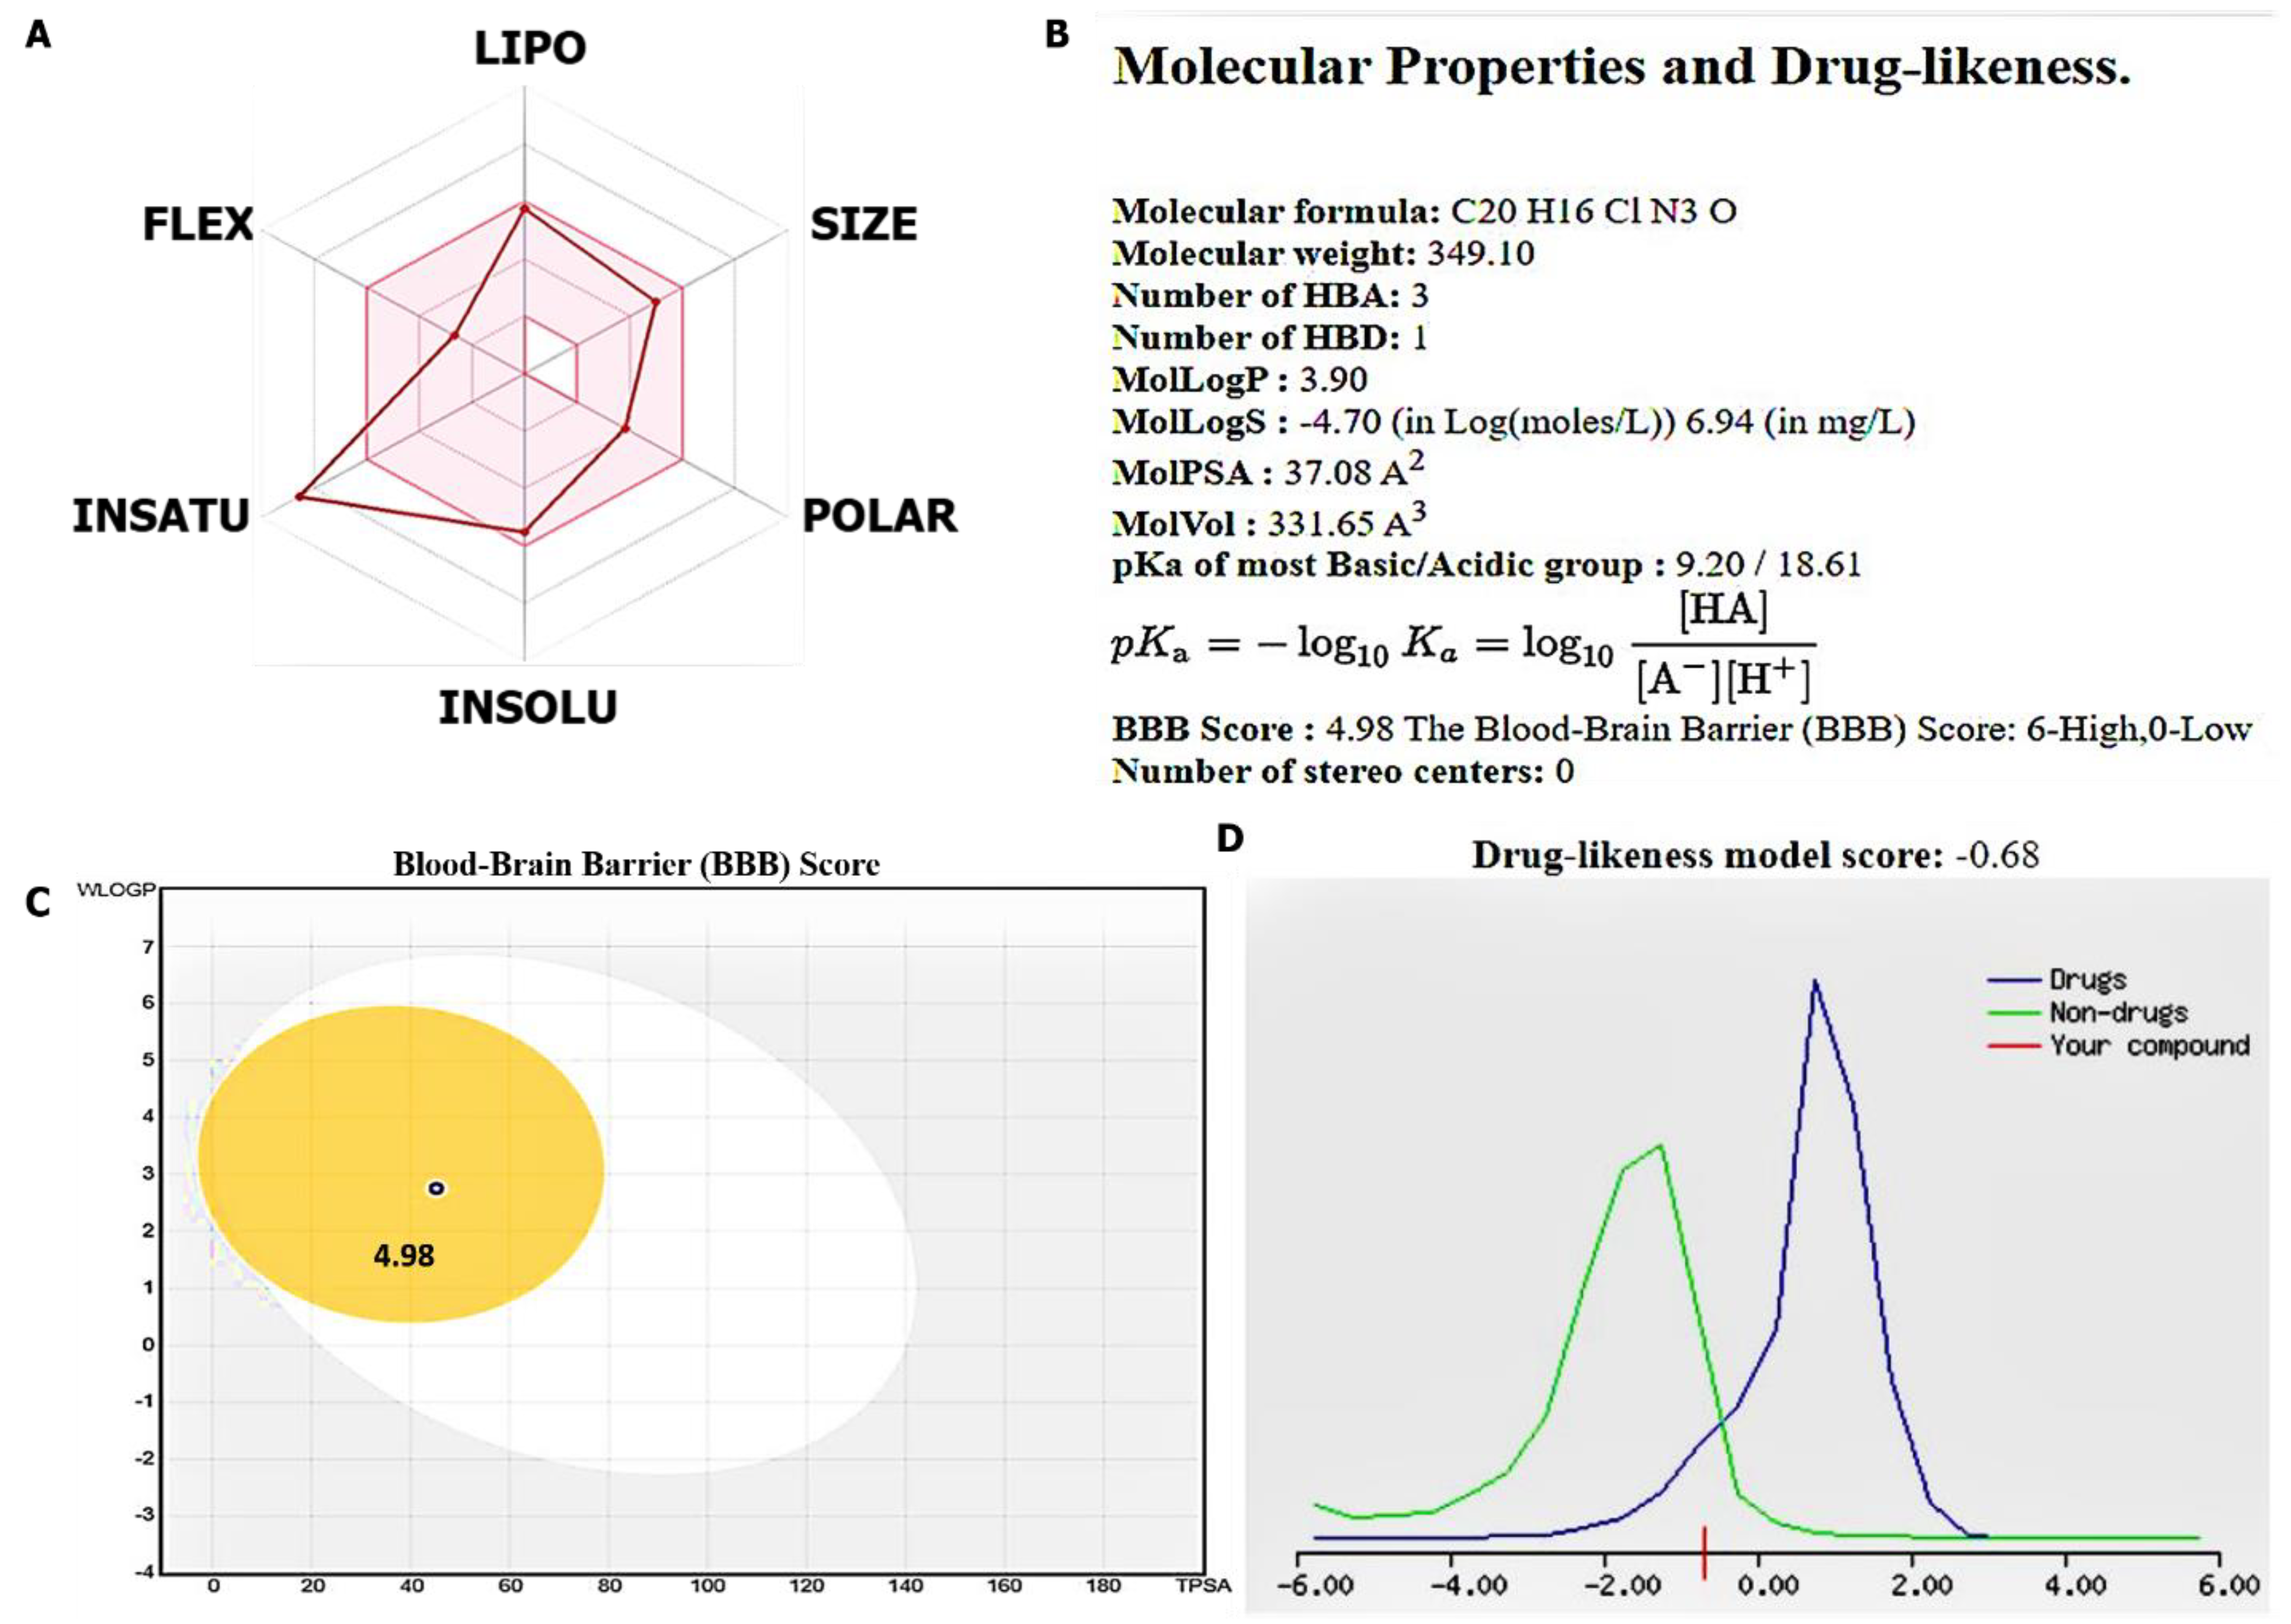
2.8. Evaluation of Drug Likeness, Pharmacokinetics (PKs), and Medicinal Chemistry of SJ10

Identifying novel and potential drug candidates in the early stage of drug discovery and development is crucial, as it reduces time and costs; herein, we applied the drug-likeness concept based on specific criteria [53,54]. We explored the SwissADME algorithm developed by the Swiss Institute of Bioinformatics (http://www.swissadme.ch/index.php, accessed on 2 September 2021), and molecular in silico (molsoft) tools (https://molsoft.com/mprop/, accessed on 2 September 2021), to evaluate the PKs, drug likeness, medicinal chemistry friendliness, adsorption, distribution, metabolism, excretion, and toxicity (ADMET) properties of SJ10 [55,56]. We analyzed the drug-likeness properties according to the Lipinski (Pfizer) rule-of-five), Ghose (Amgen), Veber (GSK), and Egan (Pharmacia), and further showed relationships between PK and physicochemical properties [57]. Moreover, we analyzed the gastrointestinal absorption (GIA) and brain-penetration properties using the brain or intestinal estimated permeation (BOILED-Egg) model [58]. The Abbot Bioavailability Score was determined based on the probability of the compound having at least 10% oral bioavailability in rats or measurable Caco-2 permeability [59].

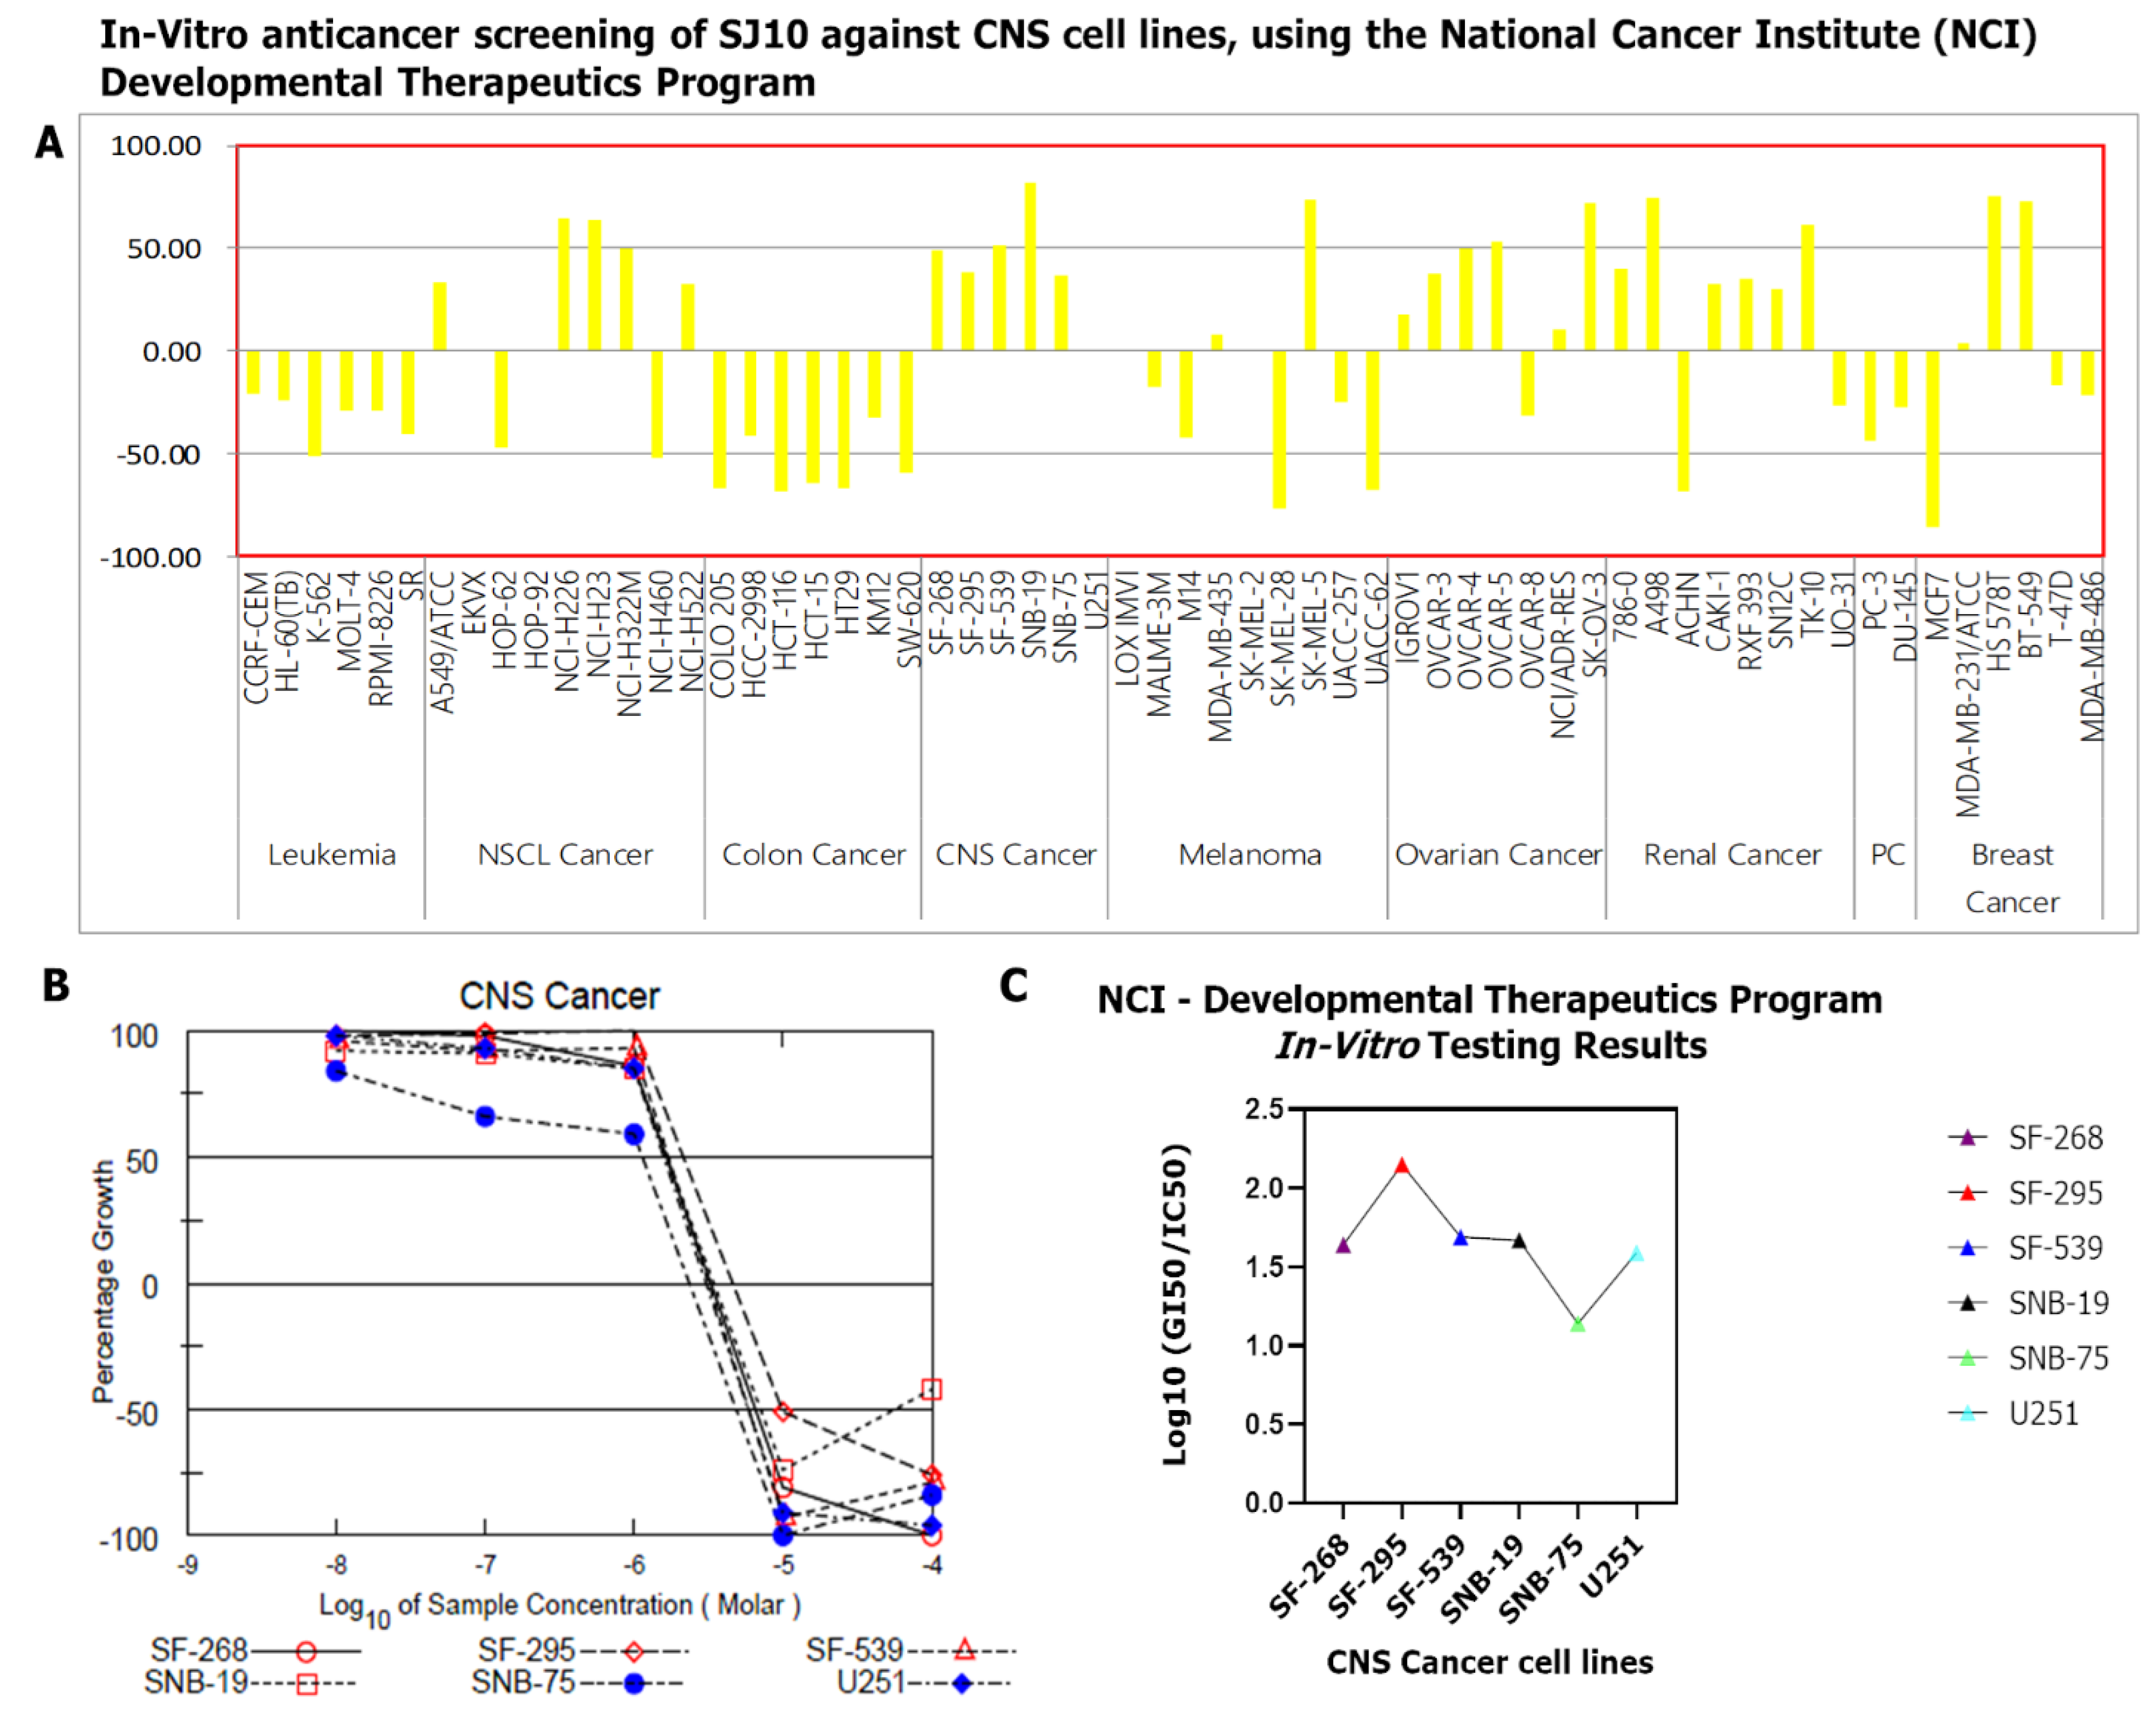
2.9. In Vitro Anticancer Screening of SJ10 against NC1-60 CNS Cells

SJ10 was submitted to the National Cancer Institute (NCI)-Development Therapeutics Program (DTP) to be screened for potential antiproliferative and cytotoxic effects against a panel of NCI-60 CNS cell lines, in agreement with the outlined protocol of the NCI (https://dtp.cancer.gov/, accessed on 11 September 2021). The compound was tested at an initial dose of 10 μM. Results showed that SJ10 exhibited antiproliferative activities against CNS cell lines.

2.10. Molecular Docking Analysis

Receptor-ligand interactions were predicted using a molecular docking analysis, a technique used to predict the predominant binding ability of a ligand with a protein’s three-dimensional (3D) structure [60]. To assess possible interactions of SJ10 with target genes predicted and selected from the Swiss-target and PASS prediction tools, we performed a docking analysis of SJ10 with the CCNB1, CDC42, MAPK7, and CD44 oncogenes. For further analysis, we used the Food and Drug Administration (FDA)-approved standard inhibitors of CDC42 and MAPK of CASIN and BAY-885, respectively. Accordingly, the 3D structure of SJ10 was assembled with the Avogadro molecular visualization tool [61], the 3D structures of CASIN (CID:2882155) and BAY-885 (CID:134128280) were downloaded from PubChem as SDF files, and the files were subsequently converted to PDB format using PyMol software (https://pymol.org/2/, accessed on 6 October 2021). In addition, the crystal structures of CCNB1 (PDB:2B9R), CDC42 (PDB: 2ODB), MAPK7 (PDB:4H3Q), and CD44 (PDB:1UUH) were downloaded from the Protein Data Bank (PDB). For further processing, we converted all PDB files to PDBQT file format using autodock software (http://autodock.scripps.edu/resources/adt, accessed on 6 October 2021) and, finally, performed docking. To visualize and interpret the docking results, we applied BIOVIA discovery studio software for analysis [62].

2.11. Statistical Analysis

Pearson’s correlations were used to assess correlations of CCNB1/CDC42/MAPK7/CD44 expressions in GBM cancer types. The statistical significance of DEGs was evaluated using the Wilcoxon test. * p < 0.05 was accepted as being statistically significant.

3. Results

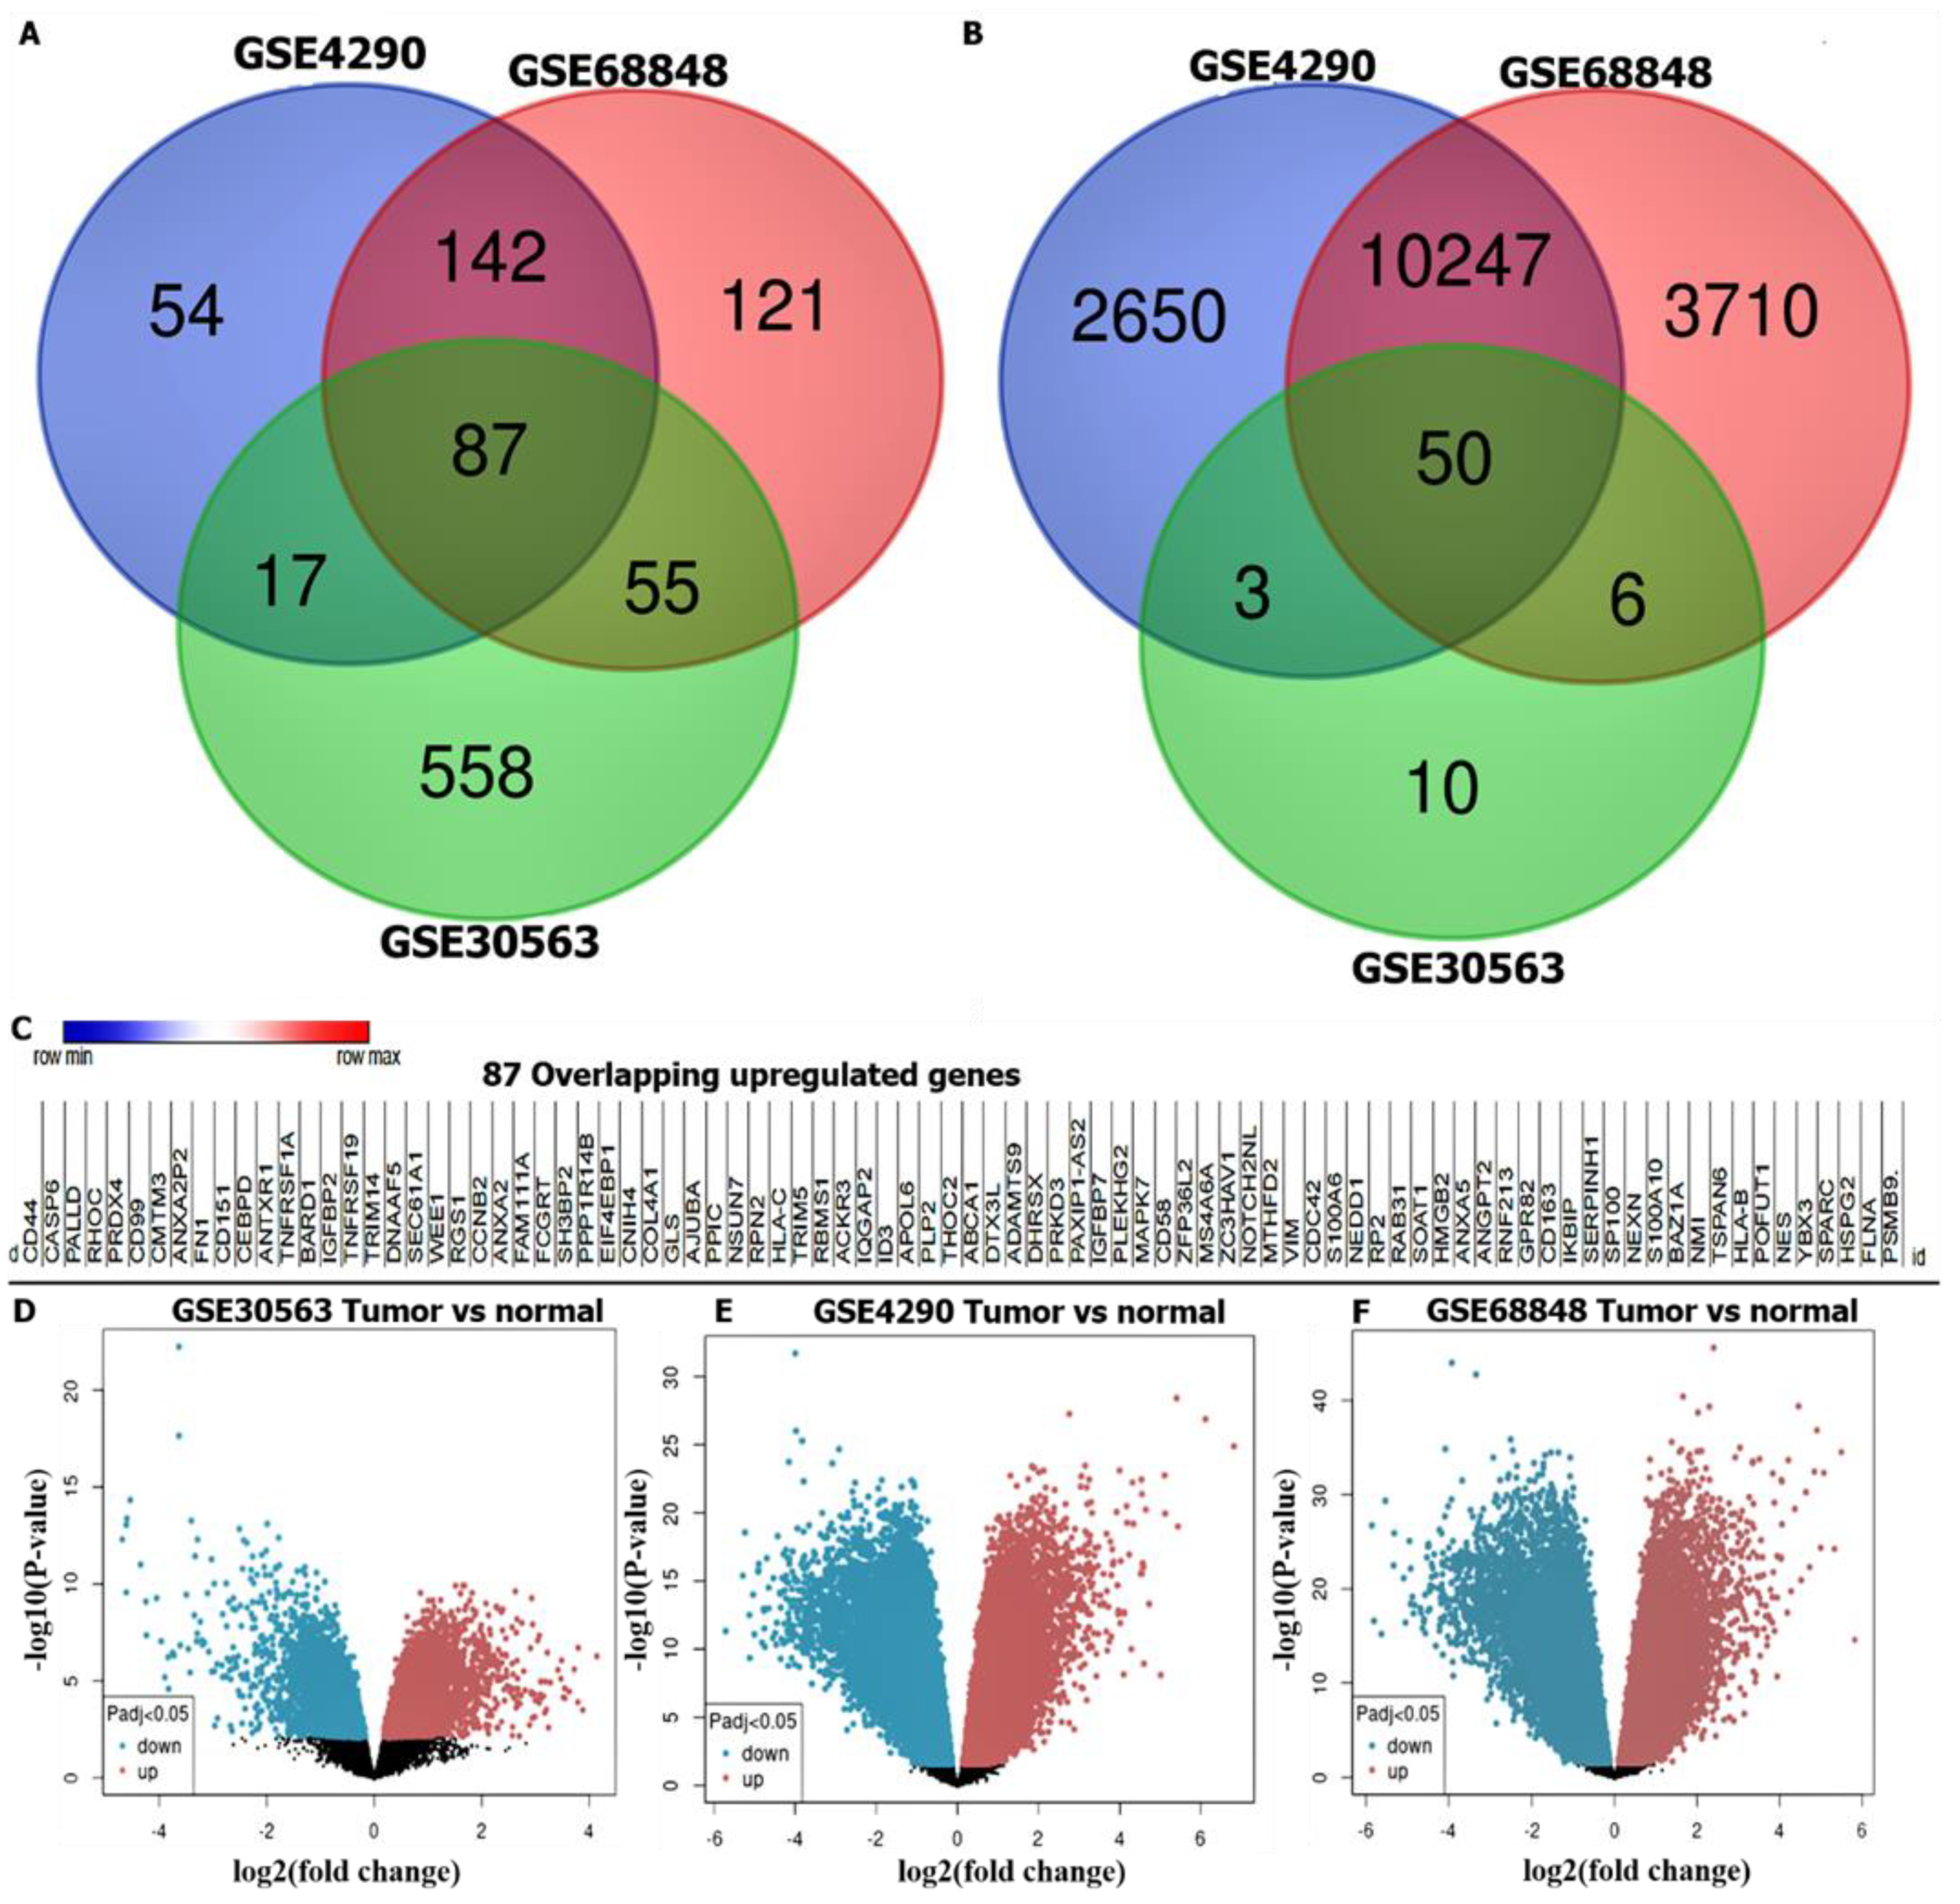
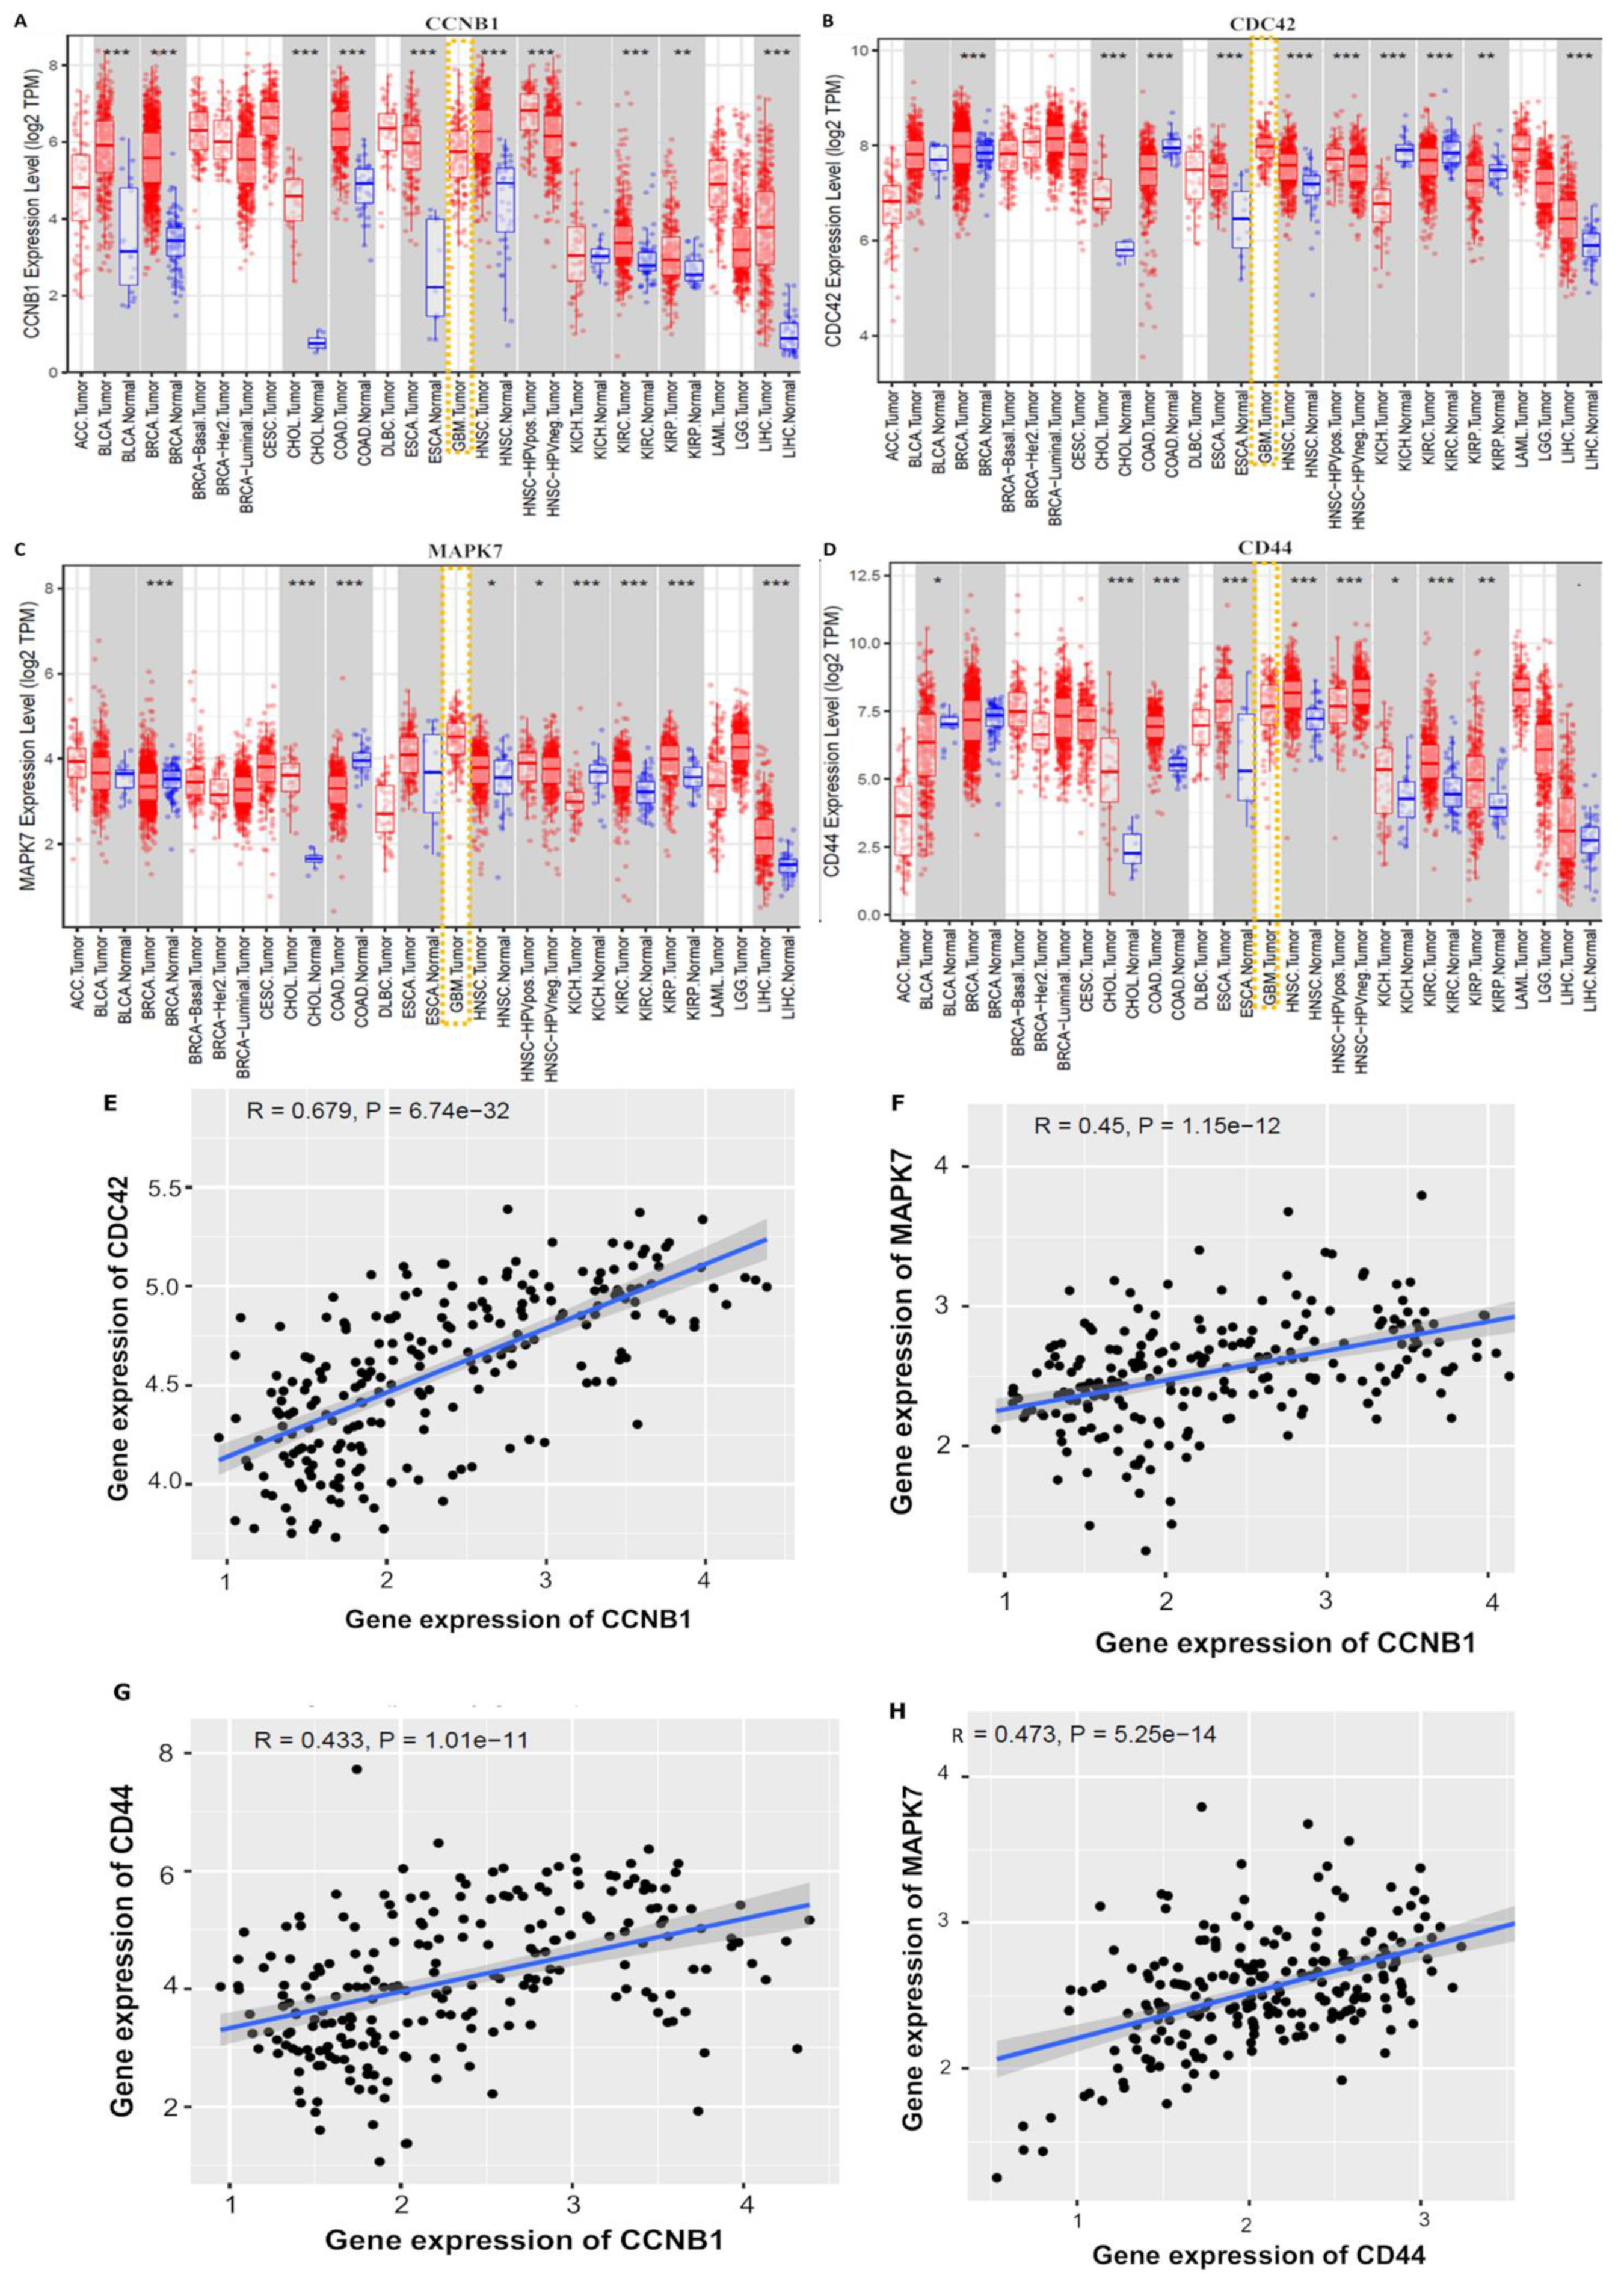
3.1. Identification of DEGs in GBM

Gene expression profiles (GEPs) from GBM samples and normal brain samples tallied from different studies were extracted from the microarray dataset. The analytical results showed that 100, 256, and 30 GBM samples and normal samples were, respectively, obtained from the GSE4290, GSE68846, and GSE30563 datasets. Further analysis with a Venn diagram demonstrated 87 overlapping upregulated genes from the three datasets (Figure 2A) and 50 overlapping downregulated genes from the same database (Figure 2B). Moreover, Figure 1 is the heatmap of overexpressed overlapping genes. Figure 2D–F shows volcano plots of GBM tumor samples compared to normal samples, the volcano plot revealed the statistical significance of the difference between tumor and normal samples through −10 log and −2 log fold change, respectively. The p-value in the volcano plot was used to indicate threshold indicators for adjusted p-values, which was further used to show all the genes that are statistically differentially-expressed with an adjusted p value threshold of 0.05 considered significant.

3.2. Evaluation of Drug Likeness, PKs, and Medicinal Chemistry of the SJ10 Compou

We explored the SwissADME algorithm developed by the Swiss Institute of Bioinformatics and molecule in silico (molsoft) to evaluate the PKs, drug likeness, medicinal chemistry friendliness, adsorption, distribution, metabolism, excretion, and toxicity (ADMET) properties of SJ10 [55,56]. We analyzed the drug-likeness properties according to the Lipinski (Pfizer) rule-of-five)), Ghose (Amgen), Veber (GSK), and Egan (Pharmacia), and further showed relationships between the PK and physicochemical properties [57]. Moreover, we analyzed the GIA and brain-penetration properties, using the brain or intestinal estimated permeation (BOILED-Egg) model [58]. The Abbot Bioavailability Score was determined based on the probability of the compound having at least 10% oral bioavailability in rats or measurable Caco-2 permeability [59] (Figure 3).

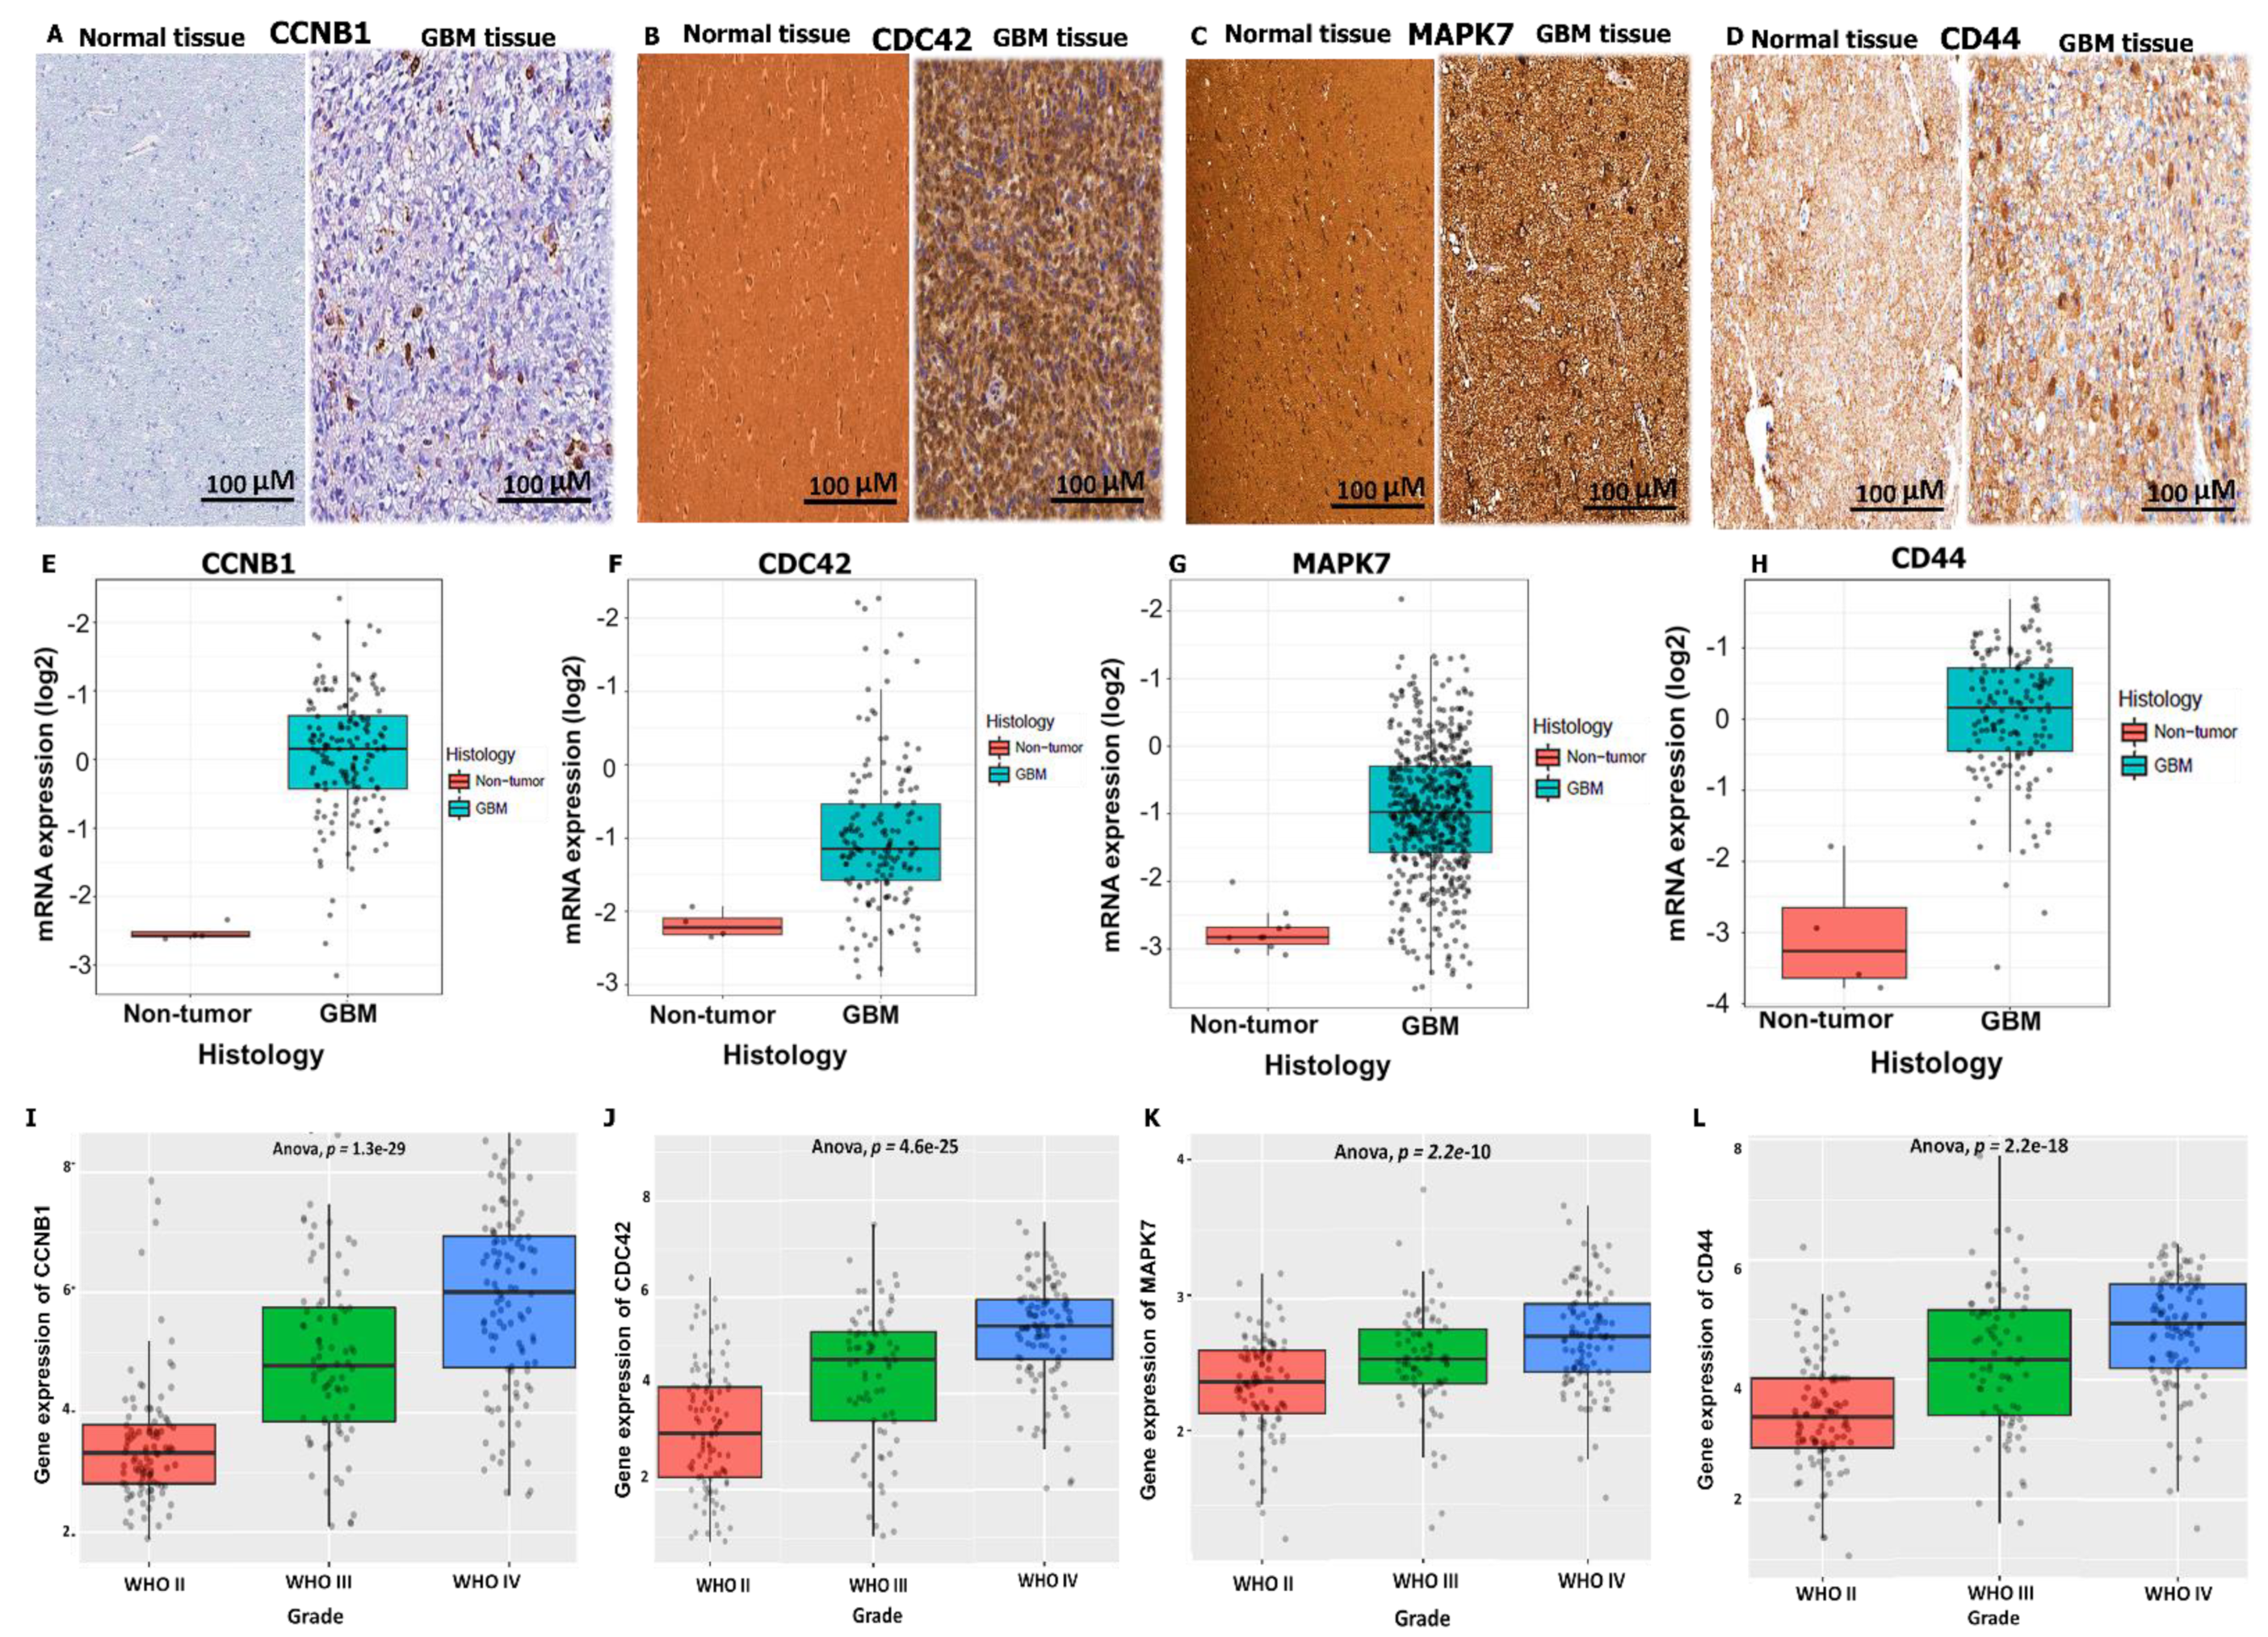
3.3. CCNB1/CDC42/MAPK7/CD44 Oncogenic Signatures Are Overexpressed in GBM

A bioinformatics analysis through TIMER online web tool with default settings showed significantly increased messenger (m)RNA levels of CCNB1/CDC42/MAPK7/CD44 in pan cancers, including GBM tumor tissues compared to normal tissues from TCGA) (Figure 4A–D). Relative gene expression levels are indicated as transcripts per million (TPM) and the expression value was normalized by log transformation of the statistical significance, as evaluated by the Wilcoxon test, with p value significant codes: 0 ≤ *** < 0.001 ≤ ** < 0.01 ≤ * < 0.05 ≤ . < 0.1. We further explored the CGGA tool with default settings to investigate correlations among the CCNB1/CDC42/MAPK7/CD44 oncogenes. When all four genes were combined for analysis, the predicted results showed positive correlations ranging r = 0.43~0.67 of CCNB1 with CDC42, CCNB1 with MAPK7, CCNB1 with CD44, and MAPK7 with CD44 in GBM patients (Figure 4E–H), with positive Pearson correlation coefficients and p < 0.05 considered statistically significant.

3.4. Validation of CCNB1/CDC42/MAPK7/CD44 Oncogenic Signature Expressions in GBM

To validate expression levels of the CCNB1/CDC42/MAPK7/CD44 gene signatures in GBM, we explored the HPA database for IHC to compare gene expression levels between GBM tumor tissues and normal samples. CCNB1 displayed medium staining, with strong intensity and quantity (25%) (Figure 5A), while CDC42 displayed medium staining, with moderate intensity and quantity (75%) (Figure 5B), and MAPK7 and CD44 displayed high staining with strong intensity and quantity (75%) (Figure 5C,D) in GBM tissues as compared to normal tissues. For further analysis, the GlioVis database showed increased mRNA expression levels of CCNB1/CDC42/MAPK7/CD44 oncogenes in GBM tissues compared to non-tumor tissues (Figure 5E–H). In addition, we explored the CGGA, an independent glioma database, and validated expressions of the CCNB1/CDC42/MAPK7/CD44 gene signatures in WHO grade II, III, and IV GBM tumors using the Analysis of variance (ANOVA) (Figure 5I–L), with p < 0.05 considered statistically significant.

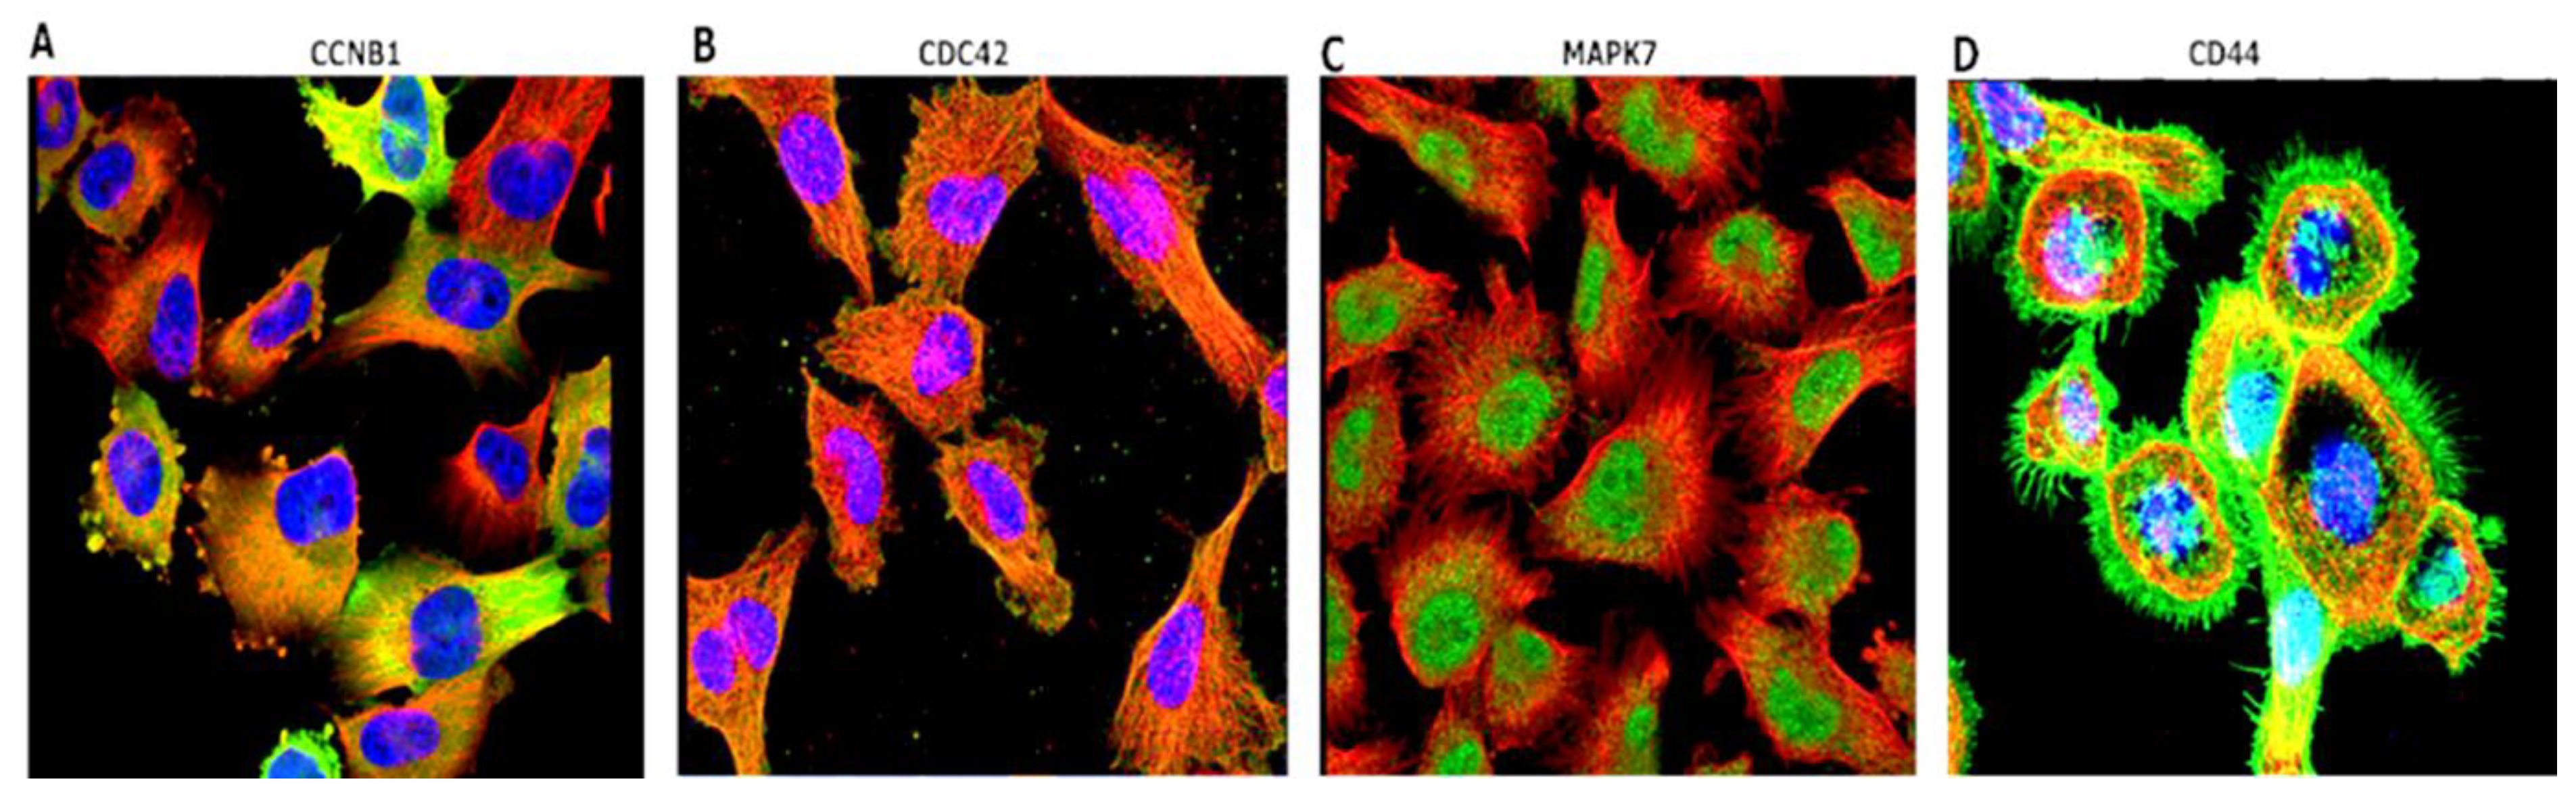
3.5. Immunofluorescent (IF) Staining of the U251-MG GBM Human Cell Line

To further validate expressions of the CCNB1/CDC42/MAPK7/CD44 genes in GBM, we explored HPA IF staining, using the U251-MG GBM cell line. The following antibodies were used for staining: CCNB1 (HPA030741), CDC42 (CAB004360), MAPK7 (CAB018561), and CD44 (CAB000112). Staining results of the U251-MG cell line exhibited the location of genes, with antibodies shown in green, nuclei in blue, and microtubules in red. CCNB1 was localized in the cytosol, CDC42 was detected in microtubules, while the localization of MAPK7 was in the nucleoplasm and CD44 was found in plasma membranes (Figure 6).

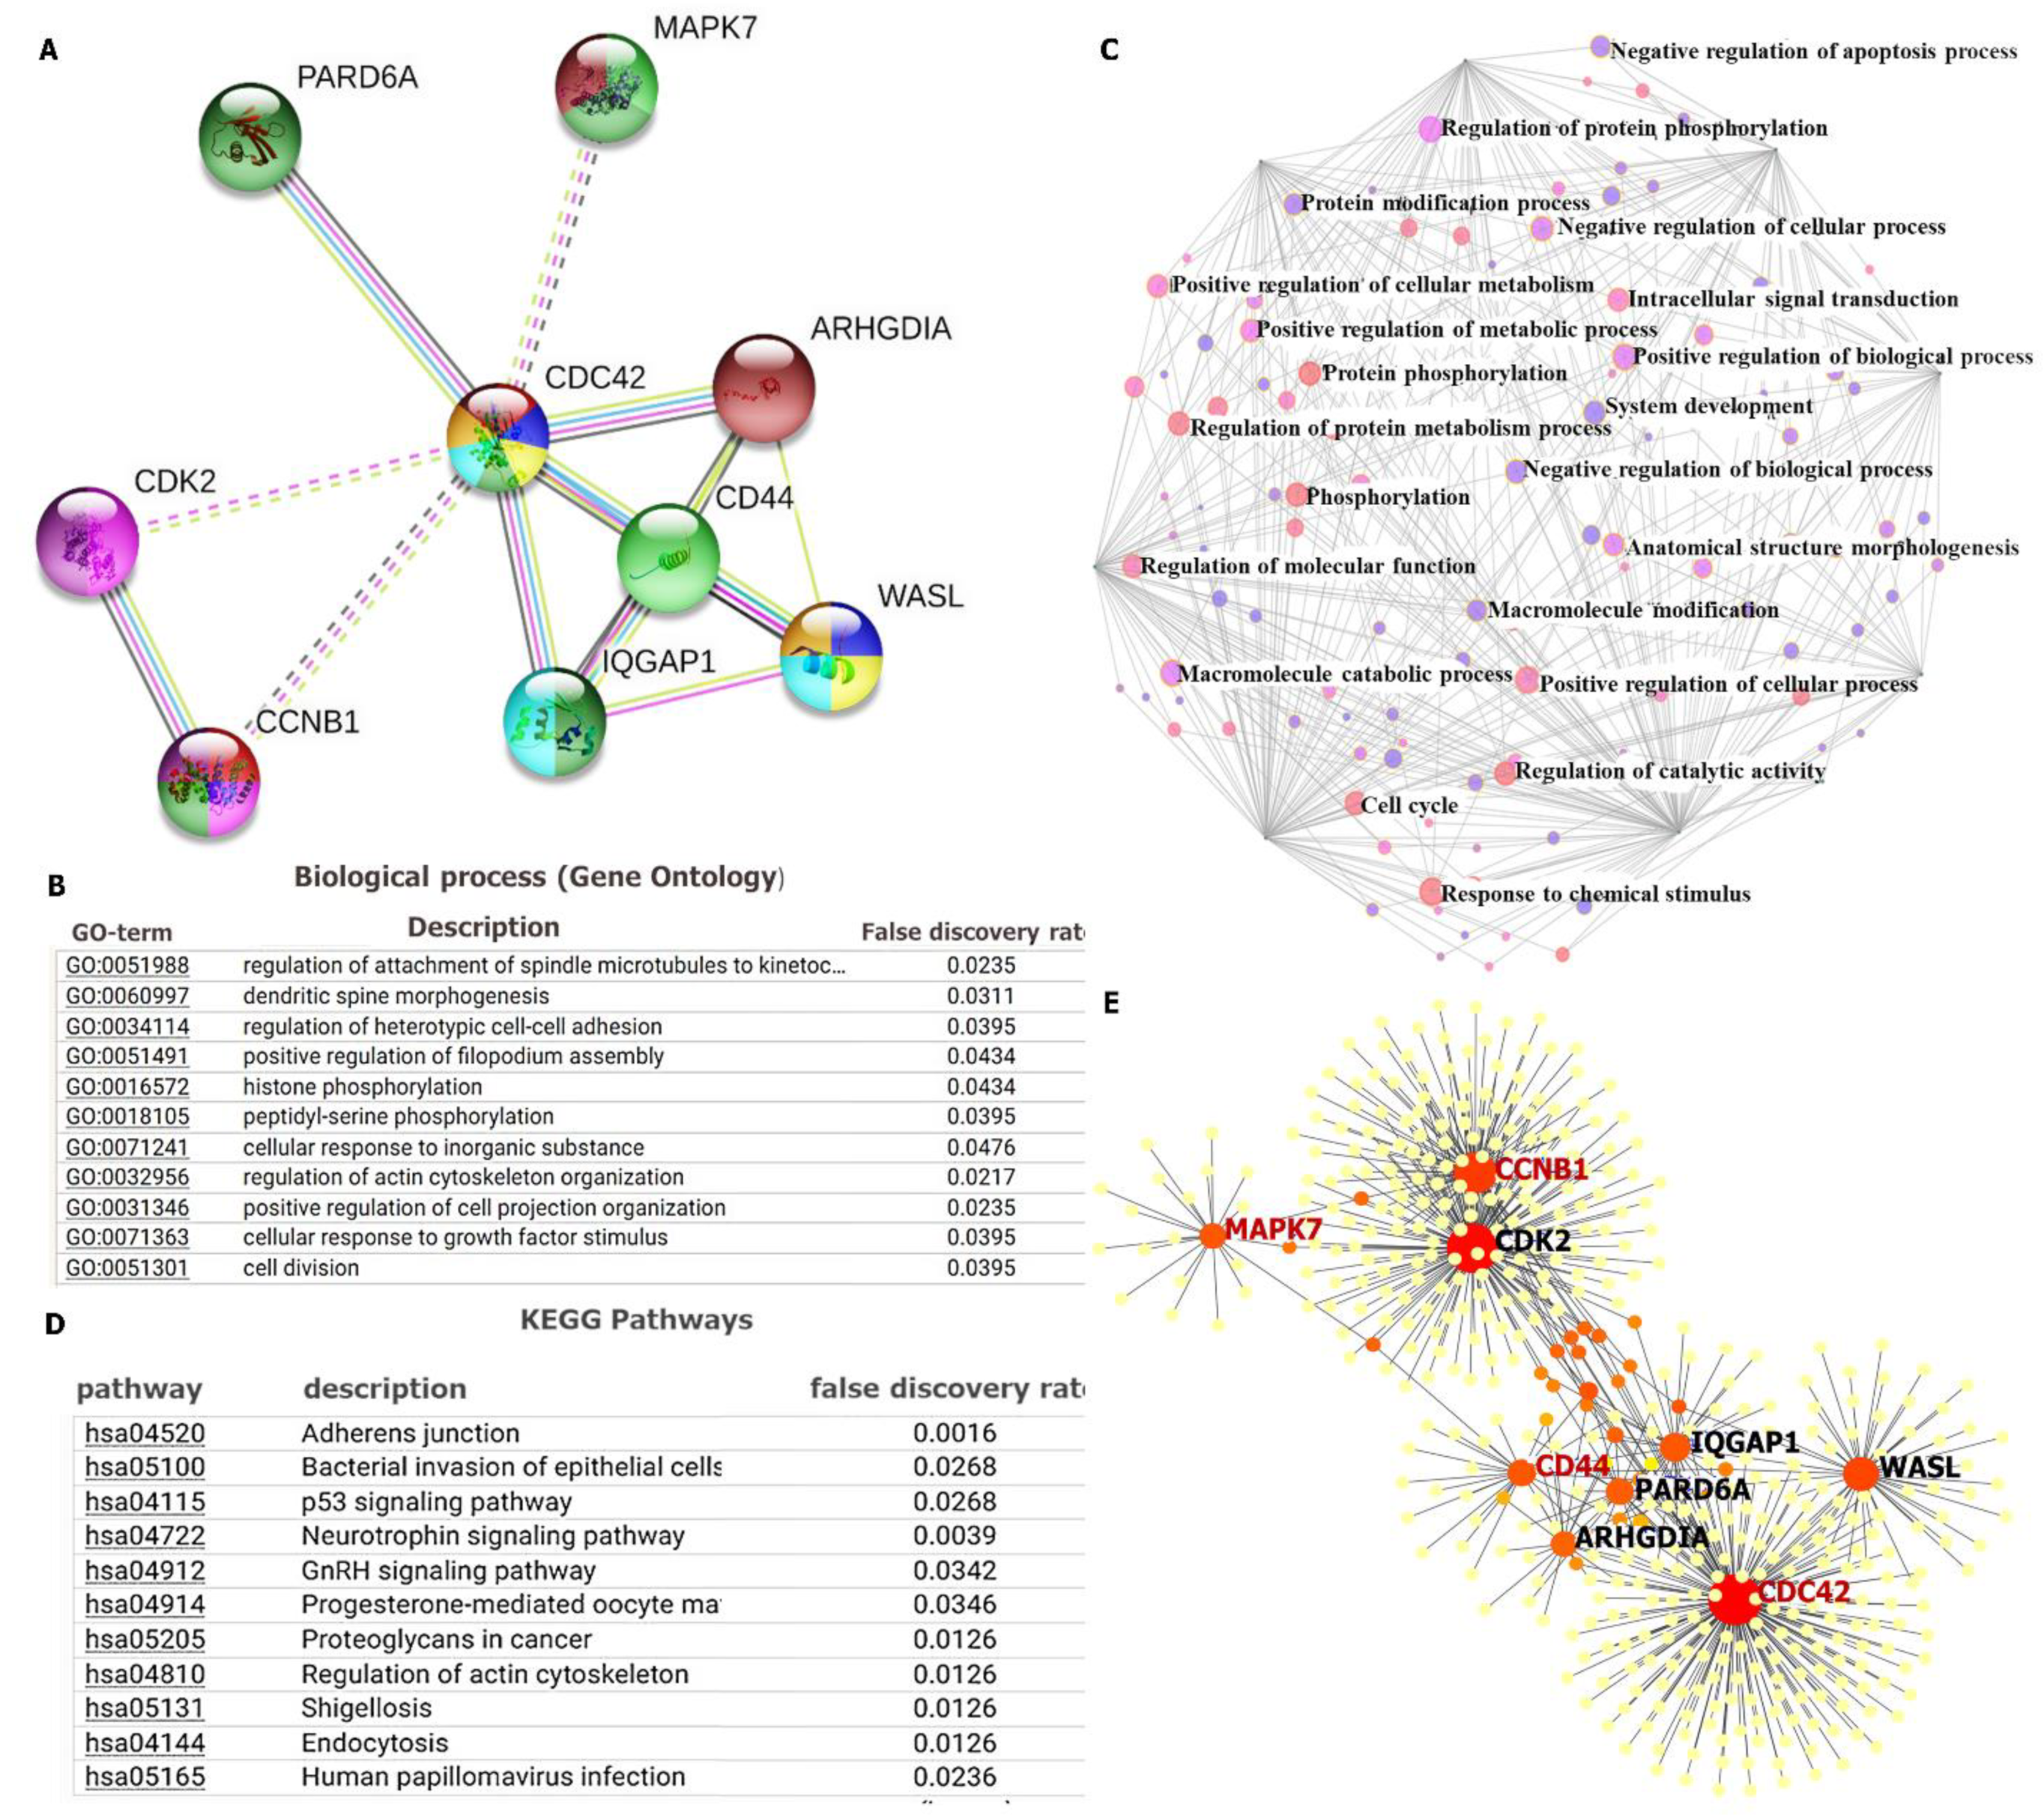
3.6. PPI Network Construction and Functional Enrichment Analysis

To assess PPIs, we used the STRING database (https://string-db.org/, accessed on 21 September 2021), a web tool developed to analyze interactions of PPIs, such as physical and functional associations. The clustering analysis had nine nodes and 15 edges, with an average local clustering coefficient of 0.917 and a PPI enrichment p value of 0.0293. Moreover, the interaction score confidence was set to > 0.4, and considered most significant. Active interactions were based on text mining, experiments, databases, co-expressions, neighborhood, gene fusion and co-occurrence (Figure 7A). Functional enrichments with the clustering network were also retrieved from the STRING analysis, and they included gene ontology (GO) involving BPs and KEGG pathways, with p < 0.05 considered significant (Figure 7B,C). For further analysis, we used Network Analyst (https://www.networkanalyst.ca/, accessed on 21 September 2021), a web-based visual analytics platform for comprehensive gene and protein expression profiling [50,51]. In this platform, we used the SIGnaling Network Open Resource (SIGNOR 2.0) and selected the BP database to analyze enriched co-expressed genes (Figure 7D). The signaling network analysis of KEGG pathway enrichment showed co-expressions of CCNB1/CDC42/MAPK7/CD44 oncogenes in the same network cluster, and results were viewed from the network topology in a force atlas layout analyzed from the Igraph R package (Figure 7E).

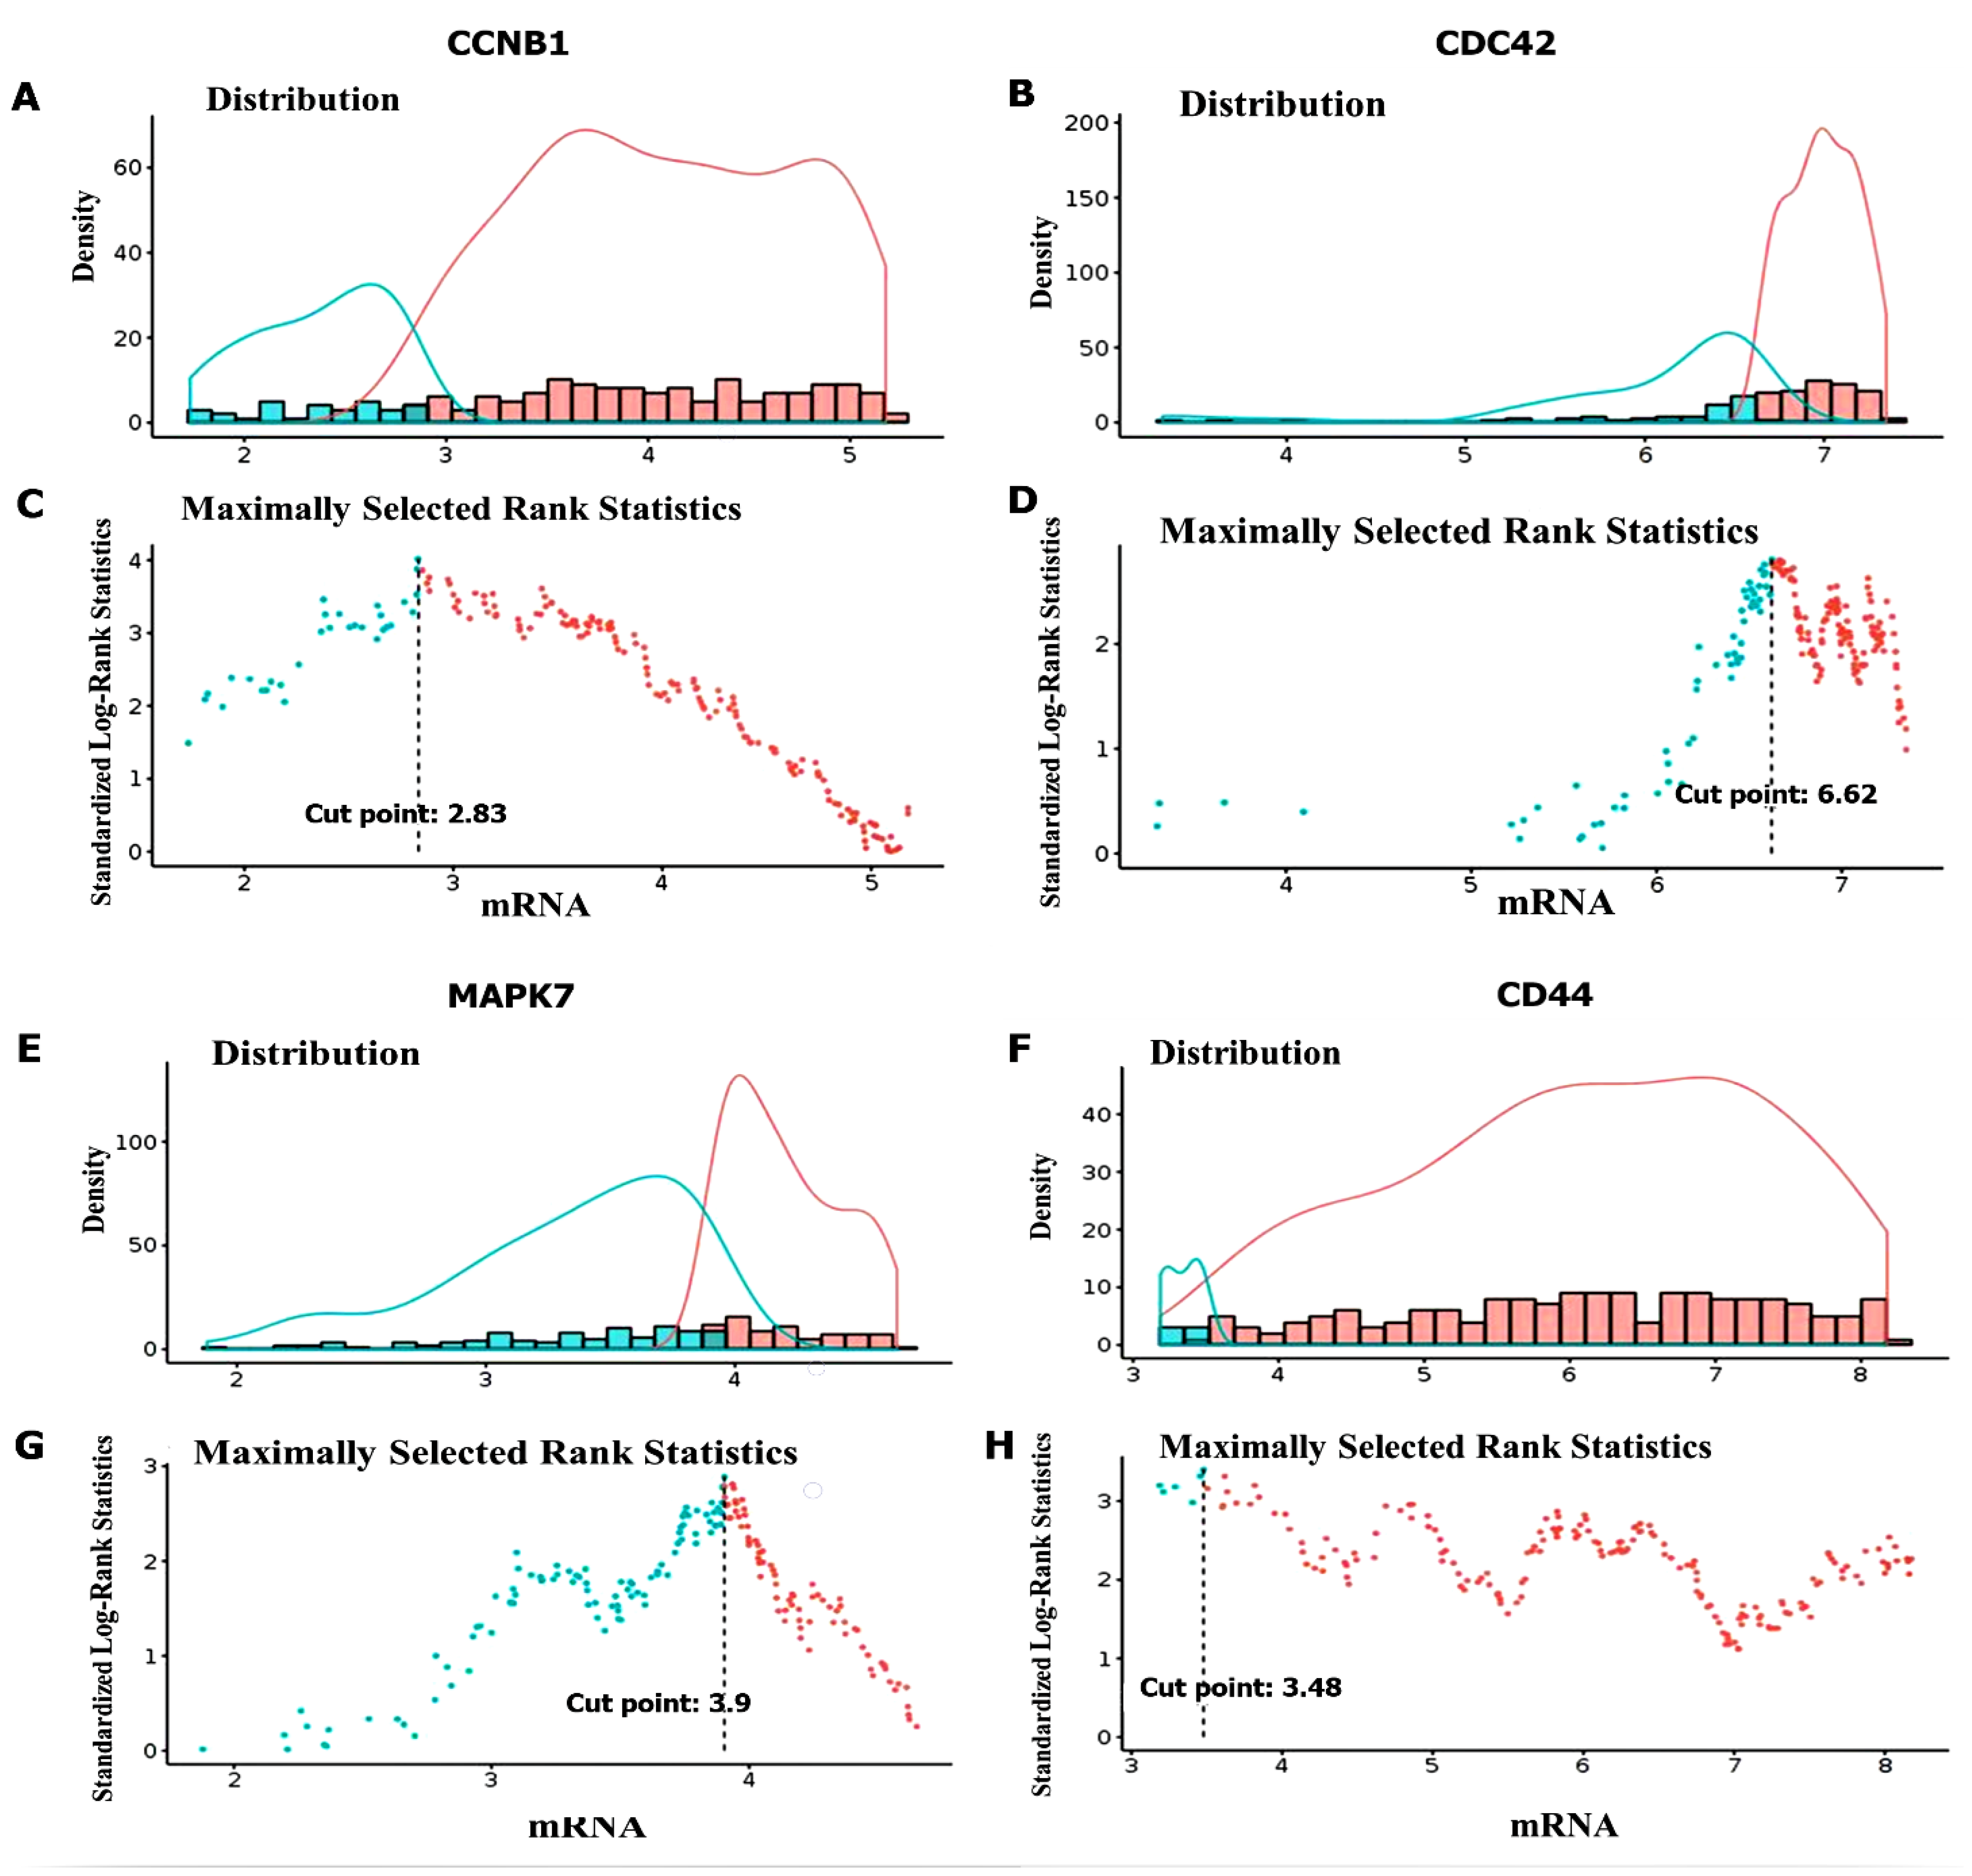
3.7. Predictions of Patient Clinical Outcomes with Radiomics Signature Construction

Prognostic outcomes of GBM patients were predicted by exploring radiomics signatures constructed using the GlioVis database, and distributions of Radscores and maximally selected rank statistics were used to determine optimal cutoff values for the CCNB1, CDC42, MAPK7, and CD44 oncogenes. The obtained cutoff scores (Radscores) were 2.83, 6.62, 3.9, and 3.48, respectively (Figure 8A–H). This analysis therefore showed that patients with lower Radscores generally displayed better OS; however, since the CCNB1/CDC42/MAPK7/CD44 oncogenes were shown to be highly expressed in GBM, herein, they also exhibited high Radscores and, consequently, worse prognoses. Therefore, predicted expressions of the CCNB1, CDC42, MAPK7 and CD44 oncogenes exhibited significant roles in the cell cycle, and thus are potential prognostic biomarkers in GBM.

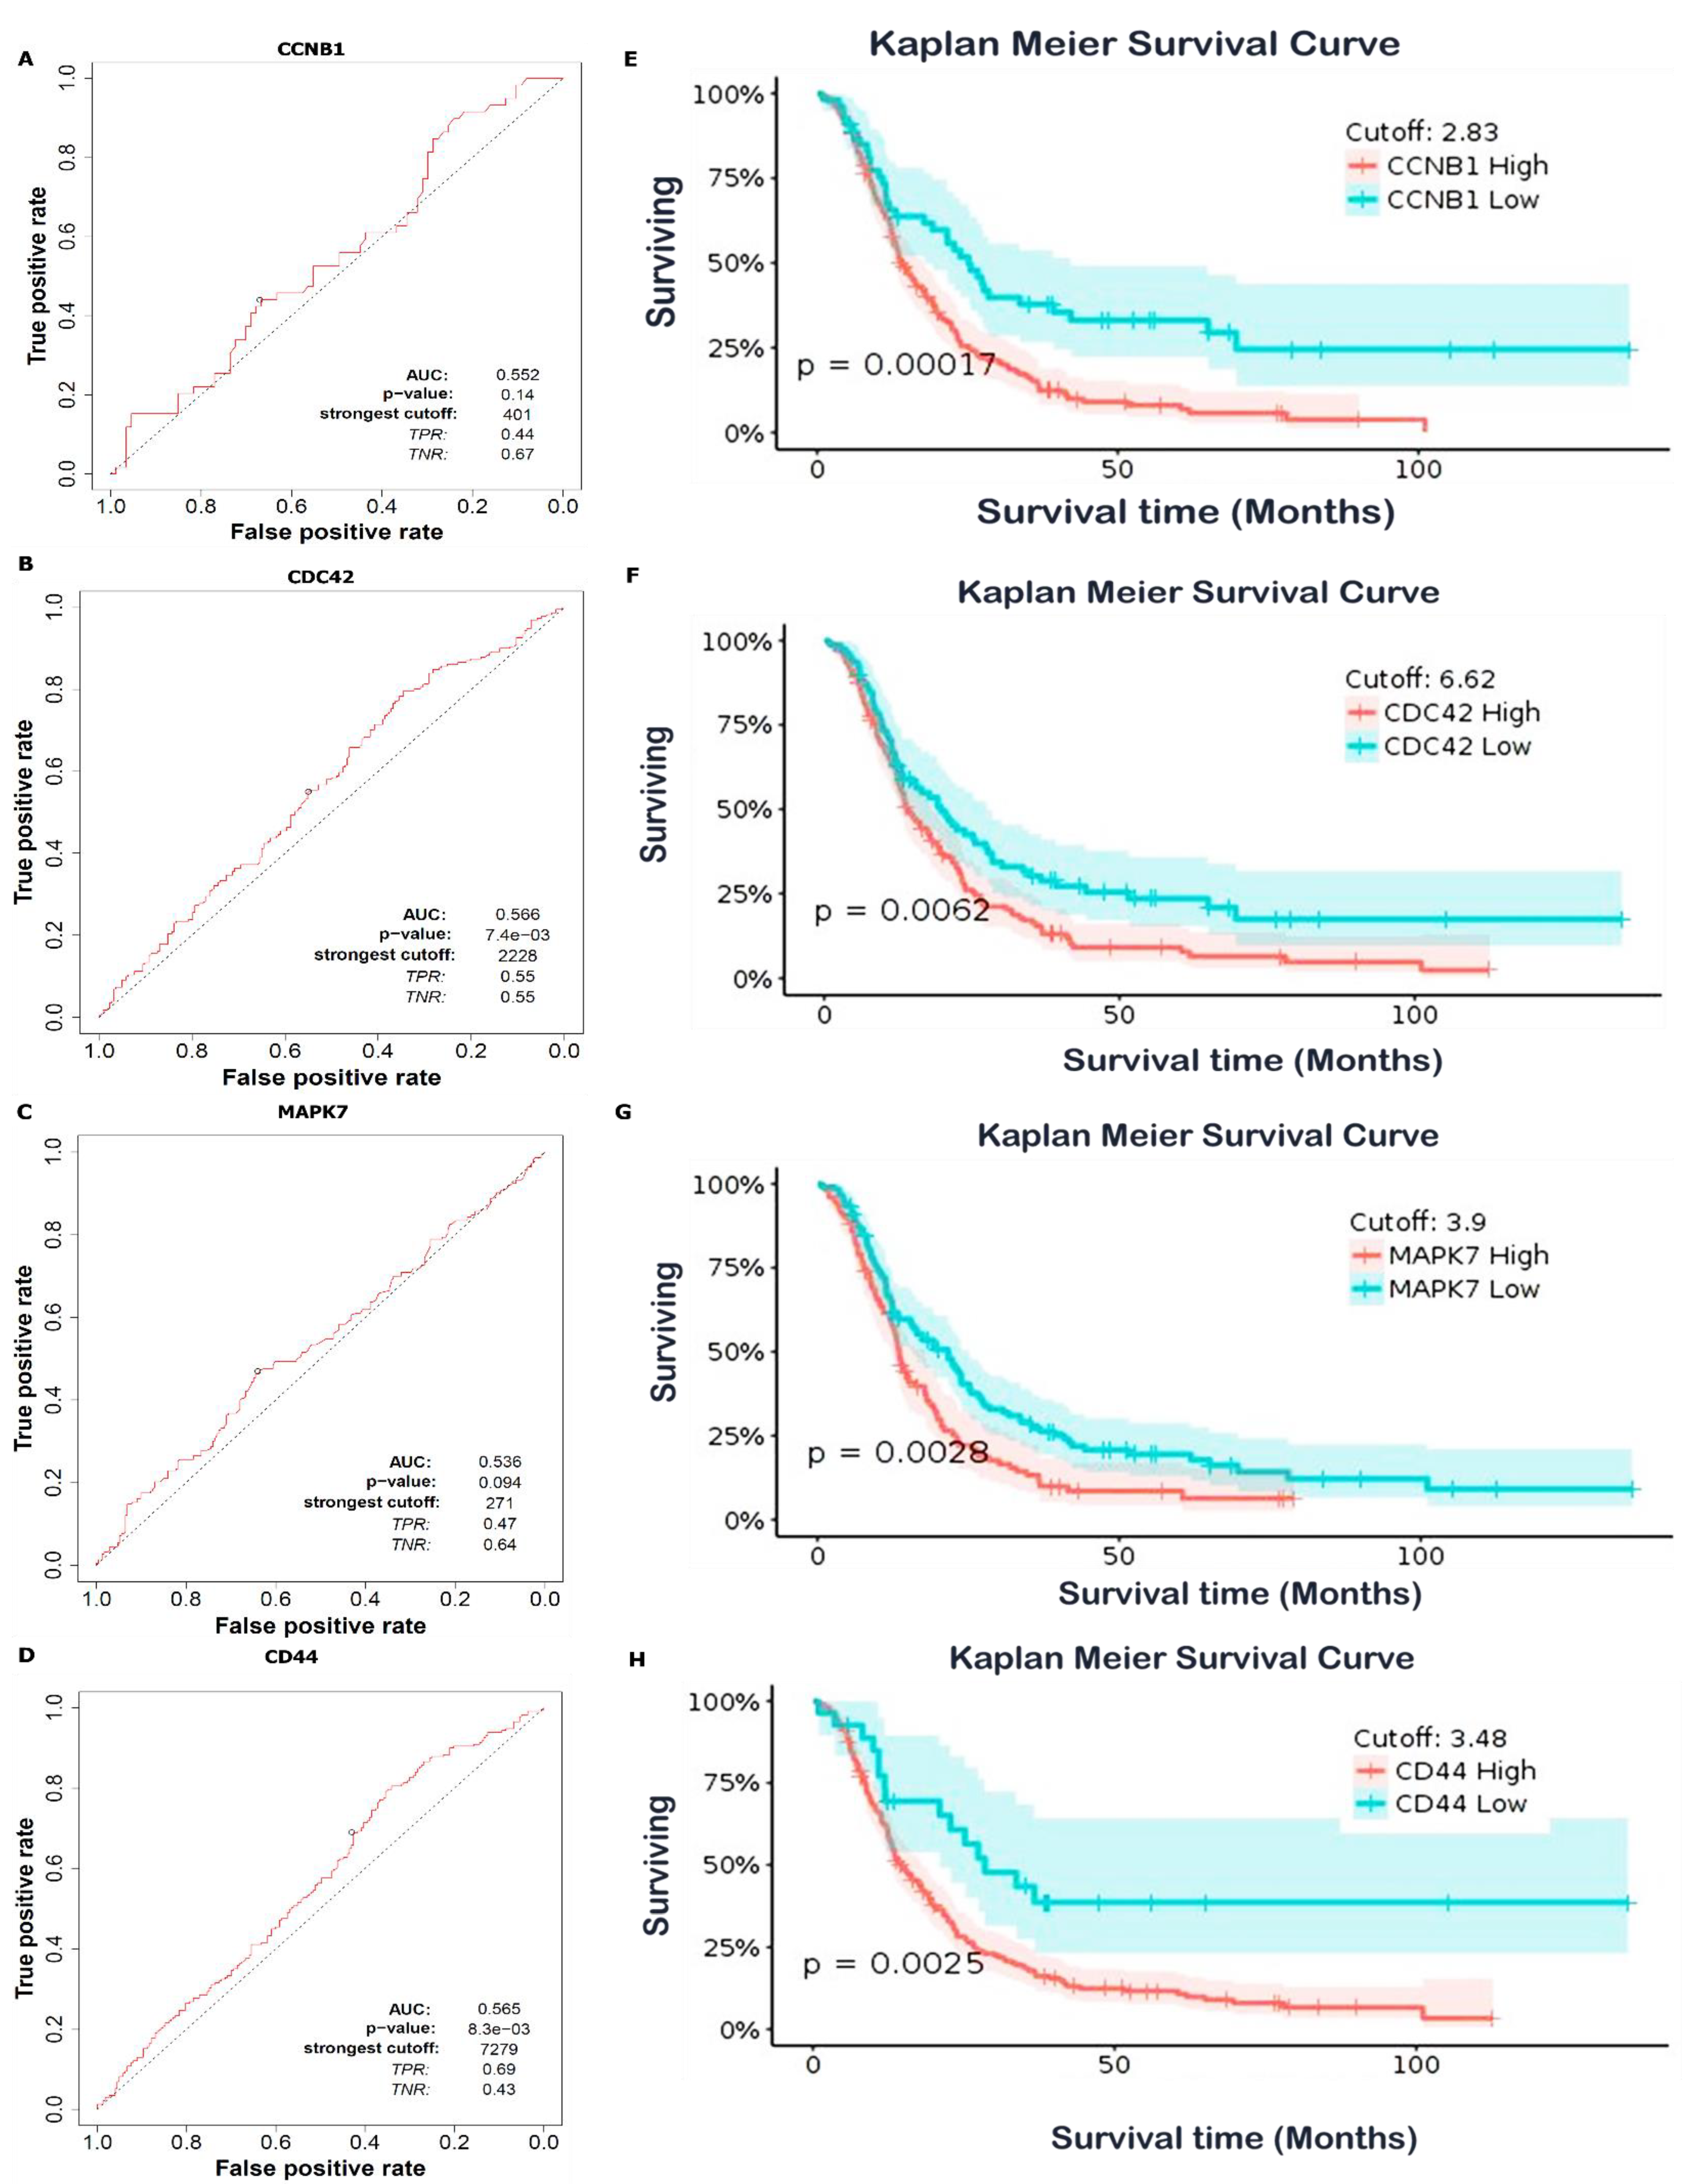
3.8. High Expressions of CCNB1, CDC42, MAPK7, and CD44 Were Associated with a Poor Prognosis in GBM

To evaluate and validate prognostic significant values of CCNB1, CDC42, MAPK7, and CD44 in GBM patients, we used an ROC curve and KM analysis. The ROC curve was based on true (sensitive) and false (selective) positive rates of responses in GBM patients. AUC scores of CCNB1, CDC42, MAPK7, and CD44 were 0.534, 0.515, 0.541, and 0.538, respectively (Figure 9A–D). The KM analysis and log-rank test showed significantly prolonged OS times in the low-risk group compared to the high-risk group, with each subtype displaying different cutoff values; p < 0.05 was considered statistically significant (Figure 9E–H). This indicated that the CCNB1, CDC42, MAPK7, and CD44 oncogenic signatures possessed potential diagnostic abilities in GBM. To evaluate whether the test measurements had specific conditions, we assessed the AUC, and an AUC of 0.5 indicated no discrimination, while an AUC of 1.0 indicated discrimination. The curve that included all possible decision thresholds from a diagnostic test result were patients who had experienced disease onset and individuals who had no thresholds from a diagnostic test result, which were patients who had experienced disease onset and individual thresholds.

3.9. In Vitro Anticancer Screening of SJ10 against NC1-60 CNS Cell Lines

SJ10 was submitted to the NCI-DTP for screening for potential antiproliferative and cytotoxic effects against a panel of NCI-60 CNS cell lines, in agreement with the outlined protocol of the NCI. The compound was tested at an initial dose of 10 μM. Results showed that SJ10 exhibited antiproliferative activities against several CNS cell lines. The compound growth inhibition (GI) percentage showed that SNB-19 cells were more sensitive, with GI of 67.25%, followed by SF-539 at 36.91%, SF-268 at 34.33%, SF-295 at 23.75%, and SNB-75 at 22.34%, as shown in Figure 10A. The compound was further evaluated with dose-dependent treatment, since it exhibited antiproliferative activities at an initial dose of 10 μM. Accordingly, SF-268 displayed complete growth inhibition (−100%), followed by U251 at −96%, SNB-75 at −84%, SF-539 at −79%, SF-295 at −76%, and SNB-19 at −42%. Sulforhodamine B (SRB) dual-pass staining was used to further investigate the in vitro 50% growth inhibition (GI50)/50% inhibitory concentration (IC50), and results ranged 1.14~2.15 μM in the CNS cell lines, with SNB-75 more sensitiv at 1.14 μM, followed by U251 at 1.59 μM, SF-268 at 1.64 μM, SNB-19 at 1.67 μM, SF-539 at 1.69 μM, and SF-295 at2.15 μM, showing a smaller response to SJ10 (Figure 10B,C).

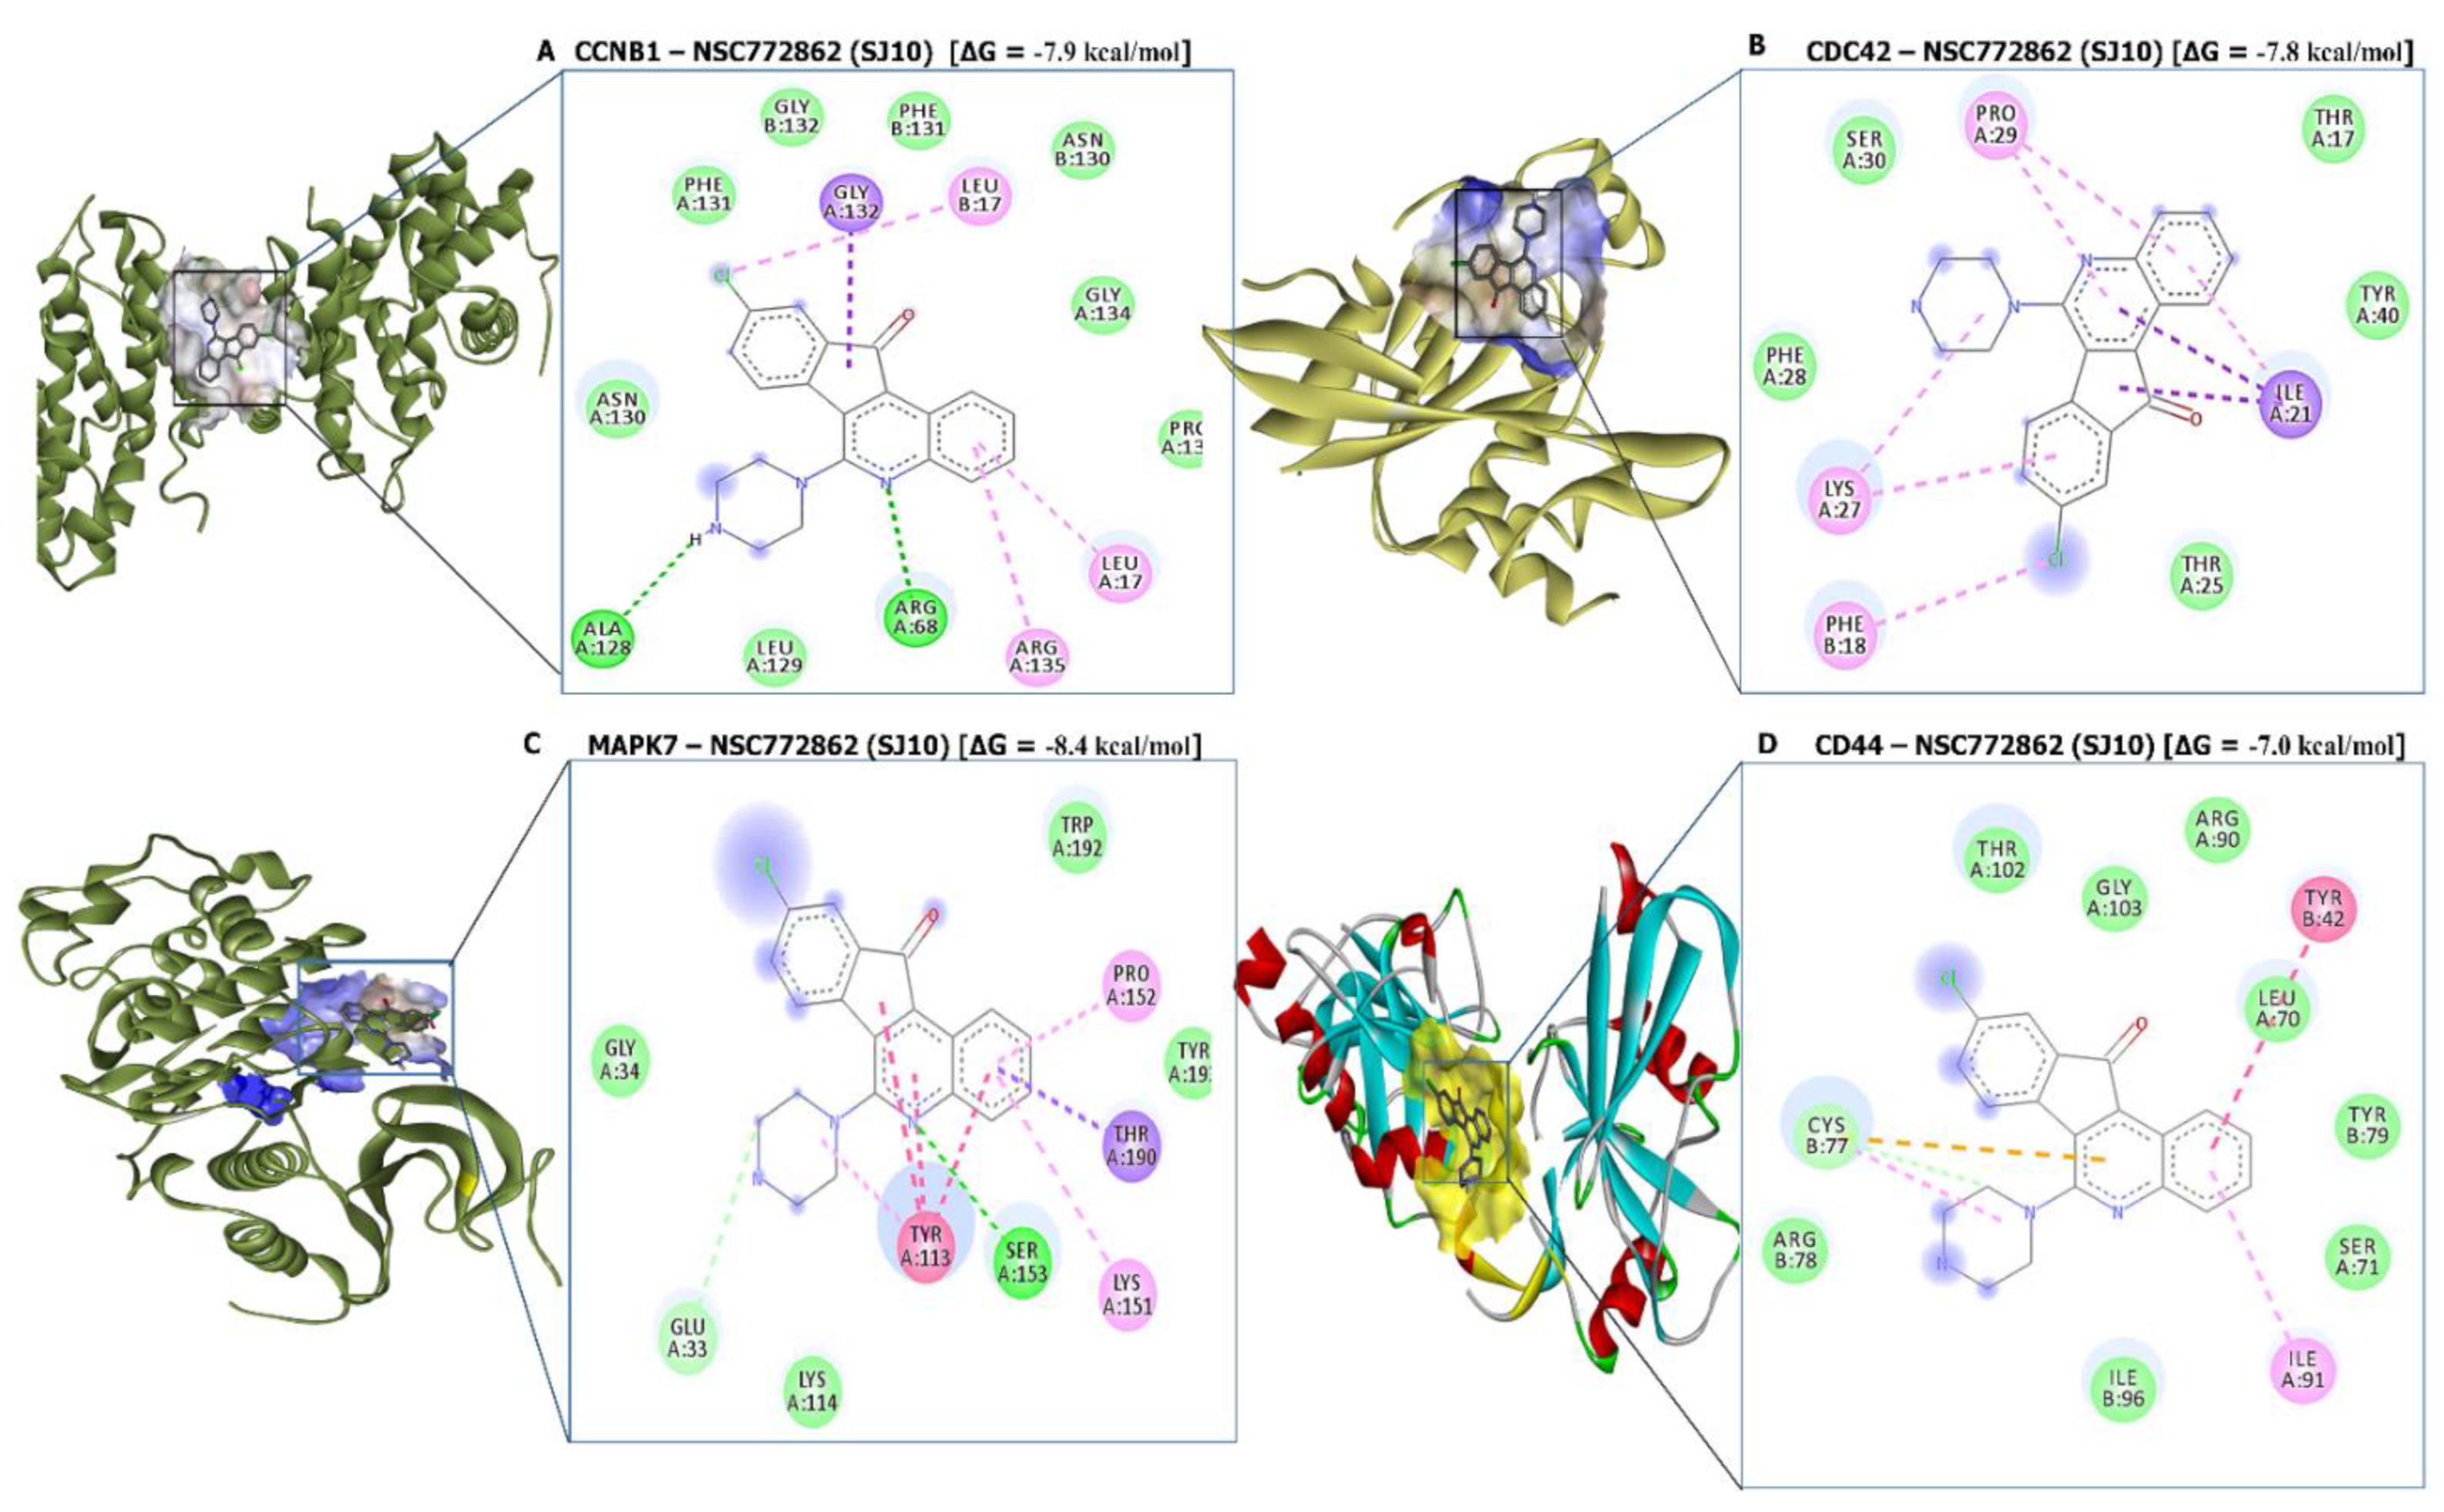
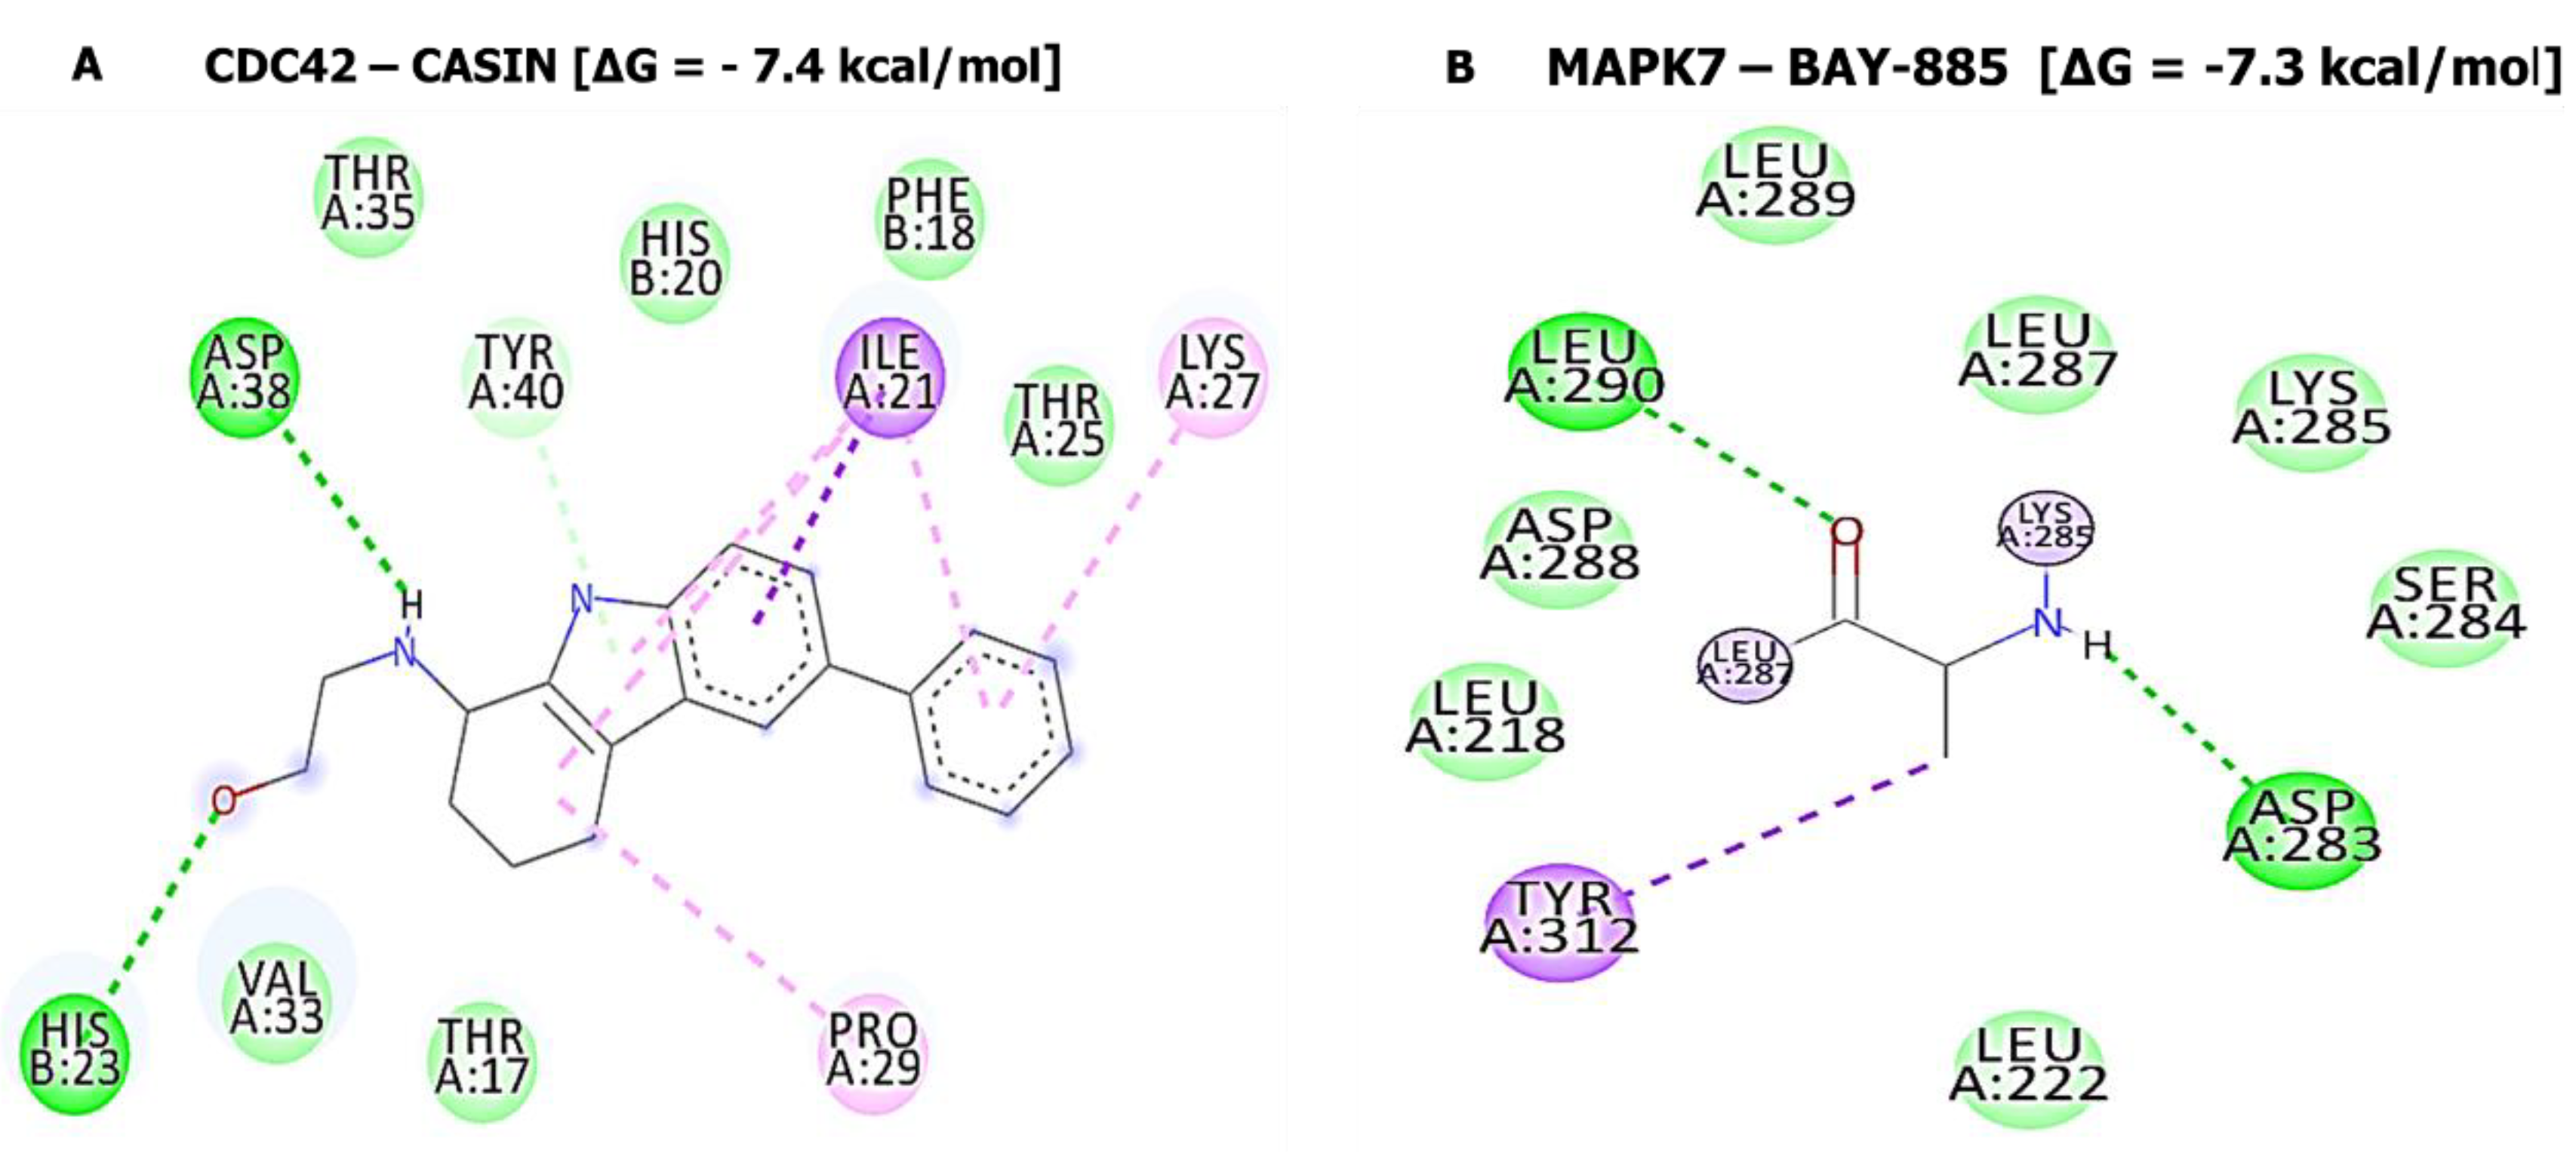
3.10. Molecular Docking Analysis

The potential inhibitory effects of SJ10 were assessed using a docking analysis. Results of receptor-ligand interactions obtained from the Autodock tool revealed putative binding affinities of SJ10 with CCNB1 (−7.9 kcal/mol), CDC42 (−7.8 kcal/mol), MAPK7 (−8.4 kcal/mol), and CD44 (−7.0 kcal/mol). When compared to standard inhibitors of CASIN (CID: 2882155) for CDC42 and BAY-885 (CID: 134128280) for MAPK7, they showed lower binding energies of −7.4 and −7.3 kcal/mol, respectively. For a further analysis, we used Pymol and Discovery Studio to visualize the analytical results. The SJ10/CCNB1 complex displayed interactions by conventional hydrogen (H) bonds with ALA128 (2.07 Å) and ARG68 (2.73 Å). The interactions were stabilized by van der Waals interactions (ASN130, LEU129, PHE131, GLY132, PHE131, ASN130, GLY134, and PRO136), pi-sigma (GLY132), and pi-alkyl (LEU17, LEU17, and ARG135) displayed in their binding pockets. The SJ10/CDC42 complex displayed van der Waals interactions (THR25, PHE28, SER30, THR17, and TYR40), pi-sigma (ILE21), and pi-alkyl (PHE18, LYS27, and PRO29) in their binding pockets, while SJ10/MAPK7 exhibited conventional hydrogen bond with SER153 (2.23 Å) and was further stabilized by van der Waals interactions (LYS114, GLY34, TRP192, and THR193), carbon hydrogen bond (GLU33), pi-sigma (THR190), pi-pi stacked (TYR113), and pi-alkyl (PRO152 and LYS151) in their binding pockets. Interactions between the SJ10/CD44 complex displayed van der Waals interactions (THR102, GLY103, ARG90, LEU70, TYR79, SER71, ILE96, and ARG78), carbon hydrogen bond (CYS77), pi-pi T-shaped (TYR42) and pi-alkyl (ILE91) in their binding pockets (Figure 11). For further analysis, we used the FDA approved standard inhibitors of CDC42 and MAPK7, CASIN and BAY-885 respectively. The interaction of CDC42 in complex with CASIN exhibited binding energy of (−7.4 kcal/mol) and MAPK7 in complex with BAY-885 displayed binding energy of (−7.3 kcal/mol), these results exhibited a much lower binding affinities as compared to SJ10, this suggesting the potential inhibitory effects of SJ10 in GBM expression CCNB1, CDC42, MAPK7, and CD44 oncogenic signatures (Figure 12, Table 2).

4. Discussion

Despite improvements in standard therapies, including surgical resection, radiation, and chemotherapy with TMZ, patients with GBM still exhibit poor clinical outcomes, with a median survival of only about 15 months [63], mainly due to GBM’s biological and genetic heterogeneity. Therefore, understanding molecular mechanisms and invasive characteristics of GBM is pivotal as an essential strategy for developing more-effective therapeutics. Integrated bioinformatics analyses have been extensively applied in the early stages of drug discovery and development and have significantly accelerated the process and reduced costs. In the current study, we applied computational simulation analyses to predict and identify dysregulated gene networks and pathways leading to resistance to radio- and chemotherapies (TMZ). Accumulating studies have demonstrated that therapeutic resistance in GBM is also associated with GSCs, which may potentially assist GBM cancer cells escape irradiation. Others have shown that GCSs are resistant to TMZ chemotherapy, thus promoting radioresistance through DNA damage-response activation [11,12,13].
SJ10 (NSC7772862) is a small molecule and a derivative of a quinolone and piperazine derivative and was recently synthesized in our laboratory. Through application of the Swisstarget and PASS prediction tools (Table 1), we predicted CCNB1, CDC42, MAPK7, and CD44 oncogenic signatures as target genes for SJ10. Moreover, we explored the SwissAMDE and molsoft algorithms to evaluate the PK, drug-likeness, medicinal chemical friendliness, and ADMET properties of SJ10 [55,56]. The compound successfully passed the required physicochemical properties, medicinal chemistry, PK, and drug-likeness criteria. Bioavailability radar, displaying the six physicochemical properties of absorption-included lipophilicity (XLOGP3 = 3.90), molecular weight (349.10 g/mol), polarity (PSA = 37.08 Å2), solubility (Log S (ESOL) = −4.7), flexibility (rotation = 4), saturation (Fraction Csp3 = 0.2), and pKa (=0.5) of the SJ10 compound. In addition, the SJ10 compound demonstrated highly probable GIA absorption, a bioavailability score (55%), and good synthetic accessibility (2.89). The compound reached the BBB with a score of 4.98, and further displayed a drug-like model score of (−0.68) (Figure 2).
We identified significantly increased mRNA levels of the CCNB1/CDC42/MAPK7/CD44 oncogenes in pan cancers, including GBM tumor tissues compared to normal tissues from TCGA, using the TIMER bioinformatics tool. These results were further validated using the HPA and GlioVis database analyses, which showed similar outputs displaying overexpression of CCNB1/CDC42/MAPK7/CD44 gene signatures in WHO grade II, III, and IV GBM tumors using an ANOVA. For further analysis, we used the STRING online web tool and showed that CCNB1/CDC42/MAPK7/CD44 actively interacted with each other in the same clustering network, based on text mining, experiments, databases, co-expressions, neighborhood, gene fusion, and co-occurrence and also exhibited enrichment of GO involving BPs and (KEGG pathways, with p < 0.05 considered significant (Figure 6B,C). Furthermore, we predicted patients’ clinical outcomes using the Radiomics signature constructed from the GlioVis database, to determine optimal cutoff values for the CCNB1, CDC42, MAPK7, and CD44 oncogenes. The obtained cutoff scores (Radscore) were 2.83, 6.62, 3.9, and 3.48, respectively (Figure 7). The analysis therefore showed that patients with lower Radscores generally displayed better OS; however, since the CCNB1/CDC42/MAPK7/CD44 oncogenes were shown to be highly expressed in GBM, herein, they also exhibited high Radscores, which consequently led to worse prognoses. Therefore, predicted expressions of the CCNB1, CDC42, MAPK7, and CD44 oncogenes exhibited significant roles in the cell cycle, and thus are potential prognostic biomarkers for GBM. In addition, MAPK7 is a potential novel drug target due to its dysregulation and association with TMZ resistance in GBM. Herein, we showed that targeting MAPK7 in GBM tumors can potentially improve the strength of TMZ in suppressing tumor cells [30,31,32].
The potential anticancer activities of SJ10 were evaluated against NCI human CNS cell lines. Accordingly, an initial dose of 10 μM exhibited antiproliferative activities against the CNS cell lines, as shown in Figure 9A. The compound was further evaluated with dose-dependent treatment, since it exhibited antiproliferative activities at an initial dose of 10 μM. Accordingly, SJ10 displayed complete growth inhibition at −100% against SF-268 cells, followed by U251 at −96%, SNB-75 at −84%, SF-539 at −79%, SF-295 at −76%, and SNB-19 at −42%. SRB dual-pass staining was used to further investigate in vitro GI50/IC50 values, and results ranged 1.14~2.15 μM in the CNS cell lines, with SNB-75 more sensitive at 1.14 μM, followed by U251 at 1.59 μM, SF-268 at 1.64 μM, SNB-19 at 1.67 μM, SF-539 at 1.69 μM, and SF-295 at 2.15 μM, showing a weaker response to SJ10. Finally, we evaluated the potential inhibitory effects of SJ10, which were assessed using a docking analysis. The results of receptor-ligand interactions obtained from the Autodock tool revealed higher binding energies of SJ10 with CCNB1 (−7.9 kcal/mol), CDC42 (−7.8 kcal/mol), MAPK7 (−8.4 kcal/mol), and CD44 (−7.0 kcal/mol) compared to the standard inhibitors of CASIN (CID: 2882155) for CDC42 and BAY-885 (CID: 134128280) for MAPK7, which showed lower respective binding energies of −7.4 and −7.3 kcal/mol (Fig.12). Therefore, the above-mentioned results suggest that SJ10 exhibits drug-like characteristics, with anticancer activities and is a potential oral drug candidate. Further in vitro and in vivo studies are both currently in progress in our laboratory.

5. Conclusions

In summary, our obtained results showed that CCNB1/CDC42/MAPK7/CD44 oncogenic signatures are potential biomarkers of GBM therapeutic-resistant tumors, and potential drug targets of our novel small molecule, SJ10. We further showed that SJ10 exhibits anticancer activities against a panel of NCI human CNS cancer cell lines when administered at an initial dose of 10 μM and also in a dose-dependent manner. We evaluated receptor-ligand interactions using a docking analysis and identified unique and higher binding energies of SJ10 in complex with the CCNB1, CDC42, MAPK7, and CD44 oncogenes, compared to their interactions with two FDA-approved inhibitors. Further in vitro and in vivo studies are both currently in progress in our laboratory.

Author Contributions

H.-S.H. and A.T.H.W. designed and oversaw the study; Y.-C.K., S.-L.T. and F.-C.L. data collection, analysis and interpretation; S.-J.C. conceptualization and investigation; N.M. wrote the manuscript. All authors have read and agreed to the published version of the manuscript.

Funding

Hsu-Shan Huang was funded by the Ministry of Science and Technology (MOST 109-2113-M- 038-003 and MOST 110-2314-B-038-120). Alexander TH Wu was funded by the Ministry of Education, Taipei Medical University (DP2-110-21121-03-C-09 and DP2-110-21121-01-H-03-03).

Data Availability Statement

The datasets generated and/or analyzed in this study are available upon reasonable request.

Acknowledgments

The authors thank the NCI Developmental Therapeutics Program (DTP) for the 60-cancer-cell-line screening of selected compounds described in this paper, funded by the National Cancer Institute, National Institutes of Health (NIH-NCI). The present study was supported by grants (MOST110-2314-B-038-120) from the Ministry of Science and Technology, Taiwan. We also acknowledge editing services provided by the Office of Research and Development, Taipei Medical University.

Conflicts of Interest

The authors declare no conflict of interest.

References

  1. Montemurro, N. Glioblastoma multiforme and genetic mutations: The issue is not over yet. An overview of the current literature. J. Neurol. Surg. Part A Cent. Eur. Neurosurg. 2020, 81, 64–70. [Google Scholar] [CrossRef] [Green Version]
  2. Omuro, A.; DeAngelis, L.M. Glioblastoma and other malignant gliomas: A clinical review. JAMA 2013, 310, 1842–1850. [Google Scholar] [CrossRef]
  3. Manikandan, C.; Kaushik, A.; Sen, D. Viral vector: Potential therapeutic for glioblastoma multiforme. Cancer Gene Ther. 2020, 27, 270–279. [Google Scholar] [CrossRef] [PubMed]
  4. Gilard, V.; Tebani, A.; Dabaj, I.; Laquerrière, A.; Fontanilles, M.; Derrey, S.; Marret, S.; Bekri, S. Diagnosis and management of glioblastoma: A comprehensive perspective. J. Pers. Med. 2021, 11, 258. [Google Scholar] [CrossRef]
  5. Shabason, J.E.; Sutton, D.; Kenton, O.; Guttmann, D.M.; Lustig, R.A.; Hill-Kayser, C. Patterns of failure for pediatric glioblastoma multiforme following radiation therapy. Pediatr. Blood Cancer 2016, 63, 1465–1467. [Google Scholar] [CrossRef]
  6. Pearson, J.R.D.; Cuzzubbo, S.; McArthur, S.; Durrant, L.G.; Adhikaree, J.; Tinsley, C.J.; Pockley, A.G.; McArdle, S.E.B. Immune escape in glioblastoma multiforme and the adaptation of immunotherapies for treatment. Front. Immunol. 2020, 11, 582106. [Google Scholar] [CrossRef]
  7. Lopes, M.B.S. The 2017 World Health Organization classification of tumors of the pituitary gland: A summary. Acta Neuropathol. 2017, 134, 521–535. [Google Scholar] [CrossRef]
  8. Petrecca, K.; Guiot, M.C.; Panet-Raymond, V.; Souhami, L. Failure pattern following complete resection plus radiotherapy and temozolomide is at the resection margin in patients with glioblastoma. J. Neurooncol. 2013, 111, 19–23. [Google Scholar] [CrossRef] [PubMed]
  9. Brandes, A.A.; Tosoni, A.; Franceschi, E.; Sotti, G.; Frezza, G.; Amistà, P.; Morandi, L.; Spagnolli, F.; Ermani, M. Recurrence pattern after temozolomide concomitant with and adjuvant to radiotherapy in newly diagnosed patients with glioblastoma: Correlation with MGMT promoter methylation status. J. Clin. Oncol. 2009, 27, 1275–1279. [Google Scholar] [CrossRef] [Green Version]
  10. Jastaniyah, N.; Murtha, A.; Pervez, N.; Le, D.; Roa, W.; Patel, S.; Mackenzie, M.; Fulton, D.; Field, C.; Ghosh, S.; et al. Phase I study of hypofractionated intensity modulated radiation therapy with concurrent and adjuvant temozolomide in patients with glioblastoma multiforme. Radiat. Oncol. 2013, 8, 38. [Google Scholar] [CrossRef] [PubMed] [Green Version]
  11. Bao, S.; Wu, Q.; McLendon, R.E.; Hao, Y.; Shi, Q.; Hjelmeland, A.B.; Dewhirst, M.W.; Bigner, D.D.; Rich, J.N. Glioma stem cells promote radioresistance by preferential activation of the DNA damage response. Nature 2006, 444, 756–760. [Google Scholar] [CrossRef]
  12. Phillips, T.M.; McBride, W.H.; Pajonk, F. The response of CD24(-/low)/CD44+ breast cancer-initiating cells to radiation. J. Natl. Cancer Inst. 2006, 98, 1777–1785. [Google Scholar] [CrossRef] [PubMed] [Green Version]
  13. Kim, M.J.; Kim, R.K.; Yoon, C.H.; An, S.; Hwang, S.G.; Suh, Y.; Park, M.J.; Chung, H.Y.; Kim, I.G.; Lee, S.J. Importance of PKCδ signaling in fractionated-radiation-induced expansion of glioma-initiating cells and resistance to cancer treatment. J. Cell Sci. 2011, 124, 3084–3094. [Google Scholar] [CrossRef] [PubMed] [Green Version]
  14. Senbanjo, L.T.; Chellaiah, M.A. CD44: A Multifunctional cell surface adhesion receptor is a regulator of progression and metastasis of cancer cells. Front. Cell Dev. Biol. 2017, 5, 18. [Google Scholar] [CrossRef] [Green Version]
  15. Klank, R.L.; Decker Grunke, S.A.; Bangasser, B.L.; Forster, C.L.; Price, M.A.; Odde, T.J.; SantaCruz, K.S.; Rosenfeld, S.S.; Canoll, P.; Turley, E.A.; et al. Biphasic dependence of glioma survival and cell migration on cd44 expression level. Cell Rep. 2017, 18, 23–31. [Google Scholar] [CrossRef] [PubMed]
  16. Desai, A.; Webb, B.; Gerson, S.L. CD133+ cells contribute to radioresistance via altered regulation of DNA repair genes in human lung cancer cells. Radiother. Oncol. 2014, 110, 538–545. [Google Scholar] [CrossRef] [Green Version]
  17. Wu, J.; Lai, G.; Wan, F.; Xiao, Z.; Zeng, L.; Wang, X.; Ye, F.; Lei, T. Knockdown of checkpoint kinase 1 is associated with the increased radiosensitivity of glioblastoma stem-like cells. Tohoku J. Exp. Med. 2012, 226, 267–274. [Google Scholar] [CrossRef] [PubMed] [Green Version]
  18. Lim, Y.C.; Roberts, T.L.; Day, B.W.; Stringer, B.W.; Kozlov, S.; Fazry, S.; Bruce, Z.C.; Ensbey, K.S.; Walker, D.G.; Boyd, A.W.; et al. Increased sensitivity to ionizing radiation by targeting the homologous recombination pathway in glioma initiating cells. Mol. Oncol. 2014, 8, 1603–1615. [Google Scholar] [CrossRef]
  19. Li, Q.; Zhang, L.; Jiang, J.; Zhang, Y.; Wang, X.; Zhang, Q.; Wang, Y.; Liu, C.; Li, F. CDK1 and CCNB1 as potential diagnostic markers of rhabdomyosarcoma: Validation following bioinformatics analysis. BMC Med. Genom. 2019, 12, 198. [Google Scholar] [CrossRef] [Green Version]
  20. Zhou, Y.; Yang, L.; Zhang, X.; Chen, R.; Chen, X.; Tang, W.; Zhang, M. Identification of potential biomarkers in glioblastoma through bioinformatic analysis and evaluating their prognostic value. Biomed. Res. Int. 2019, 2019, 6581576. [Google Scholar] [CrossRef]
  21. Bo, L.; Wei, B.; Li, C.; Wang, Z.; Gao, Z.; Miao, Z. Identification of potential key genes associated with glioblastoma based on the gene expression profile. Oncol. Lett. 2017, 14, 2045–2052. [Google Scholar] [CrossRef] [PubMed] [Green Version]
  22. Malumbres, M.; Barbacid, M. Mammalian cyclin-dependent kinases. Trends Biochem. Sci. 2005, 30, 630–641. [Google Scholar] [CrossRef]
  23. Zhang, Y.; Xia, Q.; Lin, J. Identification of the potential oncogenes in glioblastoma based on bioinformatic analysis and elucidation of the underlying mechanisms. Oncol. Rep. 2018, 40, 715–725. [Google Scholar] [CrossRef] [PubMed]
  24. Kawamoto, H.; Koizumi, H.; Uchikoshi, T. Expression of the G2-M checkpoint regulators cyclin B1 and cdc2 in nonmalignant and malignant human breast lesions: Immunocytochemical and quantitative image analyses. Am. J. Pathol. 1997, 150, 15–23. [Google Scholar]
  25. Dutta, A.; Chandra, R.; Leiter, L.M.; Lester, S. Cyclins as markers of tumor proliferation: Immunocytochemical studies in breast cancer. Proc. Natl. Acad. Sci. USA 1995, 92, 5386–5390. [Google Scholar] [CrossRef] [Green Version]
  26. Cargnello, M.; Roux, P.P. Activation and function of the MAPKs and their substrates, the MAPK-activated protein kinases. Microbiol. Mol. Biol. Rev. 2011, 75, 50–83. [Google Scholar] [CrossRef] [PubMed] [Green Version]
  27. Robinson, M.J.; Cobb, M.H. Mitogen-activated protein kinase pathways. Curr. Opin. Cell Biol. 1997, 9, 180–186. [Google Scholar] [CrossRef]
  28. Cude, K.; Wang, Y.; Choi, H.J.; Hsuan, S.L.; Zhang, H.; Wang, C.Y.; Xia, Z. Regulation of the G2-M cell cycle progression by the ERK5-NFkappaB signaling pathway. J. Cell Biol. 2007, 177, 253–264. [Google Scholar] [CrossRef] [Green Version]
  29. Carmell, N.; Rominiyi, O.; Myers, K.N.; McGarrity-Cottrell, C.; Vanderlinden, A.; Lad, N.; Perroux-David, E.; El-Khamisy, S.F.; Fernando, M.; Finegan, K.G.; et al. Identification and validation of ERK5 as a DNA damage modulating drug target in glioblastoma. Cancers 2021, 13, 944. [Google Scholar] [CrossRef] [PubMed]
  30. Jiang, W.; Jin, G.; Cai, F.; Chen, X.; Cao, N.; Zhang, X.; Liu, J.; Chen, F.; Wang, F.; Dong, W.; et al. Extracellular signal-regulated kinase 5 increases radioresistance of lung cancer cells by enhancing the DNA damage response. Exp. Mol. Med. 2019, 51, 1–20. [Google Scholar] [CrossRef]
  31. Pereira, D.M.; Gomes, S.E.; Borralho, P.M.; Rodrigues, C.M.P. MEK5/ERK5 activation regulates colon cancer stem-like cell properties. Cell Death Discov. 2019, 5, 68. [Google Scholar] [CrossRef] [Green Version]
  32. Simões, A.E.; Rodrigues, C.M.; Borralho, P.M. The MEK5/ERK5 signalling pathway in cancer: A promising novel therapeutic target. Drug Discov Today 2016, 21, 1654–1663. [Google Scholar] [CrossRef]
  33. Cui, X.; Song, L.; Bai, Y.; Wang, Y.; Wang, B.; Wang, W. Elevated IQGAP1 and CDC42 levels correlate with tumor malignancy of human glioma. Oncol. Rep. 2017, 37, 768–776. [Google Scholar] [CrossRef] [Green Version]
  34. Okura, H.; Golbourn, B.J.; Shahzad, U.; Agnihotri, S.; Sabha, N.; Krieger, J.R.; Figueiredo, C.A.; Chalil, A.; Landon-Brace, N.; Riemenschneider, A.; et al. A role for activated Cdc42 in glioblastoma multiforme invasion. Oncotarget 2016, 7, 56958–56975. [Google Scholar] [CrossRef] [PubMed]
  35. Ekins, S.; Mestres, J.; Testa, B. In silico pharmacology for drug discovery: Methods for virtual ligand screening and profiling. Br. J Pharmacol. 2007, 152, 9–20. [Google Scholar] [CrossRef] [Green Version]
  36. Lawal, B.; Liu, Y.L.; Mokgautsi, N.; Khedkar, H.; Sumitra, M.R.; Wu, A.T.H.; Huang, H.S. Pharmacoinformatics and preclinical studies of NSC765690 and NSC765599, potential STAT3/CDK2/4/6 inhibitors with antitumor activities against NCI60 human tumor cell lines. Biomedicines 2021, 9, 92. [Google Scholar] [CrossRef]
  37. Liu, Z.; Wang, F.; Zhou, Z.W.; Xia, H.C.; Wang, X.Y.; Yang, Y.X.; He, Z.X.; Sun, T.; Zhou, S.F. Alisertib induces G(2)/M arrest, apoptosis, and autophagy via PI3K/Akt/mTOR- and p38 MAPK-mediated pathways in human glioblastoma cells. Am. J. Transl. Res. 2017, 9, 845–873. [Google Scholar]
  38. Chen, T.-C.; Yu, D.-S.; Chen, S.-J.; Chen, C.-L.; Lee, C.-C.; Hsieh, Y.-Y.; Chang, L.-C.; Guh, J.-H.; Lin, J.-J.; Huang, H.-S. Design, synthesis and biological evaluation of tetracyclic azafluorenone derivatives with topoisomerase I inhibitory properties as potential anticancer agents. Arab. J. Chem. 2019, 12, 4348–4364. [Google Scholar] [CrossRef] [Green Version]
  39. Huang, H.S.; Chen, T.C.; Chen, R.H.; Huang, K.F.; Huang, F.C.; Jhan, J.R.; Chen, C.L.; Lee, C.C.; Lo, Y.; Lin, J.J. Synthesis, cytotoxicity and human telomerase inhibition activities of a series of 1,2-heteroannelated anthraquinones and anthra[1,2-d]imidazole-6,11-dione homologues. Bioorg. Med. Chem. 2009, 17, 7418–7428. [Google Scholar] [CrossRef] [PubMed]
  40. Huang, H.W.; Bow, Y.D.; Wang, C.Y.; Chen, Y.C.; Fu, P.R.; Chang, K.F.; Wang, T.W.; Tseng, C.H.; Chen, Y.L.; Chiu, C.C. DFIQ, a novel quinoline derivative, shows anticancer potential by inducing apoptosis and autophagy in NSCLC cell and in vivo zebrafish xenograft models. Cancers 2020, 12, 1348. [Google Scholar] [CrossRef] [PubMed]
  41. Shoemaker, R.H. The NCI60 human tumour cell line anticancer drug screen. Nat. Rev. Cancer 2006, 6, 813–823. [Google Scholar] [CrossRef]
  42. Edgar, R.; Domrachev, M.; Lash, A.E. Gene expression omnibus: NCBI gene expression and hybridization array data repository. Nucleic Acids Res. 2002, 30, 207–210. [Google Scholar] [CrossRef] [PubMed] [Green Version]
  43. Barrett, T.; Wilhite, S.E.; Ledoux, P.; Evangelista, C.; Kim, I.F.; Tomashevsky, M.; Marshall, K.A.; Phillippy, K.H.; Sherman, P.M.; Holko, M.; et al. NCBI GEO: Archive for functional genomics data sets--update. Nucleic Acids Res. 2013, 41, D991–D995. [Google Scholar] [CrossRef] [PubMed] [Green Version]
  44. Pogodin, P.V.; Lagunin, A.A.; Filimonov, D.A.; Poroikov, V.V. PASS Targets: Ligand-based multi-target computational system based on a public data and naïve Bayes approach. SAR QSAR Environ. Res. 2015, 26, 783–793. [Google Scholar] [CrossRef] [PubMed]
  45. Gfeller, D.; Grosdidier, A.; Wirth, M.; Daina, A.; Michielin, O.; Zoete, V. SwissTargetPrediction: A web server for target prediction of bioactive small molecules. Nucleic Acids Res. 2014, 42, W32–W38. [Google Scholar] [CrossRef]
  46. Mokgautsi, N.; Wang, Y.C.; Lawal, B.; Khedkar, H.; Sumitra, M.R.; Wu, A.T.H.; Huang, H.S. Network pharmacological analysis through a bioinformatics approach of novel NSC765600 and NSC765691 compounds as potential inhibitors of CCND1/CDK4/PLK1/CD44 in cancer types. Cancers 2021, 13, 2523. [Google Scholar] [CrossRef] [PubMed]
  47. Uhlén, M.; Fagerberg, L.; Hallström, B.M.; Lindskog, C.; Oksvold, P.; Mardinoglu, A.; Sivertsson, Å.; Kampf, C.; Sjöstedt, E.; Asplund, A.; et al. Proteomics. Tissue-based map of the human proteome. Science 2015, 347, 1260419. [Google Scholar] [CrossRef]
  48. Jia, D.; Li, S.; Li, D.; Xue, H.; Yang, D.; Liu, Y. Mining TCGA database for genes of prognostic value in glioblastoma microenvironment. Aging 2018, 10, 592–605. [Google Scholar] [CrossRef] [Green Version]
  49. Szklarczyk, D.; Franceschini, A.; Wyder, S.; Forslund, K.; Heller, D.; Huerta-Cepas, J.; Simonovic, M.; Roth, A.; Santos, A.; Tsafou, K.P.; et al. STRING v10: Protein-protein interaction networks, integrated over the tree of life. Nucleic Acids Res. 2015, 43, D447–D452. [Google Scholar] [CrossRef]
  50. Xia, J.; Benner, M.J.; Hancock, R.E. NetworkAnalyst—Integrative approaches for protein-protein interaction network analysis and visual exploration. Nucleic Acids Res. 2014, 42, W167–W174. [Google Scholar] [CrossRef] [Green Version]
  51. Zhou, G.; Soufan, O.; Ewald, J.; Hancock, R.E.W.; Basu, N.; Xia, J. NetworkAnalyst 3.0: A visual analytics platform for comprehensive gene expression profiling and meta-analysis. Nucleic Acids Res. 2019, 47, W234–W241. [Google Scholar] [CrossRef] [Green Version]
  52. Bowman, R.L.; Wang, Q.; Carro, A.; Verhaak, R.G.; Squatrito, M. GlioVis data portal for visualization and analysis of brain tumor expression datasets. Neuro. Oncol. 2017, 19, 139–141. [Google Scholar] [CrossRef] [Green Version]
  53. Ritchie, T.J.; Ertl, P.; Lewis, R. The graphical representation of ADME-related molecule properties for medicinal chemists. Drug Discov. Today 2011, 16, 65–72. [Google Scholar] [CrossRef] [PubMed]
  54. Mokgautsi, N.; Wen, Y.T.; Lawal, B.; Khedkar, H.; Sumitra, M.R.; Wu, A.T.H.; Huang, H.S. An integrated bioinformatics study of a novel Niclosamide derivative, NSC765689, a Potential GSK3β/β-Catenin/STAT3/CD44 suppressor with anti-glioblastoma properties. Int J. Mol. Sci. 2021, 22, 2464. [Google Scholar] [CrossRef] [PubMed]
  55. Daina, A.; Michielin, O.; Zoete, V. SwissADME: A free web tool to evaluate pharmacokinetics, drug-likeness and medicinal chemistry friendliness of small molecules. Sci. Rep. 2017, 7, 42717. [Google Scholar] [CrossRef] [Green Version]
  56. Lawal, B.; Lo, W.C.; Mokgautsi, N.; Sumitra, M.R.; Khedkar, H.; Wu, A.T.; Huang, H.S. A preclinical report of a cobimetinib-inspired novel anticancer small-molecule scaffold of isoflavones, NSC777213, for targeting PI3K/AKT/mTOR/MEK in multiple cancers. Am. J. Cancer Res. 2021, 11, 2590–2617. [Google Scholar]
  57. Lipinski, C.A.; Lombardo, F.; Dominy, B.W.; Feeney, P.J. Experimental and computational approaches to estimate solubility and permeability in drug discovery and development settings. Adv. Drug Deliv. Rev. 2001, 46, 3–26. [Google Scholar] [CrossRef]
  58. Daina, A.; Zoete, V. A BOILED-Egg To predict gastrointestinal absorption and brain penetration of small molecules. ChemMedChem 2016, 11, 1117–1121. [Google Scholar] [CrossRef] [Green Version]
  59. Martin, Y.C. A bioavailability score. J. Med. Chem. 2005, 48, 3164–3170. [Google Scholar] [CrossRef] [PubMed]
  60. Morris, G.M.; Lim-Wilby, M. Molecular docking. Methods Mol. Biol 2008, 443, 365–382. [Google Scholar] [CrossRef]
  61. Hanwell, M.D.; Curtis, D.E.; Lonie, D.C.; Vandermeersch, T.; Zurek, E.; Hutchison, G.R. Avogadro: An advanced semantic chemical editor, visualization, and analysis platform. J. Cheminform 2012, 4, 17. [Google Scholar] [CrossRef] [PubMed] [Green Version]
  62. Temml, V.; Kaserer, T.; Kutil, Z.; Landa, P.; Vanek, T.; Schuster, D. Pharmacophore modeling for COX-1 and -2 inhibitors with LigandScout in comparison to Discovery Studio. Future Med. Chem. 2014, 6, 1869–1881. [Google Scholar] [CrossRef] [PubMed]
  63. Rapp, C.; Warta, R.; Stamova, S.; Nowrouzi, A.; Geisenberger, C.; Gal, Z.; Roesch, S.; Dettling, S.; Juenger, S.; Bucur, M.; et al. Identification of T cell target antigens in glioblastoma stem-like cells using an integrated proteomics-based approach in patient specimens. Acta Neuropathol. 2017, 134, 297–316. [Google Scholar] [CrossRef] [PubMed]
Figure 1. Rationale of NSC772862 (SJ10) and some of the representative drugs in natural products and marketed drugs.
Cancers 14 00262 g001
Figure 2. Differentially-expressed genes (DEGs) in glioblastoma multiforme (GBM) extracted from the GSE4290, GSE68846, and GSE30563 microarray datasets. (A) Venn diagram of 87 selected overexpressed overlapping DEGs. (B) Venn diagram of 50 selected downregulated overlapping DEGs. (C) is the heatmap of overexpressed overlapping genes. (DF) Volcano plots of DEGs from the GSE4290, GSE68848 and GSE30563 datasets with red and blue dots respectively representing upregulated and downregulated genes (at p < 0.05).
Cancers 14 00262 g002
Figure 3. SJ10 passed the required physicochemical properties, medicinal chemistry, pharmacokinetics (PK), and drug-likeness criteria. (A,B) Structure of the SJ10 (NSC772862) small molecule, bioavailability radar (BA), displaying the six physicochemical properties of absorption including lipophilicity (XLOGP3 = 3.90), molecular weight (349.10 g/mol), polarity (PSA = 37.08 Å2), solubility (Log S (ESOL) = −4.7), flexibility (rotation = 4), saturation (fraction Csp3 = 0.2), and pKa of the most basic or acidic group (= 0.5) of the SJ10 compound. In addition, the SJ10 compound demonstrated a highly-probable GIA absorption, bioavailability score (55%) and good synthetic accessibility (2.89). (C) The compound passed the blood–brain barrier (BBB) with a score of 4.98, and further displayed a drug-like model score of −0.68. A structural characterization of the compounds was done with the help of spectroscopic studies including IR, proton NMR, 13C NMR, MS, and elemental analysis (D).
Cancers 14 00262 g003
Figure 4. CCNB1/CDC42/MAPK7/CD44 oncogenic signatures are overexpressed in glioblastoma multiforme (GBM). (AD) Increased mRNA levels of CCNB1/CDC42/MAPK7/CD44 in pan cancers, including GBM tumor tissues, compared to normal tissues from The Cancer Genome Atlas (TCGA). The relative gene expression level is indicated as transcripts per million (TPM), and expression values were normalized by log transformation of the statistical significance as evaluated by the Wilcoxon test, with p value significant codes: 0 ≤ *** < 0.001 ≤ ** < 0.01 ≤ * < 0.05 ≤. < 0.1. (EH) Correlation analysis of CCNB1/CDC42/MAPK7/CD44 oncogenes revealed correlations among all four genes when combined for analysis. Predicted results showed positive correlations ranging r = 0.43~0.67 of CCNB1 with CDC42, CCNB1 with MAPK7, CCNB1 with CD44, and MAPK7 with CD44 in GBM samples, with positive Pearson correlation coefficient and p < 0.05 considered statistically significant.
Cancers 14 00262 g004
Figure 5. Increased expressions of CCNB1/CDC42/MAPK7/CD44 oncogenic signatures in glioblastoma. (A) CCNB1 displayed medium IHC staining, with strong intensity and quantity (25%). (B) CDC42 displayed medium IHC staining, with moderate intensity and quantity (75%). (C,D) MAPK7 and CD44 displayed high IHC staining with strong intensity and quantity (75%), in GBM tissues as compared to normal tissues. (EH) Increased mRNA expression levels of CCNB1/CDC42/MAPK7/CD44 oncogenes in GBM tissues compared to non-tumor tissues from a GlioVis database analysis. (IL) Expressions of CCNB1/CDC42/MAPK7/CD44 gene signatures in WHO grade II, III, and IV GBM tumors using the Analysis of variance (ANOVA), with p < 0.05 considered statistically significant in all datasets. All images can be found online.
Cancers 14 00262 g005
Figure 6. HPA staining results of the U251-MG cell line exhibited the locations of genes. Antibodies are shown in green, nuclei in blue, and microtubules in red. (A) CCNB1 was localized in the cytosol, (B) CDC42 was detected in microtubules, (C) while the localization of MAPK7 was in the nucleoplasm, and (D) CD44 was found in plasma membranes. All images are available online.
Cancers 14 00262 g006
Figure 7. Protein–protein interaction (PPI) network revealed interactions among the CCNB1/CDC42/MAPK7/CD44 oncogenes in glioblastoma multiforme (GBM). (A) The clustering network consisted of nine nodes and 15 edges, with an average local clustering coefficient of 0.917 and a PPI enrichment p value of 0.0293. Moreover, the interaction score confidence was set to >0.4, and p < 0.05 was considered statistically significant. Active interactions were based on text mining, experiments, databases, co-expressions, neighborhood, gene fusion, and co-occurrence. (B) The top biological processes (BPs), (C) KEGG pathways, and (D) Signaling network analysis from the BP database, showing that co-expressions of the CCNB1/CDC42/MAPK7/CD44 oncogenes displayed enrichment in the cell cycle, regulation of molecular function, positive regulation of cellular processes, regulation of protein metabolic processes, and protein phosphorylation among others (red bubble). (E) Signaling network analysis of the KEGG pathway enrichment analysis showed co-expression of CCNB1/CDC42/MAPK7/CD44 oncogenes in the same network cluster.
Cancers 14 00262 g007
Figure 8. Optimal cutoff score calculations of Radscores of CCNB1, CDC42, MAPK7, and CD44 expressions in glioblastoma multiforme (GBM). (A,B) Radscores plot of CCNB1 with a cutoff value of 2.83. (C,D) Radscores plot of CDC42 with a cutoff value of 6.62. (E,F) Radscore plot of MAPK7 with a cutoff value of 3.9. (G,H) Radscores plot of CD44 with a cutoff value of 3.48. The low radscores are indicated in blue and high radscores are indicated in red. This analysis shows that patients with lower Radscores generally displayed better overall survival. Therefore, predicted expressions of the CCNB1, CDC42, MAPK7, and CD44 oncogenes exhibited significant roles in the cell cycle, and are thus potential prognostic biomarkers for GBM.
Cancers 14 00262 g008
Figure 9. High expression levels of the CCNB1, CDC42, MAPK7, and CD44 oncogenes were associated with a poor prognosis in glioblastoma multiforme (GBM). (AD) Time-dependent ROC analysis according of the true positive (sensitivity) and false positive (specificity) rates of survival, assessed by the prognostic accuracy based on AUC values. CCNB1 (AUC: 0.552), CDC42 (AUC: 0.566), MAPK7 (AUC: 0.536), and CD44 (AUC: 0.565). An AUC of 0.5 indicates no discrimination, while an AUC of 1.0 indicates discrimination. (EH) Kaplan–Meier analysis predicted a significant prolonged overall survival time in the low-risk group compared to the high-risk group. The analysis was based on the optimal cutoff point from the low- and high-risk groups, and p < 0.05 was considered significant.
Cancers 14 00262 g009
Figure 10. In vitro anticancer screening of SJ10 against NC1-60 CNS cell lines (A) The initial dose was 10 μM. Results showed that SJ10 exhibited antiproliferative activities against various CNS cell lines. The compound growth inhibition (GI) percentage showed that SNB-19 was more sensitive, with GI of 67.25%, followed by SF-539 at 36.91%, SF-268 at 34.33%, SF-295 at 23.75%, and SNB-75 at 22.34%. (B) Dose-dependent treatment results. SF-268 displayed complete growth inhibition at −100%, followed by U251 at −96%, SNB-75 at −84%, SF-539 at −79%, SF-295 at −76%, and SNB-19 at −42%. (C) SRB dual-pass staining was used to further investigate the in vitro GI50/IC50, and results ranged 1.14~2.15 μM for the CNS cell lines, with SNB-75 cells more sensitive at 1.14 μM, followed by U251 at 1.59 μM, SF-268 at 1.64 μM, SNB-19 at 1.67 μM, SF-539 at 1.69 μM, and SF-295 less responsive at 2.15 μM.
Cancers 14 00262 g010
Figure 11. In silico docking results of SJ10 in complex with the CCNB1, CDC42, MAPK7, and CD44 oncogenes in 2D representations. (A) The CCNB-SJ10 complex exhibited a putative binding energy of −7.9 kcal/mol, and displayed interactions by conventional H-bonds (green) with ALA128 and ARG68, and short binding distances of 2.07 and 2.73 Å, respectively. (B) The CDC42-SJ10 complex showed a binding energy of −7.8 kcal/mol, and displayed van der Waals interactions (THR25, PHE28, SER30, THR17, and TYR40), pi-sigma (ILE21), and pi-alkyl (PHE18, LYS27, and PRO29) in their binding pockets. (C) The MAPK7-SJ10 complex displayed a unique binding energy of −8.4 kcal/mol, and further showed conventional hydrogen bonds (SER153), with a shorter binding distance of 2.23 Å. (D) The CD44-SJ10 complex showed a binding energy of −7.8 kcal/mol, and exhibited van der Waals interactions (THR102, GLY103, ARG90, LEU70, TYR79, SER71, ILE96, and ARG78), carbon hydrogen bonds (CYS77), pi-pi T-shaped (TYR42), and pi-alkyl (ILE91) in their binding pockets.
Cancers 14 00262 g011
Figure 12. In silico docking results CDC42 and MAPK7 with standard inhibitors (A) interaction of CDC42 in complex with CASIN exhibited binding energy of (−7.4 kcal/mol). (B) MAPK7 in complex with BAY-885 displayed binding energy of (−7.3 kcal/mol), in 2D representations.
Cancers 14 00262 g012
Table 1. Prediction of Biological Activity Spectra (PASS) and Swiss target genes and classes of the SJ10 compound.
SwissTarget PredictionPASS Prediction Results
Target GeneTarget ClassPAPIActivities
AKT1Kinase0.7030.054MAP kinase kinase 4 inhibitor
MAPK8Kinase0.6520.014Histidine kinase inhibitor
TTKKinase0.5980.088Cyclic AMP phosphodiesterase inhibitor
PIM2Kinase0.5130.024MAP3K5 inhibitor
CDK9Kinase0.4870.037Antineoplastic (glioblastoma multiforme)
SLC6A3ECT0.5290.091Protein kinase inhibitor
EGFRKinase0.4220.004Focal adhesion kinase inhibitor
CDK2Kinase0.4450.040Cyclin B1 inhibitor
MAPK7Kinase0.4350.037Apoptosis agonist
MAPK9Kinase0.4150.021Protein kinase B gamma inhibitor
CCNA2 CDK2Kinase0.5410.152MAP kinase kinase 7 inhibitor
CCND1 CDK4Kinase0.3950.020Transcription factor STAT3 inhibitor
CDK1 CCNB1Other cytosolic protein0.4070.049T cell inhibitor
CDK2 CCNA1 CCNA2Other cytosolic protein0.4070.055Wee-1 tyrosine kinase inhibitor
MAPK1Kinase0.3530.042CDC42 inhibitor
MAPK3Kinase0.4060.102Check point kinase 2 inhibitor
Pa > Pi, Pa, probability of being active; Pi, probability of being inactive.
Table 2. Analytical summary table showing interactions of SJ10 with CCNB1/CDC42/MAPK7/ CD44 oncogenes.
SJ10-CCNB1 Complex (=−7.9 kcal/mol)SJ10-CDC42 Complex (=−7.6 kcal/mol)
Type of interactions and number of bondsdistance of interacting Amino acidsType of interactions and number of bondsdistance of interacting Amino acids
Conventional Hydrogen bond (2)ALA128 (2.07 Å) and ARG68 (2.73Å)Van der Waals forcesTHR25, PHE28, SER30, THR17, and TYR40
Van der Waals forcesASN130, LEU129, PHE131, GLY132, PHE131, ASN130, GLY134, and PRO136 Pi-SigmaILE21
Pi-SigmaGLY132Pi-alkylPHE18, LYS27, PRO29
Pi-AlkylLEU17, LEU17, and ARG135
SJ10-MAPK7 Complex (=−8.4 kcal/mol)SJ10-CD44 Complex (=−7.0 kcal/mol)
Type of interactions and number of bondsdistance of interacting Amino acidsType of interactions and number of bondsdistance of interacting Amino acids
Conventional Hydrogen bond (1)SER153 (2.23 Å)Van der Waals forcesTHR102, GLY103, ARG90, LEU70, TYR79, SER71, ILE96, and ARG78
Van der Waals forcesTHR102, GLY103, ARG90, LEU70, TYR79, SER71, ILE96, and ARG78 TRP192, THR193Carbon hydrogen bondCYS77
Carbon hydrogen bondCYS77pi-pi T-shapedTYR42
Pi-sigmaTHR190Pi-AlkylILE91
Pi-AlkylILE91
Pi-Pi stackedTYR113
Pi-alkylPRO152 and LYS151
Publisher’s Note: MDPI stays neutral with regard to jurisdictional claims in published maps and institutional affiliations.

