


The Good, the Bad and the New about Uric Acid in Cancer

 , , , and
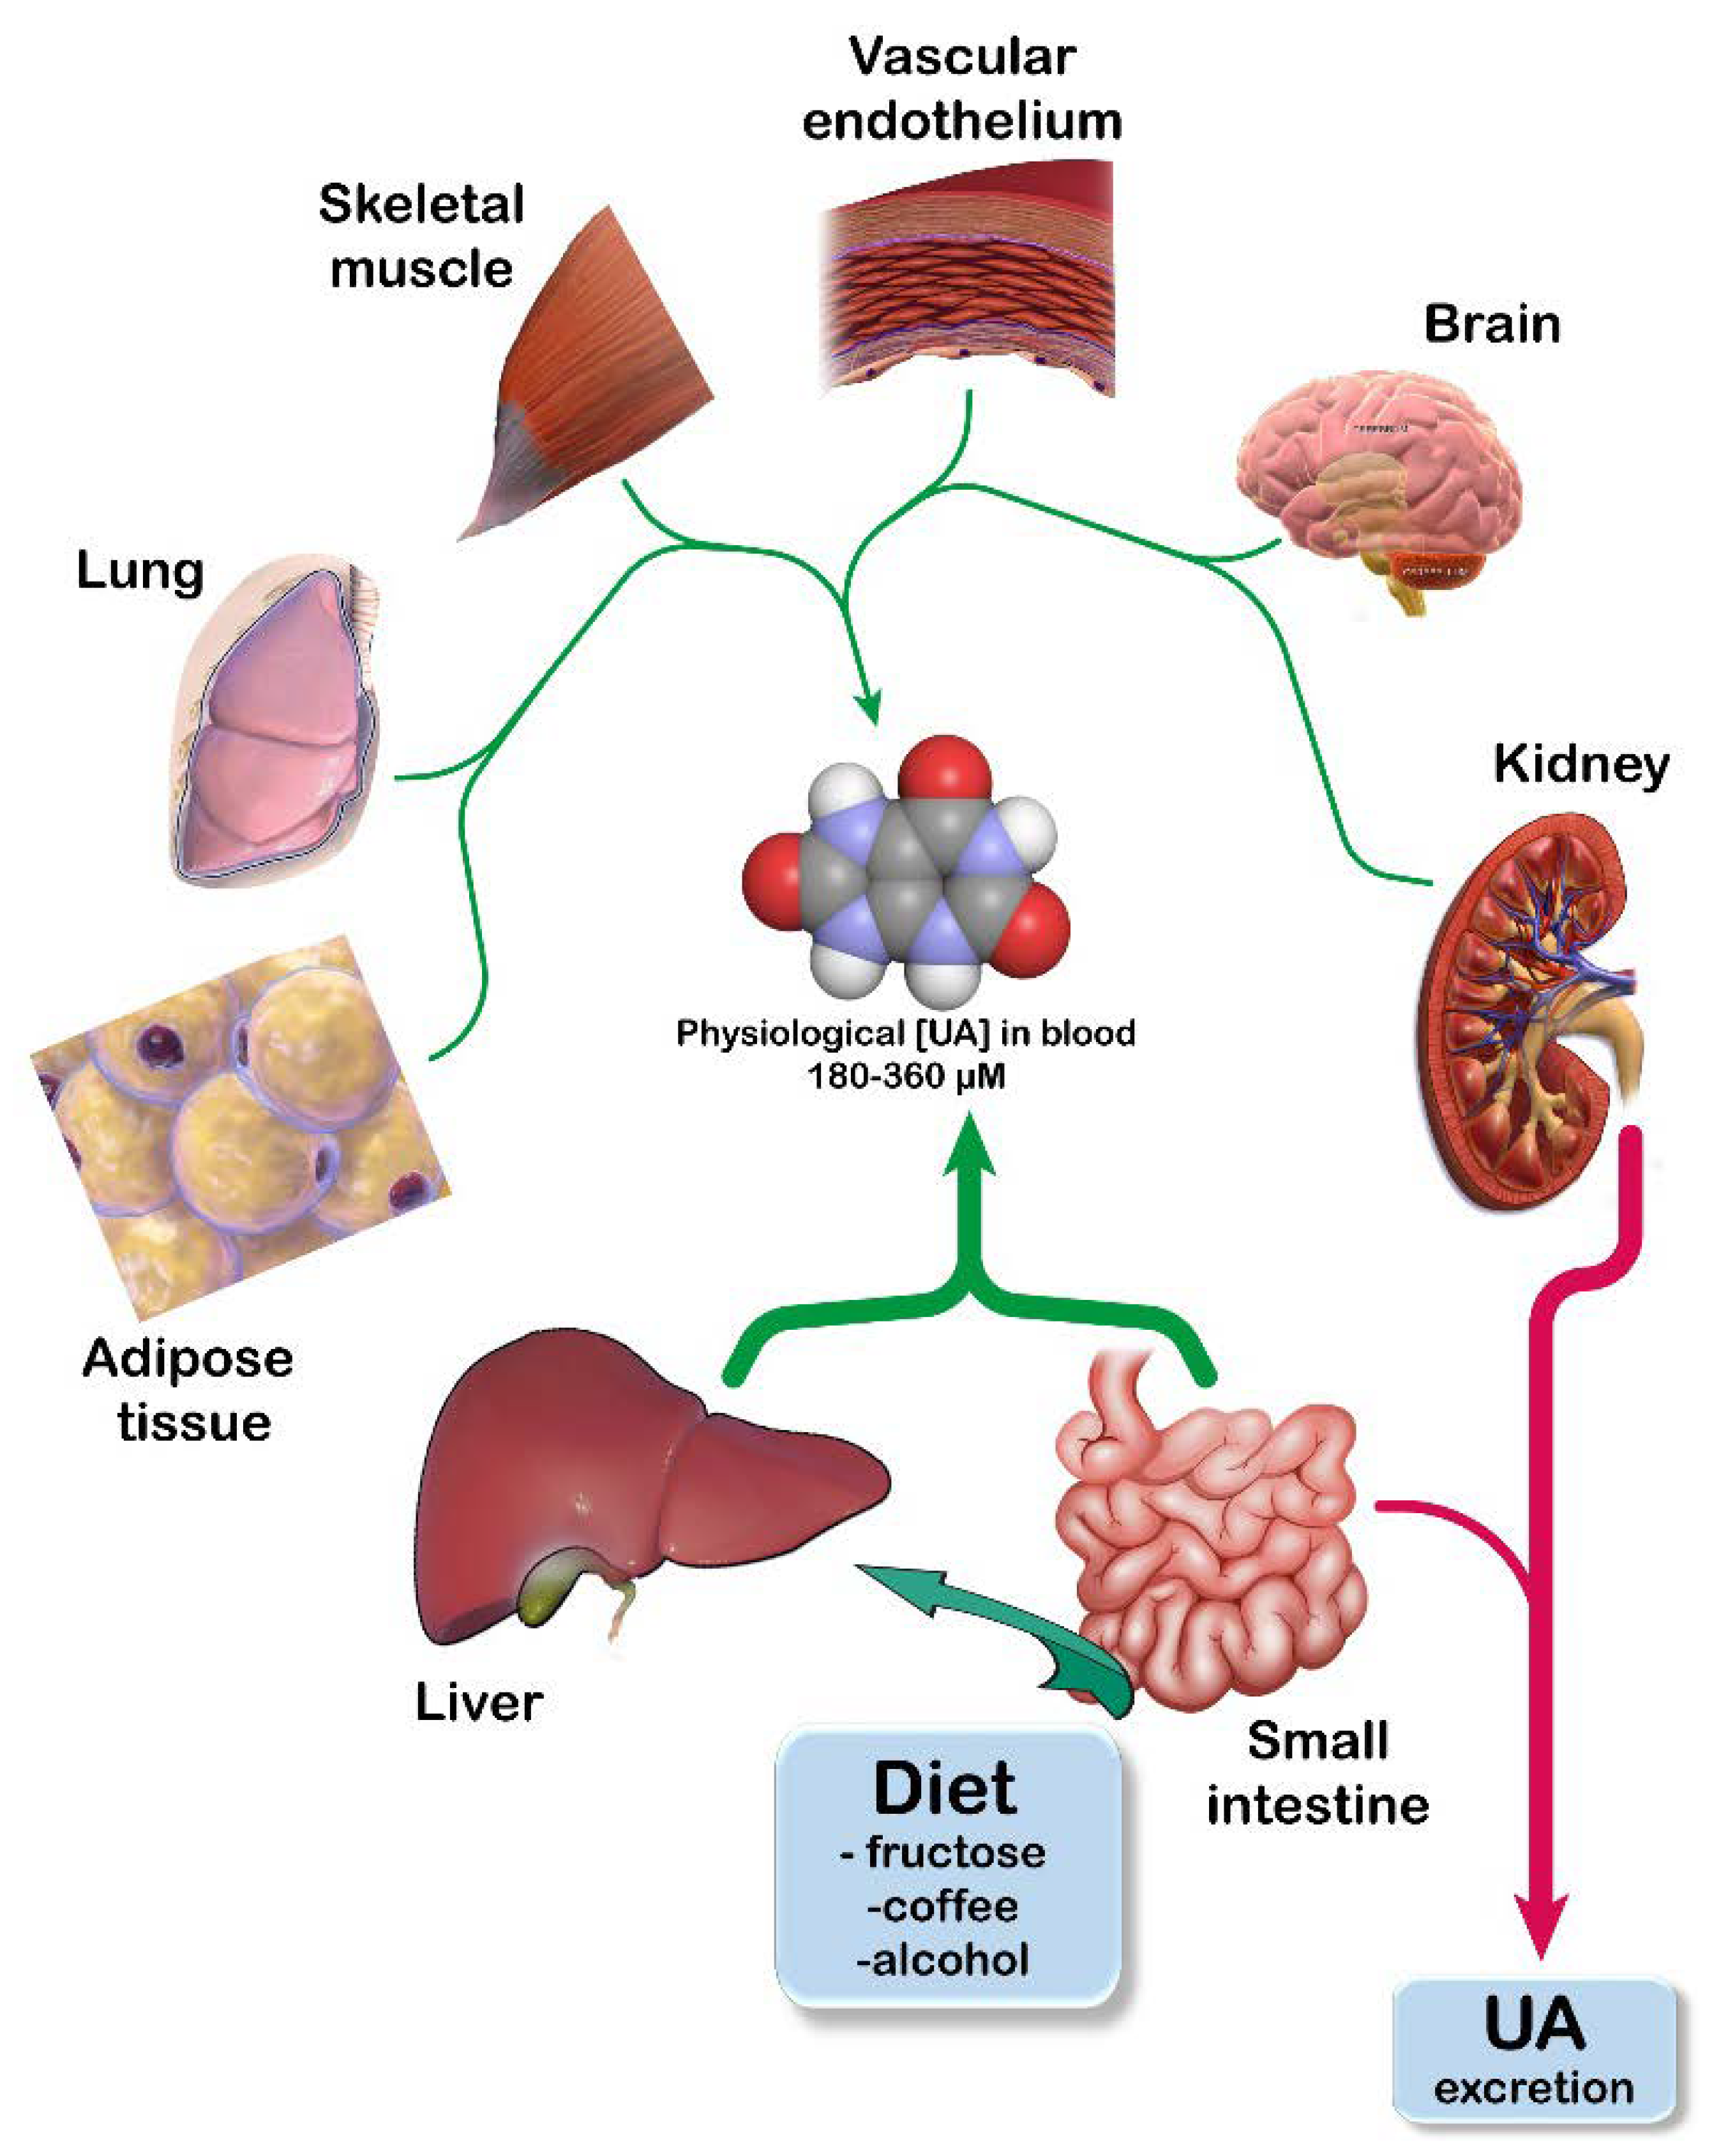
Abstract
Simple Summary
Abstract
1. Introduction
2. UA Homeostasis
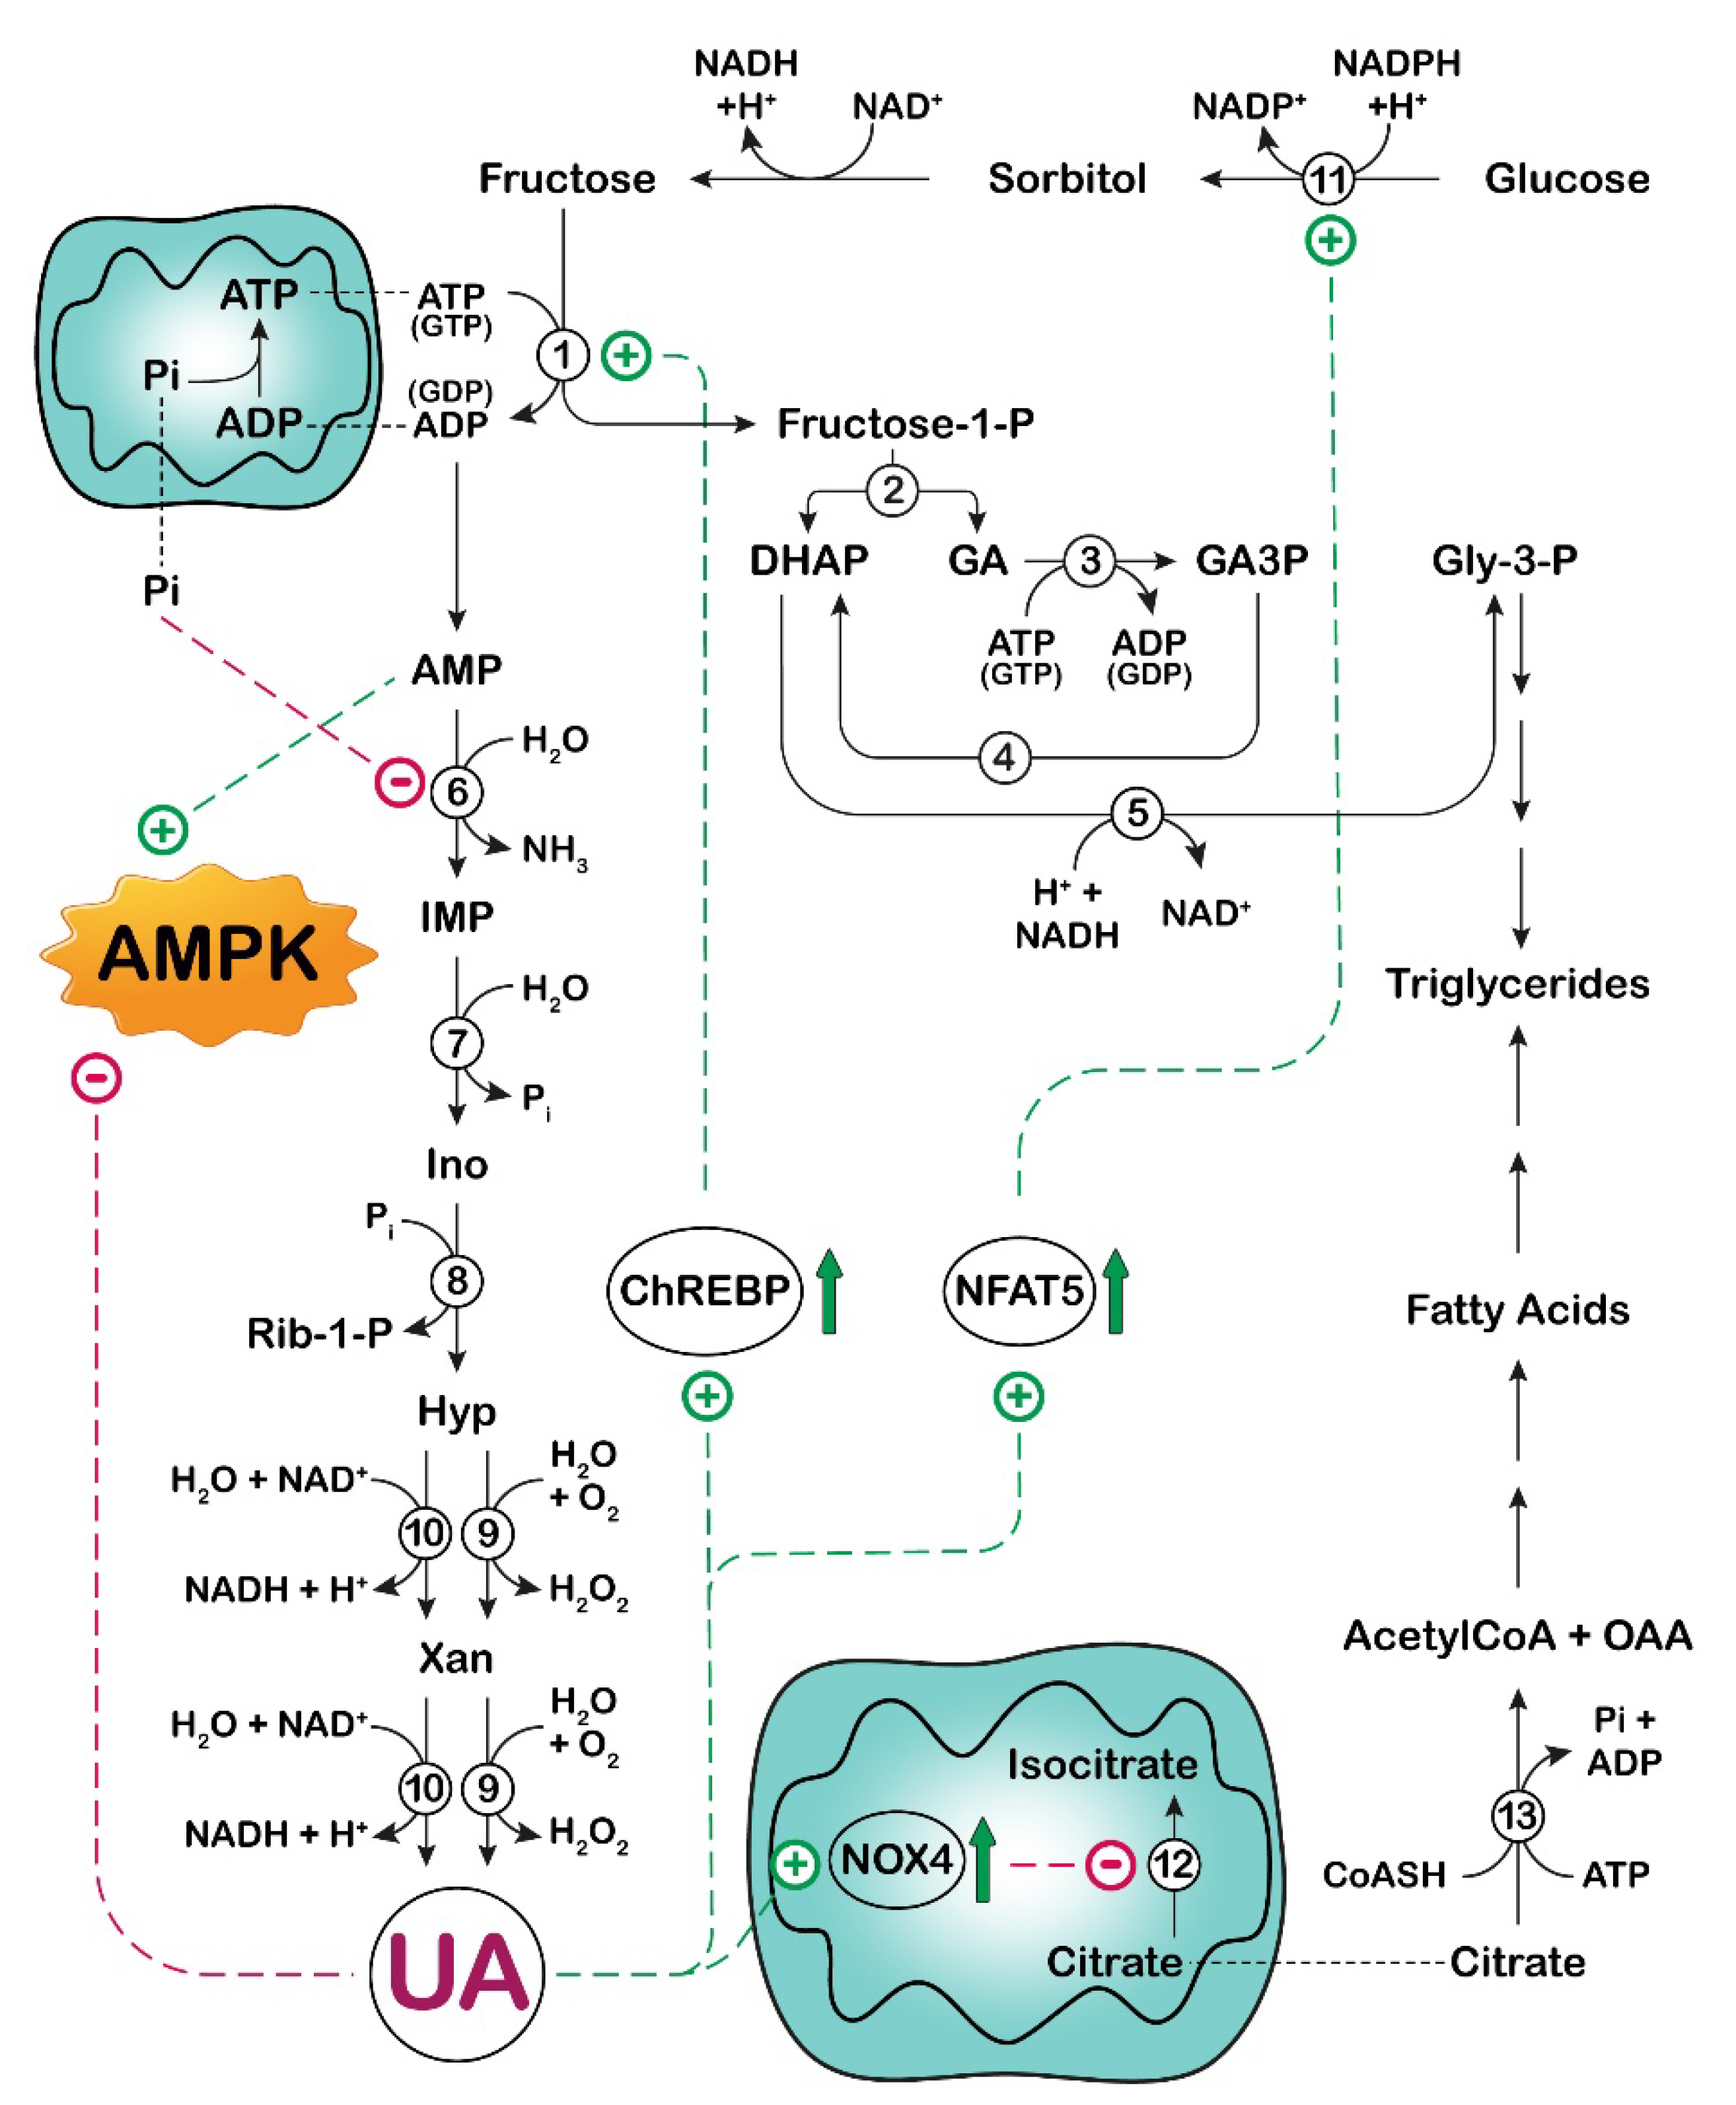
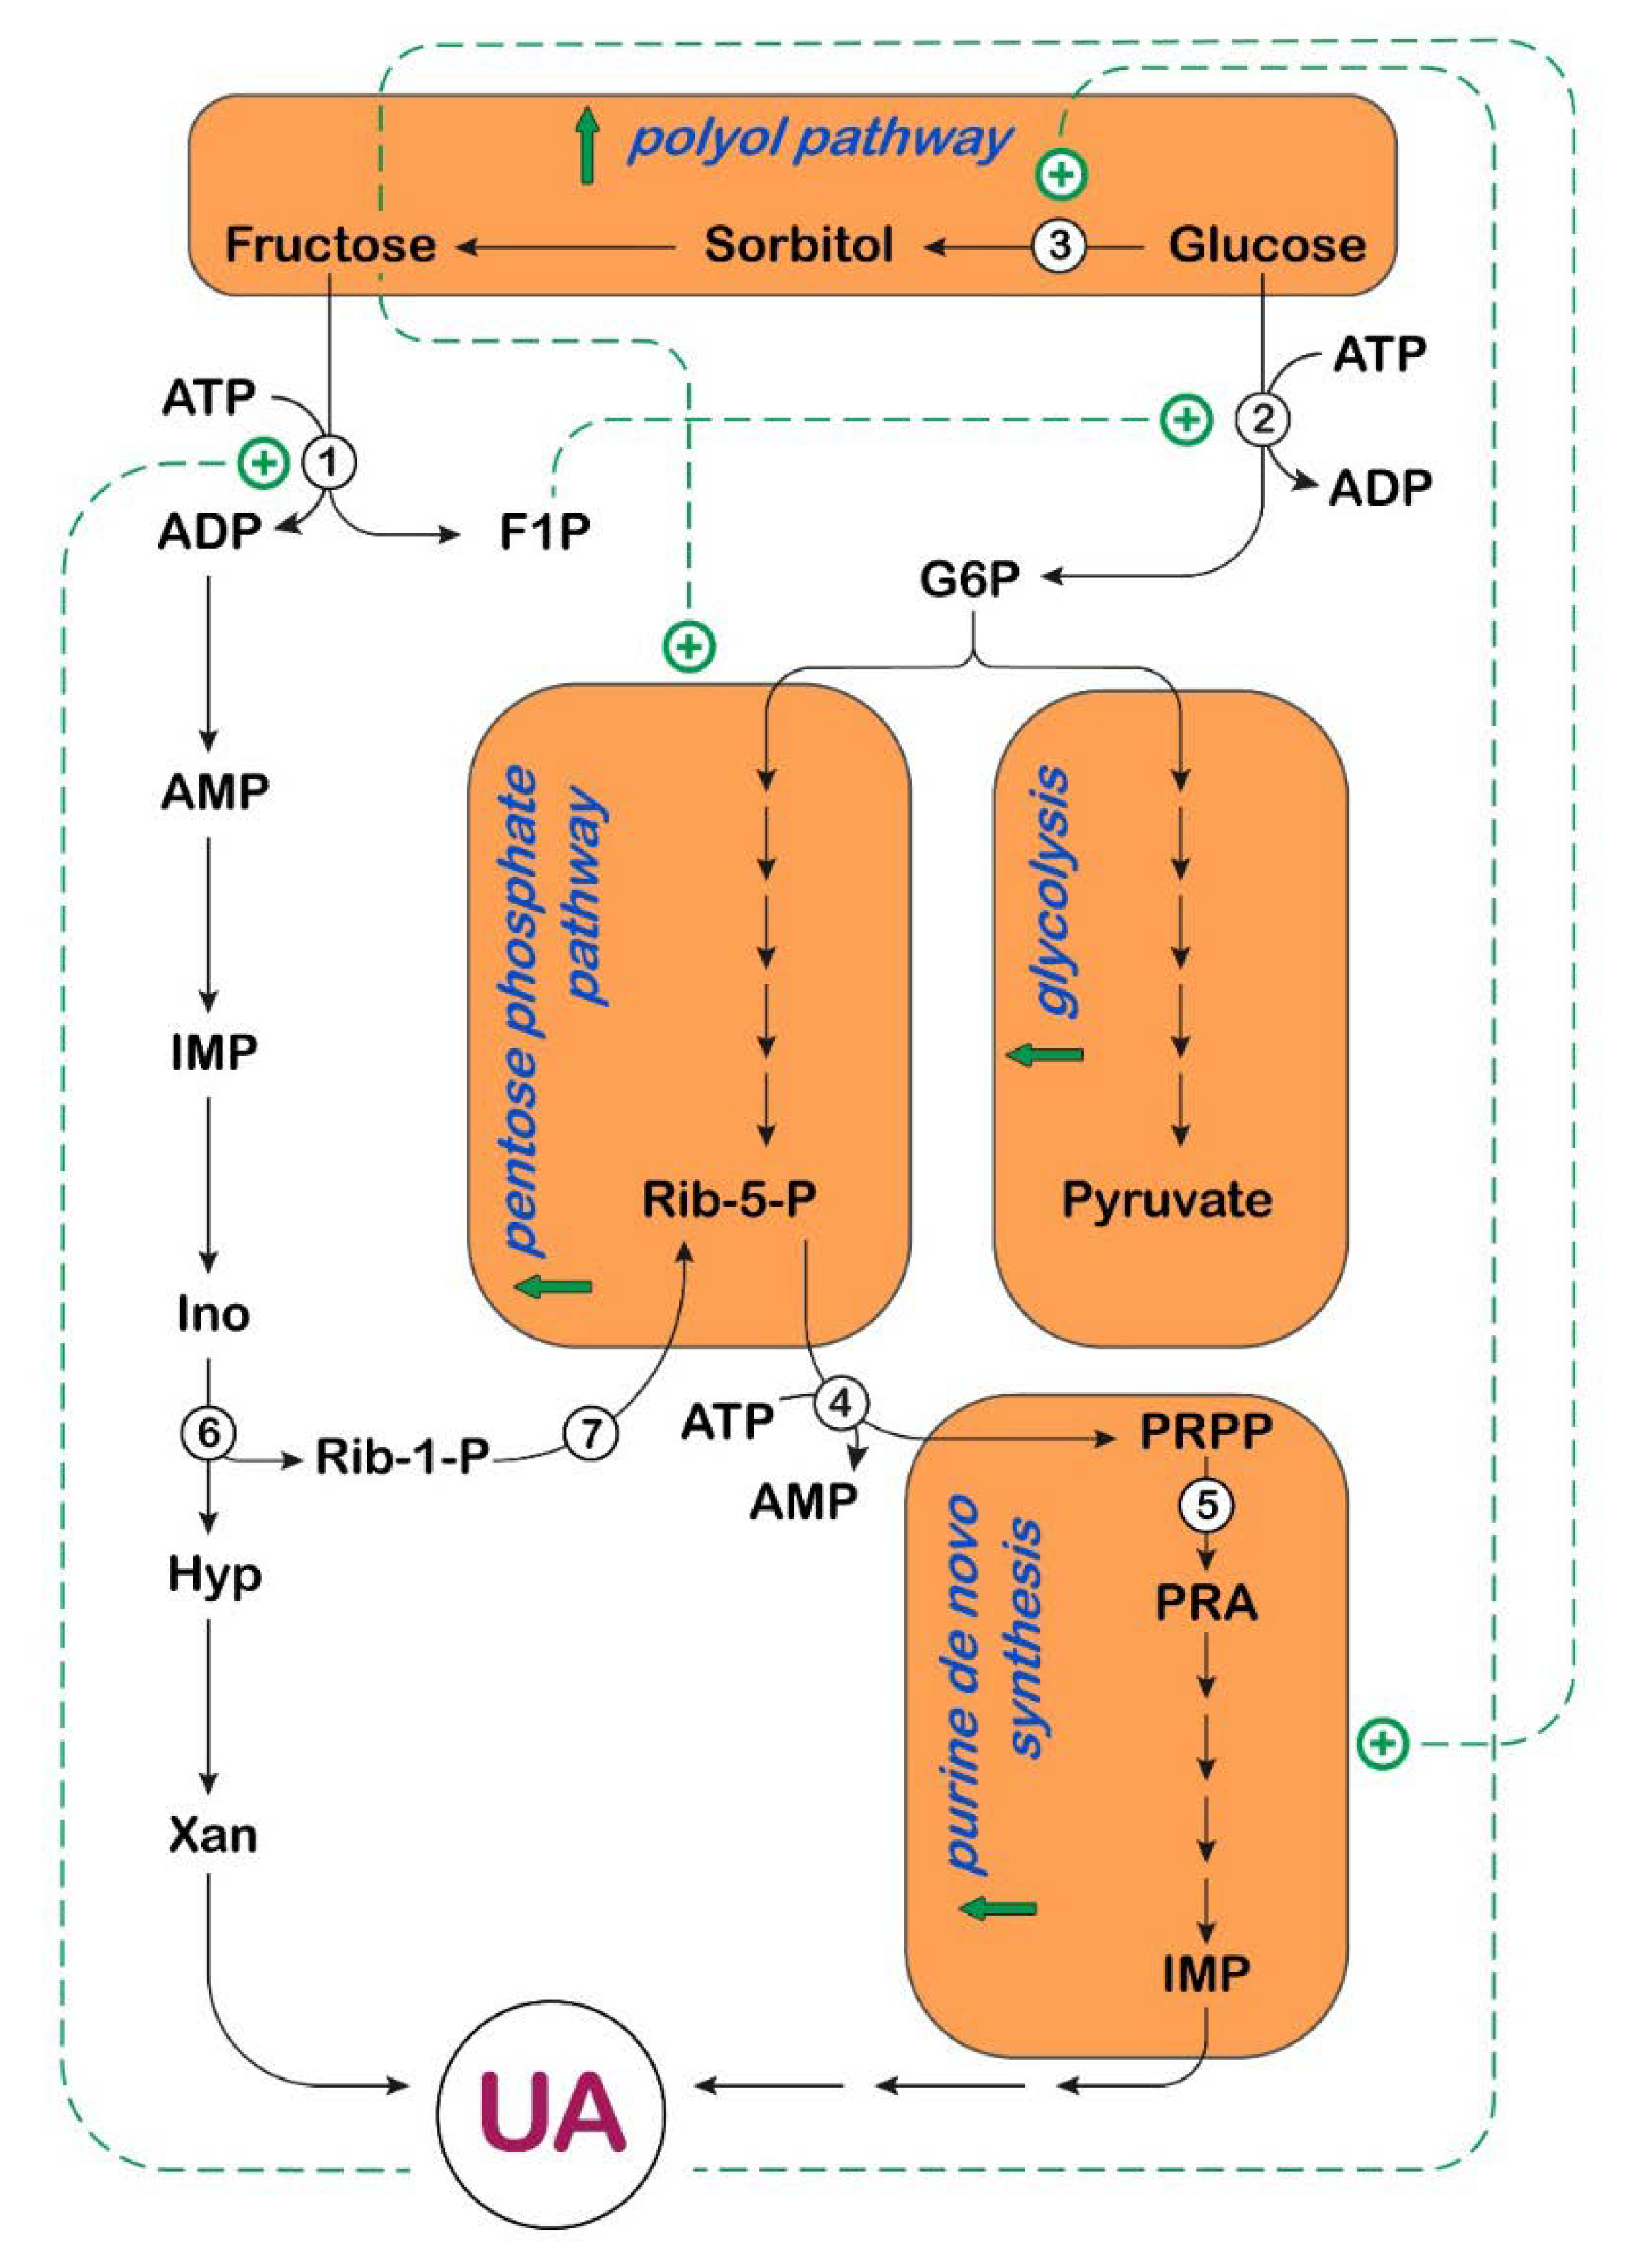
3. UA and Fructose Metabolism in Cancer
 : activation;
  : increase.
: activation; : increase.
: increase.
: activation; : increase.
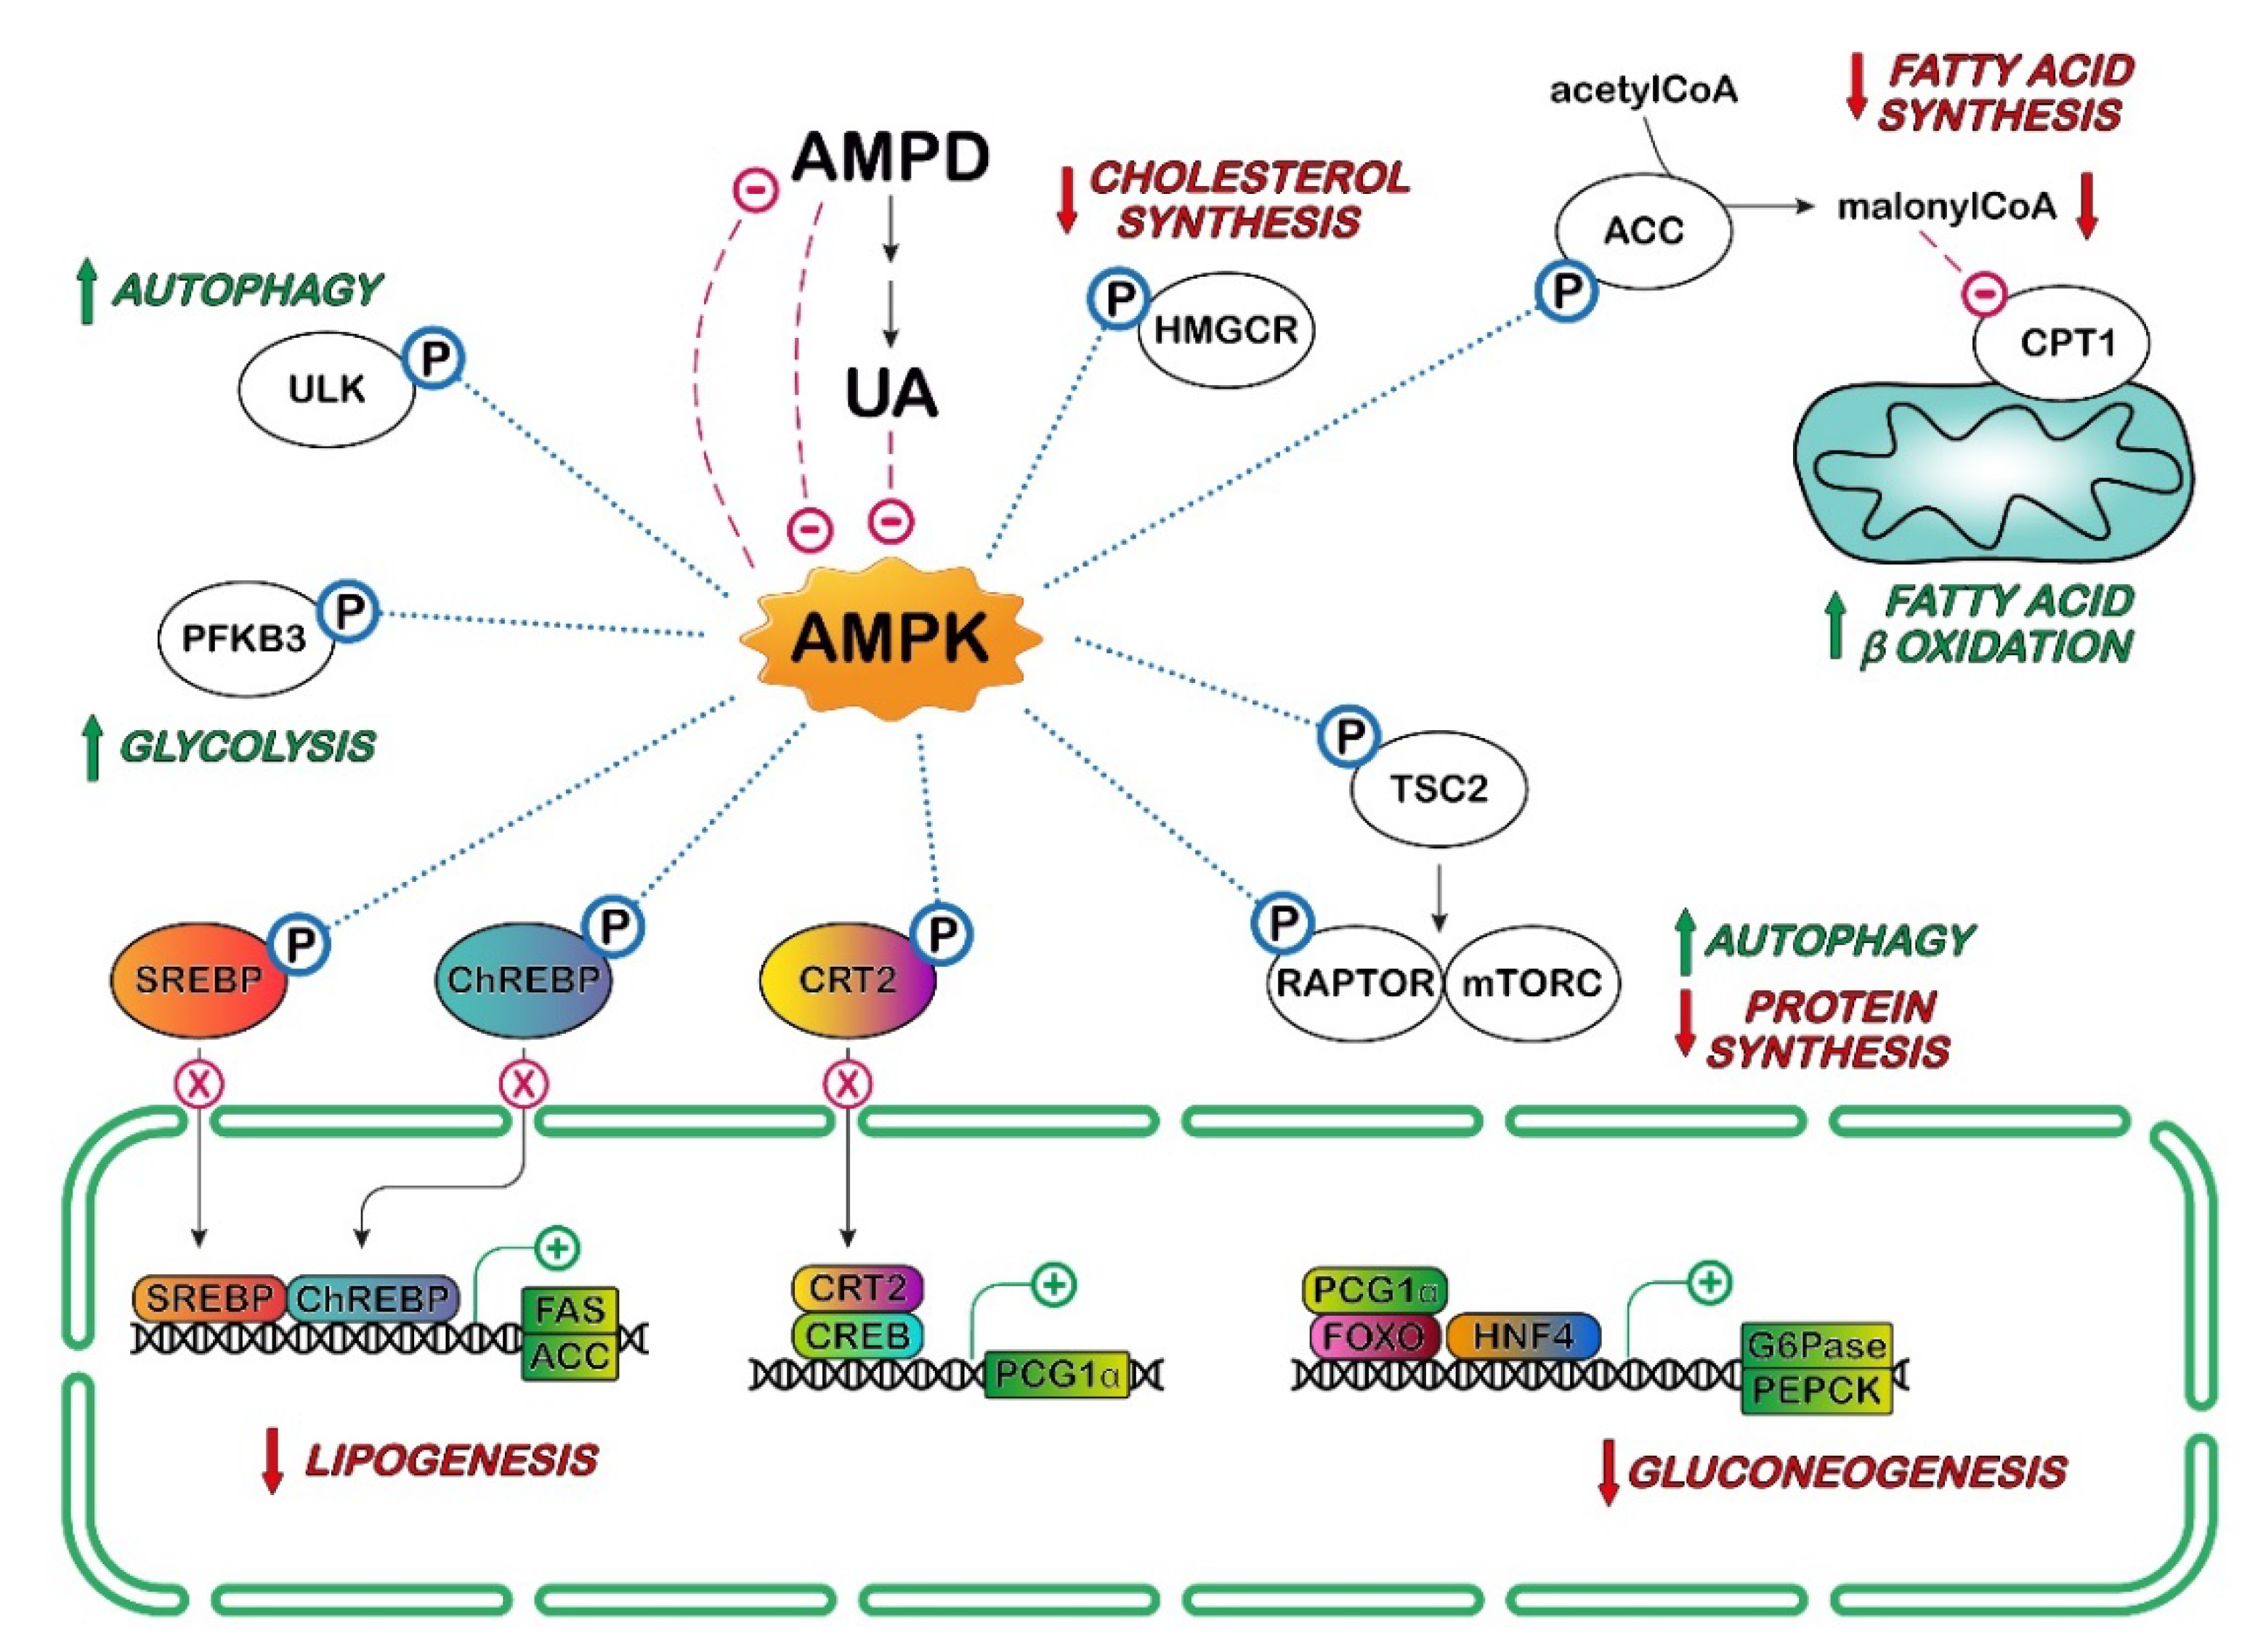
4. UA and AMPK in Cancer
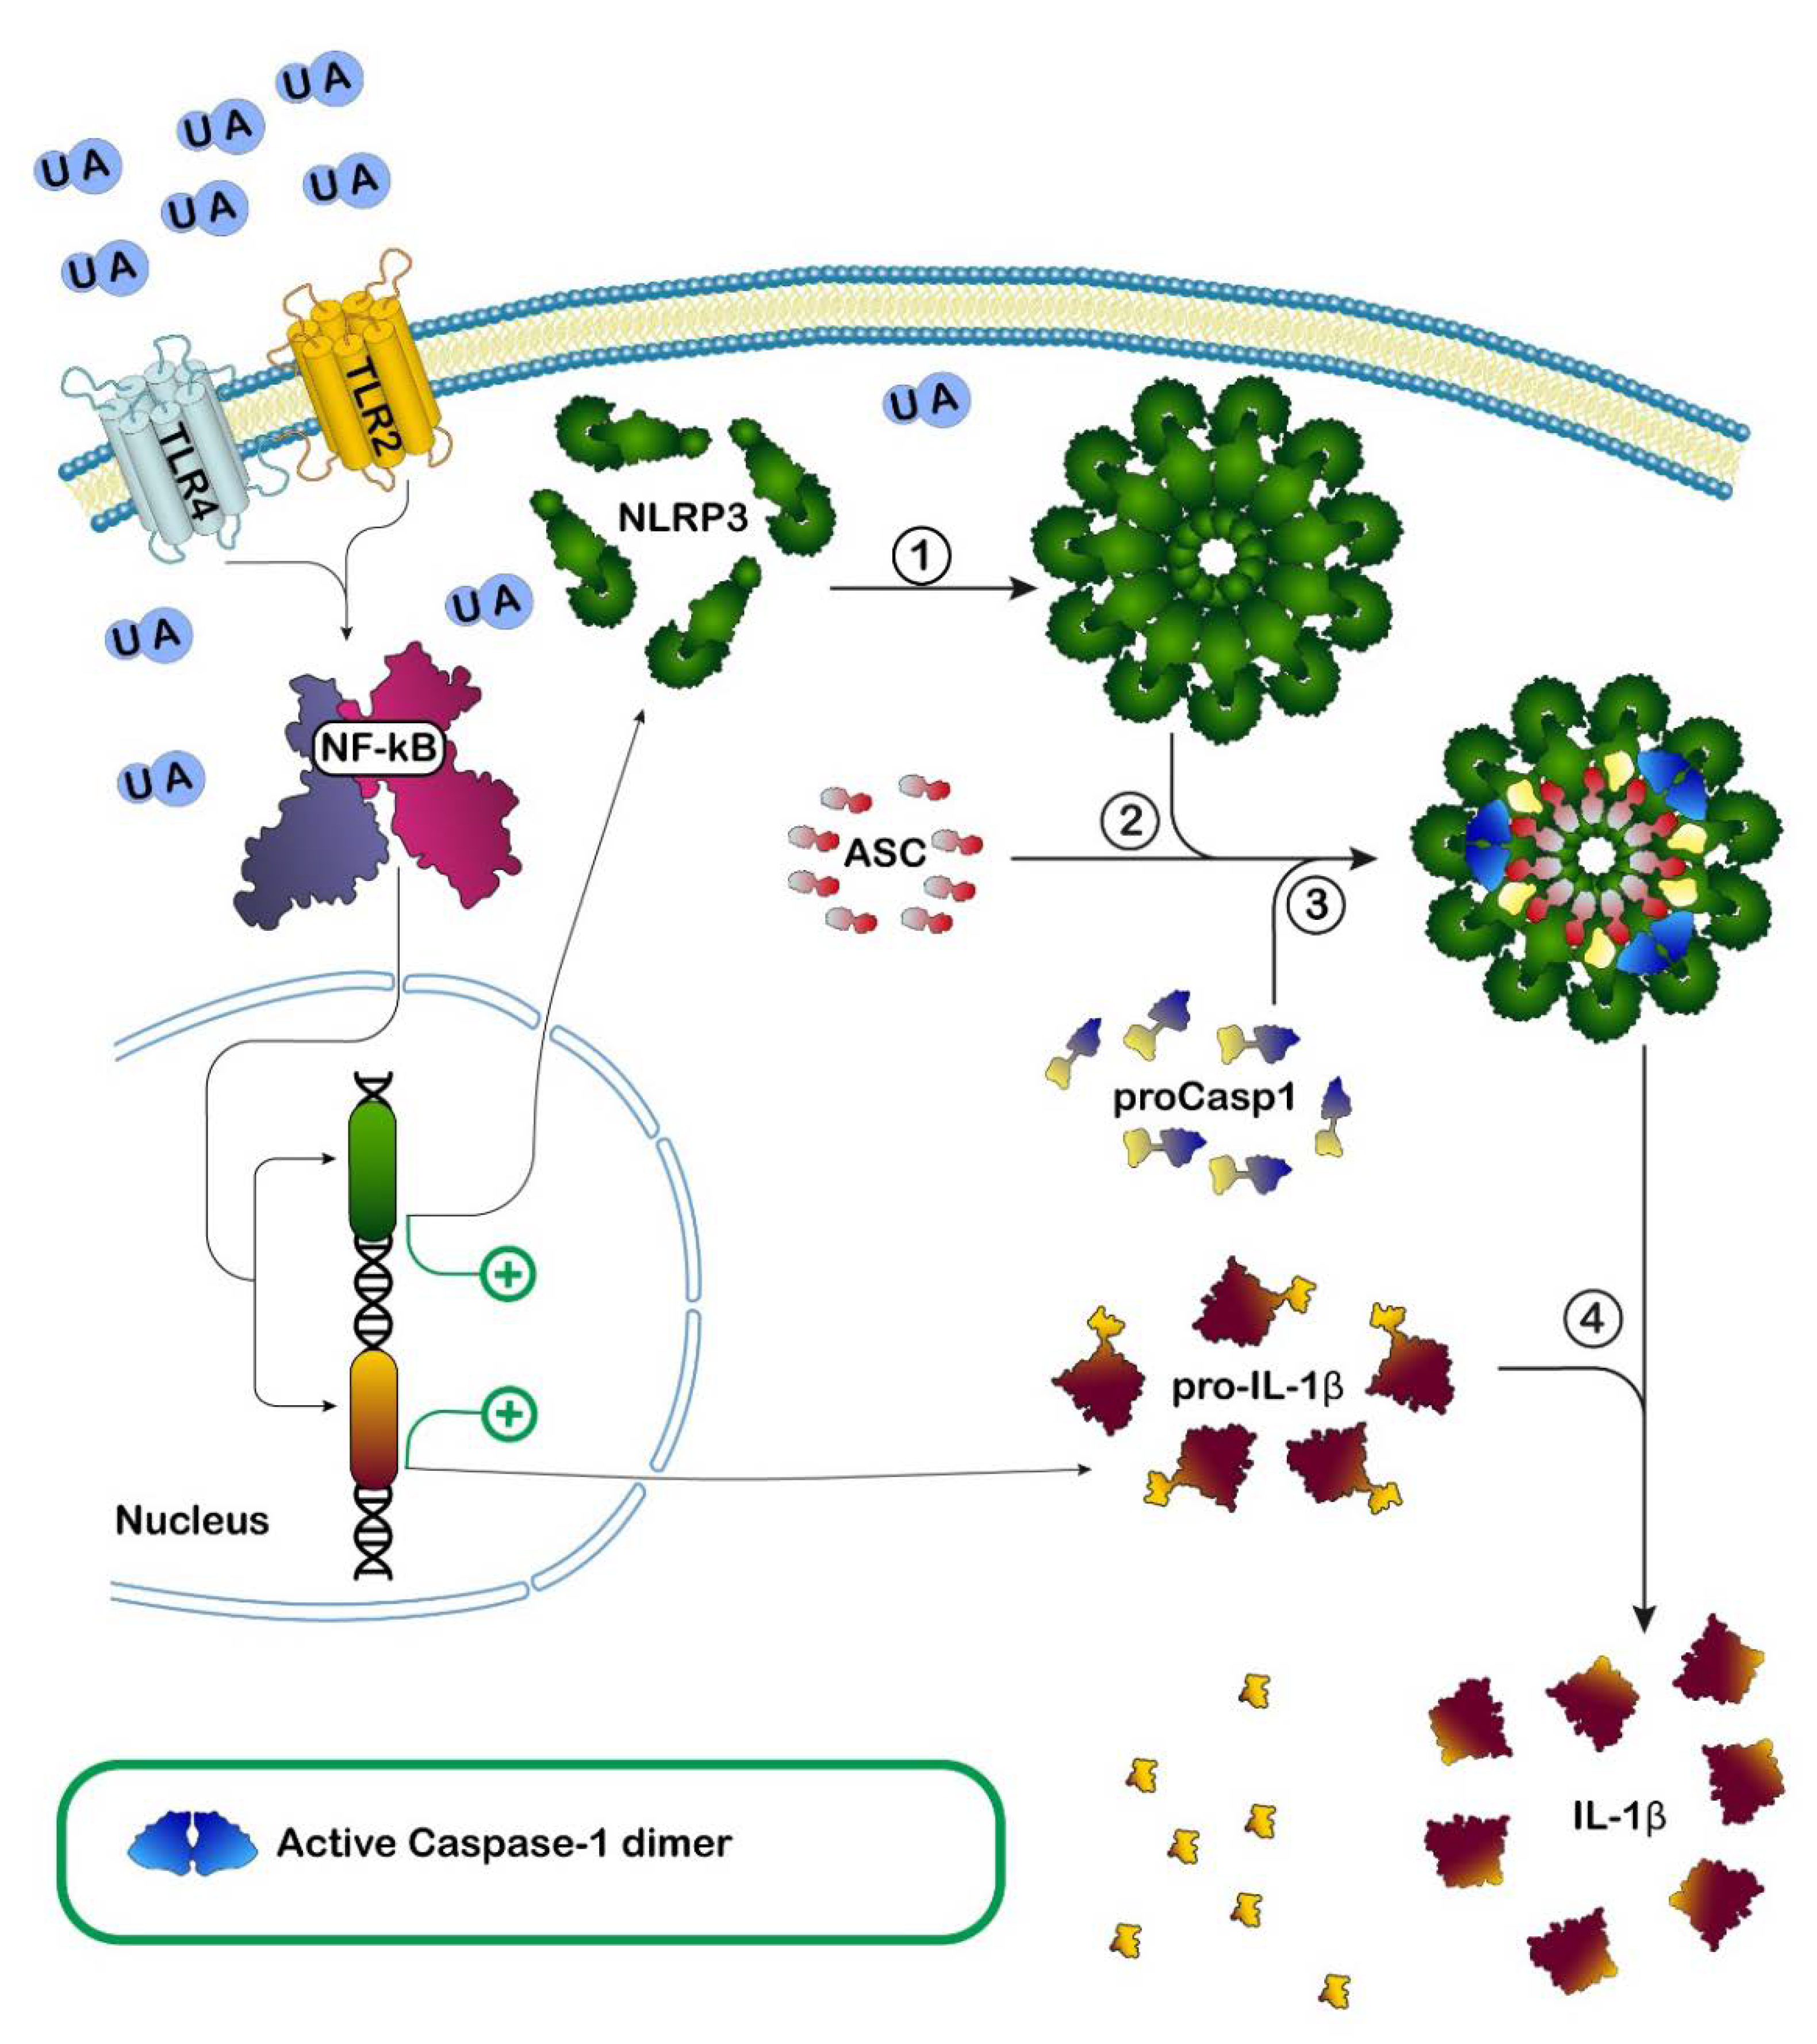
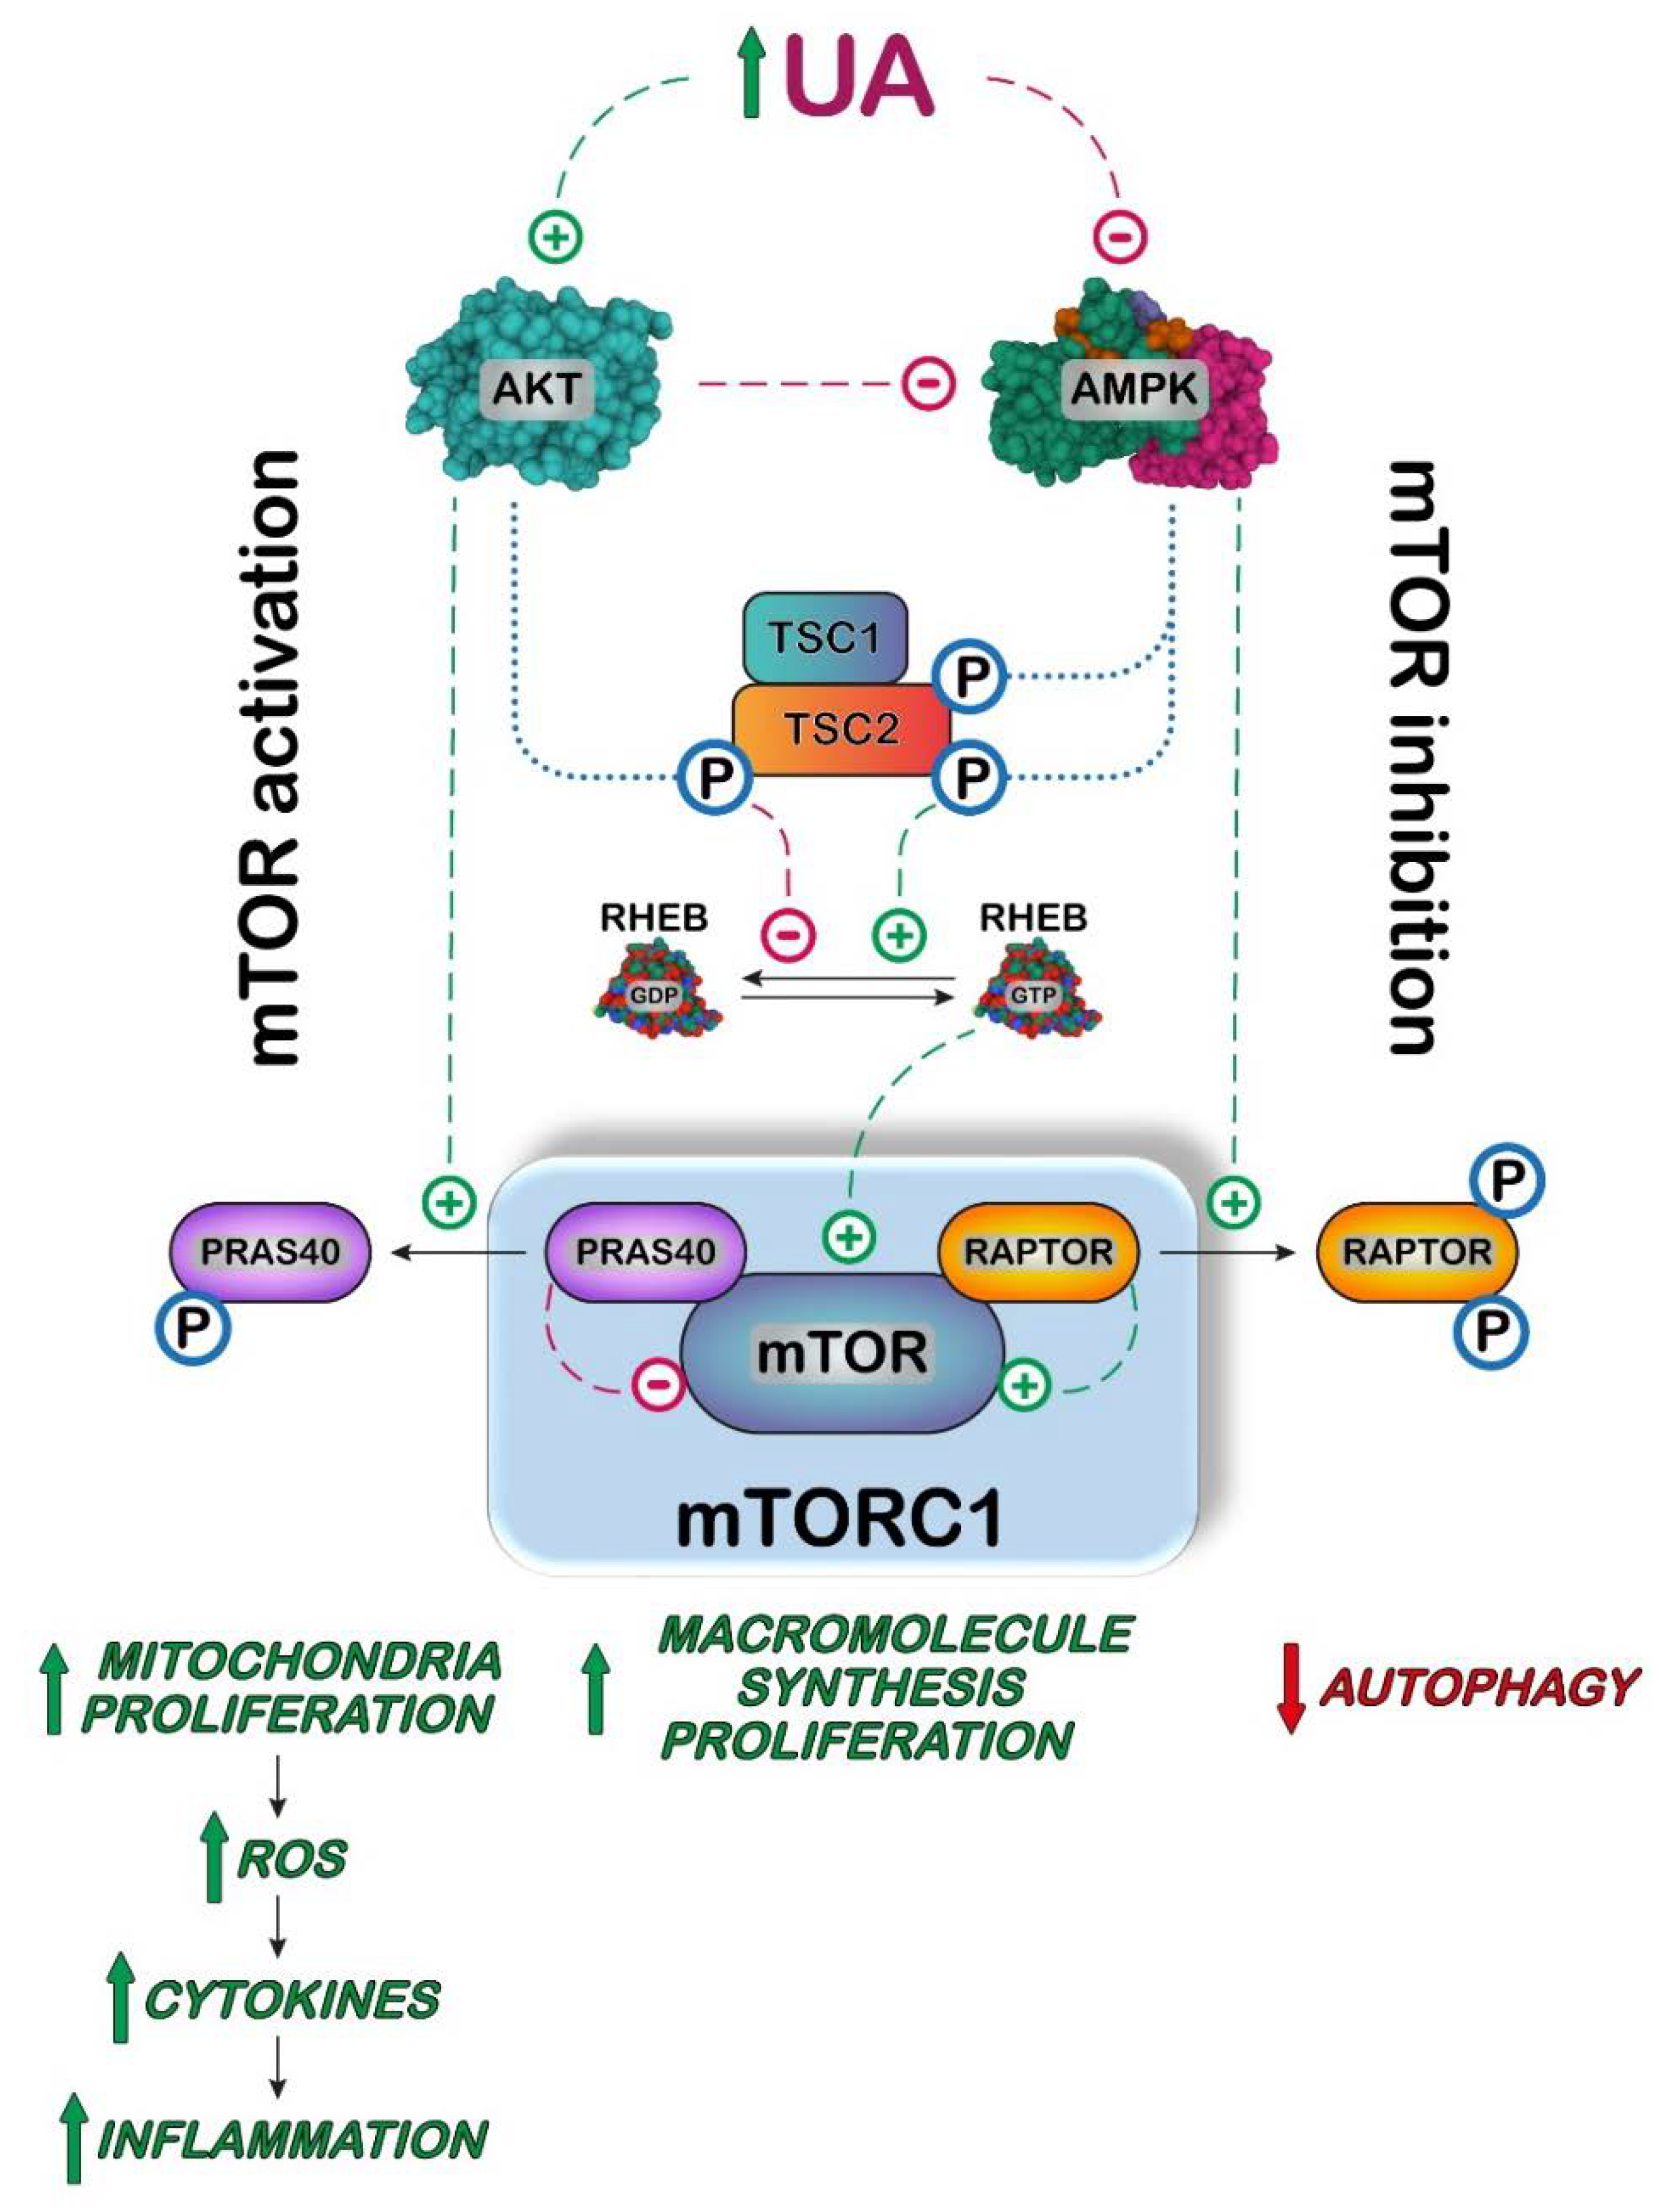
5. UA, Inflammation and mTOR/AKT
6. UA and the Lack of Uricase Hypothesis
7. Conclusions
Author Contributions
Funding
Conflicts of Interest
References
- Wu, X.W.; Muzny, D.M.; Lee, C.C.; Caskey, C.T. Two Independent Mutational Events in the Loss of Urate Oxidase during Hominoid Evolution. J. Mol. Evol. 1992, 34, 78–84. [Google Scholar] [CrossRef] [PubMed]
- Oda, M.; Satta, Y.; Takenaka, O.; Takahata, N. Loss of urate oxidase activity in hominoids and its evolutionary implications. Mol. Biol. Evol. 2002, 19, 640–653. [Google Scholar] [CrossRef] [PubMed]
- Fini, M.A.; Elias, A.; Johnson, R.J.; Wright, R.M. Contribution of uric acid to cancer risk, recurrence, and mortality. Clin. Transl. Med. 2012, 1, 16. [Google Scholar] [CrossRef] [PubMed]
- Ames, B.N.; Cathcart, R.; Schwiers, E.; Hochstein, P. Uric-Acid Provides an Antioxidant Defense in Humans against Oxidant-Caused and Radical-Caused Aging and Cancer—A Hypothesis. Proc. Natl. Acad. Sci. USA 1981, 78, 6858–6862. [Google Scholar] [CrossRef] [PubMed]
- Terkeltaub, R. Update on gout: New therapeutic strategies and options. Nat. Rev. Rheumatol. 2010, 6, 30–38. [Google Scholar] [CrossRef] [PubMed]
- Mubtasim, N.; Moustaid-Moussa, N.; Gollahon, L. The Complex Biology of the Obesity-Induced, Metastasis-Promoting Tumor Microenvironment in Breast Cancer. Int. J. Mol. Sci. 2022, 23, 2480. [Google Scholar] [CrossRef]
- Sun, B.; Karin, M. Obesity, inflammation, and liver cancer. J. Hepatol. 2012, 56, 704–713. [Google Scholar] [CrossRef]
- Fruhbeck, G.; Mentxaka, A.; Ahechu, P.; Gomez-Ambrosi, J.; Ramirez, B.; Becerril, S.; Rodriguez, A.; Unamuno, X.; Cienfuegos, J.A.; Casado, M.; et al. The Differential Expression of the Inflammasomes in Adipose Tissue and Colon Influences the Development of Colon Cancer in a Context of Obesity by Regulating Intestinal Inflammation. J. Inflamm. Res. 2021, 14, 6431–6446. [Google Scholar] [CrossRef]
- Eibl, G.; Rozengurt, E. Obesity and Pancreatic Cancer: Insight into Mechanisms. Cancers 2021, 13, 5067. [Google Scholar] [CrossRef]
- Deng, T.; Lyon, C.J.; Bergin, S.; Caligiuri, M.A.; Hsueh, W.A. Obesity, Inflammation, and Cancer. Annu. Rev. Pathol. 2016, 11, 421–449. [Google Scholar] [CrossRef]
- Khanna, A.; Sturgis, E.M.; Dahlstrom, K.R.; Xu, L.; Wei, Q.; Li, G.; Gross, N.D. Association of pretreatment body mass index with risk of head and neck cancer: A large single-center study. Am. J. Cancer Res. 2021, 11, 2343–2350. [Google Scholar] [PubMed]
- Aurilio, G.; Piva, F.; Santoni, M.; Cimadamore, A.; Sorgentoni, G.; Lopez-Beltran, A.; Cheng, L.; Battelli, N.; Nole, F.; Montironi, R. The Role of Obesity in Renal Cell Carcinoma Patients: Clinical-Pathological Implications. Int. J. Mol. Sci. 2019, 20, 5683. [Google Scholar] [CrossRef] [PubMed]
- Gluba-Brzozka, A.; Rysz, J.; Lawinski, J.; Franczyk, B. Renal Cell Cancer and Obesity. Int. J. Mol. Sci. 2022, 23, 3404. [Google Scholar] [CrossRef] [PubMed]
- Santoni, M.; Cimadamore, A.; Massari, F.; Piva, F.; Aurilio, G.; Martignetti, A.; Scarpelli, M.; Di Nunno, V.; Gatto, L.; Battelli, N.; et al. Key Role of Obesity in Genitourinary Tumors with Emphasis on Urothelial and Prostate Cancers. Cancers 2019, 11, 1225. [Google Scholar] [CrossRef] [PubMed]
- Wilson, R.L.; Taaffe, D.R.; Newton, R.U.; Hart, N.H.; Lyons-Wall, P.; Galvao, D.A. Using Exercise and Nutrition to Alter Fat and Lean Mass in Men with Prostate Cancer Receiving Androgen Deprivation Therapy: A Narrative Review. Nutrients 2021, 13, 1664. [Google Scholar] [CrossRef] [PubMed]
- Liu, J.H.; Wu, Q.F.; Fu, J.K.; Che, X.M.; Li, H.J. Obesity Potentiates Esophageal Squamous Cell Carcinoma Growth and Invasion by AMPK-YAP Pathway. J. Immunol. Res. 2020, 2020, 9. [Google Scholar] [CrossRef]
- Madeddu, C.; Sanna, E.; Gramignano, G.; Tanca, L.; Cherchi, M.C.; Mola, B.; Petrillo, M.; Maccio, A. Correlation of Leptin, Proinflammatory Cytokines and Oxidative Stress with Tumor Size and Disease Stage of Endometrioid (Type I) Endometrial Cancer and Review of the Underlying Mechanisms. Cancers 2022, 14, 268. [Google Scholar] [CrossRef]
- Sanchez-Lozada, L.G.; Soto, V.; Tapia, E.; Avila-Casado, C.; Sautin, Y.Y.; Nakagawa, T.; Franco, M.; Rodriguez-Iturbe, B.; Johnson, R.J. Role of oxidative stress in the renal abnormalities induced by experimental hyperuricemia. Am. J. Physiol. Renal Physiol. 2008, 295, F1134–F1141. [Google Scholar] [CrossRef]
- Imaram, W.; Gersch, C.; Kim, K.M.; Johnson, R.J.; Henderson, G.N.; Angerhofer, A. Radicals in the reaction between peroxynitrite and uric acid identified by electron spin resonance spectroscopy and liquid chromatography mass spectrometry. Free Radic. Bio. Med. 2010, 49, 275–281. [Google Scholar] [CrossRef]
- Lanaspa, M.A.; Sanchez-Lozada, L.G.; Choi, Y.J.; Cicerchi, C.; Kanbay, M.; Roncal-Jimenez, C.A.; Ishimoto, T.; Li, N.X.; Marek, G.; Duranay, M.; et al. Uric Acid Induces Hepatic Steatosis by Generation of Mitochondrial Oxidative Stress POTENTIAL ROLE IN FRUCTOSE-DEPENDENT AND -INDEPENDENT FATTY LIVER. J. Biol. Chem. 2012, 287, 40732–40744. [Google Scholar] [CrossRef]
- Lima, W.G.; Martins-Santos, M.E.; Chaves, V.E. Uric acid as a modulator of glucose and lipid metabolism. Biochimie 2015, 116, 17–23. [Google Scholar] [CrossRef] [PubMed]
- de Oliveira, E.P.; Burini, R.C. High plasma uric acid concentration: Causes and consequences. Diabetol. Metab. Syndr. 2012, 4, 12. [Google Scholar] [CrossRef]
- Oh, J.H.; Dossetor, J.B.; Beck, I.T. Kinetics of uric acid transport and its production in rat small intestine. Can. J. Physiol. Pharmacol. 1967, 45, 121–127. [Google Scholar] [CrossRef]
- Hediger, M.A.; Johnson, R.J.; Miyazaki, H.; Endou, H. Molecular physiology of urate transport. Physiology 2005, 20, 125–133. [Google Scholar] [CrossRef] [PubMed]
- Chaudhary, K.; Malhotra, K.; Sowers, J.; Aroor, A. Uric Acid—Key ingredient in the recipe for cardiorenal metabolic syndrome. Cardiorenal. Med. 2013, 3, 208–220. [Google Scholar] [CrossRef]
- Tsushima, Y.; Nishizawa, H.; Tochino, Y.; Nakatsuji, H.; Sekimoto, R.; Nagao, H.; Shirakura, T.; Kato, K.; Imaizumi, K.; Takahashi, H.; et al. Uric acid secretion from adipose tissue and its increase in obesity. J. Biol. Chem. 2013, 288, 27138–27149. [Google Scholar] [CrossRef] [PubMed]
- Blausen.com staff. Medical gallery of Blausen Medical 2014. WikiJ. Med. 2014, 1. [Google Scholar] [CrossRef]
- Hille, R.; Nishino, T. Flavoprotein Structure and Mechanism.4. Xanthine-Oxidase and Xanthine Dehydrogenase. FASEB J. 1995, 9, 995–1003. [Google Scholar] [CrossRef]
- Bortolotti, M.; Polito, L.; Battelli, M.G.; Bolognesi, A. Xanthine oxidoreductase: One enzyme for multiple physiological tasks. Redox Biol. 2021, 41, 101882. [Google Scholar] [CrossRef]
- Saksela, M.; Lapatto, R.; Raivio, K.O. Xanthine oxidoreductase gene expression and enzyme activity in developing human tissues. Biol. Neonatol. 1998, 74, 274–280. [Google Scholar] [CrossRef]
- Auscher, C.; Amory, N.; van der Kemp, P.; Delbarre, F. Xanthine oxidase activity in human intestines Histochemical and radiochemical study. Adv. Exp. Med. Biol. 1979, 122B, 197–201. [Google Scholar] [CrossRef] [PubMed]
- Della Corte, E.; Gozzetti, G.; Novello, F.; Stirpe, F. Properties of the xanthine oxidase from human liver. Biochim. Biophys. Acta 1969, 191, 164–166. [Google Scholar] [CrossRef]
- Battelli, M.G.; Bolognesi, A.; Polito, L. Pathophysiology of circulating xanthine oxidoreductase: New emerging roles for a multi-tasking enzyme. Bba-Mol. Basis Dis. 2014, 1842, 1502–1517. [Google Scholar] [CrossRef]
- Della Corte, E.D.; Stirpe, F. The regulation of rat liver xanthine oxidase. Involvement of thiol groups in the conversion of the enzyme activity from dehydrogenase (type D) into oxidase (type O) and purification of the enzyme. Biochem. J. 1972, 126, 739–745. [Google Scholar] [CrossRef] [PubMed]
- Clare, D.A.; Blakistone, B.A.; Swaisgood, H.E.; Horton, H.R. Sulfhydryl Oxidase-Catalyzed Conversion of Xanthine Dehydrogenase to Xanthine-Oxidase. Arch. Biochem. Biophys. 1981, 211, 44–47. [Google Scholar] [CrossRef]
- Carey, F.G.; Fridovich, I.; Handler, P. Preparation of several forms of xanthine oxidase by enzymic proteolysis. Biochim. Biophys. Acta 1961, 53, 440–442. [Google Scholar] [CrossRef]
- Della Corte, E.; Stirpe, F. The regulation of rat-liver xanthine oxidase: Activation by proteolytic enzymes. FEBS Lett. 1968, 2, 83–84. [Google Scholar] [CrossRef]
- Nishino, T.; Okamoto, K.; Eger, B.T.; Pai, E.F.; Nishino, T. Mammalian xanthine oxidoreductase—Mechanism of transition from xanthine dehydrogenase to xanthine oxidase. FEBS J. 2008, 275, 3278–3289. [Google Scholar] [CrossRef]
- Battelli, M.G.; Polito, L.; Bortolotti, M.; Bolognesi, A. Xanthine oxidoreductase in cancer: More than a differentiation marker. Cancer Med. 2016, 5, 546–557. [Google Scholar] [CrossRef]
- Chen, M.M.; Meng, L.H. The double faced role of xanthine oxidoreductase in cancer. Acta Pharmacol. Sin. 2021, 43, 1623–1632. [Google Scholar] [CrossRef]
- Mandal, A.K.; Mount, D.B. The molecular physiology of uric acid homeostasis. Annu. Rev. Physiol. 2015, 77, 323–345. [Google Scholar] [CrossRef] [PubMed]
- Maiuolo, J.; Oppedisano, F.; Gratteri, S.; Muscoli, C.; Mollace, V. Regulation of uric acid metabolism and excretion. Int. J. Cardiol. 2016, 213, 8–14. [Google Scholar] [CrossRef] [PubMed]
- Wang, Z.; Cui, T.; Ci, X.; Zhao, F.; Sun, Y.; Li, Y.; Liu, R.; Wu, W.; Yi, X.; Liu, C. The effect of polymorphism of uric acid transporters on uric acid transport. J. Nephrol. 2019, 32, 177–187. [Google Scholar] [CrossRef] [PubMed]
- Halperin Kuhns, V.L.; Woodward, O.M. Urate transport in health and disease. Best. Pract. Res. Clin. Rheumatol. 2021, 35, 101717. [Google Scholar] [CrossRef] [PubMed]
- Bobulescu, I.A.; Moe, O.W. Renal transport of uric acid: Evolving concepts and uncertainties. Adv. Chronic. Kidney Dis. 2012, 19, 358–371. [Google Scholar] [CrossRef] [PubMed]
- Xu, X.; Li, C.; Zhou, P.; Jiang, T. Uric acid transporters hiding in the intestine. Pharm. Biol. 2016, 54, 3151–3155. [Google Scholar] [CrossRef] [PubMed]
- Testa, A.; Mallamaci, F.; Spoto, B.; Pisano, A.; Sanguedolce, M.C.; Tripepi, G.; Leonardis, D.; Zoccali, C. Association of a Polymorphism in a Gene Encoding a Urate Transporter with CKD Progression. Clin. J. Am. Soc. Nephrol. 2014, 9, 1059–1065. [Google Scholar] [CrossRef]
- Sarkadi, B.; Homolya, L.; Hegedus, T. The ABCG2/BCRP transporter and its variants—From structure to pathology. FEBS Lett. 2020, 594, 4012–4034. [Google Scholar] [CrossRef]
- Raivio, K.O.; Becker, M.A.; Meyer, L.J.; Greene, M.L.; Nuki, G.; Seegmiller, J.E. Stimulation of Human Purine Synthesis De novo by Fructose Infusion. Metabolism 1975, 24, 861–869. [Google Scholar] [CrossRef]
- Itakura, M.; Sabina, R.L.; Heald, P.W.; Holmes, E.W. Basis for the control of purine biosynthesis by purine ribonucleotides. J. Clin. Investig. 1981, 67, 994–1002. [Google Scholar] [CrossRef]
- Des Rosiers, C.; Lalanne, M.; Willemot, J. Effects of glycerol and fructose on purine synthesis de novo and on PP-ribose-P availability in rat liver cells. Can. J. Biochem. 1982, 60, 1109–1115. [Google Scholar] [CrossRef]
- Hayward, B.E.; Bonthron, D.T. Structure and alternative splicing of the ketohexokinase gene. Eur. J. Biochem. 1998, 257, 85–91. [Google Scholar] [CrossRef]
- Diggle, C.P.; Shires, M.; Leitch, D.; Brooke, D.; Carr, I.M.; Markham, A.F.; Hayward, B.E.; Asipu, A.; Bonthron, D.T. Ketohexokinase: Expression and localization of the principal fructose-metabolizing enzyme. J. Histochem. Cytochem. 2009, 57, 763–774. [Google Scholar] [CrossRef] [PubMed]
- Herman, M.A.; Birnbaum, M.J. Molecular aspects of fructose metabolism and metabolic disease. Cell. Metab. 2021, 33, 2329–2354. [Google Scholar] [CrossRef] [PubMed]
- Skenderian, S.; Park, G.; Jang, C. Organismal Fructose Metabolism in Health and Non-Alcoholic Fatty Liver Disease. Biology 2020, 9, 405. [Google Scholar] [CrossRef] [PubMed]
- Van den Berghe, G.; Bronfman, M.; Vanneste, R.; Hers, H.G. Mechanism of Adenosine-Triphosphate Depletion in Liver after a Load of Fructose—Kinetic Study of Liver Adenylate Deaminase. Biochem. J. 1977, 162, 601–609. [Google Scholar] [CrossRef]
- Phillips, M.I.; Davies, D.R. The mechanism of guanosine triphosphate depletion in the liver after a fructose load. The role of fructokinase. Biochem. J. 1985, 228, 667–671. [Google Scholar] [CrossRef]
- Goncalves, M.D.; Lu, C.; Tutnauer, J.; Hartman, T.E.; Hwang, S.K.; Murphy, C.J.; Pauli, C.; Morris, R.; Taylor, S.; Bosch, K.; et al. High-fructose corn syrup enhances intestinal tumor growth in mice. Science 2019, 363, 1345–1349. [Google Scholar] [CrossRef]
- Van Schaftingen, E.; Detheux, M.; Veiga da Cunha, M. Short-term control of glucokinase activity: Role of a regulatory protein. FASEB J. 1994, 8, 414–419. [Google Scholar] [CrossRef]
- Korieh, A.; Crouzoulon, G. Dietary regulation of fructose metabolism in the intestine and in the liver of the rat. Duration of the effects of a high fructose diet after the return to the standard diet. Arch. Int. Physiol. Biochim. Biophys. 1991, 99, 455–460. [Google Scholar]
- Ouyang, X.; Cirillo, P.; Sautin, Y.; McCall, S.; Bruchette, J.L.; Diehl, A.M.; Johnson, R.J.; Abdelmalek, M.F. Fructose consumption as a risk factor for non-alcoholic fatty liver disease. J. Hepatol. 2008, 48, 993–999. [Google Scholar] [CrossRef] [PubMed]
- Lanaspa, M.A.; Sanchez-Lozada, L.G.; Cicerchi, C.; Li, N.X.; Roncal-Jimenez, C.A.; Ishimoto, T.; Le, M.; Garcia, G.E.; Thomas, J.B.; Rivard, C.J.; et al. Uric Acid Stimulates Fructokinase and Accelerates Fructose Metabolism in the Development of Fatty Liver. PLoS ONE 2012, 7, e47948. [Google Scholar] [CrossRef]
- Elion, G.B.; Kovensky, A.; Hitchings, G.H. Metabolic studies of allopurinol, an inhibitor of xanthine oxidase. Biochem. Pharmacol. 1966, 15, 863–880. [Google Scholar] [CrossRef]
- Ma, L.; Robinson, L.N.; Towle, H.C. ChREBP*Mlx is the principal mediator of glucose-induced gene expression in the liver. J. Biol. Chem. 2006, 281, 28721–28730. [Google Scholar] [CrossRef] [PubMed]
- Koo, H.Y.; Miyashita, M.; Cho, B.H.; Nakamura, M.T. Replacing dietary glucose with fructose increases ChREBP activity and SREBP-1 protein in rat liver nucleus. Biochem. Biophys. Res. Commun. 2009, 390, 285–289. [Google Scholar] [CrossRef]
- Lanaspa, M.A.; Ishimoto, T.; Li, N.X.; Cicerchi, C.; Orlicky, D.J.; Ruzicky, P.; Rivard, C.; Inaba, S.; Roncal-Jimenez, C.A.; Bales, E.S.; et al. Endogenous fructose production and metabolism in the liver contributes to the development of metabolic syndrome. Nat. Commun. 2013, 4, 2434. [Google Scholar] [CrossRef]
- Lee, H.J.; Cha, J.Y. Recent insights into the role of ChREBP in intestinal fructose absorption and metabolism. BMB Rep. 2018, 51, 429–436. [Google Scholar] [CrossRef]
- Oh, A.R.; Sohn, S.; Lee, J.; Park, J.M.; Nam, K.T.; Hahm, K.B.; Kim, Y.B.; Lee, H.J.; Cha, J.Y. ChREBP deficiency leads to diarrhea-predominant irritable bowel syndrome. Metabolism 2018, 85, 286–297. [Google Scholar] [CrossRef]
- Sautin, Y.Y.; Nakagawa, T.; Zharikov, S.; Johnson, R.J. Adverse effects of the classic antioxidant uric acid in adipocytes: NADPH oxidase-mediated oxidative/nitrosative stress. Am. J. Physiol. Cell Physiol. 2007, 293, C584–C596. [Google Scholar] [CrossRef]
- Hausladen, A.; Fridovich, I. Superoxide and Peroxynitrite Inactivate Aconitases, but Nitric-Oxide Does Not. J. Biol. Chem. 1994, 269, 29405–29408. [Google Scholar] [CrossRef]
- Sanchez-Lozada, L.G.; Andres-Hernando, A.; Garcia-Arroyo, F.E.; Cicerchi, C.; Li, N.X.; Kuwabara, M.; Roncal-Jimenez, C.A.; Johnson, R.J.; Lanaspa, M.A. Uric acid activates aldose reductase and the polyol pathway for endogenous fructose and fat production causing development of fatty liver in rats. J. Biol. Chem. 2019, 294, 4272–4281. [Google Scholar] [CrossRef] [PubMed]
- Balestri, F.; Moschini, R.; Mura, U.; Cappiello, M.; Del Corso, A. In Search of Differential Inhibitors of Aldose Reductase. Biomolecules 2022, 12, 485. [Google Scholar] [CrossRef] [PubMed]
- Thakur, S.; Gupta, S.K.; Ali, V.; Singh, P.; Verma, M. Aldose Reductase: A cause and a potential target for the treatment of diabetic complications. Arch. Pharm. Res. 2021, 44, 655–667. [Google Scholar] [CrossRef]
- Schwab, A.; Siddiqui, A.; Vazakidou, M.E.; Napoli, F.; Bottcher, M.; Menchicchi, B.; Raza, U.; Saatci, O.; Krebs, A.M.; Ferrazzi, F.; et al. Polyol Pathway Links Glucose Metabolism to the Aggressiveness of Cancer Cells. Cancer Res. 2018, 78, 1604–1618. [Google Scholar] [CrossRef] [PubMed]
- Saraswat, M.; Mrudula, T.; Kumar, P.U.; Suneetha, A.; Rao, T.S.; Srinivasulu, M.; Reddy, G.B. Overexpression of aldose reductase in human cancer tissues. Med. Sci. Monit. 2006, 12, Cr525–Cr529. [Google Scholar]
- Taskoparan, B.; Seza, E.G.; Demirkol, S.; Tuncer, S.; Stefek, M.; Gure, A.O.; Banerjee, S. Opposing roles of the aldo-keto reductases AKR1B1 and AKR1B10 in colorectal cancer. Cell Oncol. 2017, 40, 563–578. [Google Scholar] [CrossRef]
- Woo, S.K.; Lee, S.D.; Kwon, H.M. TonEBP transcriptional activator in the cellular response to increased osmolality. Pflug. Arch. Eur. J. Phys. 2002, 444, 579–585. [Google Scholar] [CrossRef]
- Wang, M.; Chen, W.Y.; Zhang, J.W.; Gobejishvili, L.; Barve, S.S.; McClain, C.J.; Joshi-Barve, S. Elevated Fructose and Uric Acid Through Aldose Reductase Contribute to Experimental and Human Alcoholic Liver Disease. Hepatology 2020, 72, 1617–1637. [Google Scholar] [CrossRef]
- Park, T.J.; Reznick, J.; Peterson, B.L.; Blass, G.; Omerbasic, D.; Bennett, N.C.; Kuich, P.; Zasada, C.; Browe, B.M.; Hamann, W.; et al. Fructose-driven glycolysis supports anoxia resistance in the naked mole-rat. Science 2017, 356, 307–311. [Google Scholar] [CrossRef]
- Nakagawa, T.; Lanaspa, M.A.; Millan, I.S.; Fini, M.; Rivard, C.J.; Sanchez-Lozada, L.G.; Andres-Hernando, A.; Tolan, D.R.; Johnson, R.J. Fructose contributes to the Warburg effect for cancer growth. Cancer Metab. 2020, 8, 16. [Google Scholar] [CrossRef]
- Liu, H.; Huang, D.; McArthur, D.L.; Boros, L.G.; Nissen, N.; Heaney, A.P. Fructose induces transketolase flux to promote pancreatic cancer growth. Cancer Res. 2010, 70, 6368–6376. [Google Scholar] [CrossRef] [PubMed]
- Rais, B.; Comin, B.; Puigjaner, J.; Brandes, J.L.; Creppy, E.; Saboureau, D.; Ennamany, R.; Lee, W.N.; Boros, L.G.; Cascante, M. Oxythiamine and dehydroepiandrosterone induce a G1 phase cycle arrest in Ehrlich’s tumor cells through inhibition of the pentose cycle. FEBS Lett. 1999, 456, 113–118. [Google Scholar] [CrossRef]
- Nassir, F.; Rector, R.S.; Hammoud, G.M.; Ibdah, J.A. Pathogenesis and Prevention of Hepatic Steatosis. Gastroenterol. Hepatol. 2015, 11, 167–175. [Google Scholar]
- Strathearn, L.S.; Stepanov, A.I.; Font-Burgada, J. Inflammation in Primary and Metastatic Liver Tumorigenesis-Under the Influence of Alcohol and High-Fat Diets. Nutrients 2020, 12, 933. [Google Scholar] [CrossRef] [PubMed]
- Hamady, Z.Z.R.; Rees, M.; Welsh, F.K.; Toogood, G.J.; Prasad, K.R.; John, T.K.; Lodge, J.P.A. Fatty liver disease as a predictor of local recurrence following resection of colorectal liver metastases. Brit. J. Surg. 2013, 100, 820–826. [Google Scholar] [CrossRef]
- Lv, Y.; Zhang, H.J. Effect of Non-alcoholic Fatty Liver Disease on the Risk of Synchronous Liver Metastasis: Analysis of 451 Consecutive Patients of Newly Diagnosed Colorectal Cancer. Front. Oncol. 2020, 10, 251. [Google Scholar] [CrossRef]
- Chen, H.Y.; Dai, S.Q.; Fang, Y.M.; Chen, L.B.; Jiang, K.; Wei, Q.C.; Ding, K.F. Hepatic Steatosis Predicts Higher Incidence of Recurrence in Colorectal Cancer Liver Metastasis Patients. Front. Oncol. 2021, 11, 631943. [Google Scholar] [CrossRef]
- Murono, K.; Kitayama, J.; Tsuno, N.H.; Nozawa, H.; Kawai, K.; Sunami, E.; Akahane, M.; Watanabe, T. Hepatic steatosis is associated with lower incidence of liver metastasis from colorectal cancer. Int. J. Colorectal Dis. 2013, 28, 1065–1072. [Google Scholar] [CrossRef]
- Viollet, B.; Guigas, B.; Leclerc, J.; Hebrard, S.; Lantier, L.; Mounier, R.; Andreelli, F.; Foretz, M. AMP-activated protein kinase in the regulation of hepatic energy metabolism: From physiology to therapeutic perspectives. Acta. Physiol. 2009, 196, 81–98. [Google Scholar] [CrossRef]
- Camici, M.; Allegrini, S.; Tozzi, M.G. Interplay between adenylate metabolizing enzymes and AMP-activated protein kinase. FEBS J. 2018, 285, 3337–3352. [Google Scholar] [CrossRef]
- Russell, F.M.; Hardie, D.G. AMP-Activated Protein Kinase: Do We Need Activators or Inhibitors to Treat or Prevent Cancer? Int. J. Mol. Sci. 2021, 22, 186. [Google Scholar] [CrossRef] [PubMed]
- Lanaspa, M.A.; Cicerchi, C.; Garcia, G.; Li, N.X.; Roncal-Jimenez, C.A.; Rivard, C.J.; Hunter, B.; Andres-Hernando, A.; Ishimoto, T.; Sanchez-Lozada, L.G.; et al. Counteracting Roles of AMP Deaminase and AMP Kinase in the Development of Fatty Liver. PLoS ONE 2012, 7, e48801. [Google Scholar] [CrossRef] [PubMed]
- Garcia-Arroyo, F.E.; Monroy-Sanchez, F.; Munoz-Jimenez, I.; Gonzaga, G.; Andres-Hernando, A.; Zazueta, C.; Juarez-Rojas, J.G.; Lanaspa, M.A.; Johnson, R.J.; Sanchez-Lozada, L.G. Allopurinol Prevents the Lipogenic Response Induced by an Acute Oral Fructose Challenge in Short-Term Fructose Fed Rats. Biomolecules 2019, 9, 601. [Google Scholar] [CrossRef] [PubMed]
- Cicerchi, C.; Li, N.X.; Kratzer, J.; Garcia, G.; Roncal-Jimenez, C.A.; Tanabe, K.; Hunter, B.; Rivard, C.J.; Sautin, Y.Y.; Gaucher, E.A.; et al. Uric acid-dependent inhibition of AMP kinase induces hepatic glucose production in diabetes and starvation: Evolutionary implications of the uricase loss in hominids. Faseb J. 2014, 28, 3339–3350. [Google Scholar] [CrossRef] [PubMed]
- Suh, S.; Kim, K.W. Diabetes and Cancer: Cancer Should Be Screened in Routine Diabetes Assessment. Diabetes Metab. J. 2019, 43, 733–743. [Google Scholar] [CrossRef]
- Wang, J.W.; Fan, Y.X.; Cai, X.M.; Gao, Z.Z.; Yu, Z.Y.; Wei, B.; Tang, Y.L.; Hu, L.; Liu, W.T.; Gu, Y.H. Uric acid preconditioning alleviated doxorubicin induced JNK activation and Cx43 phosphorylation associated cardiotoxicity via activation of AMPK-SHP2 signaling pathway. Ann. Transl. Med. 2020, 8, 1570. [Google Scholar] [CrossRef]
- Shi, Y.; Evans, J.E.; Rock, K.L. Molecular identification of a danger signal that alerts the immune system to dying cells. Nature 2003, 425, 516–521. [Google Scholar] [CrossRef]
- Liu-Bryan, R.; Scott, P.; Sydlaske, A.; Rose, D.M.; Terkeltaub, R. Innate immunity conferred by toll-like receptors 2 and 4 and myeloid differentiation factor 88 expression is pivotal to monosodium urate monohydrate crystal-induced inflammation. Arthritis Rheum 2005, 52, 2936–2946. [Google Scholar] [CrossRef]
- Liu, T.; Zhang, L.Y.; Joo, D.; Sun, S.C. NF-k B signaling in inflammation. Signal. Transduct. Target 2017, 2, 17023. [Google Scholar] [CrossRef]
- Martinon, F.; Petrilli, V.; Mayor, A.; Tardivel, A.; Tschopp, J. Gout-associated uric acid crystals activate the NALP3 inflammasome. Nature 2006, 440, 237–241. [Google Scholar] [CrossRef]
- Martinon, F. Update on biology: Uric acid and the activation of immune and inflammatory cells. Curr. Rheumatol. Rep. 2010, 12, 135–141. [Google Scholar] [CrossRef] [PubMed]
- Wang, Y.F.; Zhu, W.; Lu, D.D.; Zhang, C.Z.; Wang, Y. Tetrahydropalmatine attenuates MSU crystal-induced gouty arthritis by inhibiting ROS-mediated NLRP3 inflammasome activation. Int. Immunopharmacol. 2021, 100, 108107. [Google Scholar] [CrossRef] [PubMed]
- Dalbeth, N.; Merriman, T.R.; Stamp, L.K. Gout. Lancet 2016, 388, 2039–2052. [Google Scholar] [CrossRef]
- Takahashi, M.M.; de Oliveira, E.P.; de Carvalho, A.L.R.; Dantas, L.A.D.; Burini, F.H.P.; Portero-McLellan, K.C.; Burini, R.C. Metabolic syndrome and dietary components are associated with coronary artery disease risk score in free-living adults: A cross-sectional study. Diabetol. Metab. Syndr. 2011, 3, 7. [Google Scholar] [CrossRef] [PubMed]
- Zhang, T.J.; Rayamajhi, S.; Meng, G.; Zhang, Q.; Liu, L.; Wu, H.M.; Gu, Y.Q.; Wang, Y.W.; Zhang, S.M.; Wang, X.N.; et al. Dietary patterns and risk for hyperuricemia in the general population: Results from the TCLSIH cohort study. Nutrition 2022, 93, 111501. [Google Scholar] [CrossRef]
- Coutinho, T.D.; Turner, S.T.; Peyser, P.A.; Bielak, L.F.; Sheedy, P.F.; Kullo, I.J. Associations of serum uric acid with markers of inflammation, metabolic syndrome, and subclinical coronary atherosclerosis. Am. J. Hypertens. 2007, 20, 83–89. [Google Scholar] [CrossRef]
- Niskanen, L.K.; Laaksonen, D.E.; Nyyssonen, K.; Alfthan, G.; Lakka, H.M.; Lakka, T.A.; Salonen, J.T. Uric acid level as a risk factor for cardiovascular and all-cause mortality in middle-aged men—A prospective cohort study. Arch. Intern. Med. 2004, 164, 1546–1551. [Google Scholar] [CrossRef]
- Chen, M.; Lu, X.Y.; Lu, C.; Shen, N.; Jiang, Y.J.; Chen, M.L.; Wu, H.X. Soluble uric acid increases PDZK1 and ABCG2 expression in human intestinal cell lines via the TLR4-NLRP3 inflammasome and PI3K/Akt signaling pathway. Arthritis Res. Ther. 2018, 20, 20. [Google Scholar] [CrossRef]
- Preitner, F.; Laverriere-Loss, A.; Metref, S.; Da Costa, A.; Moret, C.; Rotman, S.; Bazin, D.; Daudon, M.; Sandt, C.; Dessombz, A.; et al. Urate-induced acute renal failure and chronic inflammation in liver-specific Glut9 knockout mice. Am. J. Physiol. Renal Physiol. 2013, 305, F786–F795. [Google Scholar] [CrossRef][Green Version]
- Jiang, M.X.; Ren, L.L.; Chen, S.Z.; Li, G.H. Serum Uric Acid Levels and Risk of Eight Site-Specific Cancers: A Mendelian Randomization Study. Front. Genet. 2021, 12, 608311. [Google Scholar] [CrossRef]
- Yan, S.; Zhang, P.; Xu, W.; Liu, Y.; Wang, B.; Jiang, T.; Hua, C.; Wang, X.; Xu, D.; Sun, B. Serum Uric Acid Increases Risk of Cancer Incidence and Mortality: A Systematic Review and Meta-Analysis. Mediators Inflamm. 2015, 2015, 764250. [Google Scholar] [CrossRef] [PubMed]
- Mi, S.Y.; Gong, L.; Sui, Z.Q. Friend or Foe? An Unrecognized Role of Uric Acid in Cancer Development and the Potential Anticancer Effects of Uric Acid-lowering Drugs. J. Cancer 2020, 11, 5236–5244. [Google Scholar] [CrossRef] [PubMed]
- Yiu, A.; Van Hemelrijck, M.; Garmo, H.; Holmberg, L.; Malmstrom, H.; Lambe, M.; Hammar, N.; Walldius, G.; Jungner, I.; Wulaningsih, W. Circulating uric acid levels and subsequent development of cancer in 493,281 individuals: Findings from the AMORIS Study. Oncotarget 2017, 8, 42332–42342. [Google Scholar] [CrossRef]
- Huang, C.F.; Huang, J.J.; Mi, N.N.; Lin, Y.Y.; He, Q.S.; Lu, Y.W.; Yue, P.; Bai, B.; Zhang, J.D.; Zhang, C.; et al. Associations between serum uric acid and hepatobiliary-pancreatic cancer: A cohort study. World J. Gastroenterol. 2020, 26, 7061–7075. [Google Scholar] [CrossRef]
- Dai, X.Y.; He, Q.S.; Jing, Z.; Yuan, J.Q. Serum uric acid levels and risk of kidney cancer incidence and mortality: A prospective cohort study. Cancer Med. 2020, 9, 5655–5661. [Google Scholar] [CrossRef]
- Wang, W.; Xu, D.; Wang, B.; Yan, S.; Wang, X.; Yin, Y.; Wang, X.; Sun, B.; Sun, X. Increased Risk of Cancer in relation to Gout: A Review of Three Prospective Cohort Studies with 50,358 Subjects. Mediat. Inflamm. 2015, 2015, 680853. [Google Scholar] [CrossRef]
- Oh, Y.J.; Lee, Y.J.; Lee, E.; Park, B.; Kwon, J.W.; Heo, J.; Moon, K.W. Cancer risk in Korean patients with gout. Korean J. Intern. Med. 2022, 37, 460–467. [Google Scholar] [CrossRef]
- Hsueh, C.Y.; Shao, M.; Cao, W.; Li, S.; Zhou, L. Pretreatment Serum Uric Acid as an Efficient Predictor of Prognosis in Men with Laryngeal Squamous Cell Cancer: A Retrospective Cohort Study. Oxid. Med. Cell Longev. 2019, 2019, 1821969. [Google Scholar] [CrossRef]
- Matozaki, T.; Kotani, T.; Murata, Y.; Saito, Y. Roles of Src family kinase, Ras, and mTOR signaling in intestinal epithelial homeostasis and tumorigenesis. Cancer Sci. 2021, 112, 16–21. [Google Scholar] [CrossRef]
- Sanchez-Garrido, J.; Shenoy, A.R. Regulation and repurposing of nutrient sensing and autophagy in innate immunity. Autophagy 2021, 17, 1571–1591. [Google Scholar] [CrossRef]
- Crisan, T.O.; Cleophas, M.C.P.; Novakovic, B.; Erler, K.; de Veerdonk, F.L.V.; Stunnenberg, H.G.; Netea, M.G.; Dinarello, C.A.; Joosten, L.A.B. Uric acid priming in human monocytes is driven by the AKT-PRAS40 autophagy pathway. Proc. Natl. Acad. Sci. USA 2017, 114, 5485–5490. [Google Scholar] [CrossRef] [PubMed]
- Deretic, V. Autophagy in leukocytes and other cells: Mechanisms, subsystem organization, selectivity, and links to innate immunity. J. Leukoc. Biol. 2016, 100, 969–978. [Google Scholar] [CrossRef] [PubMed]
- Wiza, C.; Nascimento, E.B.M.; Ouwens, D.M. Role of PRAS40 in Akt and mTOR signaling in health and disease. Am. J. Physiol.-Endoc. Metab. 2012, 302, E1453–E1460. [Google Scholar] [CrossRef] [PubMed]
- Gwinn, D.M.; Shackelford, D.B.; Egan, D.F.; Mihaylova, M.M.; Mery, A.; Vasquez, D.S.; Turk, B.E.; Shaw, R.J. AMPK phosphorylation of raptor mediates a metabolic checkpoint. Mol. Cell 2008, 30, 214–226. [Google Scholar] [CrossRef]
- Zhi, L.; Yuzhang, Z.; Tianliang, H.; Hisatome, I.; Yamamoto, T.; Jidong, C. High Uric Acid Induces Insulin Resistance in Cardiomyocytes In Vitro and In vivo. PLoS ONE 2016, 11, e0147737. [Google Scholar] [CrossRef]
- Zhu, Y.Z.; Hu, Y.Q.; Huang, T.L.; Zhang, Y.N.; Li, Z.; Luo, C.H.; Luo, Y.F.; Yuan, H.E.; Hisatome, I.; Yamamoto, T.; et al. High uric acid directly inhibits insulin signalling and induces insulin resistance. Biochem. Bioph. Res. Commun. 2014, 447, 707–714. [Google Scholar] [CrossRef]
- Johnson, R.J.; Lanaspa, M.A.; Gaucher, E.A. Uric Acid: A Danger Signal from the RNA World That May Have a Role in the Epidemic of Obesity, Metabolic Syndrome, and Cardiorenal Disease: Evolutionary Considerations. Semin. Nephrol. 2011, 31, 394–399. [Google Scholar] [CrossRef]
- Kimura, Y.; Yanagida, T.; Onda, A.; Tsukui, D.; Hosoyamada, M.; Kono, H. Soluble Uric Acid Promotes Atherosclerosis via AMPK (AMP-Activated Protein Kinase)-Mediated Inflammation. Arterioscler. Throm. Vas. 2020, 40, 570–582. [Google Scholar] [CrossRef]
- Lu, J.; Dalbeth, N.; Yin, H.; Li, C.; Merriman, T.R.; Wei, W.H. Mouse models for human hyperuricaemia: A critical review. Nat. Rev. Rheumatol. 2019, 15, 413–426. [Google Scholar] [CrossRef]
- Battelli, M.G.; Bortolotti, M.; Polito, L.; Bolognesi, A. Metabolic syndrome and cancer risk: The role of xanthine oxidoreductase. Redox Biol. 2019, 21, 101070. [Google Scholar] [CrossRef]
- Proctor, P. Similar Functions of Uric Acid and Ascorbate in Man. Nature 1970, 228, 868. [Google Scholar] [CrossRef] [PubMed]
- Alvarez-Lario, B.; Macarron-Vicente, J. Uric acid and evolution. Rheumatology 2010, 49, 2010–2015. [Google Scholar] [CrossRef]
- Nakajima, Y.; Shantha, T.R.; Bourne, G.H. Histochemical detection of L-gulonolactone: Phenazine methosulfate oxidoreductase activity in several mammals with special reference to synthesis of vitamin C in primates. Histochemie 1969, 18, 293–301. [Google Scholar] [CrossRef] [PubMed]
- Del Corso, A.; Cappiello, M.; Moschini, R.; Balestri, F.; Mura, U. How the chemical features of molecules may have addressed the settlement of metabolic steps. Metabolomics 2017, 14, 2. [Google Scholar] [CrossRef] [PubMed]
- Johnson, R.J.; Andrews, P. Fructose, Uricase, and the Back-to-Africa Hypothesis. Evol. Anthropol. 2010, 19, 250–257. [Google Scholar] [CrossRef]
- Fini, M.A.; Lanaspa, M.A.; Gaucher, E.A.; Boutwell, B.; Nakagawa, T.; Wright, R.M.; Sanchez-Lozada, L.G.; Andrews, P.; Stenmark, K.R.; Johnson, R.J. Brief report: The uricase mutation in humans increases our risk for cancer growth. Cancer Metab. 2021, 9, 32. [Google Scholar] [CrossRef]
- Cho, S.K.; Chang, Y.; Kim, I.; Ryu, S. U-Shaped Association Between Serum Uric Acid Level and Risk of Mortality: A Cohort Study. Arthritis Rheumatol. 2018, 70, 1122–1132. [Google Scholar] [CrossRef]
- Crawley, W.T.; Jungels, C.G.; Stenmark, K.R.; Fini, M.A. U-shaped association of uric acid to overall-cause mortality and its impact on clinical management of hyperuricemia. Redox Biol. 2022, 51, 102271. [Google Scholar] [CrossRef]
- Hu, L.; Hu, G.; Xu, B.P.; Zhu, L.; Zhou, W.; Wang, T.; Bao, H.; Cheng, X. U-Shaped Association of Serum Uric Acid with All-Cause and Cause-Specific Mortality in US Adults: A Cohort Study. J. Clin. Endocrinol. Metab. 2020, 105, e597–e609. [Google Scholar] [CrossRef]
- Giebultowicz, J.; Wroczynski, P.; Samolczyk-Wanyura, D. Comparison of antioxidant enzymes activity and the concentration of uric acid in the saliva of patients with oral cavity cancer, odontogenic cysts and healthy subjects. J. Oral. Pathol. Med. 2011, 40, 726–730. [Google Scholar] [CrossRef]

 : activation;
  : inhibition;
  : increase.
: activation; : inhibition; : increase.
: increase.
: activation; : inhibition; : increase.
 : activation;
  : inhibition;
  : increase;
  : decrease.
  indicates lack of nuclear translocation and therefore loss of transcription of the target genes.
: activation; : inhibition; : increase; : decrease. indicates lack of nuclear translocation and therefore loss of transcription of the target genes.
indicates lack of nuclear translocation and therefore loss of transcription of the target genes.
: activation; : inhibition; : increase; : decrease. indicates lack of nuclear translocation and therefore loss of transcription of the target genes.

 : activation;
  : inhibition;
  : increase;
  : decrease.
: activation; : inhibition; : increase; : decrease.
: decrease.
: activation; : inhibition; : increase; : decrease.
Publisher’s Note: MDPI stays neutral with regard to jurisdictional claims in published maps and institutional affiliations. |
© 2022 by the authors. Licensee MDPI, Basel, Switzerland. This article is an open access article distributed under the terms and conditions of the Creative Commons Attribution (CC BY) license (https://creativecommons.org/licenses/by/4.0/).
Share and Cite
Allegrini, S.; Garcia-Gil, M.; Pesi, R.; Camici, M.; Tozzi, M.G. The Good, the Bad and the New about Uric Acid in Cancer. Cancers 2022, 14, 4959. https://doi.org/10.3390/cancers14194959
Allegrini S, Garcia-Gil M, Pesi R, Camici M, Tozzi MG. The Good, the Bad and the New about Uric Acid in Cancer. Cancers. 2022; 14(19):4959. https://doi.org/10.3390/cancers14194959
Chicago/Turabian StyleAllegrini, Simone, Mercedes Garcia-Gil, Rossana Pesi, Marcella Camici, and Maria Grazia Tozzi. 2022. "The Good, the Bad and the New about Uric Acid in Cancer" Cancers 14, no. 19: 4959. https://doi.org/10.3390/cancers14194959
APA StyleAllegrini, S., Garcia-Gil, M., Pesi, R., Camici, M., & Tozzi, M. G. (2022). The Good, the Bad and the New about Uric Acid in Cancer. Cancers, 14(19), 4959. https://doi.org/10.3390/cancers14194959