

Defining A Liquid Biopsy Profile of Circulating Tumor Cells and Oncosomes in Metastatic Colorectal Cancer for Clinical Utility

 , , ,
, , ,  and
and
Abstract
Simple Summary
Abstract
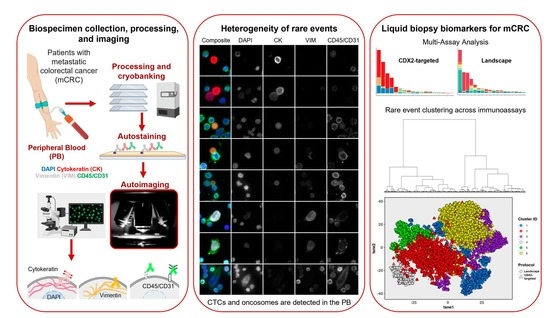
1. Introduction
2. Materials and Methods
2.1. Study Design
2.2. Blood Processing
2.3. IF Staining Protocols
2.4. Scanning and Analysis
2.5. Rare Event Detection Approach
2.6. Multi-Assay Analysis
2.7. Survival Analysis
2.8. Statistical Analysis
3. Results
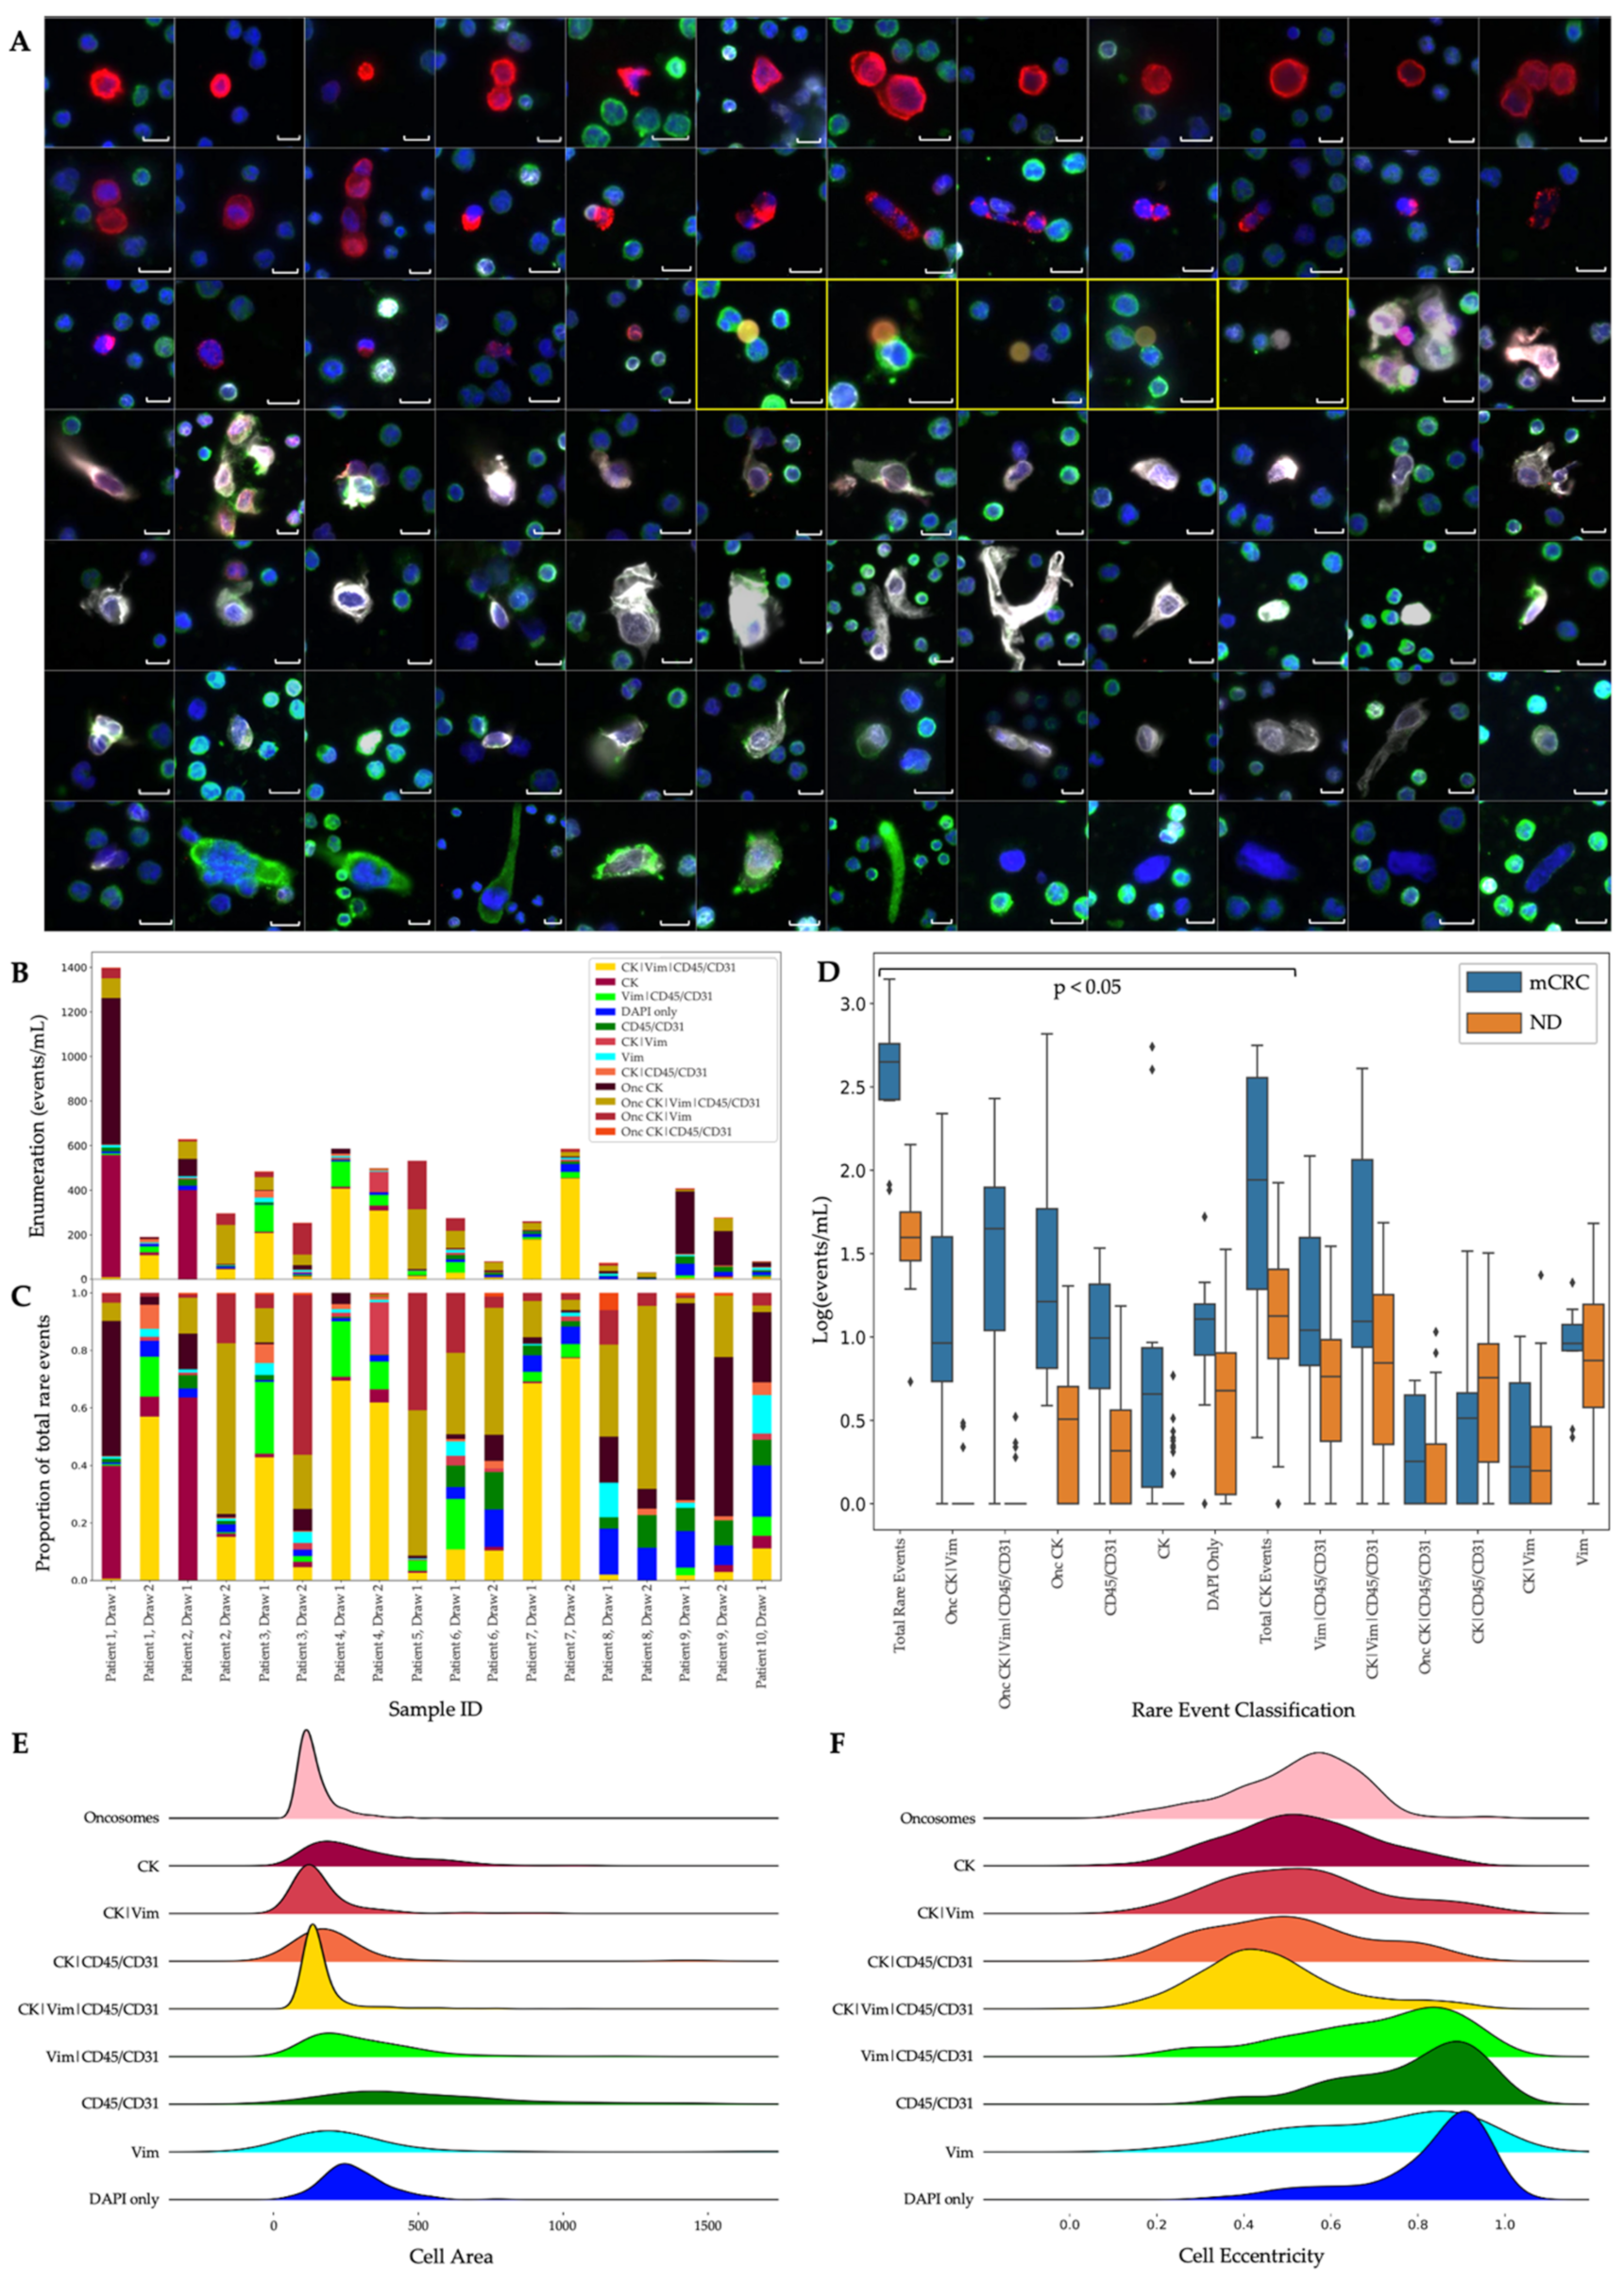
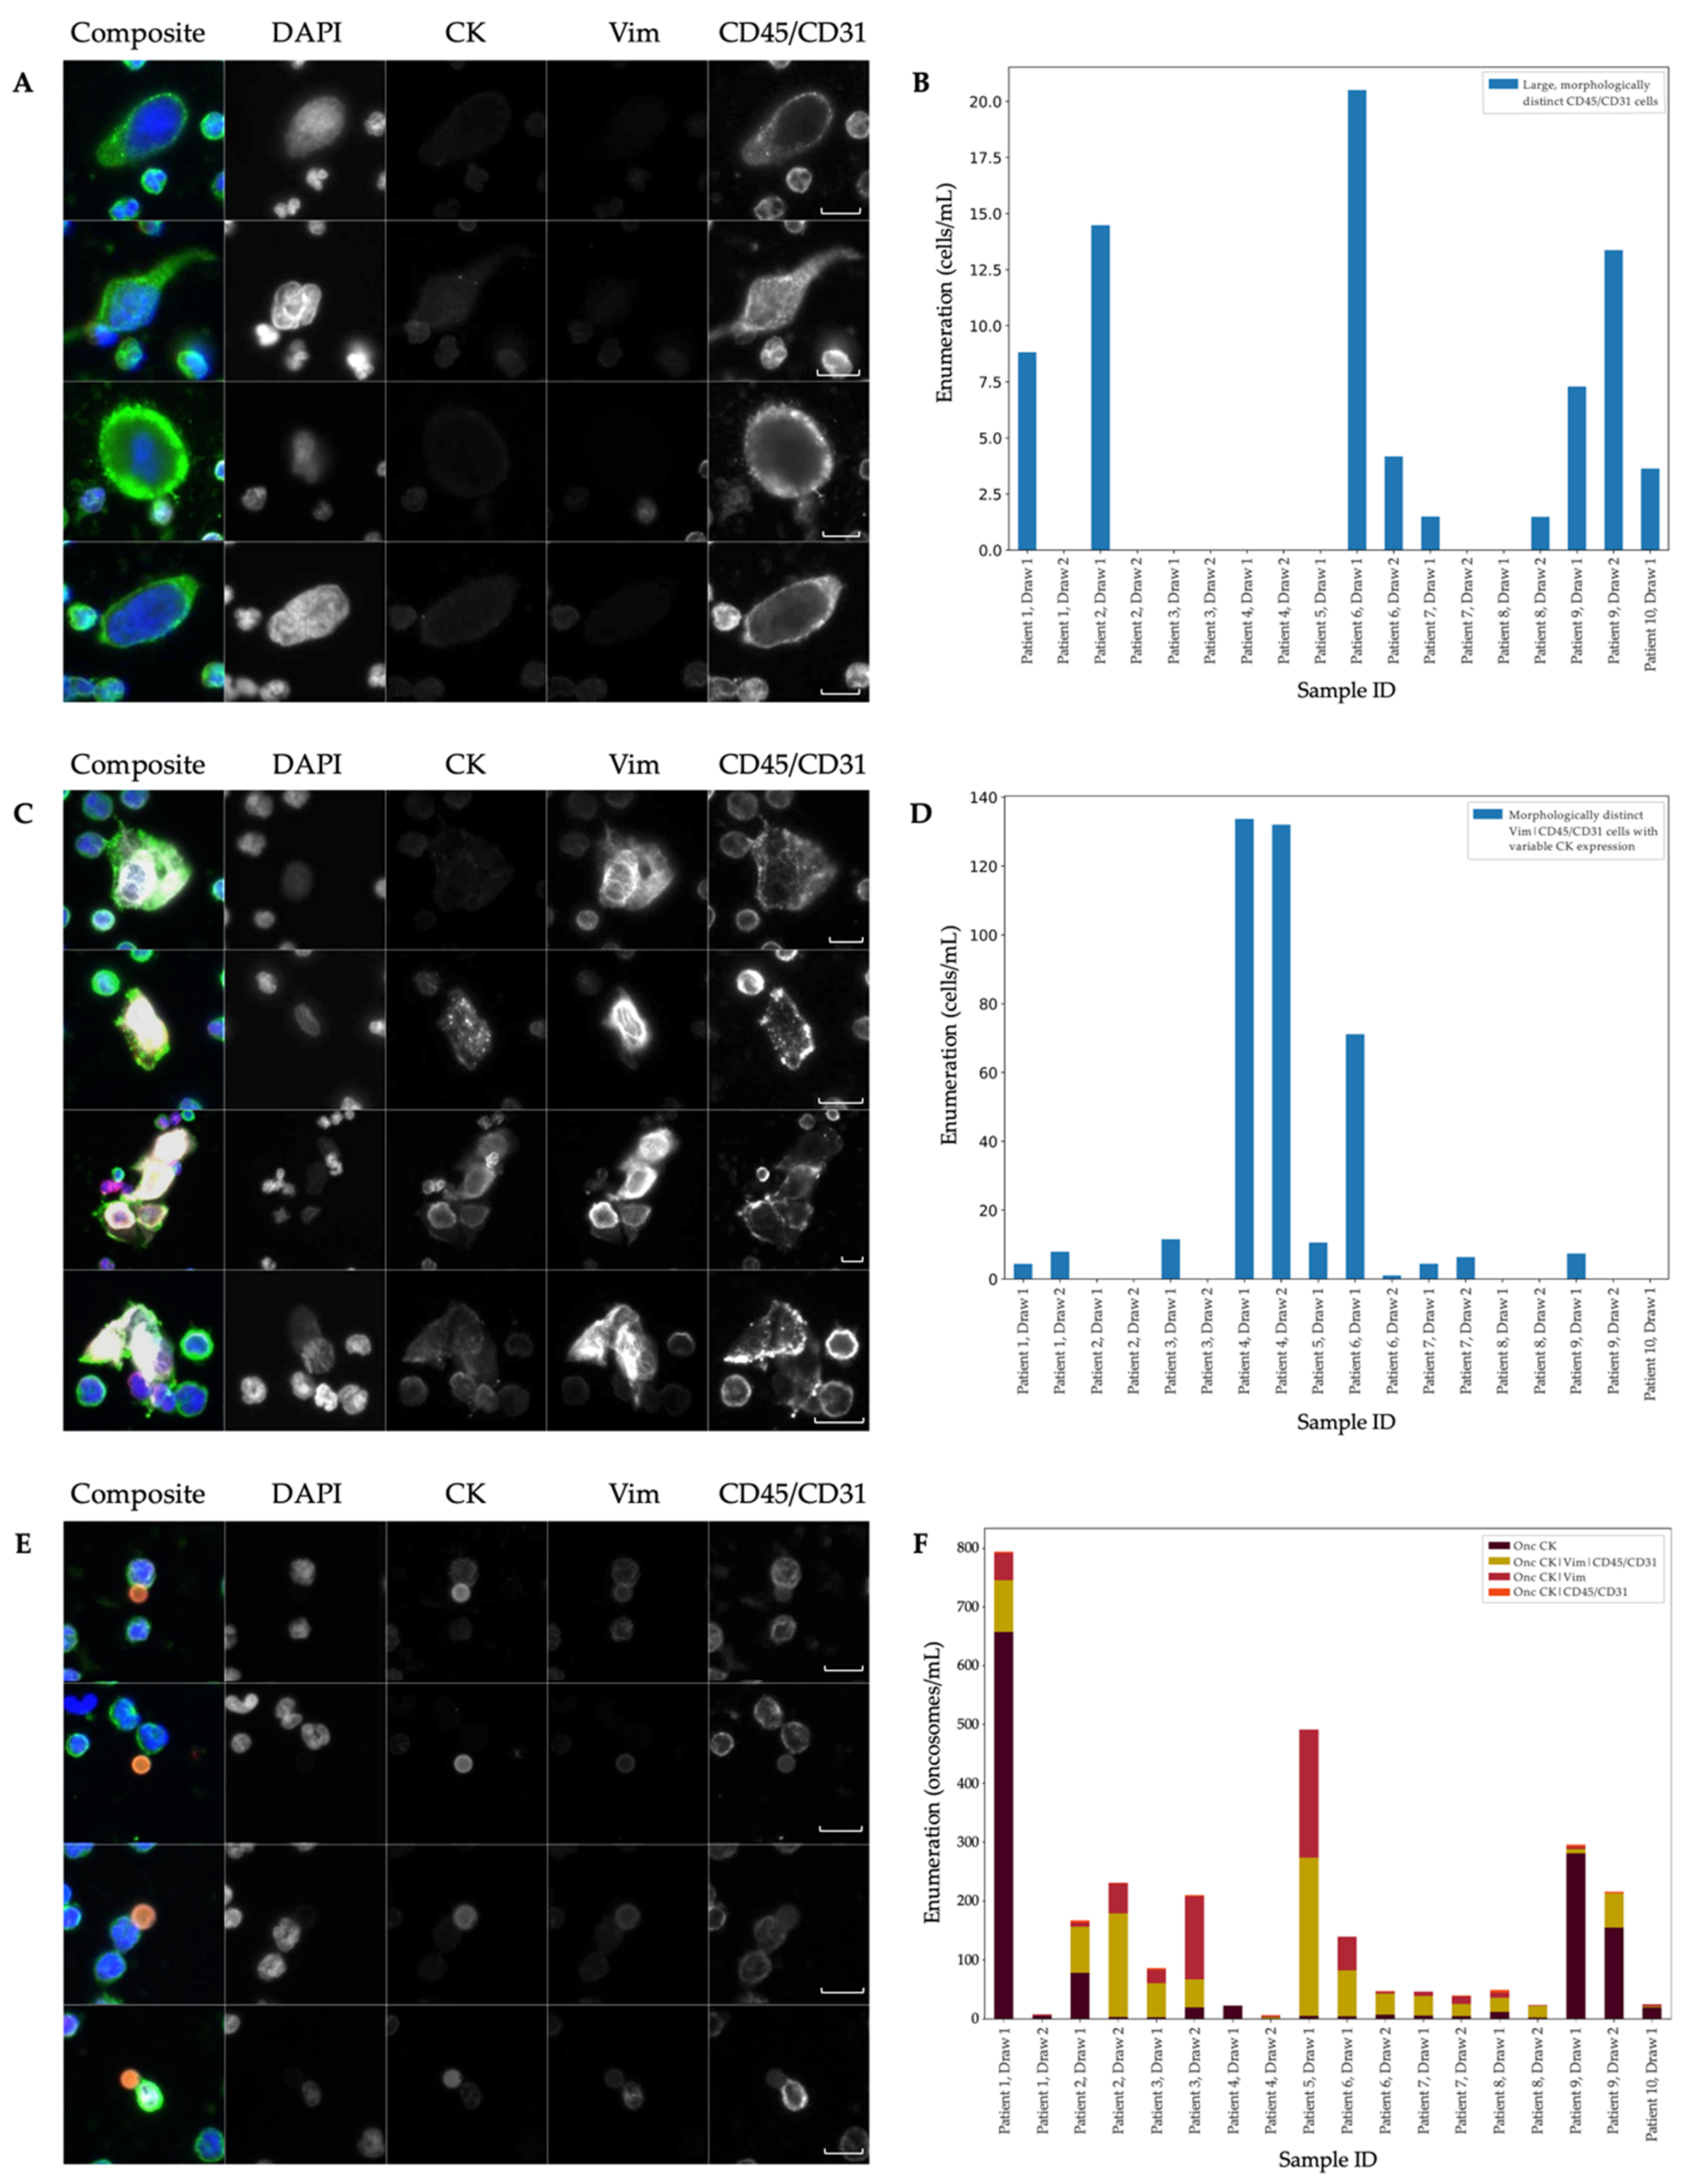
3.1. Landscape Rare-Event Detection: Rare Cells and Oncosomes
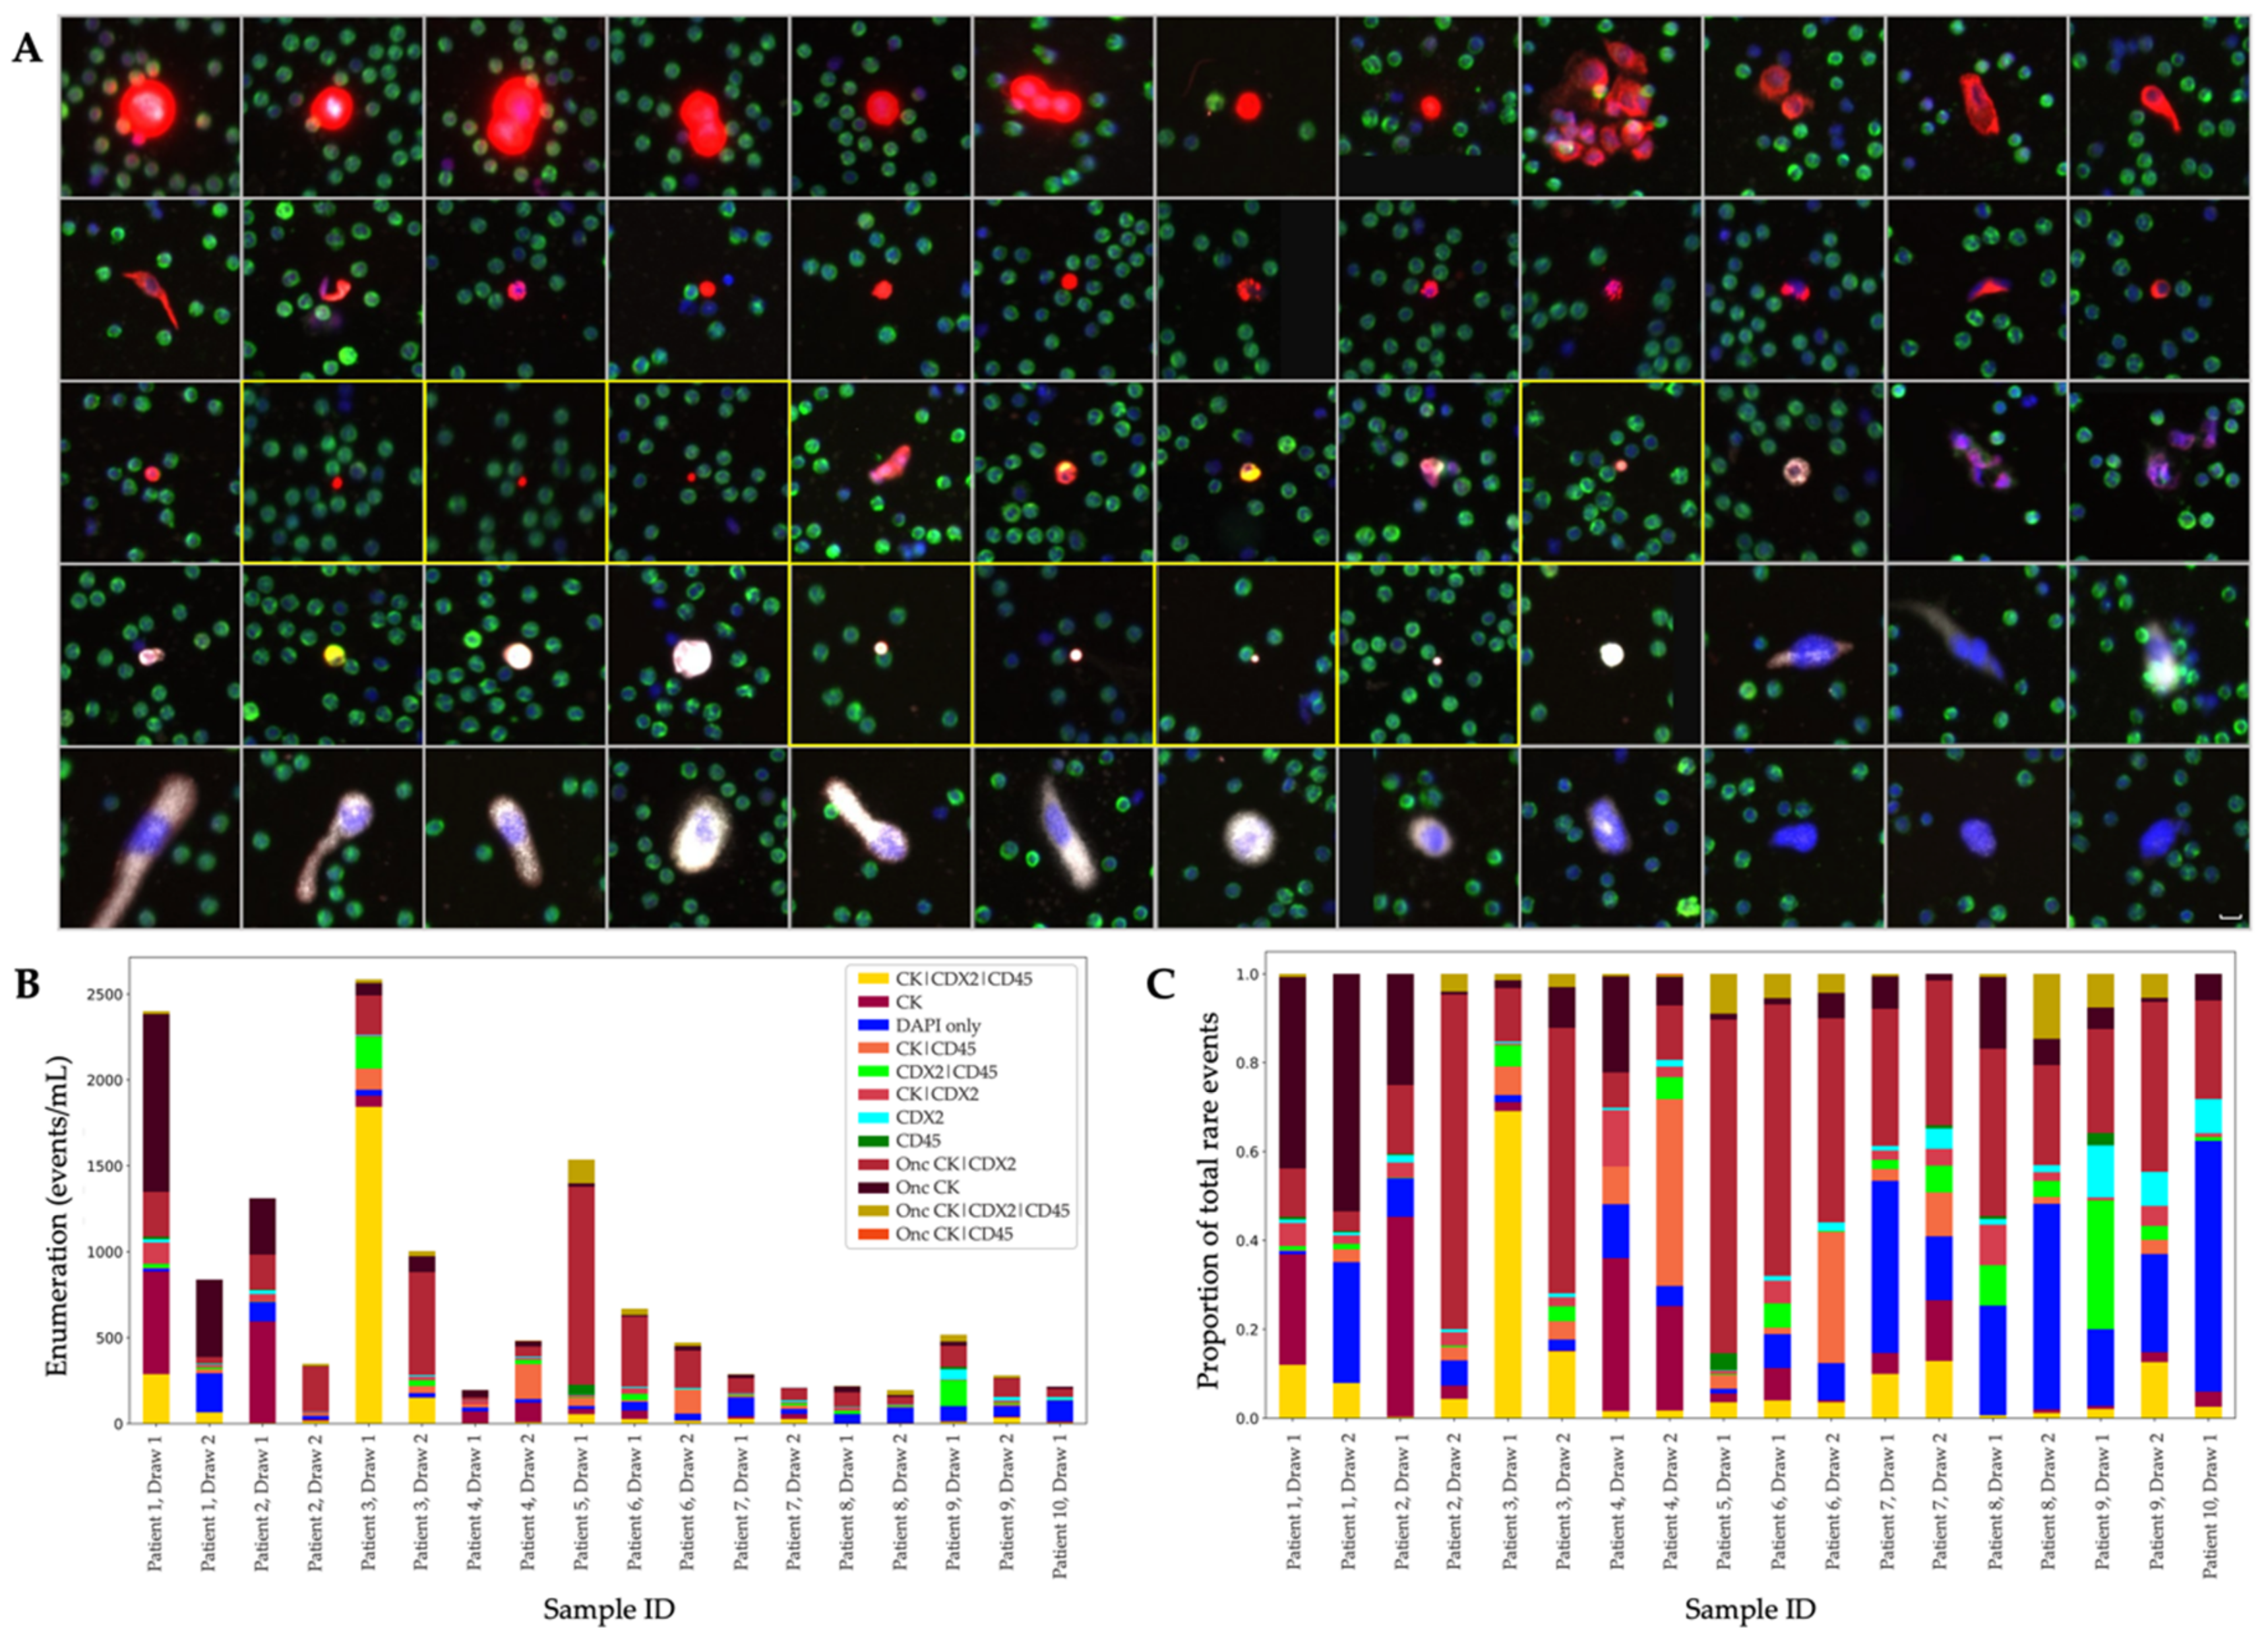
3.2. Analysis of the CDX2-Targeted Protocol
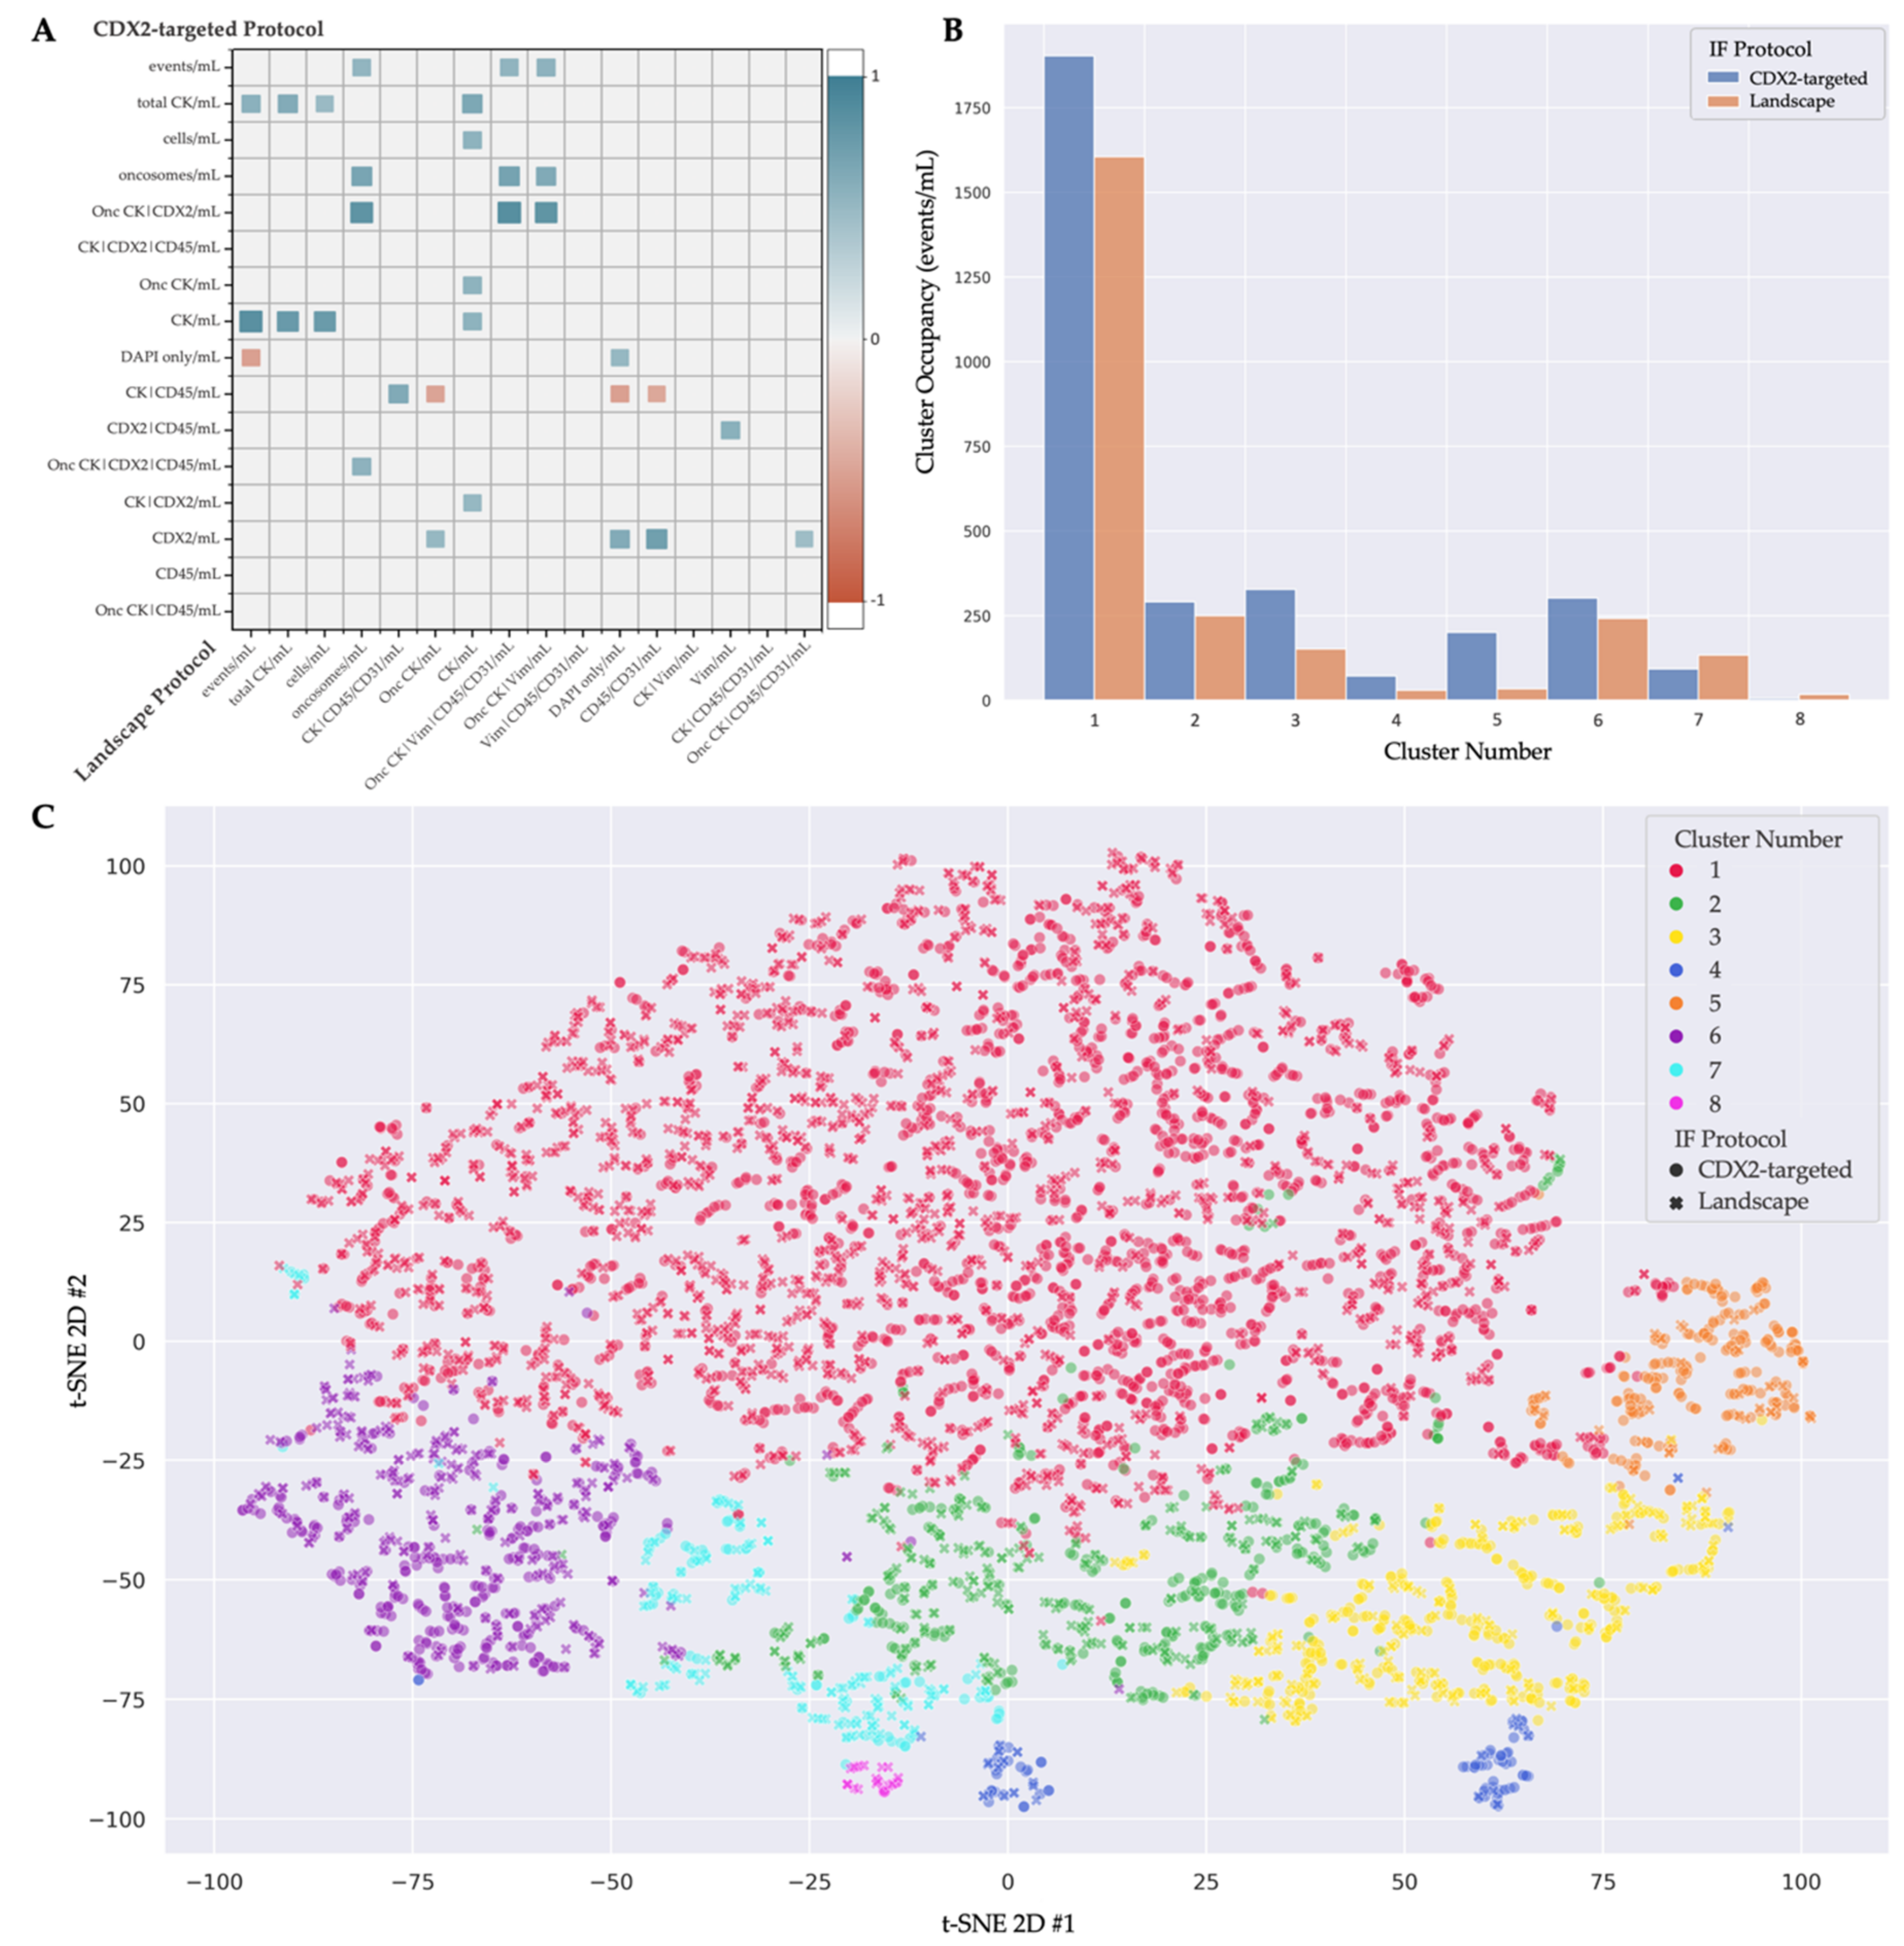
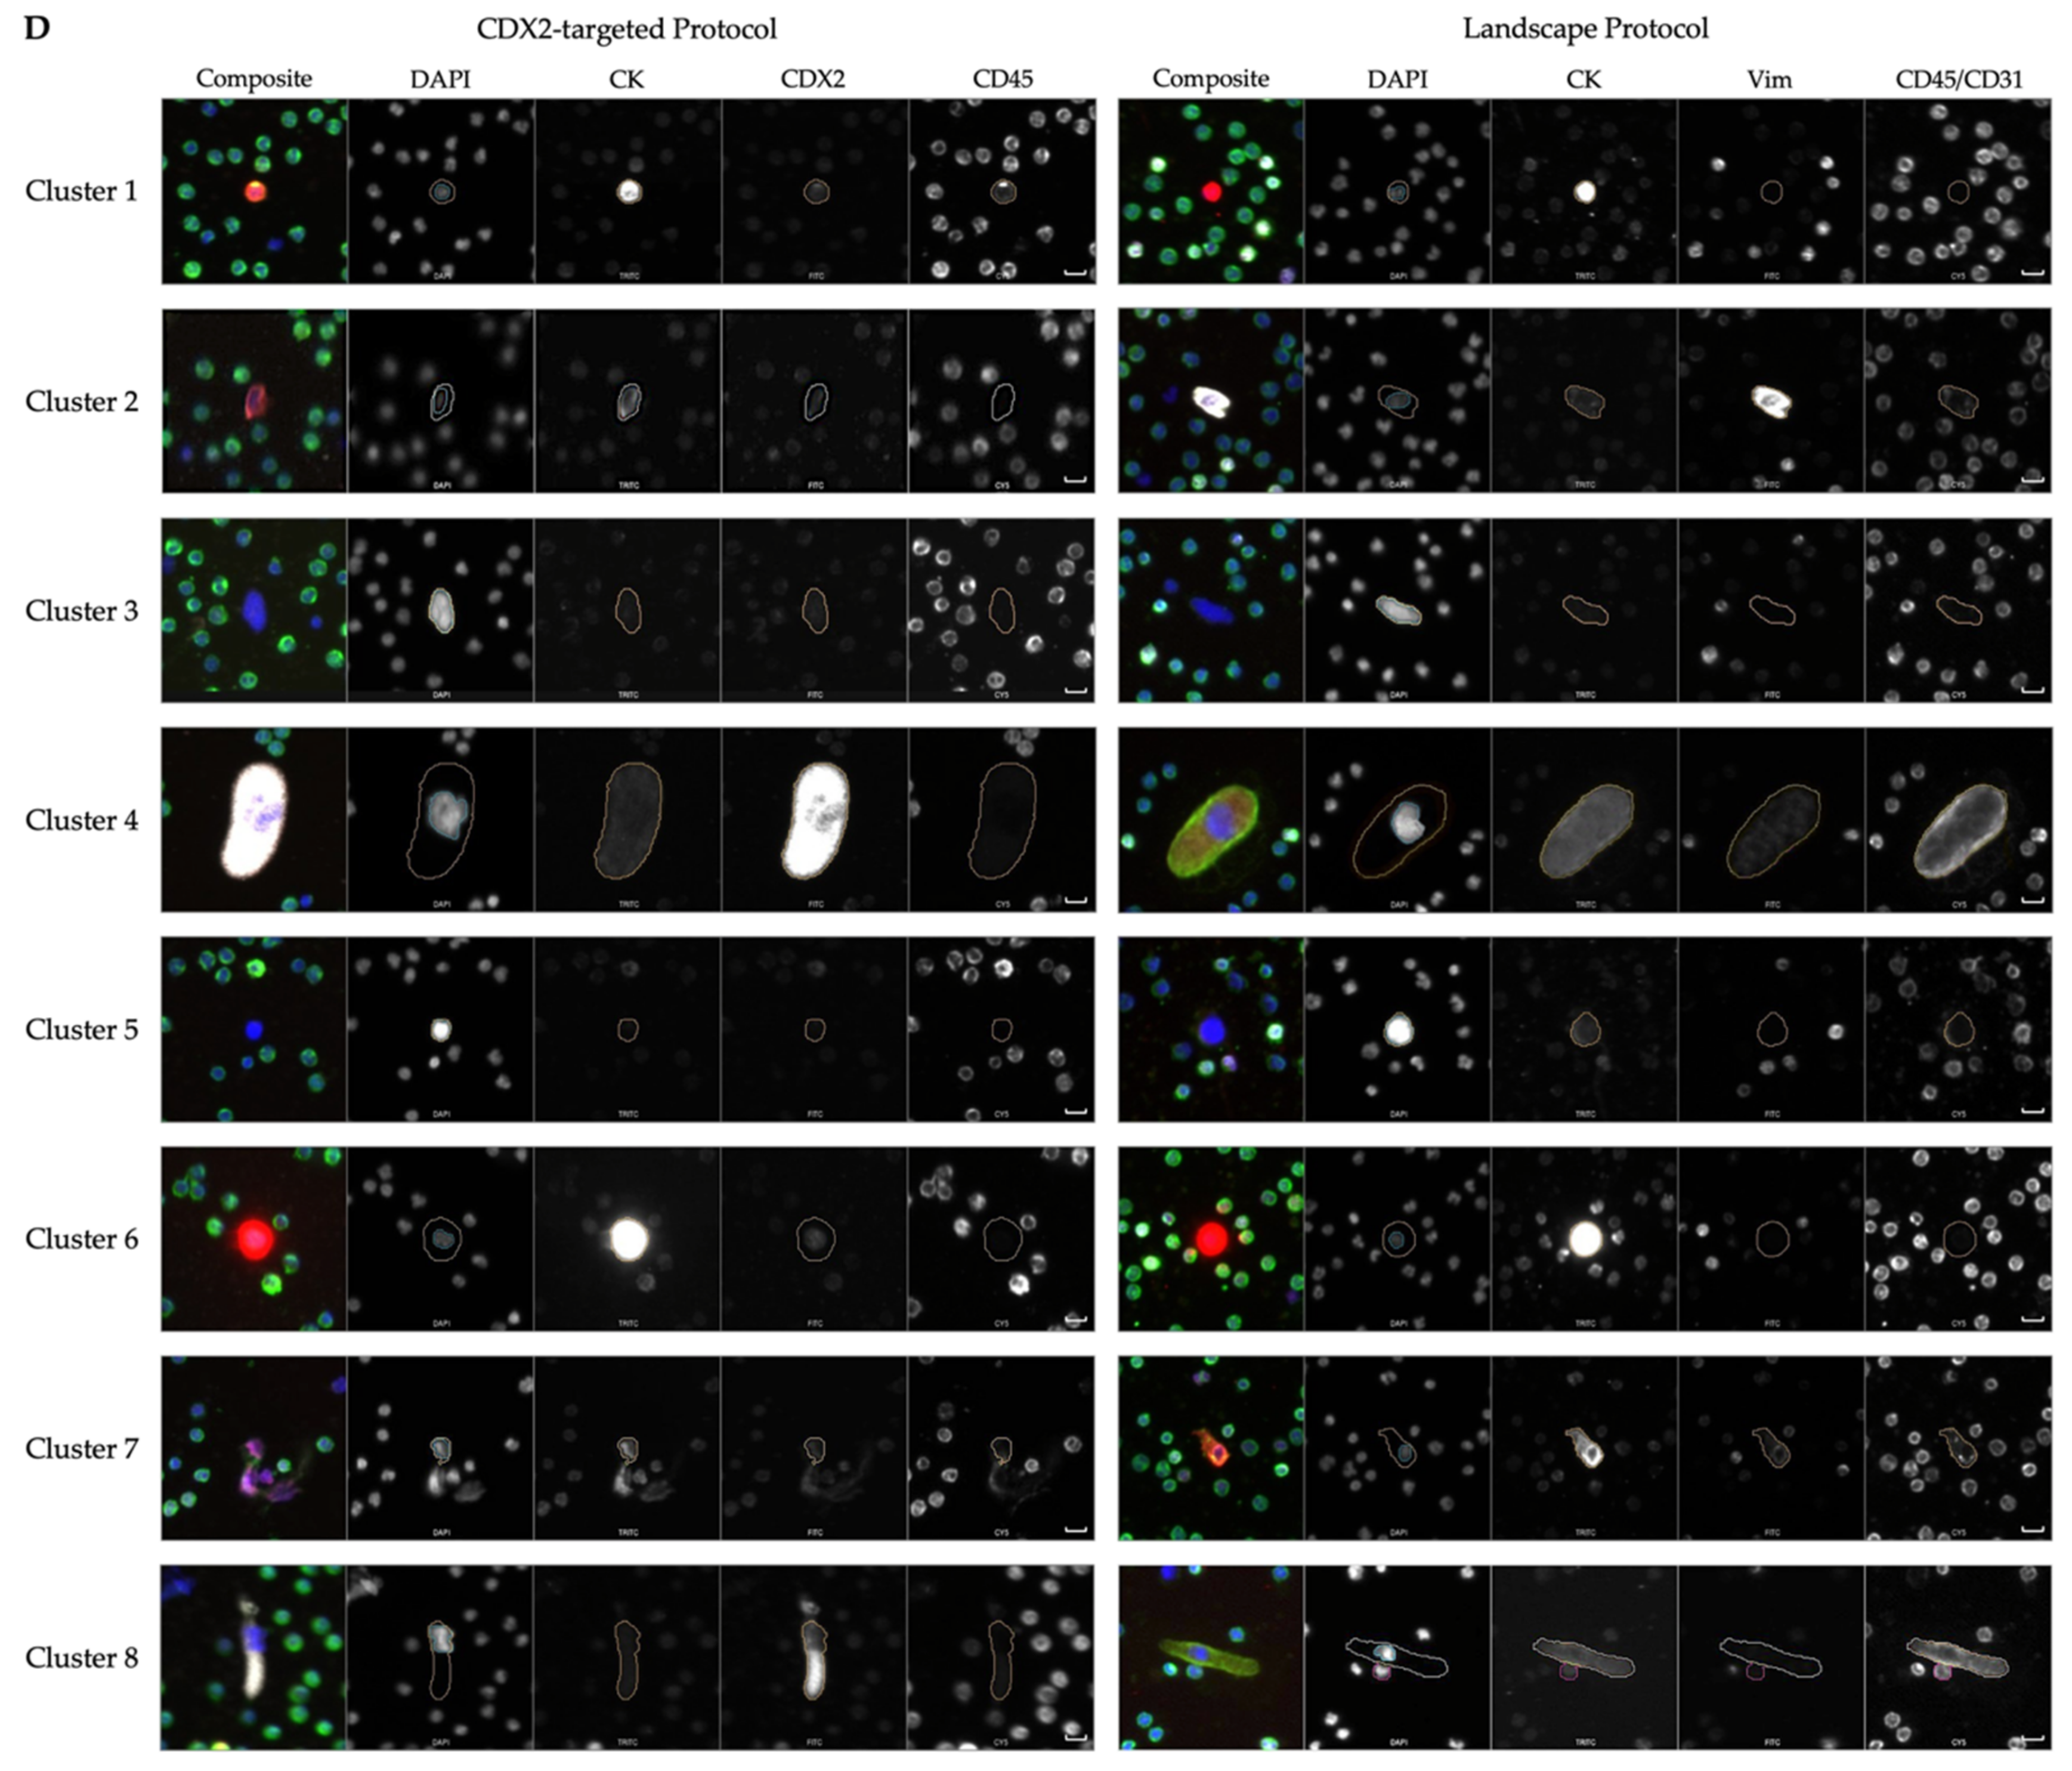
3.3. Multi-Assay Analysis
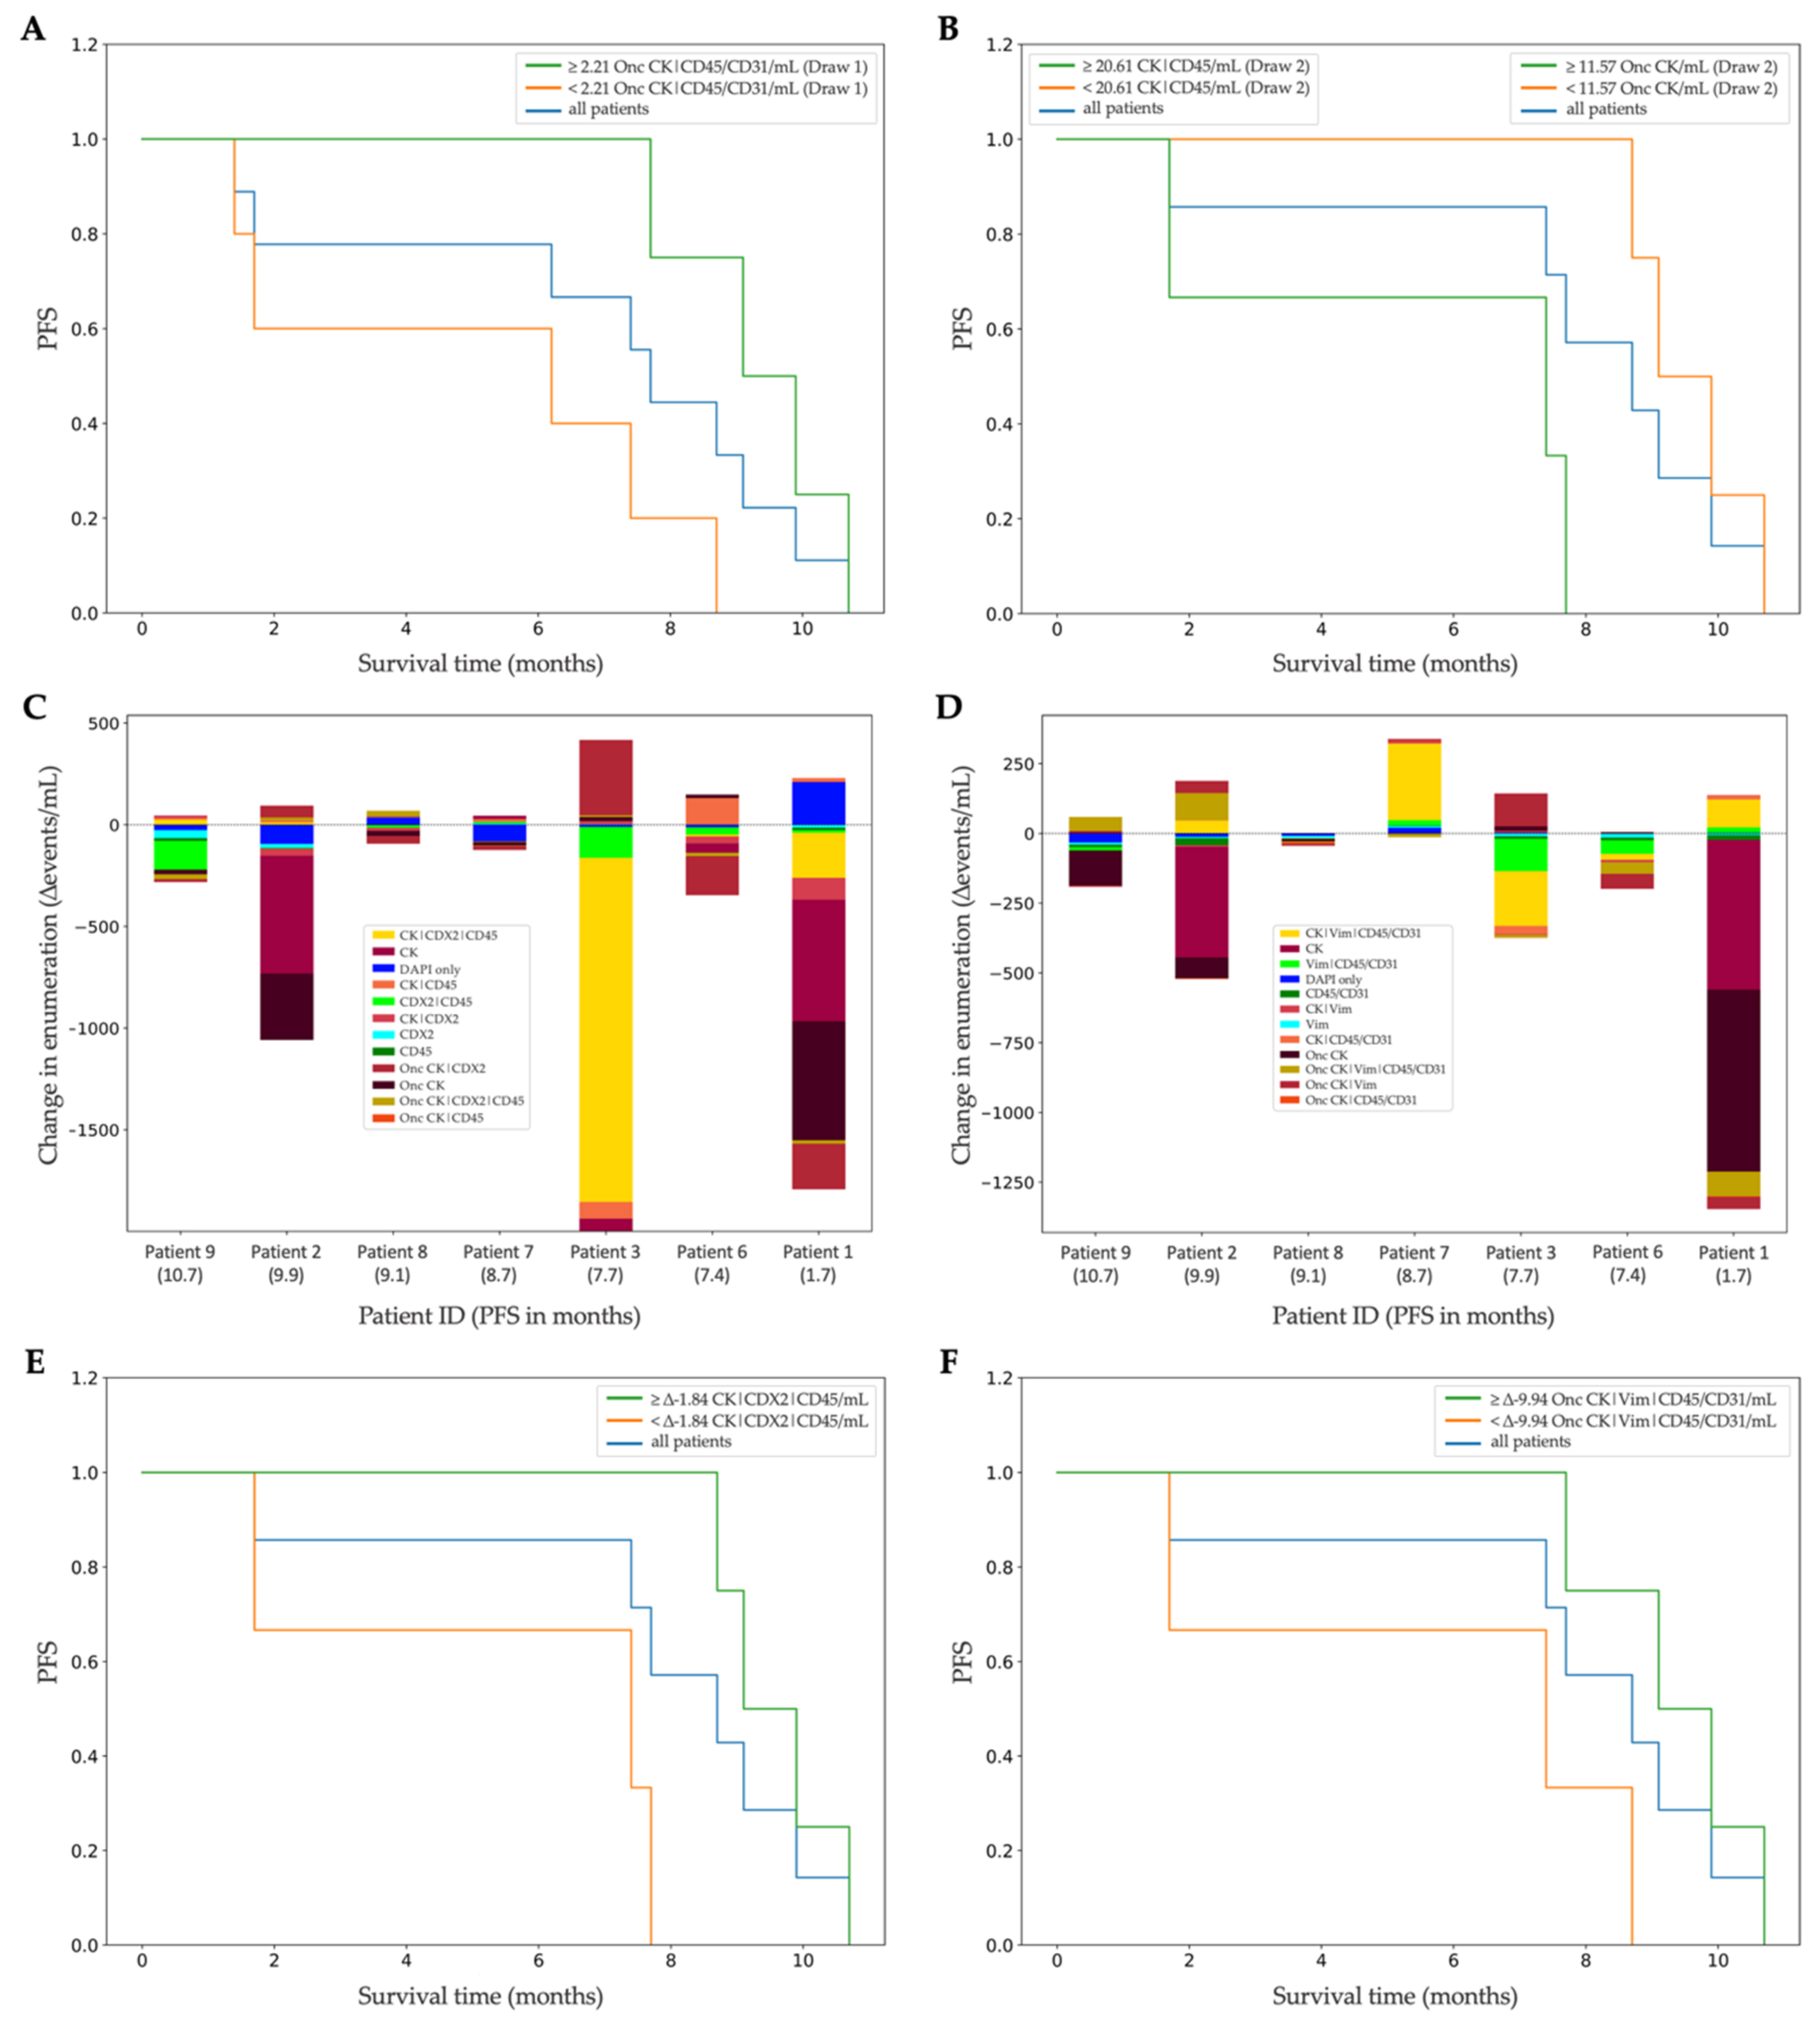
3.4. Clinical Correlation of Liquid-Biopsy Data
4. Discussion
5. Conclusions
Supplementary Materials
Author Contributions
Funding
Institutional Review Board Statement
Informed Consent Statement
Data Availability Statement
Acknowledgments
Conflicts of Interest
References
- Siegel, R.L.; Miller, K.D.; Goding Sauer, A.; Fedewa, S.A.; Butterly, L.F.; Anderson, J.C.; Cercek, A.; Smith, R.A.; Jemal, A. Colorectal cancer statistics, 2020. CA A Cancer J. Clin. 2020, 70, 145–164. [Google Scholar] [CrossRef] [PubMed]
- Barker, N.; Bartfeld, S.; Clevers, H. Tissue-resident adult stem cell populations of rapidly self-renewing organs. Cell Stem Cell 2010, 7, 656–670. [Google Scholar] [CrossRef] [PubMed]
- Fontana, E.; Nyamundanda, G.; Cunningham, D.; Tu, D.; Cheang, M.C.; Jonker, D.J.; Siu, L.L.; Sclafani, F.; Eason, K.; Ragulan, C. Intratumoral transcriptome heterogeneity is associated with patient prognosis and sidedness in patients with colorectal cancer treated with anti-EGFR therapy from the CO. 20 trial. JCO Precis. Oncol. 2020, 4, 1152–1162. [Google Scholar] [CrossRef]
- Suzuki, Y.; Ng, S.B.; Chua, C.; Leow, W.Q.; Chng, J.; Liu, S.Y.; Ramnarayanan, K.; Gan, A.; Ho, D.L.; Ten, R. Multiregion ultra-deep sequencing reveals early intermixing and variable levels of intratumoral heterogeneity in colorectal cancer. Mol. Oncol. 2017, 11, 124–139. [Google Scholar] [CrossRef]
- Moorcraft, S.Y.; Smyth, E.C.; Cunningham, D. The role of personalized medicine in metastatic colorectal cancer: An evolving landscape. Ther. Adv. Gastroenterol. 2013, 6, 381–395. [Google Scholar] [CrossRef] [PubMed]
- Molinari, C.; Marisi, G.; Passardi, A.; Matteucci, L.; De Maio, G.; Ulivi, P. Heterogeneity in colorectal cancer: A challenge for personalized medicine? Int. J. Mol. Sci. 2018, 19, 3733. [Google Scholar] [CrossRef]
- Kyrochristos, I.D.; Roukos, D.H. Comprehensive intra-individual genomic and transcriptional heterogeneity: Evidence-based Colorectal Cancer Precision Medicine. Cancer Treat. Rev. 2019, 80, 101894. [Google Scholar] [CrossRef] [PubMed]
- Chen, D.; Xu, T.; Wang, S.; Chang, H.; Yu, T.; Zhu, Y.; Chen, J. Liquid Biopsy Applications in the Clinic. Mol. Diagn. Ther. 2020, 24, 125–132. [Google Scholar]
- Esposito, A.; Criscitiello, C.; Locatelli, M.; Milano, M.; Curigliano, G. Liquid biopsies for solid tumors: Understanding tumor heterogeneity and real time monitoring of early resistance to targeted therapies. Pharmacol. Ther. 2016, 157, 120–124. [Google Scholar] [CrossRef]
- Russano, M.; Napolitano, A.; Ribelli, G.; Iuliani, M.; Simonetti, S.; Citarella, F.; Pantano, F.; Dell’Aquila, E.; Anesi, C.; Silvestris, N. Liquid biopsy and tumor heterogeneity in metastatic solid tumors: The potentiality of blood samples. J. Exp. Clin. Cancer Res. 2020, 39, 95. [Google Scholar] [CrossRef]
- Van Cutsem, E.; Cervantes, A.; Nordlinger, B.; Arnold, D. Metastatic colorectal cancer: ESMO Clinical Practice Guidelines for diagnosis, treatment and follow-up. Ann. Oncol. 2014, 25, iii1–iii9. [Google Scholar] [CrossRef] [PubMed]
- Benson, A.B.; Venook, A.P.; Al-Hawary, M.M.; Arain, M.A.; Chen, Y.-J.; Ciombor, K.K.; Cohen, S.; Cooper, H.S.; Deming, D.; Farkas, L.; et al. Colon Cancer, Version 2.2021, NCCN Clinical Practice Guidelines in Oncology. J. Natl. Compr. Cancer Netw. 2021, 19, 329–359. [Google Scholar] [CrossRef] [PubMed]
- Aggarwal, C.; Meropol, N.; Punt, C.; Iannotti, N.; Saidman, B.; Sabbath, K.; Gabrail, N.; Picus, J.; Morse, M.; Mitchell, E. Relationship among circulating tumor cells, CEA and overall survival in patients with metastatic colorectal cancer. Ann. Oncol. 2013, 24, 420–428. [Google Scholar] [CrossRef] [PubMed]
- Cohen, S.J.; Punt, C.J.; Iannotti, N.; Saidman, B.H.; Sabbath, K.D.; Gabrail, N.Y.; Picus, J.; Morse, M.; Mitchell, E.; Miller, M.C.; et al. Relationship of circulating tumor cells to tumor response, progression-free survival, and overall survival in patients with metastatic colorectal cancer. J. Clin. Oncol. 2008, 26, 3213–3221. [Google Scholar] [CrossRef] [PubMed]
- Hendricks, A.; Brandt, B.; Geisen, R.; Dall, K.; Röder, C.; Schafmayer, C.; Becker, T.; Hinz, S.; Sebens, S. Isolation and enumeration of CTC in colorectal cancer patients: Introduction of a novel cell imaging approach and comparison to cellular and molecular detection techniques. Cancers 2020, 12, 2643. [Google Scholar] [CrossRef] [PubMed]
- Kolenčík, D.; Narayan, S.; Thiele, J.-A.; McKinley, D.; Gerdtsson, A.S.; Welter, L.; Hošek, P.; Ostašov, P.; Vyčítal, O.; Brůha, J.; et al. Circulating tumor cell kinetics and morphology from the liquid biopsy predict disease progression in patients with metastatic colorectal cancer following resection. Cancers 2022, 14, 642. [Google Scholar] [CrossRef] [PubMed]
- Kolencik, D.; Shishido, S.N.; Pitule, P.; Mason, J.; Hicks, J.; Kuhn, P. Liquid biopsy in colorectal carcinoma: Clinical applications and challenges. Cancers 2020, 12, 1376. [Google Scholar] [CrossRef]
- Veridex LLC. CellSearch Circulating Tumor Cell Kit Premarket Notification-Expanded Indications for Use—Metastatic Prostate Cancer. 2008. Available online: https://www.accessdata.fda.gov/cdrh_docs/pdf7/k073338.pdf (accessed on 16 December 2008).
- Allard, W.J.; Matera, J.; Miller, M.C.; Repollet, M.; Connelly, M.C.; Rao, C.; Tibbe, A.G.; Uhr, J.W.; Terstappen, L.W. Tumor cells circulate in the peripheral blood of all major carcinomas but not in healthy subjects or patients with nonmalignant diseases. Clin. Cancer Res. 2004, 10, 6897–6904. [Google Scholar] [CrossRef]
- Miller, M.C.; Doyle, G.V.; Terstappen, L.W. Significance of circulating tumor cells detected by the CellSearch system in patients with metastatic breast colorectal and prostate cancer. J. Oncol. 2010, 2010, 617421. [Google Scholar] [CrossRef]
- Seeberg, L.T.; Waage, A.; Brunborg, C.; Hugenschmidt, H.; Renolen, A.; Stav, I.; Bjornbeth, B.A.; Brudvik, K.W.; Borgen, E.F.; Naume, B.; et al. Circulating tumor cells in patients with colorectal liver metastasis predict impaired survival. Ann. Surg. 2015, 261, 164–171. [Google Scholar] [CrossRef]
- Huang, X.; Gao, P.; Song, Y.; Sun, J.; Chen, X.; Zhao, J.; Xu, H.; Wang, Z. Meta-analysis of the prognostic value of circulating tumor cells detected with the CellSearch System in colorectal cancer. BMC Cancer 2015, 15, 202. [Google Scholar] [CrossRef] [PubMed]
- Mazouji, O.; Ouhajjou, A.; Incitti, R.; Mansour, H. Updates on clinical use of liquid biopsy in colorectal cancer screening, diagnosis, follow-up, and treatment guidance. Front. Cell Dev. Biol. 2021, 9, 962. [Google Scholar] [CrossRef] [PubMed]
- Arneth, B. Update on the types and usage of liquid biopsies in the clinical setting: A systematic review. BMC Cancer 2018, 18, 527. [Google Scholar] [CrossRef]
- Gerdtsson, A.S.; Thiele, J.A.; Shishido, S.N.; Zheng, S.; Schaffer, R.; Bethel, K.; Curley, S.; Lenz, H.J.; Hanna, D.L.; Nieva, J.; et al. Single cell correlation analysis of liquid and solid biopsies in metastatic colorectal cancer. Oncotarget 2019, 10, 7016–7030. [Google Scholar] [CrossRef] [PubMed][Green Version]
- Sotelo, M.; Sastre, J.; Maestro, M.; Veganzones, S.; Vieitez, J.; Alonso, V.; Gravalos, C.; Escudero, P.; Vera, R.; Aranda, E. Role of circulating tumor cells as prognostic marker in resected stage III colorectal cancer. Ann. Oncol. 2015, 26, 535–541. [Google Scholar] [CrossRef]
- Wang, L.; Balasubramanian, P.; Chen, A.P.; Kummar, S.; Evrard, Y.A.; Kinders, R.J. Promise and limits of the CellSearch platform for evaluating pharmacodynamics in circulating tumor cells. Semin. Oncol. 2016, 43, 464–475. [Google Scholar] [CrossRef] [PubMed]
- Shishido, S.N.; Carlsson, A.; Nieva, J.; Bethel, K.; Hicks, J.B.; Bazhenova, L.; Kuhn, P. Circulating tumor cells as a response monitor in stage IV non-small cell lung cancer. J. Transl. Med. 2019, 17, 294. [Google Scholar] [CrossRef]
- Keomanee-Dizon, K.; Shishido, S.N.; Kuhn, P. Circulating tumor cells: High-throughput imaging of CTCs and bioinformatic analysis. Recent Results Cancer Res. 2020, 215, 89–104. [Google Scholar] [CrossRef]
- Marrinucci, D.; Bethel, K.; Kolatkar, A.; Luttgen, M.S.; Malchiodi, M.; Baehring, F.; Voigt, K.; Lazar, D.; Nieva, J.; Bazhenova, L. Fluid biopsy in patients with metastatic prostate, pancreatic and breast cancers. Phys. Biol. 2012, 9, 016003. [Google Scholar] [CrossRef]
- Rodríguez-Lee, M.; Kolatkar, A.; McCormick, M.; Dago, A.D.; Kendall, J.; Carlsson, N.A.; Bethel, K.; Greenspan, E.J.; Hwang, S.E.; Waitman, K.R. Effect of blood collection tube type and time to processing on the enumeration and high-content characterization of circulating tumor cells using the high-definition single-cell assay. Arch. Pathol. Lab. Med. 2018, 142, 198–207. [Google Scholar] [CrossRef]
- Shishido, S.N.; Welter, L.; Rodriguez-Lee, M.; Kolatkar, A.; Xu, L.; Ruiz, C.; Gerdtsson, A.S.; Restrepo-Vassalli, S.; Carlsson, A.; Larsen, J. Preanalytical variables for the genomic assessment of the cellular and acellular fractions of the liquid biopsy in a cohort of breast cancer patients. J. Mol. Diagn. 2020, 22, 319–337. [Google Scholar] [CrossRef] [PubMed]
- Bethel, K.; Luttgen, M.S.; Damani, S.; Kolatkar, A.; Lamy, R.; Sabouri-Ghomi, M.; Topol, S.; Topol, E.J.; Kuhn, P. Fluid phase biopsy for detection and characterization of circulating endothelial cells in myocardial infarction. Phys. Biol. 2014, 11, 016002. [Google Scholar] [CrossRef] [PubMed]
- Armstrong, A.J.; Halabi, S.; Luo, J.; Nanus, D.M.; Giannakakou, P.; Szmulewitz, R.Z.; Danila, D.C.; Healy, P.; Anand, M.; Rothwell, C.J. Prospective multicenter validation of androgen receptor splice variant 7 and hormone therapy resistance in high-risk castration-resistant prostate cancer: The prophecy study. J. Clin. Oncol. 2019, 37, 1120. [Google Scholar] [CrossRef] [PubMed]
- Scher, H.I.; Graf, R.P.; Schreiber, N.A.; Jayaram, A.; Winquist, E.; McLaughlin, B.; Lu, D.; Fleisher, M.; Orr, S.; Lowes, L. Assessment of the validity of nuclear-localized androgen receptor splice variant 7 in circulating tumor cells as a predictive biomarker for castration-resistant prostate cancer. JAMA Oncol. 2018, 4, 1179–1186. [Google Scholar] [CrossRef] [PubMed]
- Scher, H.I.; Lu, D.; Schreiber, N.A.; Louw, J.; Graf, R.P.; Vargas, H.A.; Johnson, A.; Jendrisak, A.; Bambury, R.; Danila, D. Association of AR-V7 on circulating tumor cells as a treatment-specific biomarker with outcomes and survival in castration-resistant prostate cancer. JAMA Oncol. 2016, 2, 1441–1449. [Google Scholar] [CrossRef]
- Welter, L.; Xu, L.; McKinley, D.; Dago, A.E.; Prabakar, R.K.; Restrepo-Vassalli, S.; Xu, K.; Rodriguez-Lee, M.; Kolatkar, A.; Nevarez, R. Treatment response and tumor evolution: Lessons from an extended series of multianalyte liquid biopsies in a metastatic breast cancer patient. Mol. Case Stud. 2020, 6, a005819. [Google Scholar] [CrossRef]
- Gerdtsson, E.; Pore, M.; Thiele, J.-A.; Gerdtsson, A.S.; Malihi, P.D.; Nevarez, R.; Kolatkar, A.; Velasco, C.R.; Wix, S.; Singh, M. Multiplex protein detection on circulating tumor cells from liquid biopsies using imaging mass cytometry. Converg. Sci. Phys. Oncol. 2018, 4, 015002. [Google Scholar] [CrossRef]
- Febbo, P.G.; Martin, A.M.; Scher, H.I.; Barrett, J.C.; Beaver, J.A.; Beresford, P.J.; Blumenthal, G.M.; Bramlett, K.; Compton, C.; Dittamore, R. Minimum technical data elements for liquid biopsy data submitted to public databases. Clin. Pharmacol. Ther. 2020, 107, 730–734. [Google Scholar] [CrossRef]
- Ghatalia, P.; Smith, C.H.; Winer, A.; Gou, J.; Kiedrowski, L.A.; Slifker, M.; Saltzberg, P.D.; Bubes, N.; Anari, F.M.; Kasireddy, V.; et al. Clinical Utilization Pattern of Liquid Biopsies (LB) to Detect Actionable Driver Mutations, Guide Treatment Decisions and Monitor Disease Burden During Treatment of 33 Metastatic Colorectal Cancer (mCRC) Patients (pts) at a Fox Chase Cancer Center GI Oncology Subspecialty Clinic. Front. Oncol. 2018, 8, 652. [Google Scholar] [CrossRef]
- Matsusaka, S.; Suenaga, M.; Mishima, Y.; Takagi, K.; Terui, Y.; Mizunuma, N.; Hatake, K. Circulating endothelial cells predict for response to bevacizumab-based chemotherapy in metastatic colorectal cancer. Cancer Chemother. Pharmacol. 2011, 68, 763–768. [Google Scholar] [CrossRef]
- Simkens, L.; Tol, J.; Terstappen, L.; Teerenstra, S.; Punt, C.; Nagtegaal, I. The predictive and prognostic value of circulating endothelial cells in advanced colorectal cancer patients receiving first-line chemotherapy and bevacizumab. Ann. Oncol. 2010, 21, 2447–2448. [Google Scholar] [CrossRef] [PubMed]
- Okusha, Y.; Eguchi, T.; Tran, M.T.; Sogawa, C.; Yoshida, K.; Itagaki, M.; Taha, E.A.; Ono, K.; Aoyama, E.; Okamura, H. Extracellular vesicles enriched with moonlighting metalloproteinase are highly transmissive, pro-tumorigenic, and trans-activates cellular communication network factor (CCN2/CTGF): CRISPR against cancer. Cancers 2020, 12, 881. [Google Scholar] [CrossRef] [PubMed]
- Di Vizio, D.; Kim, J.; Hager, M.H.; Morello, M.; Yang, W.; Lafargue, C.J.; True, L.D.; Rubin, M.A.; Adam, R.M.; Beroukhim, R. Oncosome formation in prostate cancer: Association with a region of frequent chromosomal deletion in metastatic disease. Cancer Res. 2009, 69, 5601–5609. [Google Scholar] [CrossRef] [PubMed]
- Ciardiello, C.; Leone, A.; Lanuti, P.; Roca, M.S.; Moccia, T.; Minciacchi, V.R.; Minopoli, M.; Gigantino, V.; De Cecio, R.; Rippa, M. Large oncosomes overexpressing integrin alpha-V promote prostate cancer adhesion and invasion via AKT activation. J. Exp. Clin. Cancer Res. 2019, 38, 317. [Google Scholar] [CrossRef]
- Gerdtsson, A.S.; Setayesh, S.M.; Malihi, P.D.; Ruiz, C.; Carlsson, A.; Nevarez, R.; Matsumoto, N.; Gerdtsson, E.; Zurita, A.; Logothetis, C.; et al. Large extracellular vesicle characterization and association with circulating tumor cells in metastatic castrate resistant prostate cancer. Cancers 2021, 13, 1056. [Google Scholar] [CrossRef]
- Chai, S.; Matsumoto, N.; Storgard, R.; Peng, C.C.; Aparicio, A.; Ormseth, B.; Rappard, K.; Cunningham, K.; Kolatkar, A.; Nevarez, R.; et al. Platelet-coated circulating tumor cells are a predictive biomarker in patients with metastatic castrate-resistant prostate cancer. Mol. Cancer Res. 2021, 19, 2036–2045. [Google Scholar] [CrossRef]
- Shishido, S.N.; Sayeed, S.; Courcoubetis, G.; Djaladat, H.; Miranda, G.; Pienta, K.J.; Nieva, J.; Hansel, D.E.; Desai, M.; Gill, I.S.; et al. Characterization of cellular and acellular analytes from pre-cystectomy liquid biopsies in patients newly diagnosed with primary bladder cancer. Cancers 2022, 14, 758. [Google Scholar] [CrossRef]
- Werling, R.W.; Yaziji, H.; Bacchi, C.E.; Gown, A.M. CDX2, a highly sensitive and specific marker of adenocarcinomas of intestinal origin: An immunohistochemical survey of 476 primary and metastatic carcinomas. Am. J. Surg. Pathol. 2003, 27, 303–310. [Google Scholar] [CrossRef]
- Adams, D.L.; Stefansson, S.; Haudenschild, C.; Martin, S.S.; Charpentier, M.; Chumsri, S.; Cristofanilli, M.; Tang, C.M.; Alpaugh, R.K. Cytometric characterization of circulating tumor cells captured by microfiltration and their correlation to the cellsearch® CTC test. Cytom. Part A 2015, 87, 137–144. [Google Scholar] [CrossRef]
- Shishido, S.N.; Ghoreifi, A.; Sayeed, S.; Courcoubetis, G.; Huang, A.; Ye, B.; Mrutyunjaya, S.; Gill, I.S.; Kuhn, P.; Mason, J.; et al. Liquid biopsy landscape in patients with primary upper tract Urothelial Carcinoma. Cancers 2022, 14, 3007. [Google Scholar] [CrossRef]
- Minciacchi, V.R.; Freeman, M.R.; Di Vizio, D. Extracellular vesicles in cancer: Exosomes, microvesicles and the emerging role of large oncosomes. Semin. Cell Dev. Biol. 2015, 40, 41–51. [Google Scholar] [CrossRef] [PubMed]
- Di Vizio, D.; Morello, M.; Dudley, A.C.; Schow, P.W.; Adam, R.M.; Morley, S.; Mulholland, D.; Rotinen, M.; Hager, M.H.; Insabato, L. Large oncosomes in human prostate cancer tissues and in the circulation of mice with metastatic disease. Am. J. Pathol. 2012, 181, 1573–1584. [Google Scholar] [CrossRef] [PubMed]
- Pedregosa, F.; Varoquaux, G.; Gramfort, A.; Michel, V.; Thirion, B.; Grisel, O.; Blondel, M.; Prettenhofer, P.; Weiss, R.; Dubourg, V. Scikit-learn: Machine learning in Python. J. Mach. Learn. Res. 2011, 12, 2825–2830. [Google Scholar]
- Spearman, C. The proof and measurement of association between two things. Am. J. Psychol. 1987, 100, 441–471. [Google Scholar] [CrossRef]
- Kaplan, E.L.; Meier, P. Nonparametric estimation from incomplete observations. J. Am. Stat. Assoc. 1958, 53, 457–481. [Google Scholar] [CrossRef]
- Virtanen, P.; Gommers, R.; Oliphant, T.E.; Haberland, M.; Reddy, T.; Cournapeau, D.; Burovski, E.; Peterson, P.; Weckesser, W.; Bright, J. SciPy 1.0: Fundamental algorithms for scientific computing in Python. Nat. Methods 2020, 17, 261–272. [Google Scholar] [CrossRef]
- Pölsterl, S. Scikit-survival: A library for time-to-event analysis built on top of scikit-learn. J. Mach. Learn. Res. 2020, 21, 8747–8752. [Google Scholar]
- Sharpe, A.; McIntosh, M.; Lawrie, S.M. Research methods, statistics and evidence-based practice. In Companion to Psychiatric Studies, 8th ed.; Churchill Livingstone: London, UK, 2010; p. 157. [Google Scholar]
- Hladovec, J.; Rossmann, P. Circulating endothelial cells isolated together with platelets and the experimental modification of their counts in rats. Thromb. Res. 1973, 3, 665–674. [Google Scholar] [CrossRef]
- Mancuso, P.; Burlini, A.; Pruneri, G.; Goldhirsch, A.; Martinelli, G.; Bertolini, F. Resting and activated endothelial cells are increased in the peripheral blood of cancer patients. Blood J. Am. Soc. Hematol. 2001, 97, 3658–3661. [Google Scholar] [CrossRef]
- Ronzoni, M.; Manzoni, M.; Mariucci, S.; Loupakis, F.; Brugnatelli, S.; Bencardino, K.; Rovati, B.; Tinelli, C.; Falcone, A.; Villa, E. Circulating endothelial cells and endothelial progenitors as predictive markers of clinical response to bevacizumab-based first-line treatment in advanced colorectal cancer patients. Ann. Oncol. 2010, 21, 2382–2389. [Google Scholar] [CrossRef]
- Cima, I.; Kong, S.L.; Sengupta, D.; Tan, I.B.; Phyo, W.M.; Lee, D.; Hu, M.; Iliescu, C.; Alexander, I.; Goh, W.L. Tumor-derived circulating endothelial cell clusters in colorectal cancer. Sci. Transl. Med. 2016, 8, 345ra389. [Google Scholar] [CrossRef] [PubMed]
- Dave, J.M.; Bayless, K.J. Vimentin as an integral regulator of cell adhesion and endothelial sprouting. Microcirculation 2014, 21, 333–344. [Google Scholar] [CrossRef] [PubMed]
- DeLisser, H.; Newman, P.; Albelda, S. Platelet endothelial cell adhesion molecule (CD31). Curr. Top. Microbiol. Immunol. 1993, 184, 37–45. [Google Scholar] [PubMed]
- Metcalf, D.; MacDonald, H.; Odartchenko, N.; Sordat, B. Growth of mouse megakaryocyte colonies in vitro. Proc. Natl. Acad. Sci. USA 1975, 72, 1744–1748. [Google Scholar] [CrossRef]
- Xu, L.; Mao, X.; Guo, T.; Chan, P.Y.; Shaw, G.; Hines, J.; Stankiewicz, E.; Wang, Y.; Oliver, R.T.D.; Ahmad, A.S. The novel association of circulating tumor cells and circulating megakaryocytes with prostate cancer prognosis. Clin. Cancer Res. 2017, 23, 5112–5122. [Google Scholar] [CrossRef] [PubMed]
- Huang, W.; Zhao, S.; Xu, W.; Zhang, Z.; Ding, X.; He, J.; Liang, W. Presence of intra-tumoral CD61+ megakaryocytes predicts poor prognosis in non-small cell lung cancer. Transl. Lung Cancer Res. 2019, 8, 323. [Google Scholar] [CrossRef]
- Zhu, X.; Cao, Y.; Lu, P.; Kang, Y.; Lin, Z.; Hao, T.; Song, Y. Evaluation of platelet indices as diagnostic biomarkers for colorectal cancer. Sci. Rep. 2018, 8, 11814. [Google Scholar] [CrossRef] [PubMed]
- Crescitelli, R.; Lässer, C.; Lötvall, J. Isolation and characterization of extracellular vesicle subpopulations from tissues. Nature Protocols 2021, 16, 1548–1580. [Google Scholar] [CrossRef]
- Schwitalla, S.; Fingerle, A.A.; Cammareri, P.; Nebelsiek, T.; Göktuna, S.I.; Ziegler, P.K.; Canli, O.; Heijmans, J.; Huels, D.J.; Moreaux, G. Intestinal tumorigenesis initiated by dedifferentiation and acquisition of stem-cell-like properties. Cell 2013, 152, 25–38. [Google Scholar] [CrossRef]
- Merlos-Suárez, A.; Barriga, F.M.; Jung, P.; Iglesias, M.; Céspedes, M.V.; Rossell, D.; Sevillano, M.; Hernando-Momblona, X.; da Silva-Diz, V.; Muñoz, P. The intestinal stem cell signature identifies colorectal cancer stem cells and predicts disease relapse. Cell Stem Cell 2011, 8, 511–524. [Google Scholar] [CrossRef]
- Fumagalli, A.; Oost, K.C.; Kester, L.; Morgner, J.; Bornes, L.; Bruens, L.; Spaargaren, L.; Azkanaz, M.; Schelfhorst, T.; Beerling, E. Plasticity of Lgr5-negative cancer cells drives metastasis in colorectal cancer. Cell Stem Cell 2020, 26, 569–578.e7. [Google Scholar] [CrossRef] [PubMed]
- Dago, A.E.; Stepansky, A.; Carlsson, A.; Luttgen, M.; Kendall, J.; Baslan, T.; Kolatkar, A.; Wigler, M.; Bethel, K.; Gross, M.E. Rapid phenotypic and genomic change in response to therapeutic pressure in prostate cancer inferred by high content analysis of single circulating tumor cells. PLoS ONE 2014, 9, e101777. [Google Scholar] [CrossRef] [PubMed]
- Malihi, P.D.; Morikado, M.; Welter, L.; Liu, S.T.; Miller, E.T.; Cadaneanu, R.M.; Knudsen, B.S.; Lewis, M.S.; Carlsson, A.; Velasco, C.R. Clonal diversity revealed by morphoproteomic and copy number profiles of single prostate cancer cells at diagnosis. Converg. Sci. Phys. Oncol. 2018, 4, 015003. [Google Scholar] [CrossRef] [PubMed]
- Ruiz, C.; Li, J.; Luttgen, M.S.; Kolatkar, A.; Kendall, J.T.; Flores, E.; Topp, Z.; Samlowski, W.E.; McClay, E.; Bethel, K. Limited genomic heterogeneity of circulating melanoma cells in advanced stage patients. Phys. Biol. 2015, 12, 016008. [Google Scholar] [CrossRef]


| IF | Event Classification | Sample Positivity | Mean (Events/mL) | Standard Error (±Events/mL) | % of Total Rare Events | Median (Events/mL) | Range (Events/mL) |
|---|---|---|---|---|---|---|---|
| Protocol | |||||||
| Landscape | DAPI only | 15/18 | 13.69 | 2.9 | 3.55 | 10.84 | 0.00–51.57 |
| CK (Epi.CTC) | 18-Jul | 57 | 36.36 | 14.77 | 3.55 | 0.00–549.63 | |
| Vim | 18-Nov | 6.64 | 1.27 | 1.72 | 7.3 | 0.00–20.16 | |
| CD45/CD31 | 18-Oct | 10.29 | 2.44 | 2.67 | 8.05 | 0.00–33.16 | |
| CK|Vim (Mes.CTC) | 18-Jun | 7.6 | 1.4 | 1.97 | 1.4 | 0.00–91.29 | |
| CK|CD45/CD31 | 18-Apr | 4.66 | 1.86 | 1.21 | 2.13 | 0.00–30.74 | |
| Vim|CD45/CD31 | 18-Nov | 24.52 | 8.73 | 6.35 | 7.79 | 0.00–121.00 | |
| CK|Vim|CD45/CD31 | 15/18 | 100.4 | 35.02 | 26.01 | 12.89 | 0.00–453.13 | |
| Onc CK | 18-Dec | 71.59 | 38.39 | 18.55 | 6.64 | 1.06–657.60 | |
| Onc CK|Vim | 18-Oct | 32.72 | 13.64 | 8.48 | 7.38 | 0.00–217.65 | |
| Onc CK|CD45/CD31 | 0/18 | 1.47 | 0.36 | 0.38 | 1.12 | 0.00–4.47 | |
| Onc CK|Vim|CD45/CD31 | 14/18 | 55.37 | 16.22 | 14.35 | 34.32 | 0.00–268.32 | |
| CDX2- targeted | DAPI only | 18/18 | 63.72 | 12.8 | 8.33 | 45.29 | 16.94–226.94 |
| CK | 18-Dec | 88.14 | 43.95 | 11.53 | 11.97 | 0.00–597.32 | |
| CDX2 | 18-Dec | 11.45 | 3.28 | 1.5 | 7.27 | 1.04–60.22 | |
| CD45 | 18-Mar | 5.44 | 3.35 | 0.71 | 0 | 0.00–59.22 | |
| CK|CDX2 (CDX2.CTC) | 14/18 | 19.95 | 6.71 | 2.61 | 11.34 | 0.00–124.08 | |
| CK|CD45 | 18-Dec | 36.66 | 13.71 | 4.79 | 10.02 | 0.00–203.63 | |
| CDX2|CD45 | 18-Dec | 29.37 | 12.46 | 3.84 | 9.8 | 0.00–185.68 | |
| CK|CDX2|CD45 | 14/18 | 143.67 | 101.35 | 18.79 | 21.79 | 1.44–1843.34 | |
| Onc CK | 15/18 | 123.55 | 60.73 | 16.16 | 26 | 2.31–1035.65 | |
| Onc CK|CDX2 | 18/18 | 222.4 | 65.04 | 29.08 | 114.87 | 15.55–1151.64 | |
| Onc CK|CD45 | 0/18 | 0.06 | 0.06 | 0.01 | 0 | 0.00–1.06 | |
| Onc CK|CDX2|CD45 | 18-Oct | 20.27 | 7.64 | 2.65 | 14.5 | 0.00–1138.28 |
| Cluster Number | Cluster Comments | Cells from Landscape | Comments from Landscape | Cells from CDX2-Targeted | Comments from CDX2-Targeted |
|---|---|---|---|---|---|
| 1 | Heterogeneous phenotype with cellular morphology similar to WBCs | 1605 | Most prominent: CK|Vim|CD45/CD31 | 1903 | Most prominent: CK|CDX2|CD45 |
| 2 | Includes endothelial cells | 249 | Morphologically distinct Vim|CD45/CD31 cells with variable CK expression | 291 | 64 (22%) DAPI-only, 67 (23%) CK and 34 (12%) CK|CDX2 cells |
| 3 | Large nuclei, more eccentric than cluster 5 | 152 | 101 (66%) DAPI only, 11 (7%) morphologically distinct CD45/CD31 expressing cells | 328 | 279 (85%) DAPI-only |
| 4 | Includes megakaryocytes | 30 | 25 (83%) morphologically distinct CD45-/CD31-expressing cells, 5 (17%) small rod-like CD45-/CD31-expressing cells | 72 | DAPI-only and CDX2-only with similar large morphology |
| 5 | Large nuclei, more circular than cluster 3 | 34 | 15 (44%) DAPI-only | 201 | 191 (95%) DAPI-only |
| 6 | CK only CTCs | 242 | 219 (90%) Epi.CTCs | 302 | 265 (88%) CK and 29 (10%) CK|CDX2 cells |
| 7 | Includes endothelial cells | 134 | 84 (63%) morphologically distinct Vim|CD45/CD31 cells with variable CK expression | 93 | 80 (86%) CK only. Morphologically distinct from cluster 6, more elongated. |
| 8 | Includes megakaryocytes | 18 | Morphologically distinct CD45/CD31 cells with variable CK and Vim expression | 6 | Large, morphologically distinct cells with punctate CDX2 expression |
Publisher’s Note: MDPI stays neutral with regard to jurisdictional claims in published maps and institutional affiliations. |
© 2022 by the authors. Licensee MDPI, Basel, Switzerland. This article is an open access article distributed under the terms and conditions of the Creative Commons Attribution (CC BY) license (https://creativecommons.org/licenses/by/4.0/).
Share and Cite
Narayan, S.; Courcoubetis, G.; Mason, J.; Naghdloo, A.; Kolenčík, D.; Patterson, S.D.; Kuhn, P.; Shishido, S.N. Defining A Liquid Biopsy Profile of Circulating Tumor Cells and Oncosomes in Metastatic Colorectal Cancer for Clinical Utility. Cancers 2022, 14, 4891. https://doi.org/10.3390/cancers14194891
Narayan S, Courcoubetis G, Mason J, Naghdloo A, Kolenčík D, Patterson SD, Kuhn P, Shishido SN. Defining A Liquid Biopsy Profile of Circulating Tumor Cells and Oncosomes in Metastatic Colorectal Cancer for Clinical Utility. Cancers. 2022; 14(19):4891. https://doi.org/10.3390/cancers14194891
Chicago/Turabian StyleNarayan, Sachin, George Courcoubetis, Jeremy Mason, Amin Naghdloo, Drahomír Kolenčík, Scott D. Patterson, Peter Kuhn, and Stephanie N. Shishido. 2022. "Defining A Liquid Biopsy Profile of Circulating Tumor Cells and Oncosomes in Metastatic Colorectal Cancer for Clinical Utility" Cancers 14, no. 19: 4891. https://doi.org/10.3390/cancers14194891
APA StyleNarayan, S., Courcoubetis, G., Mason, J., Naghdloo, A., Kolenčík, D., Patterson, S. D., Kuhn, P., & Shishido, S. N. (2022). Defining A Liquid Biopsy Profile of Circulating Tumor Cells and Oncosomes in Metastatic Colorectal Cancer for Clinical Utility. Cancers, 14(19), 4891. https://doi.org/10.3390/cancers14194891