

Modulation of Fibroblast Activity via Vitamin D3 Is Dependent on Tumor Type—Studies on Mouse Mammary Gland Cancer
 , , , ,
  and
and
Abstract
Simple Summary
Abstract
1. Introduction
2. Materials and Methods
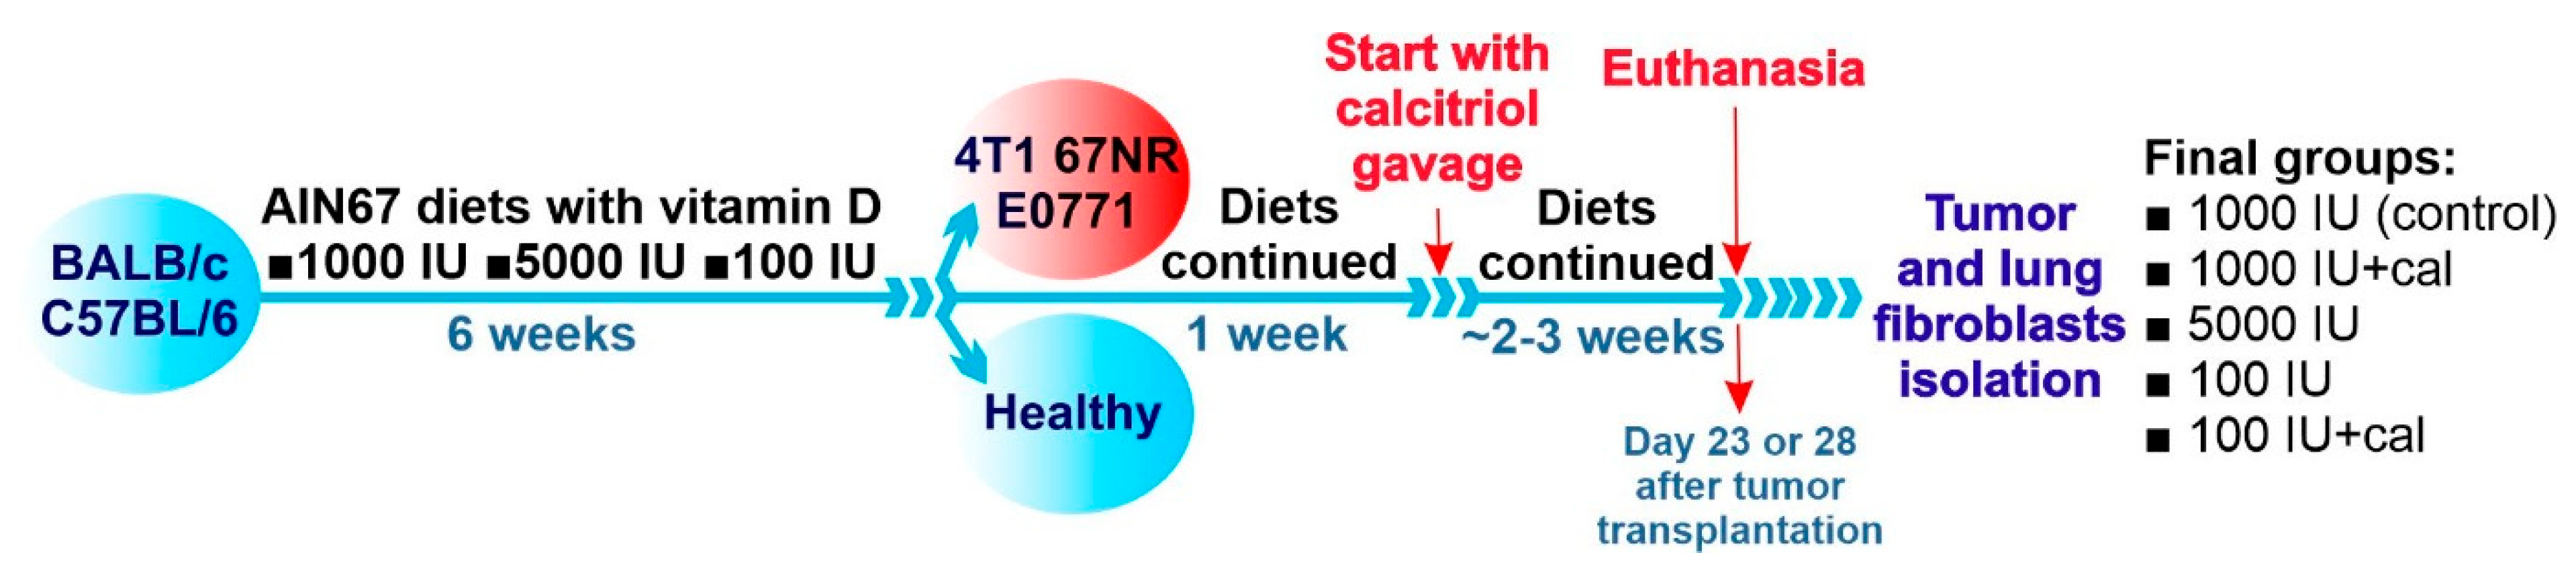
2.1. Cells and Tissues Harvested from Mice Bearing Mammary Gland Tumors
2.2. Blood Flow Assessment
2.3. Tissue Microarrays
2.4. Immunohistochemical Staining of Tissues
2.5. Isolation of Lung and Tumor Fibroblasts
2.6. Magnetic Separation
2.7. Flow Cytometry Analysis of Isolated Fibroblasts
2.8. Preparation of Conditioned Media (CM) from 4T1, 67NR, and E0771 Cell Cultures
2.9. Stimulation of Lung Fibroblasts from Healthy Mice with TGF-β and Mammary Gland Cancer CM
2.10. Fluorescence Microscopy Analyses
2.11. Real-Time qPCR Analysis of Cultured NFs Isolated from Lungs of Healthy BALB/c or C57BL/6 Mice Fed Control Diet and Vitamin-D3-Deficient Diet and/or Treated with Calcitriol
2.12. Tumor Tissue Preparation for Enzyme-Linked Immunosorbent Assays (ELISA)
2.13. Quantitative Protein Evaluation by ELISA
2.14. Statistical Analysis
3. Results
3.1. Impact of Vitamin D on Surface Markers of Lung NFs and CAFs
3.2. Analysis of Blood Flow in Tumor Tissue from 4T1, 67NR, and E0771 Tumor-Bearing Mice
3.3. COL1A1 and α-SMA Expression in Tumor Tissue
3.4. Plasma and Tumor Tissue Expression of Selected Cytokines and Growth Factors
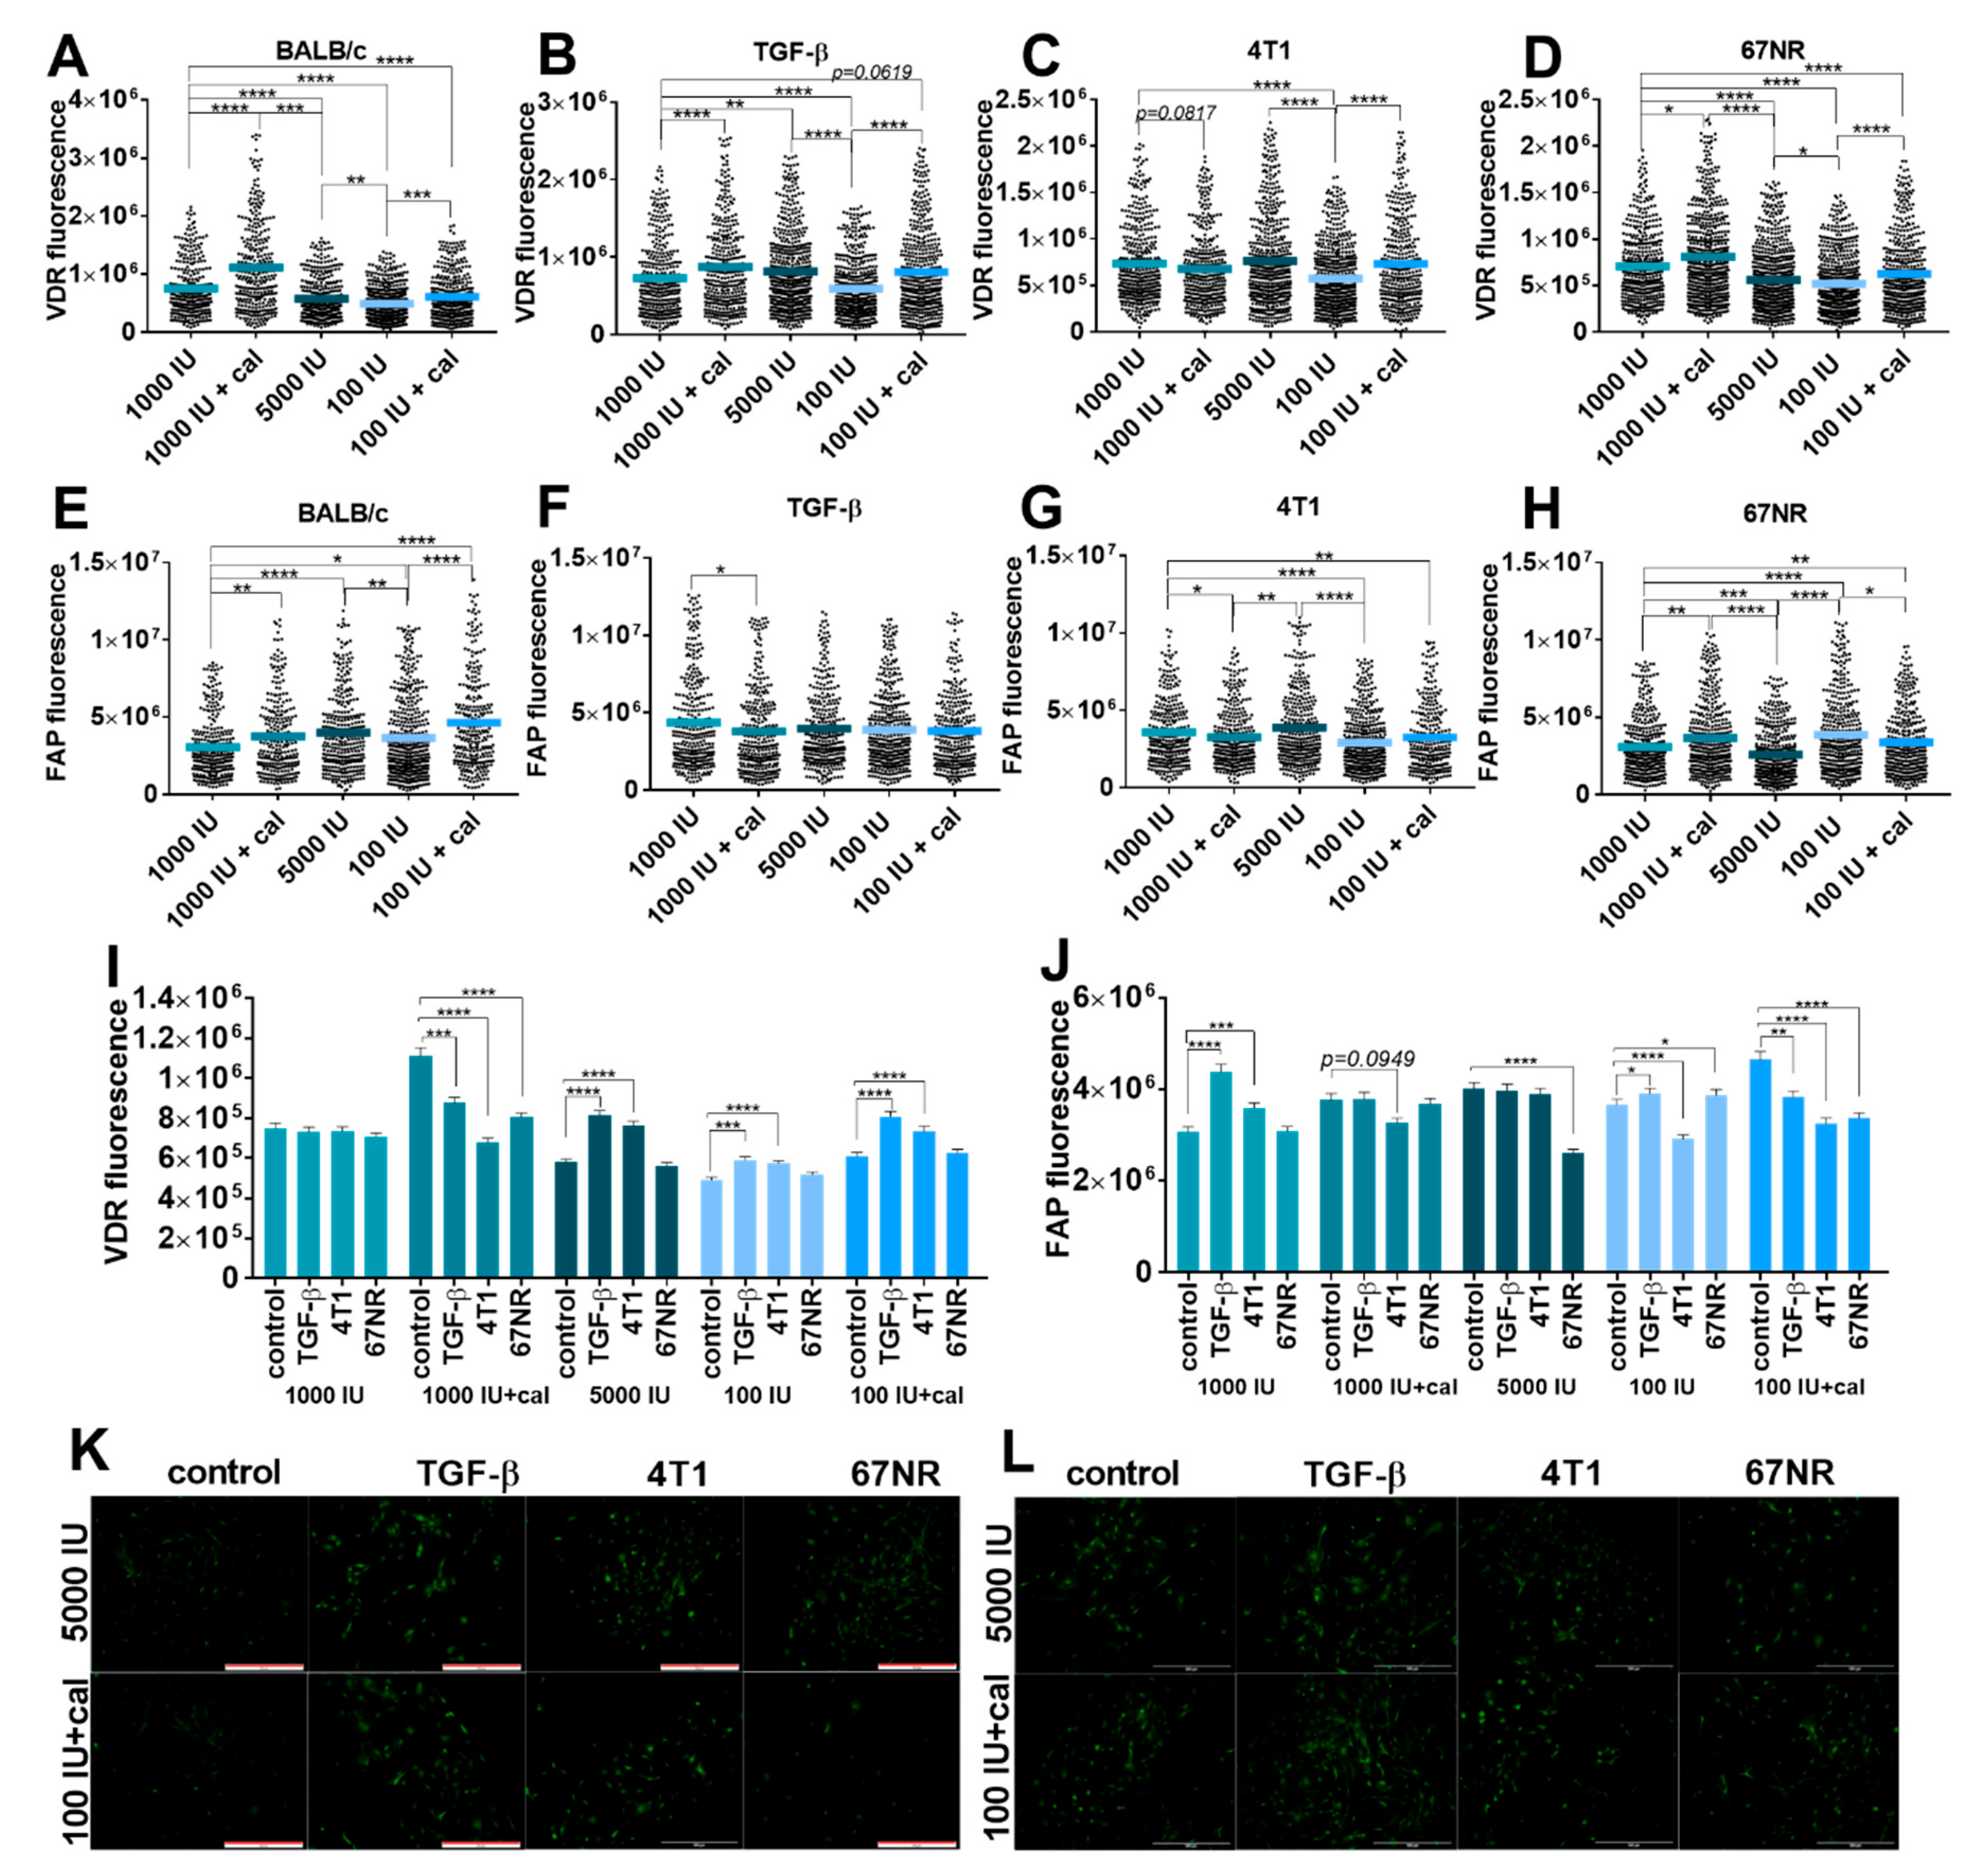
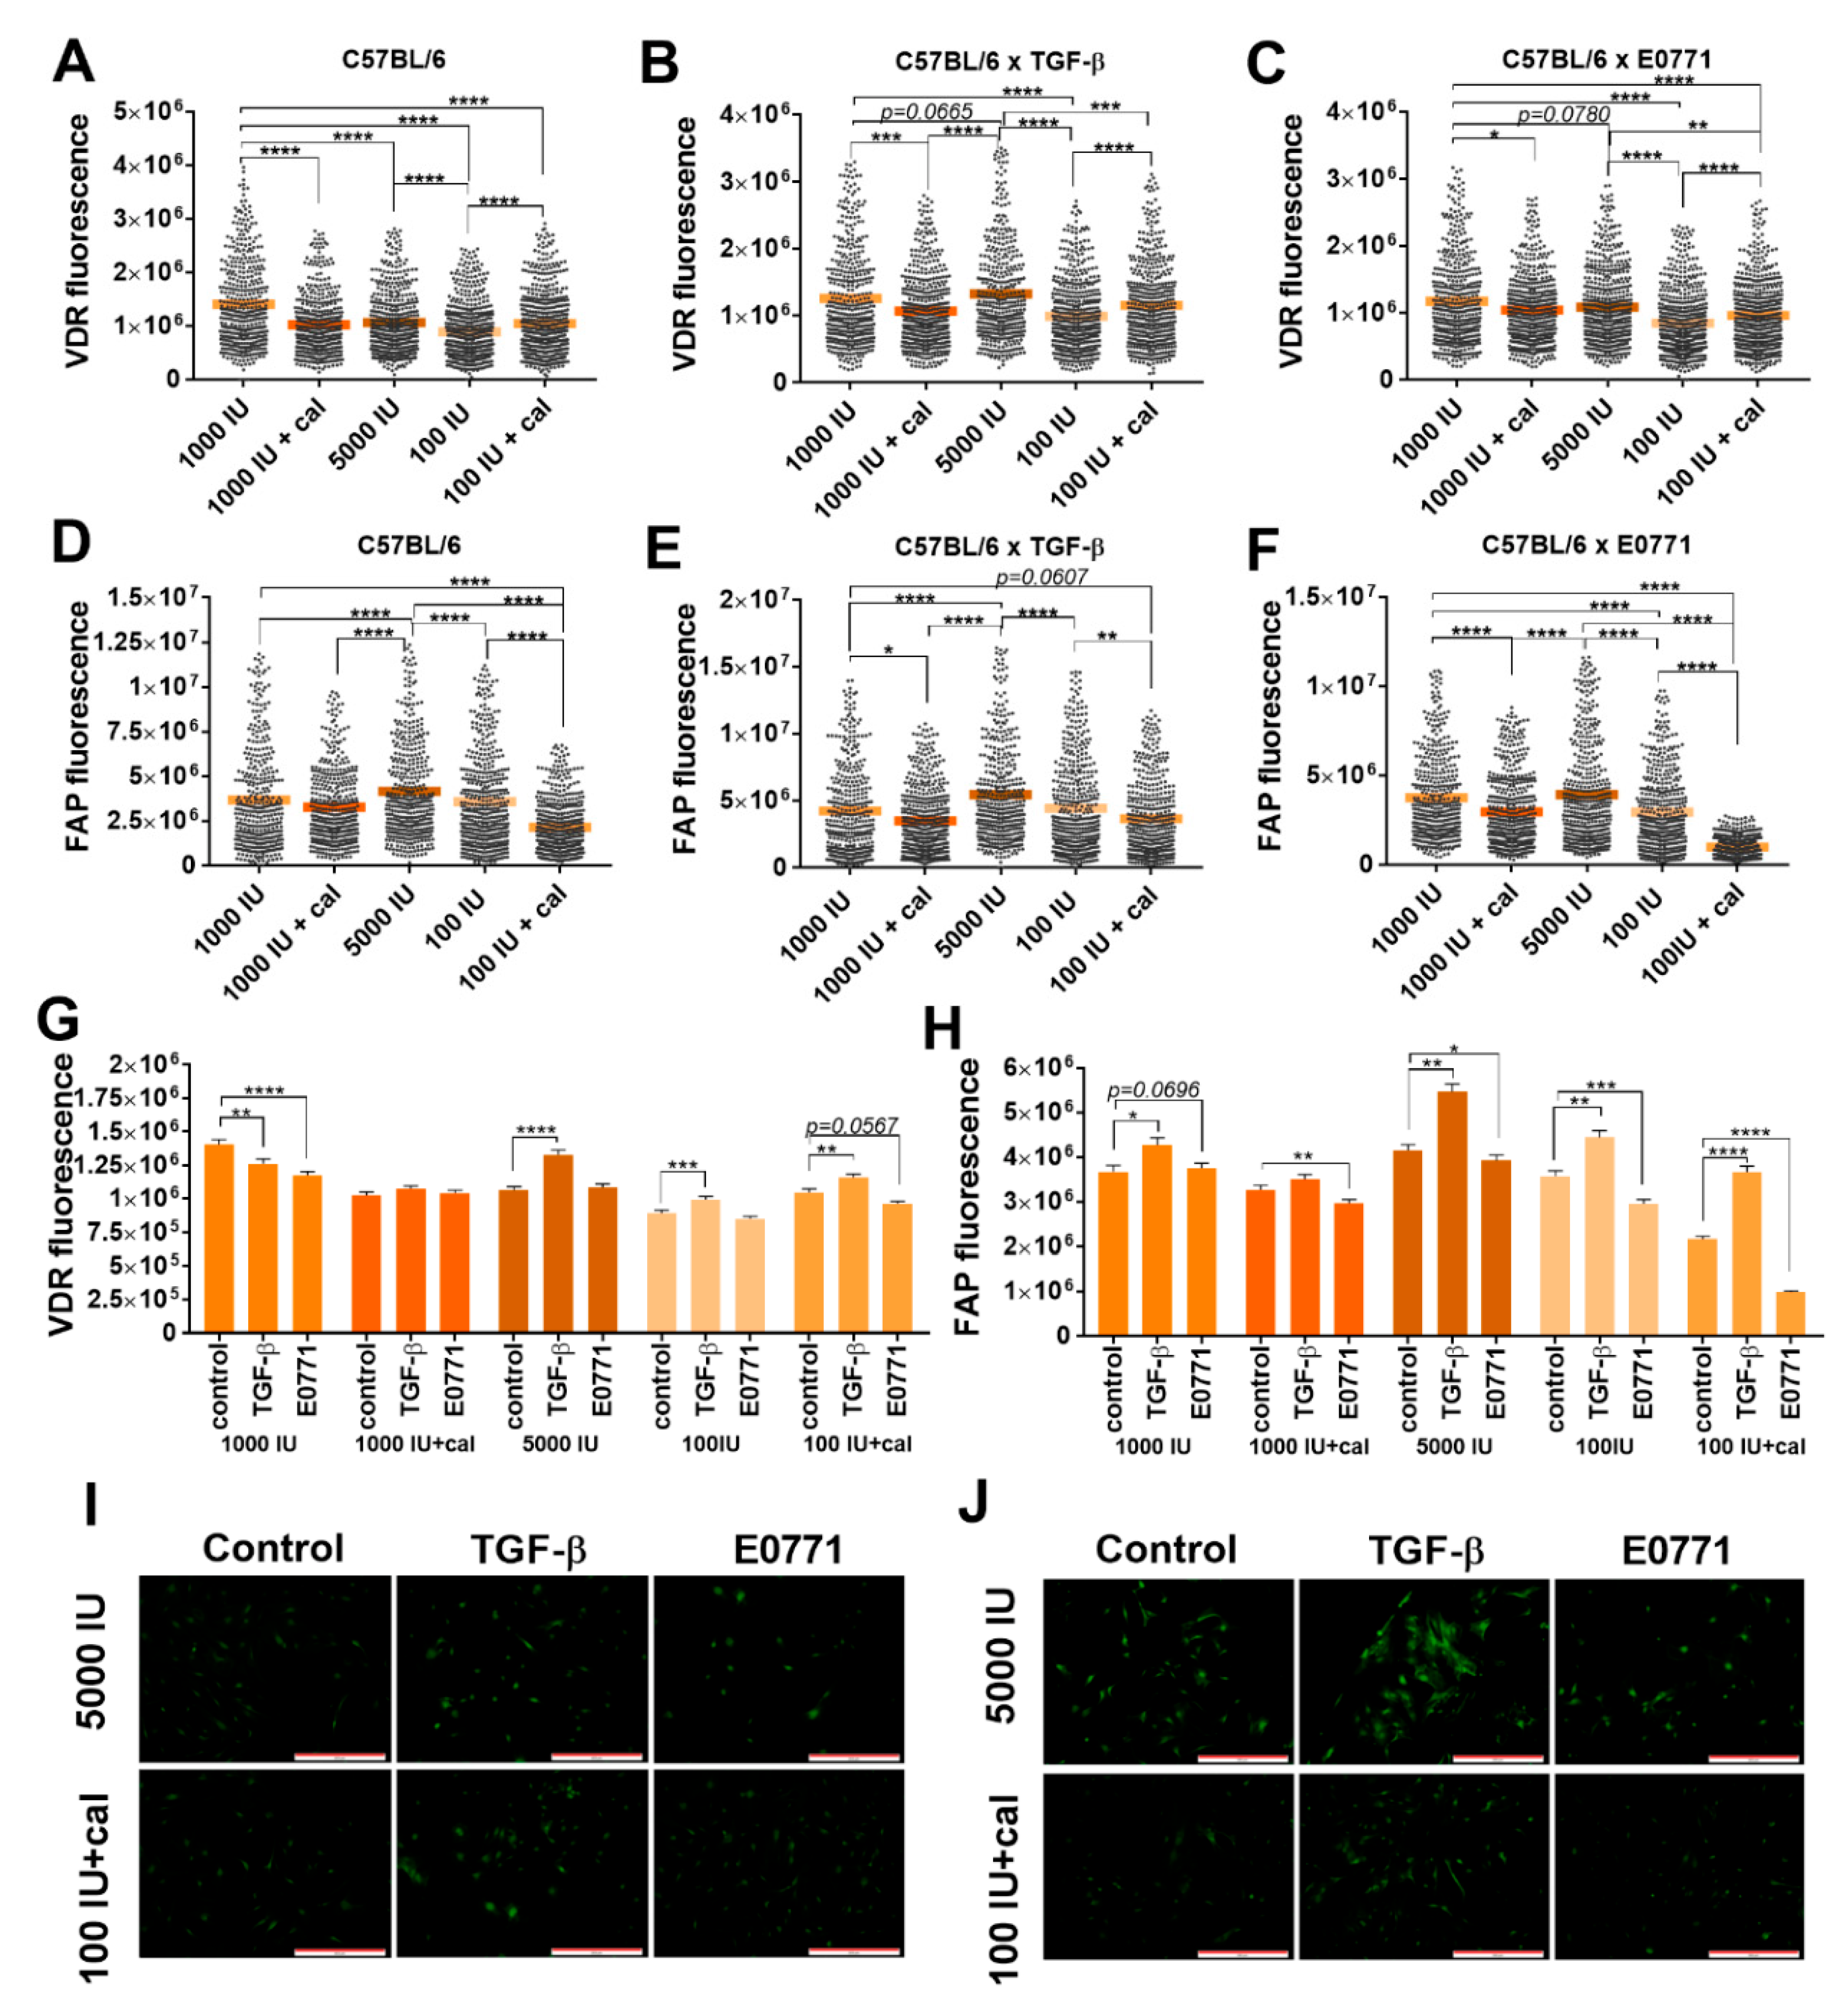
3.5. Effect of TGF-β and Cancer Cell CM on Lung Fibroblasts Harvested from Healthy Mice Fed with Different Vitamin D3 Diets
3.5.1. Flow Cytometry Analyses for α-SMA, Podoplanin, PDGFRβ, and TNC Expression
3.5.2. Fluorescence Microscopy Analysis of VDR and FAP Expression in Lung Fibroblasts
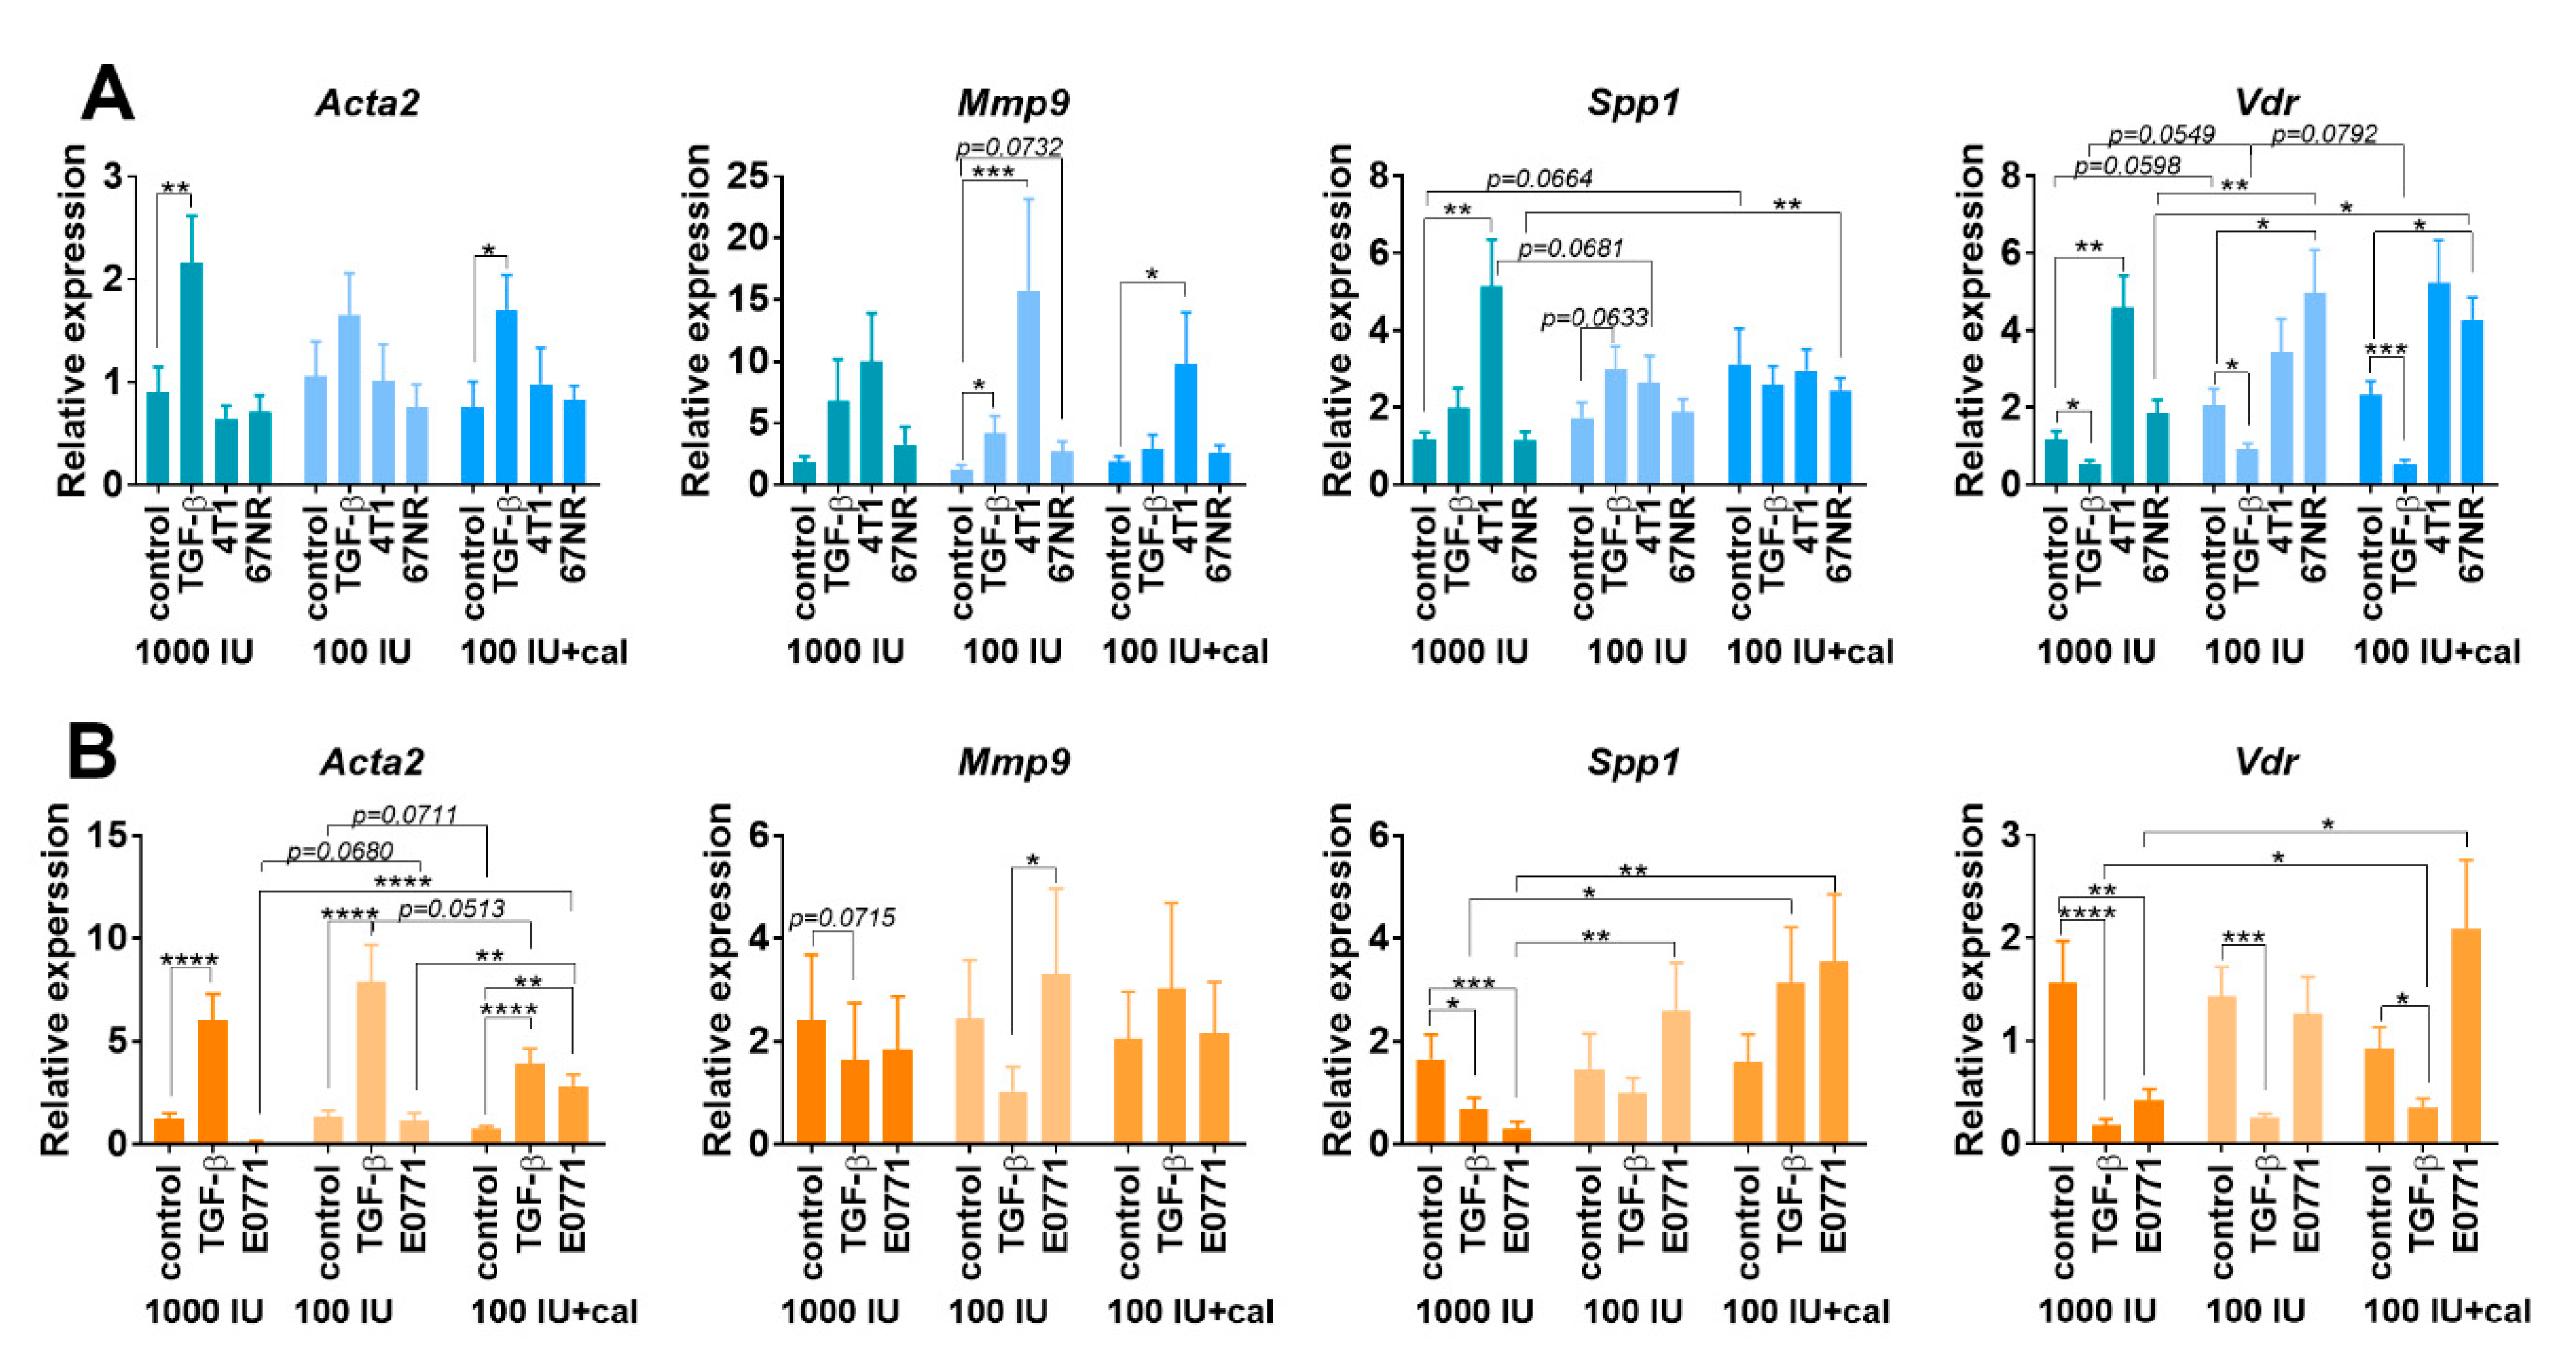
3.5.3. Acta2, Mmp9, Spp1, and Vdr Expression in Cultured NFs Isolated from Lungs of Healthy BALB/c or C57BL/6 Mice Fed with Control and Vitamin-D3-Deficient Diet and/or Treated with Calcitriol
4. Discussion
5. Conclusions
Supplementary Materials
Author Contributions
Funding
Institutional Review Board Statement
Informed Consent Statement
Data Availability Statement
Conflicts of Interest
References
- Wu, X.; Hu, W.; Lu, L.; Zhao, Y.; Zhou, Y.; Xiao, Z.; Zhang, L.; Zhang, H.; Li, X.; Li, W.; et al. Repurposing vitamin D for treatment of human malignancies via targeting tumor microenvironment. Acta Pharm. Sin. B 2019, 9, 203–219. [Google Scholar] [CrossRef] [PubMed]
- Anisiewicz, A.; Pawlik, A.; Filip-Psurska, B.; Turlej, E.; Dzimira, S.; Milczarek, M.; Gdesz, K.; Papiernik, D.; Jarosz, J.; Kłopotowska, D.; et al. Unfavorable effect of calcitriol and its low-calcemic analogs on metastasis of 4T1 mouse mammary gland cancer. Int. J. Oncol. 2017, 52, 103–126. [Google Scholar] [CrossRef]
- Anisiewicz, A.; Kowalski, K.; Banach, J.; Łabędź, N.; Stachowicz-Suhs, M.; Piotrowska, A.; Milczarek, M.; Kłopotowska, D.; Dzięgiel, P.; Wietrzyk, J. Vitamin d metabolite profile in cholecalciferol-or calcitriol-supplemented healthy and mammary gland tumor-bearing mice. Nutrients 2020, 12, 3416. [Google Scholar] [CrossRef] [PubMed]
- Cao, Y.; Du, Y.; Liu, F.; Feng, Y.; Cheng, S.; Guan, S.; Wang, Y.; Li, X.; Li, B.; Jin, F.; et al. Vitamin D aggravates breast cancer by inducing immunosuppression in the tumor bearing mouse. Immunotherapy 2018, 10, 555–566. [Google Scholar] [CrossRef] [PubMed]
- Anisiewicz, A.; Filip-Psurska, B.; Pawlik, A.; Nasulewicz-Goldeman, A.; Piasecki, T.; Kowalski, K.; Maciejewska, M.; Jarosz, J.; Banach, J.; Papiernik, D.; et al. Calcitriol Analogues Decrease Lung Metastasis but Impair Bone Metabolism in Aged Ovariectomized Mice Bearing 4T1 Mammary Gland Tumours. Aging Dis. 2019, 10, 977. [Google Scholar] [CrossRef] [PubMed]
- Zhang, Y.; Guo, Q.; Zhang, Z.; Bai, N.; Liu, Z.; Xiong, M.; Wei, Y.; Xiang, R.; Tan, X. VDR status arbitrates the prometastatic effects of tumor-associated macrophages. Mol. Cancer Res. 2014, 12, 1181–1191. [Google Scholar] [CrossRef]
- Wietrzyk, J.; Nevozhay, D.; Filip, B.; Milczarek, M.; Kutner, A. The antitumor effect of lowered doses of cytostatics combined with new analogs of vitamin D in mice. Anticancer Res. 2007, 27, 3387–3398. [Google Scholar] [PubMed]
- Karkeni, E.; Morin, S.O.; Bou Tayeh, B.; Goubard, A.; Josselin, E.; Castellano, R.; Fauriat, C.; Guittard, G.; Olive, D.; Nunès, J.A. Vitamin D Controls Tumor Growth and CD8+ T Cell Infiltration in Breast Cancer. Front. Immunol. 2019, 10, 1307. [Google Scholar] [CrossRef]
- Filip-Psurska, B.; Zachary, H.; Strzykalska, A.; Wietrzyk, J. Vitamin D, Th17 Lymphocytes, and Breast Cancer. Cancers 2022, 14, 3649. [Google Scholar] [CrossRef]
- Hossain, S.; Beydoun, M.A.; Beydoun, H.A.; Chen, X.; Zonderman, A.B.; Wood, R.J. Vitamin D and breast cancer: A systematic review and meta-analysis of observational studies. Clin. Nutr. ESPEN 2019, 30, 170–184. [Google Scholar] [CrossRef]
- Voutsadakis, I.A. Vitamin D baseline levels at diagnosis of breast cancer: A systematic review and meta-analysis. Hematol. Oncol. Stem Cell Ther. 2021, 14, 16–26. [Google Scholar] [CrossRef]
- Keum, N.; Lee, D.H.; Greenwood, D.C.; Manson, J.E.; Giovannucci, E. Vitamin D supplementation and total cancer incidence and mortality: A meta-analysis of randomized controlled trials. Ann. Oncol. 2019, 30, 733–743. [Google Scholar] [CrossRef]
- O’Connor, E.A.; Evans, C.V.; Ivlev, I.; Rushkin, M.C.; Thomas, R.G.; Martin, A.; Lin, J.S. Vitamin and Mineral Supplements for the Primary Prevention of Cardiovascular Disease and Cancer. JAMA 2022, 327, 2334. [Google Scholar] [CrossRef]
- Kanstrup, C.; Teilum, D.; Rejnmark, L.; Bigaard, J.V.; Eiken, P.; Kroman, N.; Tjønneland, A.; Mejdahl, M.K. 25-Hydroxyvitamin D at time of breast cancer diagnosis and breast cancer survival. Breast Cancer Res. Treat. 2020, 179, 699–708. [Google Scholar] [CrossRef]
- Ganji, V.; Sukik, L.; Hoque, B.; Boutefnouchet, L.; Shi, Z. Association of Serum 25-Hydroxyvitamin D Concentration with Breast Cancer Risk in Postmenopausal Women in the US. J. Pers. Med. 2022, 12, 944. [Google Scholar] [CrossRef]
- De Wever, O.; Demetter, P.; Mareel, M.; Bracke, M. Stromal myofibroblasts are drivers of invasive cancer growth. Int. J. Cancer 2008, 123, 2229–2238. [Google Scholar] [CrossRef]
- Wang, Z.; Yang, Q.; Tan, Y.; Tang, Y.; Ye, J.; Yuan, B.; Yu, W. Cancer-Associated Fibroblasts Suppress Cancer Development: The Other Side of the Coin. Front. Cell Dev. Biol. 2021, 9, 146. [Google Scholar] [CrossRef]
- Sugimoto, H.; Mundel, T.M.; Kieran, M.W.; Kalluri, R. Identification of fibroblast heterogeneity in the tumor microenvironment. Cancer Biol. Ther. 2006, 5, 1640–1646. [Google Scholar] [CrossRef]
- Kobayashi, H.; Enomoto, A.; Woods, S.L.; Burt, A.D.; Takahashi, M.; Worthley, D.L. Cancer-associated fibroblasts in gastrointestinal cancer. Nat. Rev. Gastroenterol. Hepatol. 2019, 16, 282–295. [Google Scholar] [CrossRef]
- Bu, L.; Baba, H.; Yoshida, N.; Miyake, K.; Yasuda, T.; Uchihara, T.; Tan, P.; Ishimoto, T. Biological heterogeneity and versatility of cancer-associated fibroblasts in the tumor microenvironment. Oncogene 2019, 38, 4887–4901. [Google Scholar] [CrossRef]
- Orimo, A.; Gupta, P.B.; Sgroi, D.C.; Arenzana-Seisdedos, F.; Delaunay, T.; Naeem, R.; Carey, V.J.; Richardson, A.L.; Weinberg, R.A. Stromal Fibroblasts Present in Invasive Human Breast Carcinomas Promote Tumor Growth and Angiogenesis through Elevated SDF-1/CXCL12 Secretion. Cell 2005, 121, 335–348. [Google Scholar] [CrossRef] [PubMed]
- Takai, K.; Le, A.; Weaver, V.M.; Werb, Z. Targeting the cancer-associated fibroblasts as a treatment in triple-negative breast cancer. Oncotarget 2016, 7, 82889–82901. [Google Scholar] [CrossRef] [PubMed]
- Simpkins, S.A.; Hanby, A.M.; Holliday, D.L.; Speirs, V. Clinical and functional significance of loss of caveolin-1 expression in breast cancer-associated fibroblasts. J. Pathol. 2012, 227, 490–498. [Google Scholar] [CrossRef] [PubMed]
- Butti, R.; Nimma, R.; Kundu, G.; Bulbule, A.; Kumar, T.V.S.; Gunasekaran, V.P.; Tomar, D.; Kumar, D.; Mane, A.; Gill, S.S.; et al. Tumor-derived osteopontin drives the resident fibroblast to myofibroblast differentiation through Twist1 to promote breast cancer progression. Oncogene 2021, 40, 2002–2017. [Google Scholar] [CrossRef]
- Lau, W.L.; Leaf, E.M.; Hu, M.C.; Takeno, M.M.; Kuro-o, M.; Moe, O.W.; Giachelli, C.M. Vitamin D receptor agonists increase klotho and osteopontin while decreasing aortic calcification in mice with chronic kidney disease fed a high phosphate diet. Kidney Int. 2012, 82, 1261–1270. [Google Scholar] [CrossRef]
- Shen, Q.; Christakos, S. The vitamin D receptor, Runx2, and the notch signaling pathway cooperate in the transcriptional regulation of osteopontin. J. Biol. Chem. 2005, 280, 40589–40598. [Google Scholar] [CrossRef]
- Anisiewicz, A.; Pawlik, A.; Filip-Psurska, B.; Wietrzyk, J. Differential Impact of Calcitriol and Its Analogs on Tumor Stroma in Young and Aged Ovariectomized Mice Bearing 4T1 Mammary Gland Cancer. Int. J. Mol. Sci. 2020, 21, 6359. [Google Scholar] [CrossRef]
- Meredith, A.; Boroomand, S.; Carthy, J.; Luo, Z.; McManus, B. 1,25 dihydroxyvitamin D3 inhibits TGFβ1-mediated primary human cardiac myofibroblast activation. PLoS ONE 2015, 10, e0128655. [Google Scholar] [CrossRef]
- Li, F.; Zhang, A.; Shi, Y.; Ma, Y.; Du, Y. 1a,25-DihydroxyVitamin D3 prevents the differentiation of human lung fibroblasts via microRNA-27b targeting the Vitamin D receptor. Int. J. Mol. Med. 2015, 36, 967–974. [Google Scholar] [CrossRef]
- Seyhan, H.; Stromps, J.-P.; Demir, E.; Fuchs, P.C.; Kopp, J. Vitamin D deficiency may stimulate fibroblasts in Dupuytren’s disease via mitochondrial increased reactive oxygen species through upregulating transforming growth factor-β1. Med. Hypotheses 2018, 116, 40–41. [Google Scholar] [CrossRef]
- Shany, S.; Sigal-Batikoff, I.; LAMPRECHT, S. Vitamin D and Myofibroblasts in Fibrosis and Cancer: At Cross-purposes with TGF-β/SMAD Signaling. Anticancer Res. 2016, 36, 6225–6234. [Google Scholar] [CrossRef]
- Ferrer-Mayorga, G.; Gómez-López, G.; Barbáchano, A.; Fernández-Barral, A.; Peña, C.; Pisano, D.G.; Cantero, R.; Rojo, F.; Muñoz, A.; Larriba, M.J. Vitamin D receptor expression and associated gene signature in tumour stromal fibroblasts predict clinical outcome in colorectal cancer. Gut 2017, 66, 1449–1462. [Google Scholar] [CrossRef]
- Ferrer-Mayorga, G.; Niell, N.; Cantero, R.; González-Sancho, J.M.; del Peso, L.; Muñoz, A.; Larriba, M.J. Vitamin D and Wnt3A have additive and partially overlapping modulatory effects on gene expression and phenotype in human colon fibroblasts. Sci. Rep. 2019, 9, 8085. [Google Scholar] [CrossRef]
- Mukai, Y.; Yamada, D.; Eguchi, H.; Iwagami, Y.; Asaoka, T.; Noda, T.; Kawamoto, K.; Gotoh, K.; Kobayashi, S.; Takeda, Y.; et al. Vitamin D Supplementation is a Promising Therapy for Pancreatic Ductal Adenocarcinoma in Conjunction with Current Chemoradiation Therapy. Ann. Surg. Oncol. 2018, 25, 1868–1879. [Google Scholar] [CrossRef]
- Kong, F.; Li, L.; Wang, G.; Deng, X.; Li, Z.; Kong, X. VDR signaling inhibits cancer-associated-fibroblasts’ release of exosomal miR-10a-5p and limits their supportive effects on pancreatic cancer cells. Gut 2019, 68, 950–951. [Google Scholar] [CrossRef]
- Campos, L.T.; Brentani, H.; Roela, R.A.; Katayama, M.L.H.; Lima, L.; Rolim, C.F.; Milani, C.; Folgueira, M.A.A.K.; Brentani, M.M. Differences in transcriptional effects of 1α,25 dihydroxyvitamin D3 on fibroblasts associated to breast carcinomas and from paired normal breast tissues. J. Steroid Biochem. Mol. Biol. 2013, 133, 12–24. [Google Scholar] [CrossRef]
- Milani, C.; Katayama, M.L.H.; de Lyra, E.C.; Welsh, J.; Campos, L.T.; Brentani, M.M.; do Socorro Maciel, M.; Roela, R.A.; del Valle, P.R.; Góes, J.C.G.S.; et al. Transcriptional effects of 1,25 dihydroxyvitamin D3physiological and supra-physiological concentrations in breast cancer organotypic culture. BMC Cancer 2013, 13, 119. [Google Scholar] [CrossRef]
- Johnstone, C.N.; Smith, Y.E.; Cao, Y.; Burrows, A.D.; Cross, R.S.N.; Ling, X.; Redvers, R.P.; Doherty, J.P.; Eckhardt, B.L.; Natoli, A.L.; et al. Functional and molecular characterisation of EO771.LMB tumours, a new C57BL/6-mouse-derived model of spontaneously metastatic mammary cancer. Dis. Model. Mech. 2015, 8, 237–251. [Google Scholar] [CrossRef]
- Remmele, W.; Stegner, H.E. [Recommendation for uniform definition of an immunoreactive score (IRS) for immunohistochemical estrogen receptor detection (ER-ICA) in breast cancer tissue]. Pathologe 1987, 8, 138–140. [Google Scholar]
- Maj, E.; Papiernik, D.; Wietrzyk, J. Antiangiogenic cancer treatment: The great discovery and greater complexity (Review). Int. J. Oncol. 2016, 49, 1773–1784. [Google Scholar] [CrossRef]
- Mantell, D.J.; Owens, P.E.; Bundred, N.J.; Mawer, E.B.; Canfield, A.E. 1α,25-Dihydroxyvitamin D 3 Inhibits Angiogenesis In Vitro and In Vivo. Circ. Res. 2000, 87, 214–220. [Google Scholar] [CrossRef] [PubMed]
- García-Quiroz, J.; Rivas-Suárez, M.; García-Becerra, R.; Barrera, D.; Martínez-Reza, I.; Ordaz-Rosado, D.; Santos-Martinez, N.; Villanueva, O.; Santos-Cuevas, C.L.; Avila, E.; et al. Calcitriol reduces thrombospondin-1 and increases vascular endothelial growth factor in breast cancer cells: Implications for tumor angiogenesis. J. Steroid Biochem. Mol. Biol. 2014, 144, 215–222. [Google Scholar] [CrossRef] [PubMed]
- Raja, R.; Kale, S.; Thorat, D.; Soundararajan, G.; Lohite, K.; Mane, A.; Karnik, S.; Kundu, G.C. Hypoxia-driven osteopontin contributes to breast tumor growth through modulation of HIF1α-mediated VEGF-dependent angiogenesis. Oncogene 2014, 33, 2053–2064. [Google Scholar] [CrossRef] [PubMed]
- Stamatovic, S.M.; Keep, R.F.; Mostarica-Stojkovic, M.; Andjelkovic, A.V. CCL2 Regulates Angiogenesis via Activation of Ets-1 Transcription Factor. J. Immunol. 2006, 177, 2651–2661. [Google Scholar] [CrossRef]
- Ridiandries, A.; Tan, J.T.M.; Bursill, C.A. The Role of CC-Chemokines in the Regulation of Angiogenesis. Int. J. Mol. Sci. 2016, 17, 1856. [Google Scholar] [CrossRef] [PubMed]
- Liu, T.; Han, C.; Wang, S.; Fang, P.; Ma, Z.; Xu, L.; Yin, R. Cancer-associated fibroblasts: An emerging target of anti-cancer immunotherapy. J. Hematol. Oncol. 2019, 12, 86. [Google Scholar] [CrossRef]
- Nurmik, M.; Ullmann, P.; Rodriguez, F.; Haan, S.; Letellier, E. In search of definitions: Cancer-associated fibroblasts and their markers. Int. J. Cancer 2020, 146, 895–905. [Google Scholar] [CrossRef]
- Kojima, Y.; Acar, A.; Eaton, E.N.; Mellody, K.T.; Scheel, C.; Ben-Porath, I.; Onder, T.T.; Wang, Z.C.; Richardson, A.L.; Weinberg, R.A.; et al. Autocrine TGF-β and stromal cell-derived factor-1 (SDF-1) signaling drives the evolution of tumor-promoting mammary stromal myofibroblasts. Proc. Natl. Acad. Sci. USA 2010, 107, 20009–20014. [Google Scholar] [CrossRef]
- Liu, X.; Das, A.M.; Seideman, J.; Griswold, D.; Afuh, C.N.; Kobayashi, T.; Abe, S.; Fang, Q.; Hashimoto, M.; Kim, H.; et al. The CC chemokine ligand 2 (CCL2) mediates fibroblast survival through IL-6. Am. J. Respir. Cell Mol. Biol. 2007, 37, 121–128. [Google Scholar] [CrossRef]
- Raskov, H.; Orhan, A.; Gaggar, S.; Gögenur, I. Cancer-Associated Fibroblasts and Tumor-Associated Macrophages in Cancer and Cancer Immunotherapy. Front. Oncol. 2021, 11, 668731. [Google Scholar] [CrossRef]
- Chen, S.; Morine, Y.; Tokuda, K.; Yamada, S.; Saito, Y.; Nishi, M.; Ikemoto, T.; Shimada, M. Cancer-associated fibroblast-induced M2-polarized macrophages promote hepatocellular carcinoma progression via the plasminogen activator inhibitor-1 pathway. Int. J. Oncol. 2021, 59, 59. [Google Scholar] [CrossRef]
- Suzuki, J.; Aokage, K.; Neri, S.; Sakai, T.; Hashimoto, H.; Su, Y.; Yamazaki, S.; Nakamura, H.; Tane, K.; Miyoshi, T.; et al. Relationship between podoplanin-expressing cancer-associated fibroblasts and the immune microenvironment of early lung squamous cell carcinoma. Lung Cancer 2021, 153, 1–10. [Google Scholar] [CrossRef]
- Talts, J.F.; Wirl, G.; Dictor, M.; Muller, W.J.; Fässler, R. Tenascin-C modulates tumor stroma and monocyte/macrophage recruitment but not tumor growth or metastasis in a mouse strain with spontaneous mammary cancer. J. Cell Sci. 1999, 112 Pt 12, 1855–1864. [Google Scholar] [CrossRef]
- Pawlik, A.; Anisiewicz, A.; Filip-Psurska, B.; Nowak, M.; Turlej, E.; Trynda, J.; Banach, J.; Gretkierewicz, P.; Wietrzyk, J. Calcitriol and Its Analogs Establish the Immunosuppressive Microenvironment That Drives Metastasis in 4T1 Mouse Mammary Gland Cancer. Int. J. Mol. Sci. 2018, 19, 2116. [Google Scholar] [CrossRef]
- Anisiewicz, A.; Łabędź, N.; Krauze, I.; Wietrzyk, J. Calcitriol in the presence of conditioned media from metastatic breast cancer cells enhances ex vivo polarization of m2 alternative murine bone marrowderived macrophages. Cancers 2020, 12, 3485. [Google Scholar] [CrossRef]
- Gunaydin, G. CAFs Interacting With TAMs in Tumor Microenvironment to Enhance Tumorigenesis and Immune Evasion. Front. Oncol. 2021, 11, 2669. [Google Scholar] [CrossRef]
- Timms, P.M.; Mannan, N.; Hitman, G.A.; Noonan, K.; Mills, P.G.; Syndercombe-Court, D.; Aganna, E.; Price, C.P.; Boucher, B.J. Circulating MMP9, vitamin D and variation in the TIMP-1 response with VDR genotype: Mechanisms for inflammatory damage in chronic disorders? QJM An Int. J. Med. 2002, 95, 787–796. [Google Scholar] [CrossRef]
- Noda, M.; Vogel, R.L.; Craig, A.M.; Prahl, J.; DeLuca, H.F.; Denhardt, D.T. Identification of a DNA sequence responsible for binding of the 1,25-dihydroxyvitamin D3 receptor and 1,25-dihydroxyvitamin D3 enhancement of mouse secreted phosphoprotein 1 (SPP-1 or osteopontin) gene expression. Proc. Natl. Acad. Sci. USA 1990, 87, 9995–9999. [Google Scholar] [CrossRef]


| A | B | ||
|---|---|---|---|
| Points | Description | Points | Description |
| 0 | No cells with a positive reaction | 0 | No staining |
| 1 | Up to 10% cells with a positive reaction | 1 | Low intensity of staining |
| 2 | 11–50% cells with a positive reaction | 2 | Moderate intensity of staining |
| 3 | 51–80% cells with a positive reaction | 3 | Intense staining |
| 4 | >80% cells with a positive reaction | --- | |
| Marker | 1000 IU | 1000 IU+cal | 5000 IU | 100 IU | 100 IU+cal | |
|---|---|---|---|---|---|---|
| 4T1 | α-SMA | 36.3 ± 36.1 | 220 ± 56.3 ab | 9.9 ± 3.3 | 23.3 ± 220 | 218 ± 72.6 abc |
| Podoplanin | 8.9 ± 5.4 | 10.8 ± 4.0 b | 4.6 ± 1.0 | 4.6 ± 1,8 a | 9.5 ± 3.9 bc | |
| PDGFRβ | 3.9 ± 0.6 | 3.6 ± 0.7 b | 2.6 ± 0.2 a | 2.6 ± 0.6 a | 3.0 ± 0.6 | |
| TNC | 5.0 ± 1.7 | 4.8 ± 1.1 b | 2.7 ± 0.6 a | 3.2 ± 1.3 | 5.1 ± 1.4 bc | |
| 67NR | α-SMA | 14.6 ± 10.3 | 13.3 ± 6.5 | 11.2 ± 4.5 | 13.4 ± 5.3 | 16.7 ± 12.2 |
| Podoplanin | 3.3 ± 0.7 | 3.9 ± 0.8 | 3.8 ± 0.7 | 3.7 ± 0.9 | 3.8 ± 1.6 | |
| PDGFRβ | 2.6 ± 0.3 | 2.9 ± 1.0 | 2.2 ± 1.0 | 2.6 ± 0.4 | 2.5 ± 0.4 | |
| TNC | 2.6 ± 0.4 | 2.6 ± 0.5 | 2.7 ± 0.5 | 2.7 ± 0.6 | 2.8 ± 0.6 | |
| E0771 | α-SMA | 67.3 ± 23.9 | 62.9 ± 14.6 | 53.0 ± 19.9 | 53.9 ± 14.4 | 50.9 ± 12.5 |
| Podoplanin | 2.9 ± 0.5 | 2.9 ± 0.5 | 2.5 ± 0.4 | 2.6 ± 0.3 | 2.5 ± 0.3 | |
| PDGFRβ | 1.2 ± 0.1 | 1.2 ± 0.1 | 1.1 ± 0.0 | 1.2 ±0.1 | 1.1 ± 0.1 | |
| TNC | 1.2 ± 0.2 | 1.2 ± 0.2 | 1.1 ± 0.1 | 1.2 ± 0.1 | 1.3 ± 1.1 |
| Marker | 1000 IU | 1000 IU+cal | 5000 IU | 100 IU | 100 IU+cal | |
|---|---|---|---|---|---|---|
| 4T1 | α-SMA | 1.4 ± 0.5 | 0.9 ± 0.2 | 1.4 ± 1.2 | 1.7 ± 0.7 | 1.0 ± 0.4 |
| Podoplanin | 0.5 ± 0.2 | 0.4 ± 0.1 | 0.4 ± 0.1 | 0.4 ± 0.1 | 0.4 ± 0.1 | |
| PDGFRβ | 13.4 ± 10.9 | 15.7 ± 7.7 | 15.8 ± 6.0 | 15.5 ± 6.0 | 15.1 ±7.5 | |
| TNC | 2.5 ± 1.5 | 1.4 ± 0.6 | 1.5 ± 1.0 | 1.7 ± 0.6 | 1.7 ± 0.7 | |
| 67NR | α-SMA | 34.9 ± 10.8 | 37.5 ± 6.8 | 27.9 ± 5.8 | 35.8 ± 4.7 | 30.6 ± 4.6 |
| Podoplanin | 24.1 ± 6.2 | 27.9 ± 7.4 | 19.3 ± 7.6 | 27.0 ± 10.3 | 17.7 ± 5.6 | |
| PDGFRβ | 0.5 ± 0.1 | 0.5 ± 0.1 | 0.5 ± 0.2 | 0.5 ± 0.1 | 0.5 ± 0.0 | |
| TNC | 1.8 ± 0.3 | 1.7 ± 0.2 | 1.8 ± 0.5 | 1.9 ± 0.4 | 1.9 ± 0.4 | |
| E0771 | α-SMA | 27.6 ± 0.9 | 17.4 ± 12.3 a | 18.8 ± 1.6 | 21.6 ± 7.6 | 22.9 ± 3.4 |
| Podoplanin | 0.5 ± 0.3 | 1.5 ± 1.1 | 1.6 ± 0.8 a | 0.9 ± 0.8 | 0.8 ± 0.3 | |
| PDGFRβ | 0.8 ± 0.1 | 0.9 ± 0.1 | 0.9 ± 0.0 a | 0.8 ± 0.9 | 0.8 ± 0.1 | |
| TNC | 1.9 ± 0.3 | 1.5 ± 1.4 a | 1.6 ± 0.1 a | 1.4 ± 0.2 | 1.7 ± 0.4 a |
| Parameter Measured | 1000 IU | 1000 IU+cal | 5000 IU | 100 IU | 100 IU+cal | |
|---|---|---|---|---|---|---|
| 4T1 | PE [a.u.] | 29.8 ± 11.9 | 20.0 ± 17.5 | 47.0 ± 36.3 b | 35.2 ± 18.9 | 14.1 ± 6.3 c |
| RT [s] | 26.5 ± 15.5 | 15.7 ± 79 | 19.5 ± 14.0 | 34.5 ± 13.8 | 13.1 ± 9.5 d | |
| WiR [a.u.] | 9.6 ± 5.7 | 1.6 ± 1.6 a | 13.9 ± 11 b | 3.3 ± 2.2 c | 2.2 ± 1.5 c | |
| WiAUC [a.u.] | 602 ± 279 | 100 ± 71.1 a | 225 ± 98.3 a | 815 ± 48.7 c | 161 ± 83.2 ad | |
| WiPI [a.u.] | 22.5 ± 8.8 | 8.7 ± 6.7 a | 28.0 ± 13.8 | 24.6 ± 16.2 | 10.6 ± 5.0 cd | |
| rBV [a.u.] | 6.7 ± 3.2 | 19.7 ± 9.6 a | 16.3 ± 7.9 | 21.3 ± 16.8 a | 7.8 ± 6.0 d | |
| rBF [a.u.] | 1.9 ± 0.5 | 1.3 ± 1.4 | 2.6 ± 1.9 | 1.0 ± 0.8 c | 0.6 ± 0.4 c | |
| MTT [s] | 4.7 ± 1.4 | 45.7 ± 43.4 a | 5.7 ± 5.0 | 11.4 ± 8.9 | 14.8 ± 14.6 | |
| E0771 | PE [a.u.] | 29.2 ± 13.0 | 30.0 ± 12.3 | 38.2 ± 24.4 | 64.2 ± 35.4 a | 24.9 ± 16.1 d |
| RT [s] | 18.9 ± 9.1 | 12.3 ± 3.3 | 10.2 ± 0.9 a | 11.0 ± 5.0 | 3.8 ± 2.0 ab | |
| WiR [a.u.] | 4.8 ± 2.2 | 5.4 ± 1.9 | 5.9 ± 1.2 | 9.1 ± 5.0 | 13.2 ± 7.5 abc | |
| WiAUC [a.u.] | 317 ± 295 | 314 ± 199 | 300 ± 238 | 868 ± 469 ac | 158 ± 140 d | |
| WiPI [a.u.] | 23.3 ± 12.0 | 23.4 ± 10.7 | 28.3 ± 20.0 | 55.1 ± 17.7 ac | 18.1 ± 11.1 d | |
| rBV [a.u.] | 8.9 ± 5.6 | 7.9 ± 1.9 | 12.3 ± 5.1 | 17.4 ± 4.2 a | 3.4 ± 3.8 d | |
| rBF [a.u.] | 1.6 ± 1.2 | 1.8 ± 0.7 | 0.7 ± 1.2 | 1.7 ± 1.2 | 0.8 ± 0.7 | |
| MTT [s] | 4.2 ± 0.8 | 4.8 ± 2.1 | 29.4 ± 19.1 ab | 15.1 ± 13.0 | 3.9 ± 2.3 c |
| Cytokine | 1000 IU | 1000 IU+cal | 5000 IU | 100 IU | 100 IU+cal | ||
|---|---|---|---|---|---|---|---|
| BALB/c | 4T1 | OPN | 608 ± 360 | 875 ± 602 | 688 ± 366 | 478 ± 256 b | 676 ± 427 |
| TGF-β | 167 ± 120 | 14.7 ± 12.8 a | 8.2 ± 8.9 a | 52.2 ± 113 a | 101 ± 179 | ||
| CCL2 | 137 ± 36.8 | 166 ± 46.2 | 153 ± 86.6 | 165 ± 40.1 | 107 ± 14.1 bd | ||
| FGF23 | 101 ± 38.5 | 125 ± 34.7 | 130 ± 28.0 | 133 ± 18.6 | 157 ± 30.9 a | ||
| 67NR | OPN | 79.0 ± 36.8 | 79.8 ± 12.3 | 101 ± 31.2 | 74.0 ± 12.9 | 58.2 ± 15.7 c | |
| TGF-β | 118 ± 179 | 269 ± 214 | 259 ± 190 a | 16.3 ± 18.9 c | 32.0 ± 61.2 c | ||
| CCL2 | 238 ± 103 | 282 ± 135 | 202 ± 85.5 | 251 ± 142 | 293 ± 87.5 | ||
| FGF23 | 37.3 ± 13.9 | 41.7 ± 13.0 | 52.3 ± 10.8 a | 57.0 ± 5.3 ab | 41.9 ± 9.4 d | ||
| Healthy mice | OPN | 18.0 ± 4.6 | 15.4 ± 1.1 | 19.4 ± 10.2 | 21.0 ± 4.5 | 26.8 ± 6.9 ab | |
| TGF-β | 138 ± 255 | 188 ± 222 | 212 ± 216 | 2253 ± 3307 | 1259 ± 2072 | ||
| CCL2 | 95.8 ± 20.2 | 171 ± 38.6 a | 101 ± 23.0 b | 130 ± 50.0 | 252 ± 151 acd | ||
| C57Bl/6 | E0771 | OPN | 83.2 ± 61.0 | 74.0 ± 39.1 | 45.8 ± 11.7 | 50. 6 ± 19.2 | 76.9 ± 37.6 |
| TGF-β | 190 ± 292 | 1310 ± 2948 | 799 ± 1784 | 1353 ± 2011 | 1671 ± 2119 | ||
| CCL2 | 1513 ± 1021 | 1207 ± 870 | 941 ± 356 | 734 ± 515 | 680 ± 222 | ||
| FGF23 | 535 ± 90.5 | 649 ± 210 | 503 ± 70.7 | 495 ± 197 | 351 ± 35.7 abd | ||
| Healthy mice | OPN | 26.6 ± 9.4 | 23.1 ± 3.7 | 28.7 ± 5.8 | 25.5 ± 6.5 | 33.6 ±12.9 b | |
| TGF-β | 70.4 ± 0.0 | 1188 ± 2515 | 1001 ± 2278 | 1142 ± 2584 | 1031 ± 1855 | ||
| CCL2 | 512 ± 152 | 446 ± 186 | 353 ± 109 | 266 ± 94.7 a | 291 ± 91.1 |
| Marker | Group | Treatment | |||
|---|---|---|---|---|---|
| Control | TGFβ | 4T1 CM | 67NR CM | ||
| α-SMA | 1000 IU | 74.7 ± 8.9 | 52.6 ± 14.8 a | 66.8 ± 10.5 | 70.0 ± 15.5 |
| 1000 IU+cal | 60.4 ±12.6 | 46.9 ± 11.2 | 62.7 ± 9.6 | 68.0 ± 19.2 | |
| 5000IU | 57.1 ± 8.5 x | 46.6 ± 14.5 | 67.1 ± 7.9 | 60.6 ± 13.1 | |
| 100 IU | 56.9 ± 14.0 x | 47.8 ± 9.0 | 59.5 ± 7.6 | 66.6 ± 13.5 | |
| 100 IU+cal | 55.5 ± 15.4 x | 45.9 ± 12.5 | 57.0 ± 16.9 | 55.8 ± 15.9 | |
| Podoplanin | 1000 IU | 583 ± 135 | 399 ± 76.9 a | 662 ± 119 | 595 ± 177 |
| 1000 IU+cal | 564 ± 152 | 370 ± 29.4 a | 696 ± 145 | 540 ± 114 | |
| 5000IU | 535 ± 95.0 | 349 ± 113 a | 670 ± 123 a | 620 ± 121 | |
| 100 IU | 564 ± 77.8 | 356 ± 97.0 a | 708 ± 135 a | 601 ± 114 | |
| 100 IU+cal | 584 ± 125 | 333 ± 49.5 a | 741 ± 171 | 615 ± 171 | |
| PDGFRβ | 1000 IU | 4.5 ± 0.4 | 3.6 ± 0.4 a | 3.7 ± 0.9 a | 4.3 ± 0.5 |
| 1000 IU+cal | 4.2 ± 1.1 | 3.4 ± 0.5 | 3.6 ± 0.8 | 4. 2 ± 0.8 | |
| 5000IU | 3.9 ± 0.7 | 3.5 ± 0.6 | 3.7 ± 0.7 | 4.0 ± 0.7 | |
| 100 IU | 3.8 ± 0.9 | 3.1 ± 0.4 | 3.4 ± 0.7 | 3.8 ± 0.8 | |
| 100 IU+cal | 3.3 ± 1.0 | 3.1 ± 0.5 | 3.4 ± 1.3 | 4.2 ± 1.3 | |
| TNC | 1000 IU | 3.4 ± 0.4 | 2.8 ± 0.3 a | 2.9 ± 0.5 a | 3.1 ± 0.4 |
| 1000 IU+cal | 3.1 ± 0.6 | 2.7 ± 0.4 | 3.0 ±0.5 | 3.0 ± 0.5 | |
| 5000IU | 3.0 ± 0.6 | 2.7 ± 0.5 | 3.1 ± 0.5 | 3.0 ± 0.5 | |
| 100 IU | 3.0 ± 0.5 | 2.5 ± 0.3 | 2.9 ± 0.5 | 2.9 ± 0.5 | |
| 100 IU+cal | 3.0 ± 0.6 | 2.5 ± 0.4 | 2.9 ± 0.7 | 3.2 ± 0.8 | |
Publisher’s Note: MDPI stays neutral with regard to jurisdictional claims in published maps and institutional affiliations. |
© 2022 by the authors. Licensee MDPI, Basel, Switzerland. This article is an open access article distributed under the terms and conditions of the Creative Commons Attribution (CC BY) license (https://creativecommons.org/licenses/by/4.0/).
Share and Cite
Łabędź, N.; Stachowicz-Suhs, M.; Psurski, M.; Anisiewicz, A.; Banach, J.; Piotrowska, A.; Dzięgiel, P.; Maciejczyk, A.; Matkowski, R.; Wietrzyk, J. Modulation of Fibroblast Activity via Vitamin D3 Is Dependent on Tumor Type—Studies on Mouse Mammary Gland Cancer. Cancers 2022, 14, 4585. https://doi.org/10.3390/cancers14194585
Łabędź N, Stachowicz-Suhs M, Psurski M, Anisiewicz A, Banach J, Piotrowska A, Dzięgiel P, Maciejczyk A, Matkowski R, Wietrzyk J. Modulation of Fibroblast Activity via Vitamin D3 Is Dependent on Tumor Type—Studies on Mouse Mammary Gland Cancer. Cancers. 2022; 14(19):4585. https://doi.org/10.3390/cancers14194585
Chicago/Turabian StyleŁabędź, Natalia, Martyna Stachowicz-Suhs, Mateusz Psurski, Artur Anisiewicz, Joanna Banach, Aleksandra Piotrowska, Piotr Dzięgiel, Adam Maciejczyk, Rafał Matkowski, and Joanna Wietrzyk. 2022. "Modulation of Fibroblast Activity via Vitamin D3 Is Dependent on Tumor Type—Studies on Mouse Mammary Gland Cancer" Cancers 14, no. 19: 4585. https://doi.org/10.3390/cancers14194585
APA StyleŁabędź, N., Stachowicz-Suhs, M., Psurski, M., Anisiewicz, A., Banach, J., Piotrowska, A., Dzięgiel, P., Maciejczyk, A., Matkowski, R., & Wietrzyk, J. (2022). Modulation of Fibroblast Activity via Vitamin D3 Is Dependent on Tumor Type—Studies on Mouse Mammary Gland Cancer. Cancers, 14(19), 4585. https://doi.org/10.3390/cancers14194585