

Intelligent Identification of Early Esophageal Cancer by Band-Selective Hyperspectral Imaging


 ,
,  , ,
, , 
Abstract
:Simple Summary
Abstract
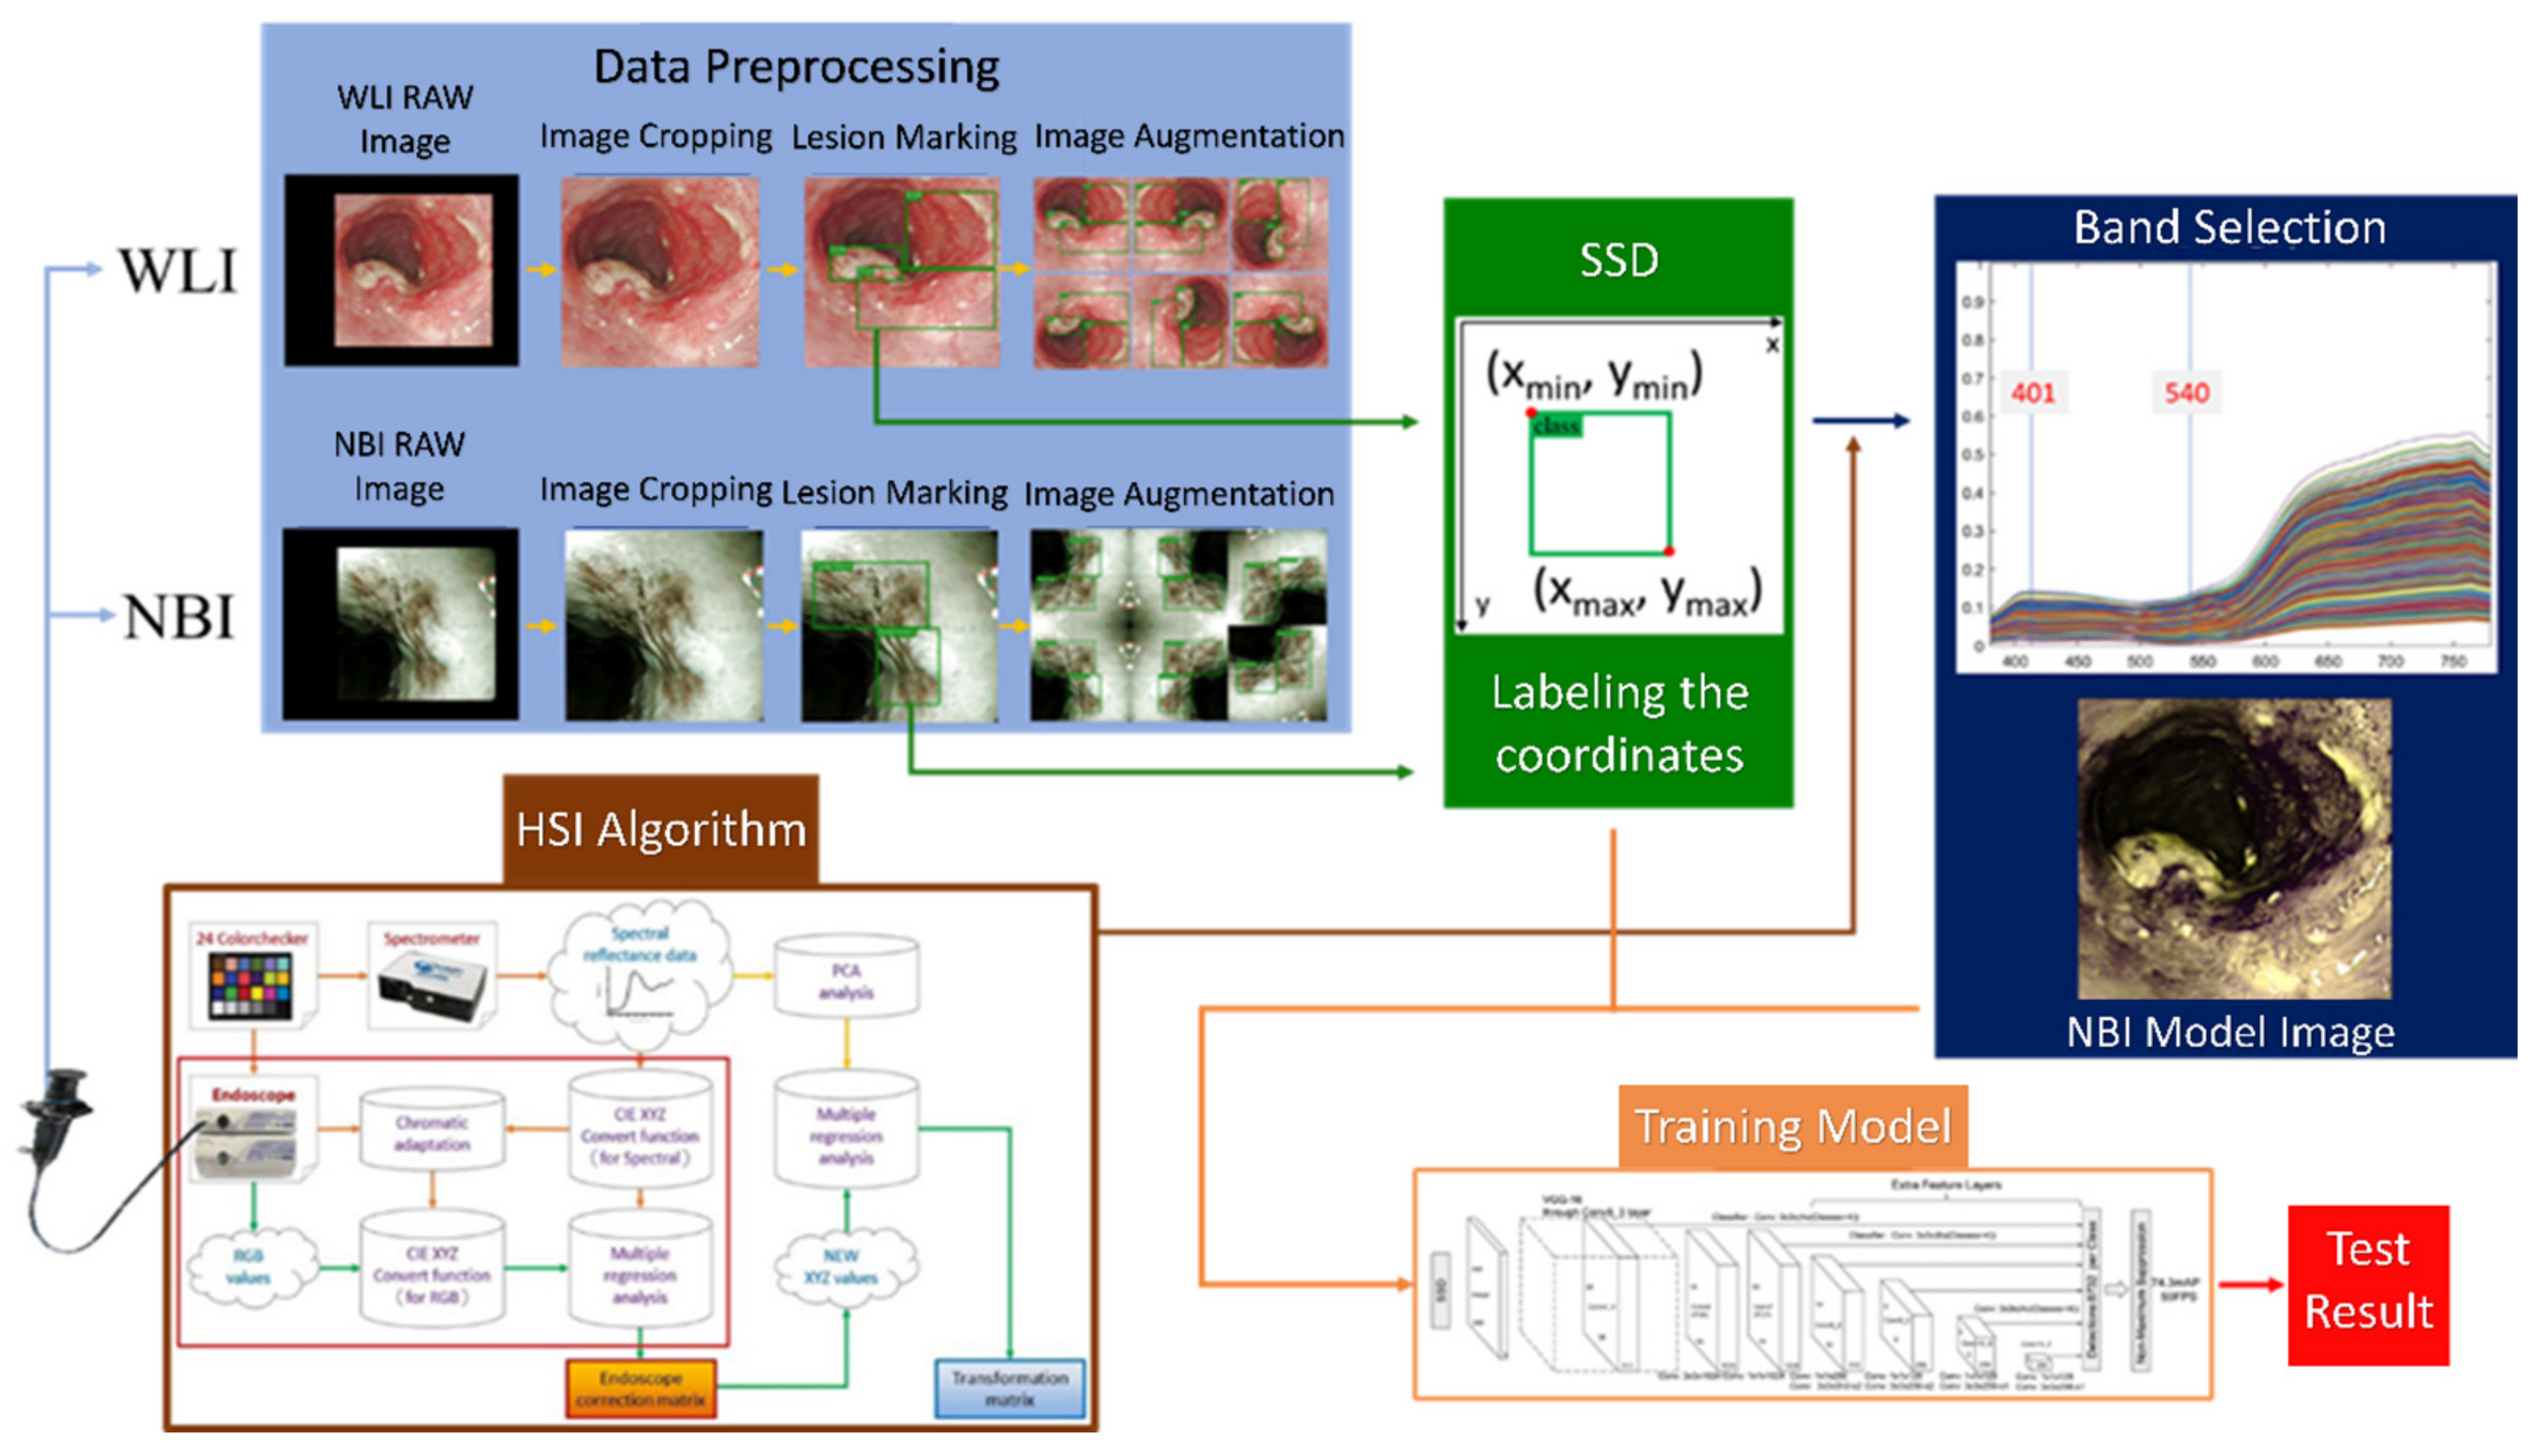
1. Introduction
2. Materials and Methods
3. Results
4. Discussion
5. Conclusions
Supplementary Materials
Author Contributions
Funding
Institutional Review Board Statement
Informed Consent Statement
Data Availability Statement
Conflicts of Interest
References
- Allen, L.N.; Wigley, S.; Holmer, H. Implementation of non-communicable disease policies from 2015 to 2020: A geopolitical analysis of 194 countries. Lancet Glob. Health 2021, 9, e1528–e1538. [Google Scholar] [CrossRef]
- Kassa, M.; Grace, J. The global burden and perspectives on non-communicable diseases (NCDs) and the prevention, data availability and systems approach of NCDs in low-resource countries. In Public Health in Developing Countries-Challenges and Opportunities; IntechOpen: London, UK, 2019. [Google Scholar]
- Lunde, P.; Nilsson, B.B.; Bergland, A.; Kværner, K.J.; Bye, A. The effectiveness of smartphone apps for lifestyle improvement in noncommunicable diseases: Systematic review and meta-analyses. J. Med. Internet Res. 2018, 20, e9751. [Google Scholar] [CrossRef] [PubMed]
- Sung, H.; Ferlay, J.; Siegel, R.L.; Laversanne, M.; Soerjomataram, I.; Jemal, A.; Bray, F. Global cancer statistics 2020: GLOBOCAN estimates of incidence and mortality worldwide for 36 cancers in 185 countries. CA Cancer J. Clin. 2021, 71, 209–249. [Google Scholar] [CrossRef]
- Ferlay, J.; Colombet, M.; Soerjomataram, I.; Parkin, D.M.; Piñeros, M.; Znaor, A.; Bray, F. Cancer statistics for the year 2020: An overview. Int. J. Cancer 2021, 149, 778–789. [Google Scholar] [CrossRef] [PubMed]
- Miller, K.D.; Nogueira, L.; Mariotto, A.B.; Rowland, J.H.; Yabroff, K.R.; Alfano, C.M.; Jemal, A.; Kramer, J.L.; Siegel, R.L. Cancer treatment and survivorship statistics, 2019. CA Cancer J. Clin. 2019, 69, 363–385. [Google Scholar] [CrossRef]
- Chen, R.; Zheng, R.; Zhang, S.; Zeng, H.; Wang, S.; Sun, K.; Gu, X.; Wei, W.; He, J. Analysis of incidence and mortality of esophageal cancer in China, 2015. Chin. J. Prev. Med. 2019, 53, 1094–1097. [Google Scholar]
- Fan, J.; Liu, Z.; Mao, X.; Tong, X.; Zhang, T.; Suo, C.; Chen, X. Global trends in the incidence and mortality of esophageal cancer from 1990 to 2017. Cancer Med. 2020, 9, 6875–6887. [Google Scholar] [CrossRef]
- sadat Yousefi, M.; Sharifi-Esfahani, M.; Pourgholam-Amiji, N.; Afshar, M.; Sadeghi-Gandomani, H.; Otroshi, O.; Salehiniya, H. Esophageal cancer in the world: Incidence, mortality and risk factors. Biomed. Res. Ther. 2018, 5, 2504–2517. [Google Scholar] [CrossRef]
- D’souza, S.; Addepalli, V. Preventive measures in oral cancer: An overview. Biomed. Pharmacother. 2018, 107, 72–80. [Google Scholar] [CrossRef]
- Pickens, A. Racial Disparities in Esophageal Cancer. Thorac. Surg. Clin. 2022, 32, 57–65. [Google Scholar] [CrossRef]
- Wu, S.-G.; Zhang, W.-W.; Sun, J.-Y.; Li, F.-Y.; Lin, Q.; He, Z.-Y. Patterns of distant metastasis between histological types in esophageal cancer. Front. Oncol. 2018, 8, 302. [Google Scholar] [CrossRef] [PubMed]
- Abnet, C.C.; Arnold, M.; Wei, W.-Q. Epidemiology of esophageal squamous cell carcinoma. Gastroenterology 2018, 154, 360–373. [Google Scholar] [CrossRef] [PubMed]
- Coleman, H.G.; Xie, S.-H.; Lagergren, J. The epidemiology of esophageal adenocarcinoma. Gastroenterology 2018, 154, 390–405. [Google Scholar] [CrossRef] [PubMed]
- Hazama, H.; Tanaka, M.; Kakushima, N.; Yabuuchi, Y.; Yoshida, M.; Kawata, N.; Takizawa, K.; Ito, S.; Imai, K.; Hotta, K. Predictors of technical difficulty during endoscopic submucosal dissection of superficial esophageal cancer. Surg. Endosc. 2019, 33, 2909–2915. [Google Scholar] [CrossRef] [PubMed]
- Mönig, S.; Chevallay, M.; Niclauss, N.; Zilli, T.; Fang, W.; Bansal, A.; Hoeppner, J. Early esophageal cancer: The significance of surgery, endoscopy, and chemoradiation. Ann. N. Y. Acad. Sci. 2018, 1434, 115–123. [Google Scholar] [CrossRef]
- Huang, F.-L.; Yu, S.-J. Esophageal cancer: Risk factors, genetic association, and treatment. Asian J. Surg. 2018, 41, 210–215. [Google Scholar] [CrossRef]
- Then, E.O.; Lopez, M.; Saleem, S.; Gayam, V.; Sunkara, T.; Culliford, A.; Gaduputi, V. Esophageal cancer: An updated surveillance epidemiology and end results database analysis. World J. Oncol. 2020, 11, 55. [Google Scholar] [CrossRef]
- He, H.; Chen, N.; Hou, Y.; Wang, Z.; Zhang, Y.; Zhang, G.; Fu, J. Trends in the incidence and survival of patients with esophageal cancer: A SEER database analysis. Thorac. Cancer 2020, 11, 1121–1128. [Google Scholar] [CrossRef]
- Mukundan, A.; Tsao, Y.-M.; Artemkina, S.B.; Fedorov, V.E.; Wang, H.-C. Growth Mechanism of Periodic-Structured MoS2 by Transmission Electron Microscopy. Nanomaterials 2022, 12, 135. [Google Scholar] [CrossRef]
- Mukundan, A.; Feng, S.-W.; Weng, Y.-H.; Tsao, Y.-M.; Artemkina, S.B.; Fedorov, V.E.; Lin, Y.-S.; Huang, Y.-C.; Wang, H.-C. Optical and Material Characteristics of MoS2/Cu2O Sensor for Detection of Lung Cancer Cell Types in Hydroplegia. Int. J. Mol. Sci. 2022, 23, 4745. [Google Scholar] [CrossRef]
- Tseng, K.-W.; Hsiao, Y.-P.; Jen, C.-P.; Chang, T.-S.; Wang, H.-C. Cu2O/PEDOT:PSS/ZnO Nanocomposite Material Biosensor for Esophageal Cancer Detection. Sensors 2020, 20, 2455. [Google Scholar] [CrossRef]
- Wu, I.C.; Weng, Y.-H.; Lu, M.-Y.; Jen, C.-P.; Fedorov, V.E.; Chen, W.C.; Wu, M.T.; Kuo, C.-T.; Wang, H.-C. Nano-structure ZnO/Cu2O photoelectrochemical and self-powered biosensor for esophageal cancer cell detection. Opt. Express 2017, 25, 7689–7706. [Google Scholar] [CrossRef]
- Fang, Y.-J.; Mukundan, A.; Tsao, Y.-M.; Huang, C.-W.; Wang, H.-C. Identification of Early Esophageal Cancer by Semantic Segmentation. J. Pers. Med. 2022, 12, 1204. [Google Scholar] [CrossRef] [PubMed]
- Huang, L.-M.; Yang, W.-J.; Huang, Z.-Y.; Tang, C.-W.; Li, J. Artificial intelligence technique in detection of early esophageal cancer. World J. Gastroenterol. 2020, 26, 5959. [Google Scholar] [CrossRef]
- Zhang, Y.-H.; Guo, L.-J.; Yuan, X.-L.; Hu, B. Artificial intelligence-assisted esophageal cancer management: Now and future. World J. Gastroenterol. 2020, 26, 5256. [Google Scholar] [CrossRef] [PubMed]
- Rahaman, M.M.; Li, C.; Yao, Y.; Kulwa, F.; Wu, X.; Li, X.; Wang, Q. DeepCervix: A deep learning-based framework for the classification of cervical cells using hybrid deep feature fusion techniques. Comput. Biol. Med. 2021, 136, 104649. [Google Scholar] [CrossRef] [PubMed]
- Li, X.; Chen, L.; Luan, S.; Zhou, J.; Xiao, X.; Yang, Y.; Mao, C.; Fang, P.; Chen, L.; Zeng, X.; et al. The development and progress of nanomedicine for esophageal cancer diagnosis and treatment. Semin. Cancer Biol. 2022, in press. [Google Scholar] [CrossRef]
- Teixeira Farinha, H.; Digklia, A.; Schizas, D.; Demartines, N.; Schäfer, M.; Mantziari, S. Immunotherapy for Esophageal Cancer: State-of-the Art in 2021. Cancers 2022, 14, 554. [Google Scholar] [CrossRef]
- Horie, Y.; Yoshio, T.; Aoyama, K.; Yoshimizu, S.; Horiuchi, Y.; Ishiyama, A.; Hirasawa, T.; Tsuchida, T.; Ozawa, T.; Ishihara, S. Diagnostic outcomes of esophageal cancer by artificial intelligence using convolutional neural networks. Gastrointest. Endosc. 2019, 89, 25–32. [Google Scholar] [CrossRef]
- de Groof, A.J.; Struyvenberg, M.R.; van der Putten, J.; van der Sommen, F.; Fockens, K.N.; Curvers, W.L.; Zinger, S.; Pouw, R.E.; Coron, E.; Baldaque-Silva, F. Deep-learning system detects neoplasia in patients with Barrett’s esophagus with higher accuracy than endoscopists in a multistep training and validation study with benchmarking. Gastroenterology 2020, 158, 915–929.e4. [Google Scholar] [CrossRef]
- Maktabi, M.; Köhler, H.; Ivanova, M.; Jansen-Winkeln, B.; Takoh, J.; Niebisch, S.; Rabe, S.M.; Neumuth, T.; Gockel, I.; Chalopin, C. Tissue classification of oncologic esophageal resectates based on hyperspectral data. Int. J. Comput. Assist. Radiol. Surg. 2019, 14, 1651–1661. [Google Scholar] [CrossRef] [PubMed]
- Lu, B.; Dao, P.D.; Liu, J.; He, Y.; Shang, J. Recent advances of hyperspectral imaging technology and applications in agriculture. Remote Sens. 2020, 12, 2659. [Google Scholar] [CrossRef]
- Mukundan, A.; Patel, A.; Saraswat, K.D.; Tomar, A.; Kuhn, T. Kalam Rover. In Proceedings of the AIAA SCITECH 2022 Forum, San Diego, CA, USA, 3–7 January 2022; p. 1047. [Google Scholar]
- Gross, W.; Queck, F.; Vögtli, M.; Schreiner, S.; Kuester, J.; Böhler, J.; Mispelhorn, J.; Kneubühler, M.; Middelmann, W. A multi-temporal hyperspectral target detection experiment: Evaluation of military setups. In Proceedings of the Target and Background Signatures VII, Online, 13–17 September 2021; pp. 38–48. [Google Scholar]
- Hsiao, Y.-P.; Mukundan, A.; Chen, W.-C.; Wu, M.-T.; Hsieh, S.-C.; Wang, H.-C. Design of a Lab-On-Chip for Cancer Cell Detection through Impedance and Photoelectrochemical Response Analysis. Biosensors 2022, 12, 405. [Google Scholar] [CrossRef] [PubMed]
- Chen, C.-W.; Tseng, Y.-S.; Mukundan, A.; Wang, H.-C. Air Pollution: Sensitive Detection of PM2. 5 and PM10 Concentration Using Hyperspectral Imaging. Appl. Sci. 2021, 11, 4543. [Google Scholar] [CrossRef]
- Mukundan, A.; Huang, C.-C.; Men, T.-C.; Lin, F.-C.; Wang, H.-C. Air Pollution Detection Using a Novel Snap-Shot Hyperspectral Imaging Technique. Sensors 2022, 22, 6231. [Google Scholar] [CrossRef]
- Gerhards, M.; Schlerf, M.; Mallick, K.; Udelhoven, T. Challenges and future perspectives of multi-/Hyperspectral thermal infrared remote sensing for crop water-stress detection: A review. Remote Sens. 2019, 11, 1240. [Google Scholar] [CrossRef]
- Lee, C.-H.; Mukundan, A.; Chang, S.-C.; Wang, Y.-L.; Lu, S.-H.; Huang, Y.-C.; Wang, H.-C. Comparative Analysis of Stress and Deformation between One-Fenced and Three-Fenced Dental Implants Using Finite Element Analysis. J. Clin. Med. 2021, 10, 3986. [Google Scholar] [CrossRef]
- Stuart, M.B.; McGonigle, A.J.; Willmott, J.R. Hyperspectral imaging in environmental monitoring: A review of recent developments and technological advances in compact field deployable systems. Sensors 2019, 19, 3071. [Google Scholar] [CrossRef]
- Mukundan, A.; Wang, H.-C. Simplified Approach to Detect Satellite Maneuvers Using TLE Data and Simplified Perturbation Model Utilizing Orbital Element Variation. Appl. Sci. 2021, 11, 10181. [Google Scholar] [CrossRef]
- Tsai, C.-L.; Mukundan, A.; Chung, C.-S.; Chen, Y.-H.; Wang, Y.-K.; Chen, T.-H.; Tseng, Y.-S.; Huang, C.-W.; Wu, I.-C.; Wang, H.-C. Hyperspectral Imaging Combined with Artificial Intelligence in the Early Detection of Esophageal Cancer. Cancers 2021, 13, 4593. [Google Scholar] [CrossRef]
- Vangi, E.; D’Amico, G.; Francini, S.; Giannetti, F.; Lasserre, B.; Marchetti, M.; Chirici, G. The new hyperspectral satellite PRISMA: Imagery for forest types discrimination. Sensors 2021, 21, 1182. [Google Scholar] [CrossRef] [PubMed]
- Zhang, X.; Han, L.; Dong, Y.; Shi, Y.; Huang, W.; Han, L.; González-Moreno, P.; Ma, H.; Ye, H.; Sobeih, T. A deep learning-based approach for automated yellow rust disease detection from high-resolution hyperspectral UAV images. Remote Sens. 2019, 11, 1554. [Google Scholar] [CrossRef]
- Hennessy, A.; Clarke, K.; Lewis, M. Hyperspectral classification of plants: A review of waveband selection generalisability. Remote Sens. 2020, 12, 113. [Google Scholar] [CrossRef]
- Terentev, A.; Dolzhenko, V.; Fedotov, A.; Eremenko, D. Current State of Hyperspectral Remote Sensing for Early Plant Disease Detection: A Review. Sensors 2022, 22, 757. [Google Scholar] [CrossRef] [PubMed]
- De La Rosa, R.; Tolosana-Delgado, R.; Kirsch, M.; Gloaguen, R. Automated Multi-Scale and Multivariate Geological Logging from Drill-Core Hyperspectral Data. Remote Sens. 2022, 14, 2676. [Google Scholar] [CrossRef]
- Khodadadzadeh, M.; Ding, X.; Chaurasia, P.; Coyle, D. A hybrid capsule network for hyperspectral image classification. IEEE J. Sel. Top. Appl. Earth Obs. Remote Sens. 2021, 14, 11824–11839. [Google Scholar] [CrossRef]
- Transon, J.; d’Andrimont, R.; Maugnard, A.; Defourny, P. Survey of hyperspectral earth observation applications from space in the sentinel-2 context. Remote Sens. 2018, 10, 157. [Google Scholar] [CrossRef]
- Khan, M.J.; Khan, H.S.; Yousaf, A.; Khurshid, K.; Abbas, A. Modern trends in hyperspectral image analysis: A review. IEEE Access 2018, 6, 14118–14129. [Google Scholar] [CrossRef]
- Sun, W.; Du, Q. Hyperspectral band selection: A review. IEEE Geosci. Remote Sens. Mag. 2019, 7, 118–139. [Google Scholar] [CrossRef]
- Gounella, R.H.; Granado, T.C.; da Costa, J.P.C.; Carmo, J.P. Optical filters for narrow band light adaptation on imaging devices. IEEE J. Sel. Top. Quantum Electron. 2020, 27, 7200508. [Google Scholar] [CrossRef]
- Rybicka-Jasinńska, K.; Wdowik, T.; Łuczak, K.; Wierzba, A.J.; Drapała, O.; Gryko, D. Porphyrins as Promising Photocatalysts for Red-Light-Induced Functionalizations of Biomolecules. ACS Org. Inorg. Au 2022. [Google Scholar] [CrossRef]
- Kumar, A.; Zhang, Z.J.; Lyu, H. Object detection in real time based on improved single shot multi-box detector algorithm. EURASIP J. Wirel. Commun. Netw. 2020, 2020, 204. [Google Scholar] [CrossRef]
- Alippi, C.; Disabato, S.; Roveri, M. Moving convolutional neural networks to embedded systems: The alexnet and VGG-16 case. In Proceedings of the 2018 17th ACM/IEEE International Conference on Information Processing in Sensor Networks (IPSN), Porto, Portugal, 11–13 April 2018; pp. 212–223. [Google Scholar]
- Simonyan, K.; Zisserman, A. Very deep convolutional networks for large-scale image recognition. arXiv 2014, arXiv:1409.1556. [Google Scholar]
- Liu, W.; Anguelov, D.; Erhan, D.; Szegedy, C.; Reed, S.; Fu, C.Y.; Berg, A.C. Ssd: Single shot multibox detector. In Proceedings of the European Conference on Computer Vision, Amsterdam, The Netherlands, 11–14 October 2016. [Google Scholar]


| WLI | Accuracy (%) | Precision (%) | Sensitivity (%) | F1 Score (%) | AP (%) | Kappa |
|---|---|---|---|---|---|---|
| Normal | 78.3 (505/645) | 84.5 (224/265) | 69.3 (224/323) | 76.2 | 75.3 | 0.600 |
| Dysplasia | 96.1 (620/645) | 84.9 (62/73) | 81.6 (62/76) | 83.2 | 81.2 | |
| SCC | 91.6 (591/645) | 87.0 (141/162) | 81.0 (141/174)) | 83.9 | 85.0 | |
| Mean | 88.7 | 85.5 | 77.3 | 81.1 | 80.5 | |
| NBI | Accuracy | Precision | Sensitivity | F1 Score | AP | Kappa |
| Normal | 88.0 (534/607) | 87.6 (190/217) | 79.2 (190/240) | 88.0 | 84.5 | 0.653 |
| Dysplasia | 84.8 (515/607) | 84.0 (136/162) | 69.7 (136/195) | 76.2 | 84.2 | |
| SCC | 92.1 (559/607) | 87.4 (97/111) | 80.8 (97/120) | 84.0 | 86.7 | |
| Mean | 88.3 | 86.3 | 76.6 | 81.1 | 85.1 | |
| HSI | Accuracy | Precision | Sensitivity | F1 Score | AP | Kappa |
| Normal | 81.2 (500/616) | 90.9 (230/253) | 71.2 (230/323) | 79.9 | 78.9 | 0.665 |
| Dysplasia | 97.7 (602/616) | 89.7 (70/78) | 92.1 (70/76) | 90.9 | 83.6 | |
| SCC | 93.2 (574/616) | 89.8 (149/166) | 85.6 (149/174) | 87.6 | 88.5 | |
| Mean | 90.7 | 90.1 | 83.0 | 86.1 | 83.7 |
Publisher’s Note: MDPI stays neutral with regard to jurisdictional claims in published maps and institutional affiliations. |
© 2022 by the authors. Licensee MDPI, Basel, Switzerland. This article is an open access article distributed under the terms and conditions of the Creative Commons Attribution (CC BY) license (https://creativecommons.org/licenses/by/4.0/).
Share and Cite
Tsai, T.-J.; Mukundan, A.; Chi, Y.-S.; Tsao, Y.-M.; Wang, Y.-K.; Chen, T.-H.; Wu, I.-C.; Huang, C.-W.; Wang, H.-C. Intelligent Identification of Early Esophageal Cancer by Band-Selective Hyperspectral Imaging. Cancers 2022, 14, 4292. https://doi.org/10.3390/cancers14174292
Tsai T-J, Mukundan A, Chi Y-S, Tsao Y-M, Wang Y-K, Chen T-H, Wu I-C, Huang C-W, Wang H-C. Intelligent Identification of Early Esophageal Cancer by Band-Selective Hyperspectral Imaging. Cancers. 2022; 14(17):4292. https://doi.org/10.3390/cancers14174292
Chicago/Turabian StyleTsai, Tsung-Jung, Arvind Mukundan, Yu-Sheng Chi, Yu-Ming Tsao, Yao-Kuang Wang, Tsung-Hsien Chen, I-Chen Wu, Chien-Wei Huang, and Hsiang-Chen Wang. 2022. "Intelligent Identification of Early Esophageal Cancer by Band-Selective Hyperspectral Imaging" Cancers 14, no. 17: 4292. https://doi.org/10.3390/cancers14174292
APA StyleTsai, T.-J., Mukundan, A., Chi, Y.-S., Tsao, Y.-M., Wang, Y.-K., Chen, T.-H., Wu, I.-C., Huang, C.-W., & Wang, H.-C. (2022). Intelligent Identification of Early Esophageal Cancer by Band-Selective Hyperspectral Imaging. Cancers, 14(17), 4292. https://doi.org/10.3390/cancers14174292