
Integrative Analysis of Angiogenesis-Related Long Non-Coding RNA and Identification of a Six-DEARlncRNA Signature Associated with Prognosis and Therapeutic Response in Esophageal Squamous Cell Carcinoma

 and
and 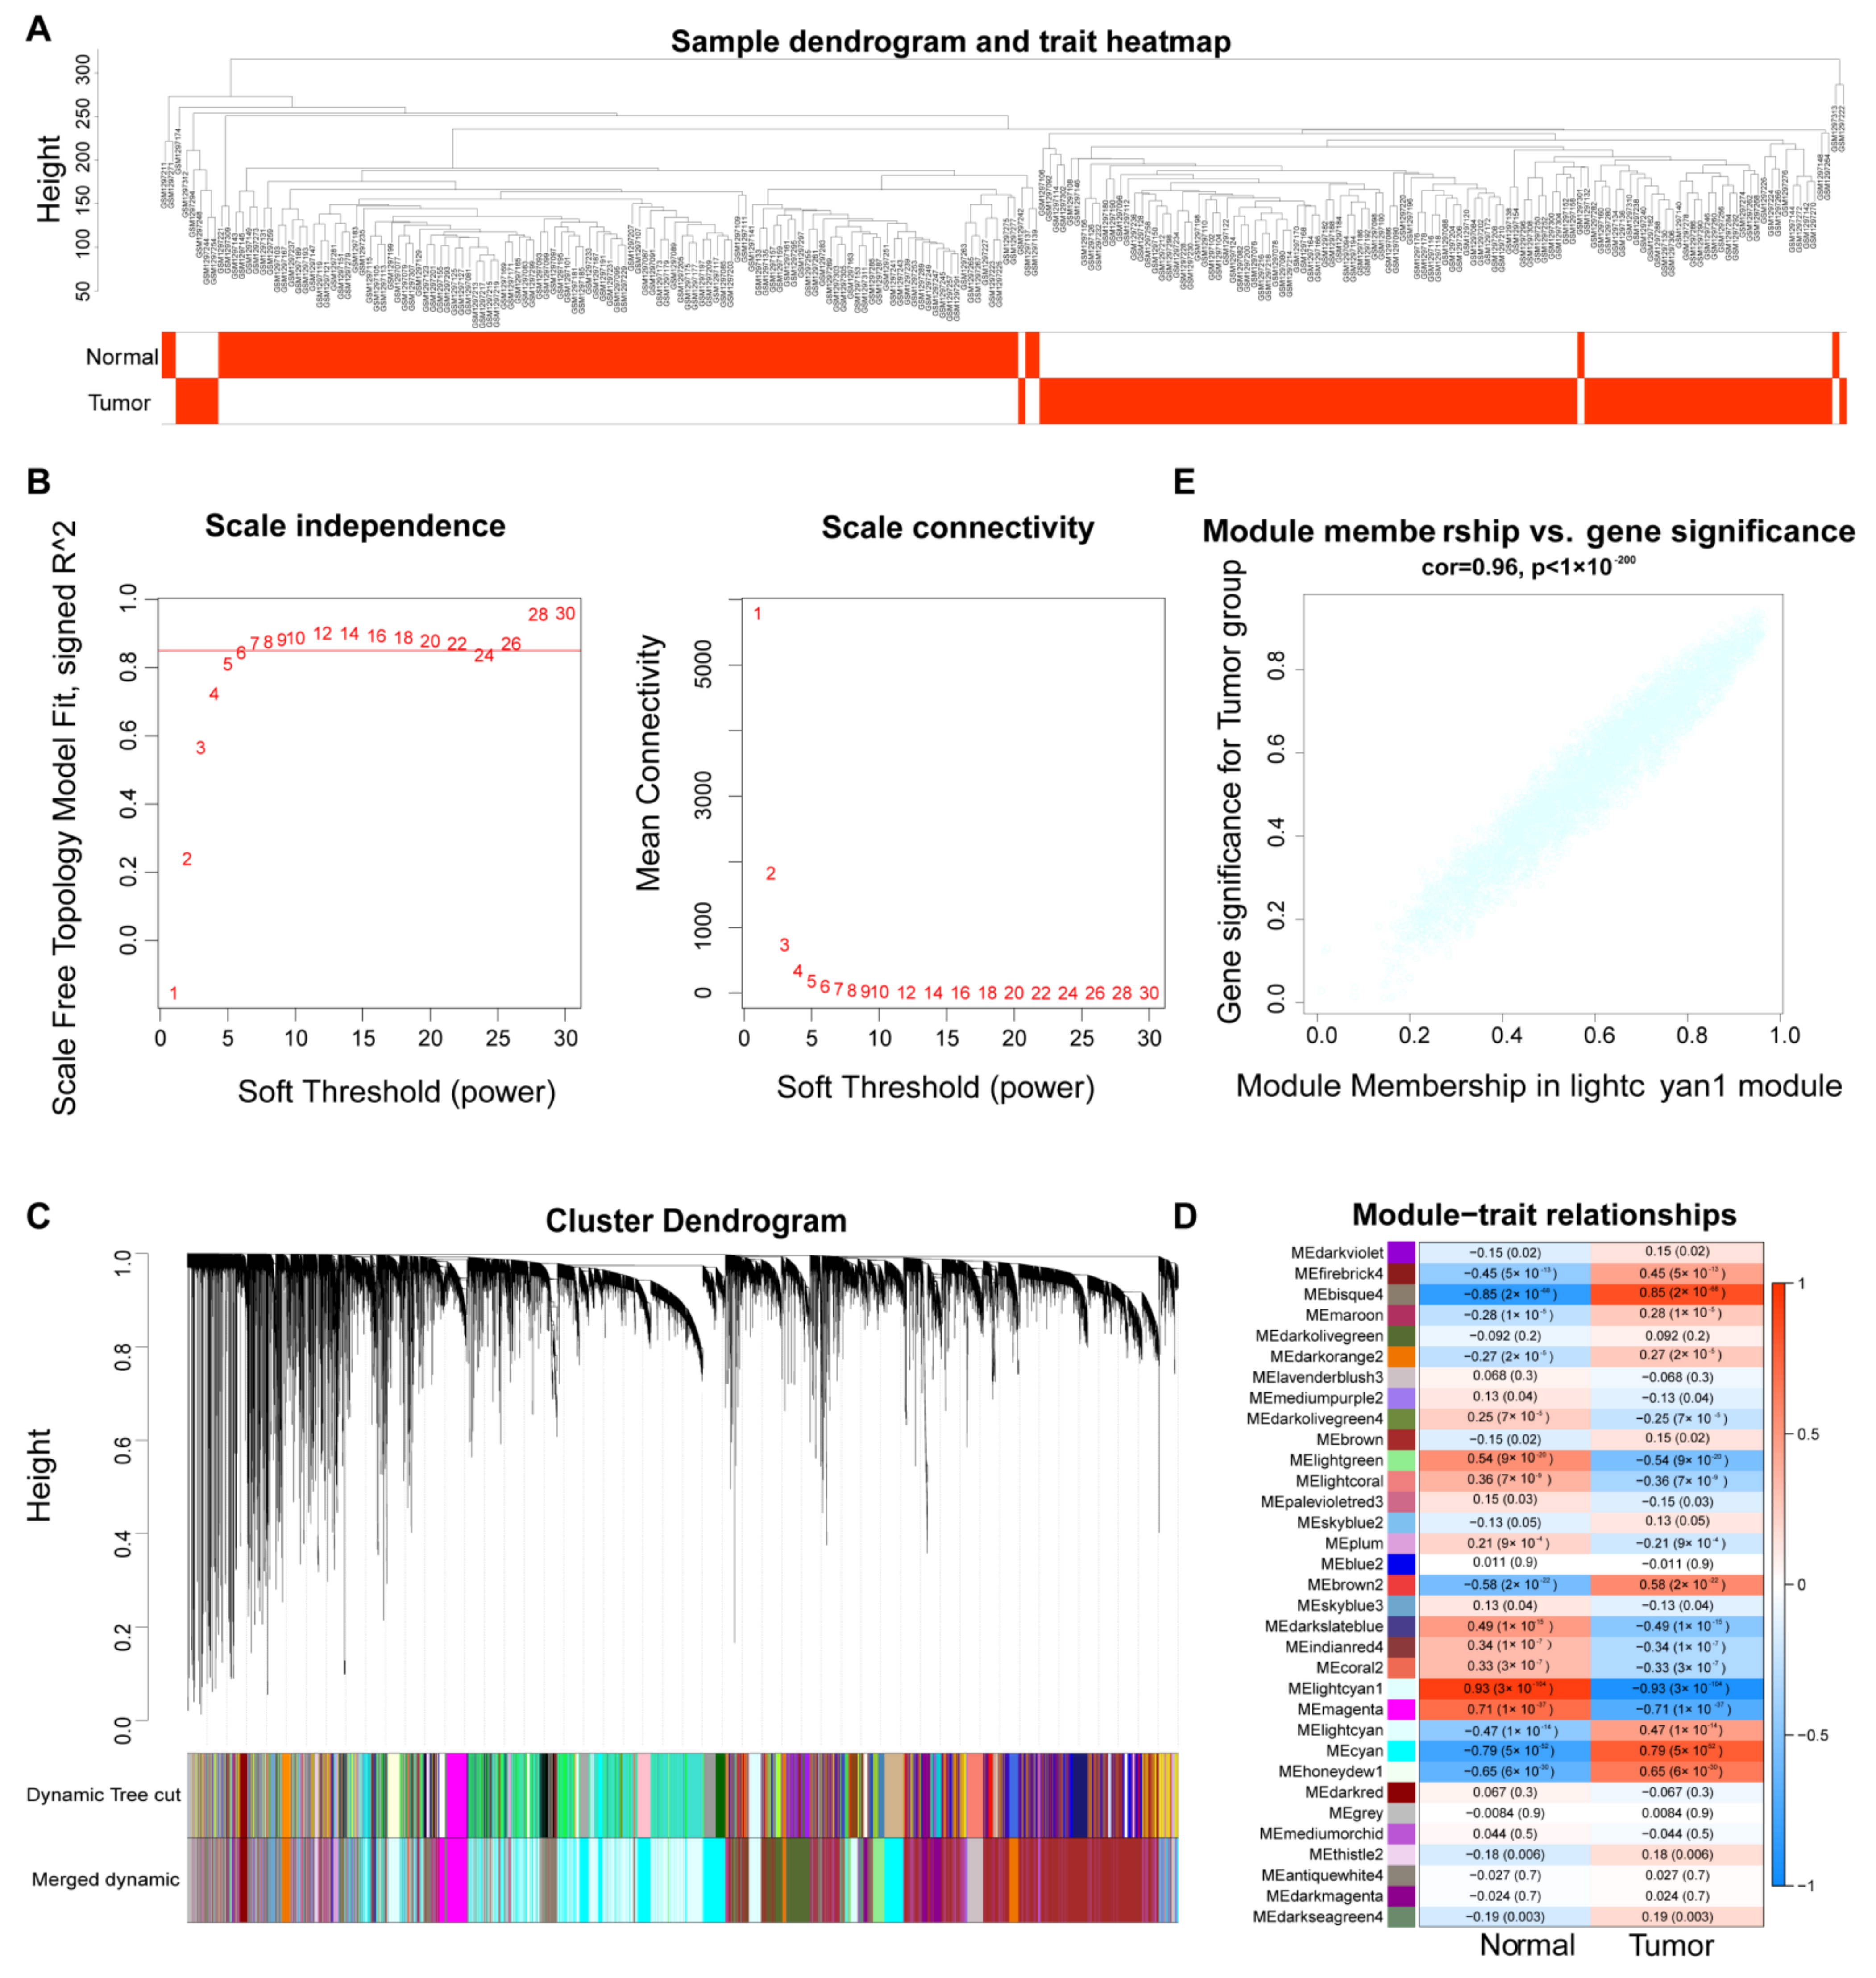
Abstract
:Simple Summary
Abstract
1. Introduction
2. Materials and Methods
2.1. Data Collection
2.2. Identification of ESCC-Related lncRNAs Based on WGCNA Analysis
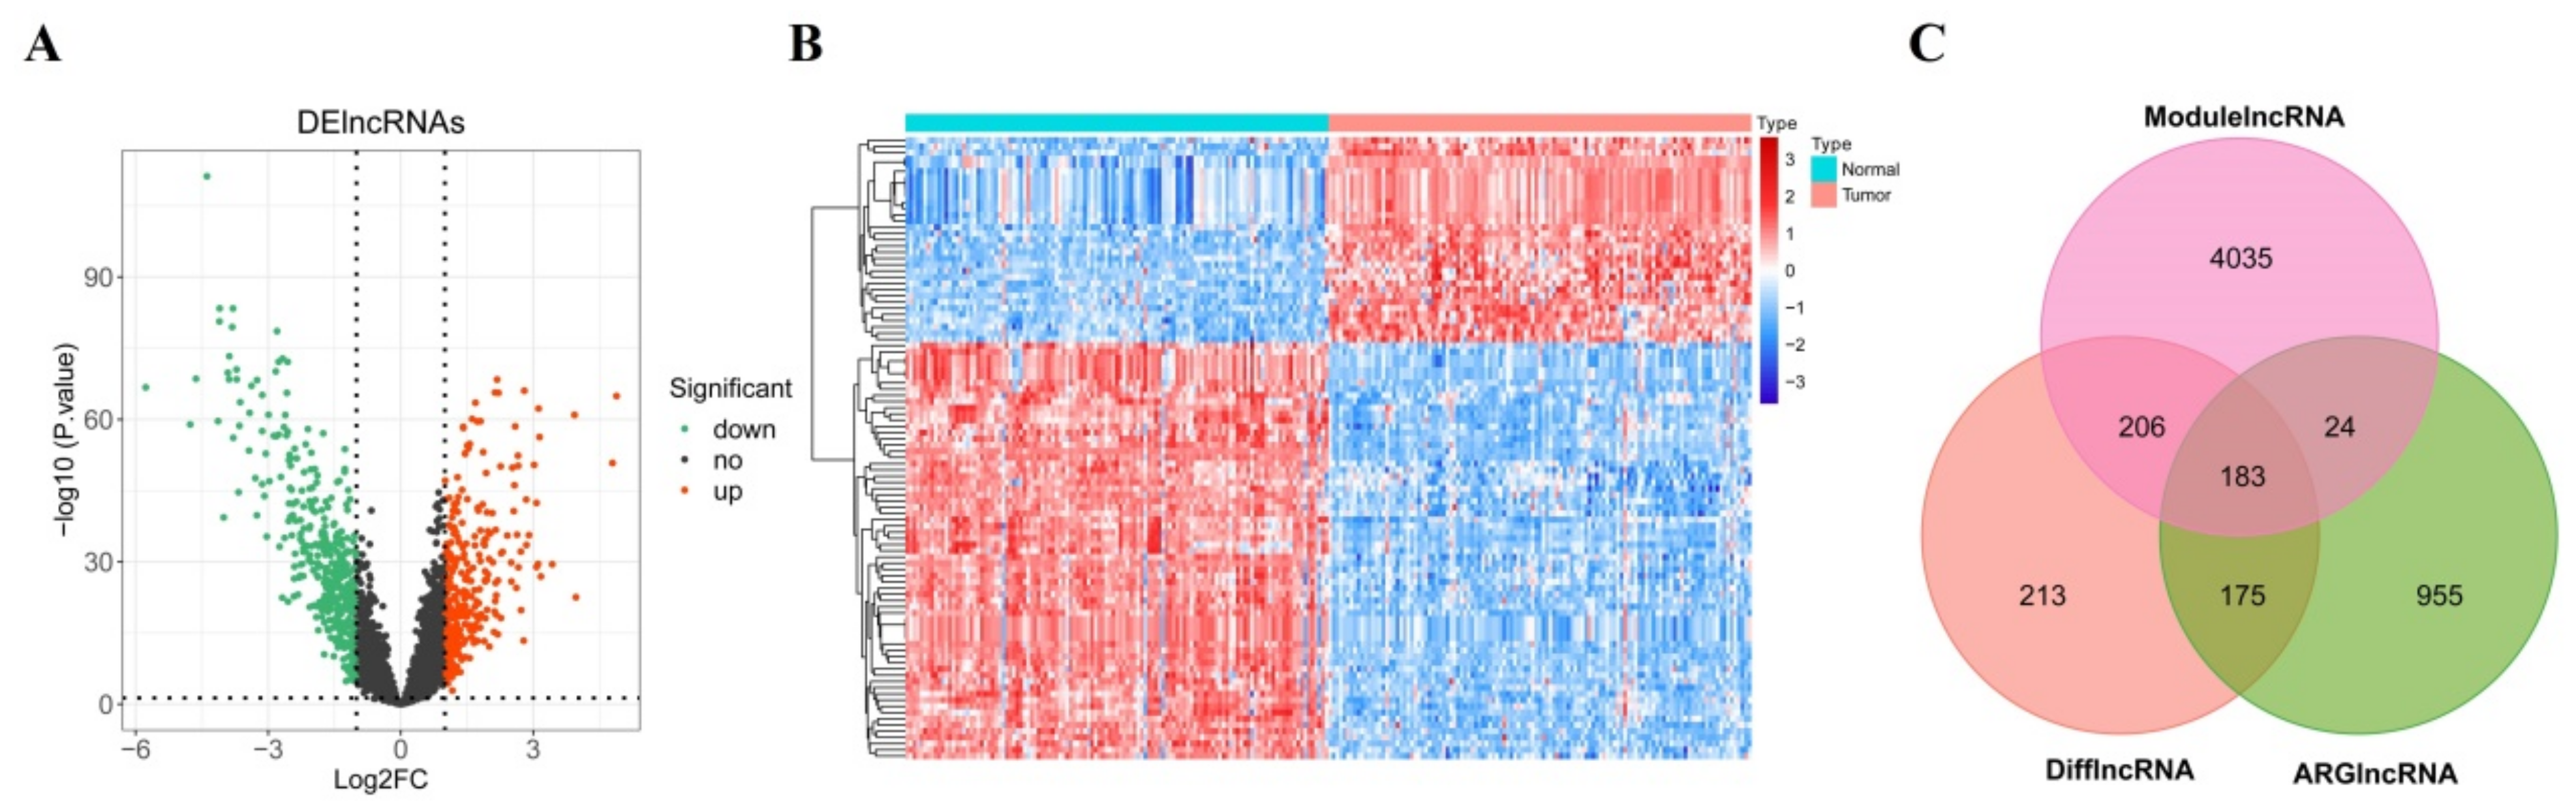
2.3. Screening of Candidate DEARlncRNAs
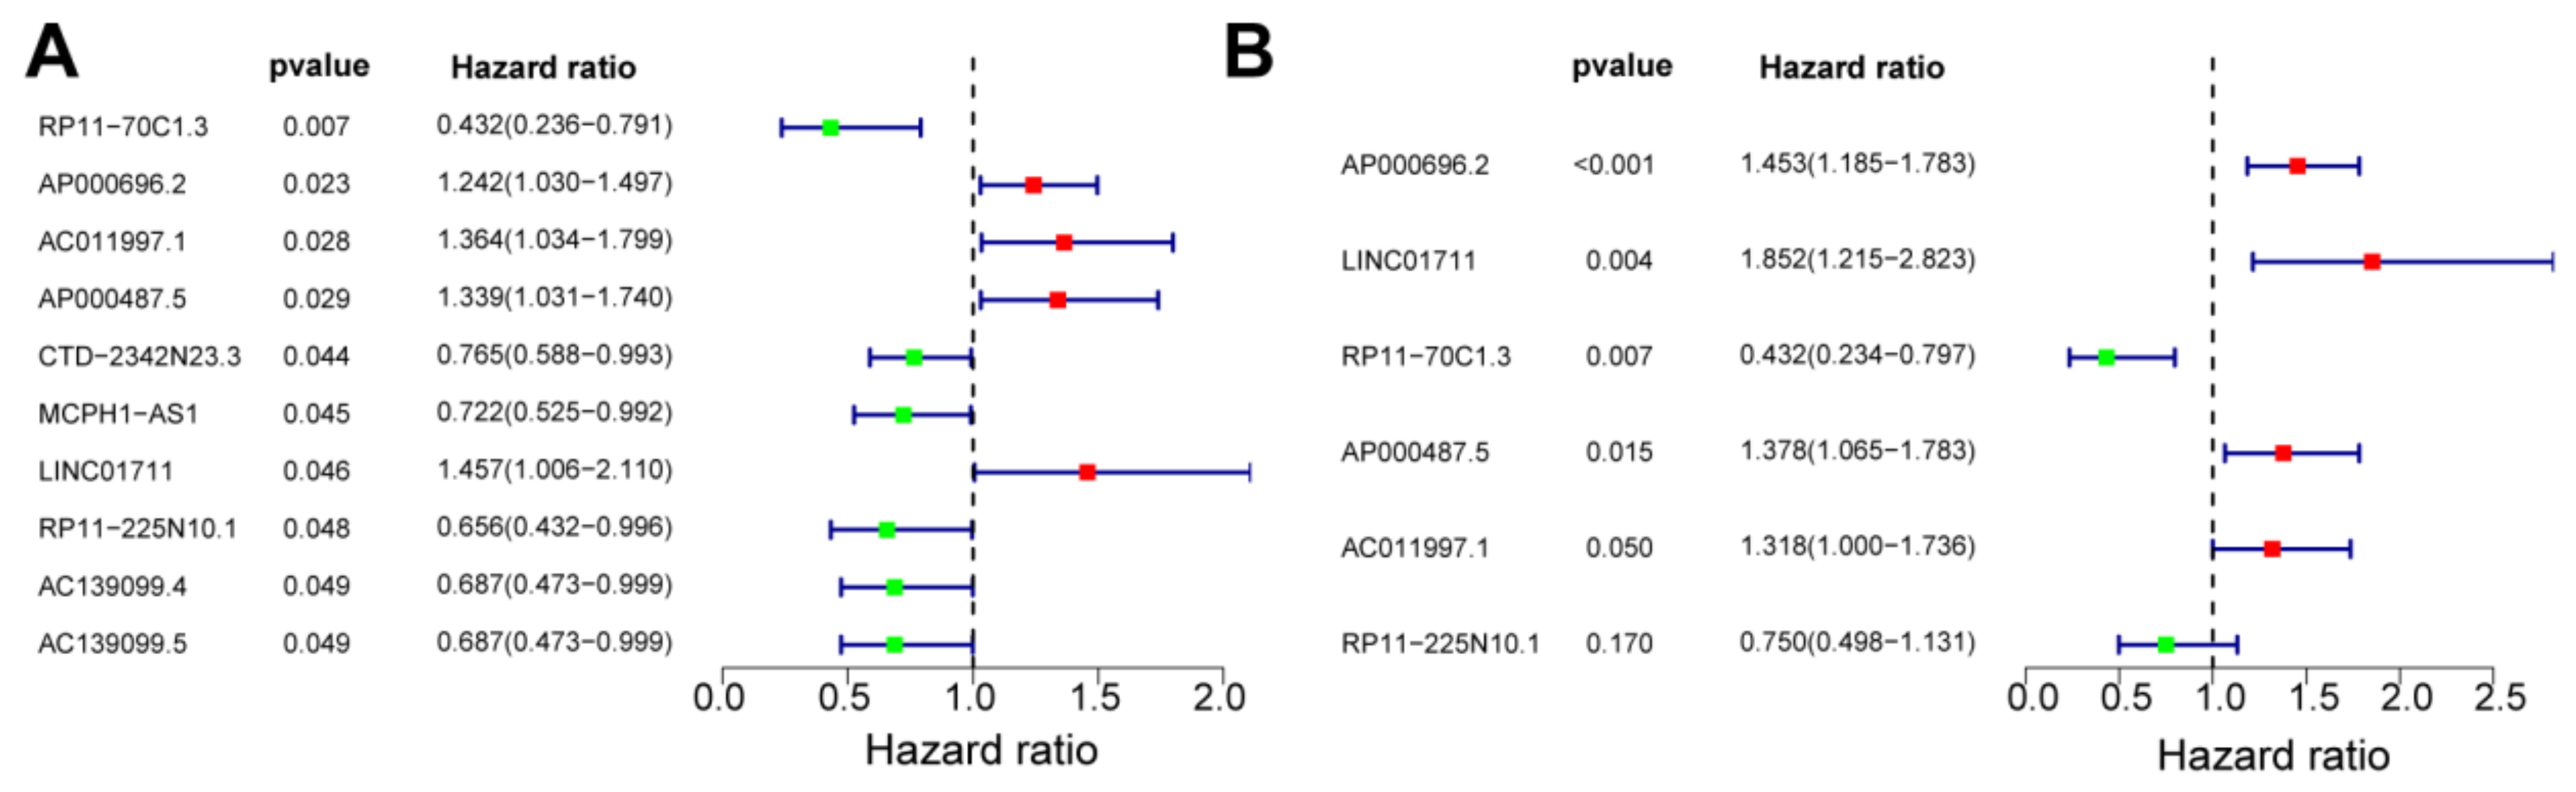
2.4. Construction of a Risk Model
2.5. Validation of the Prognostic Risk Model
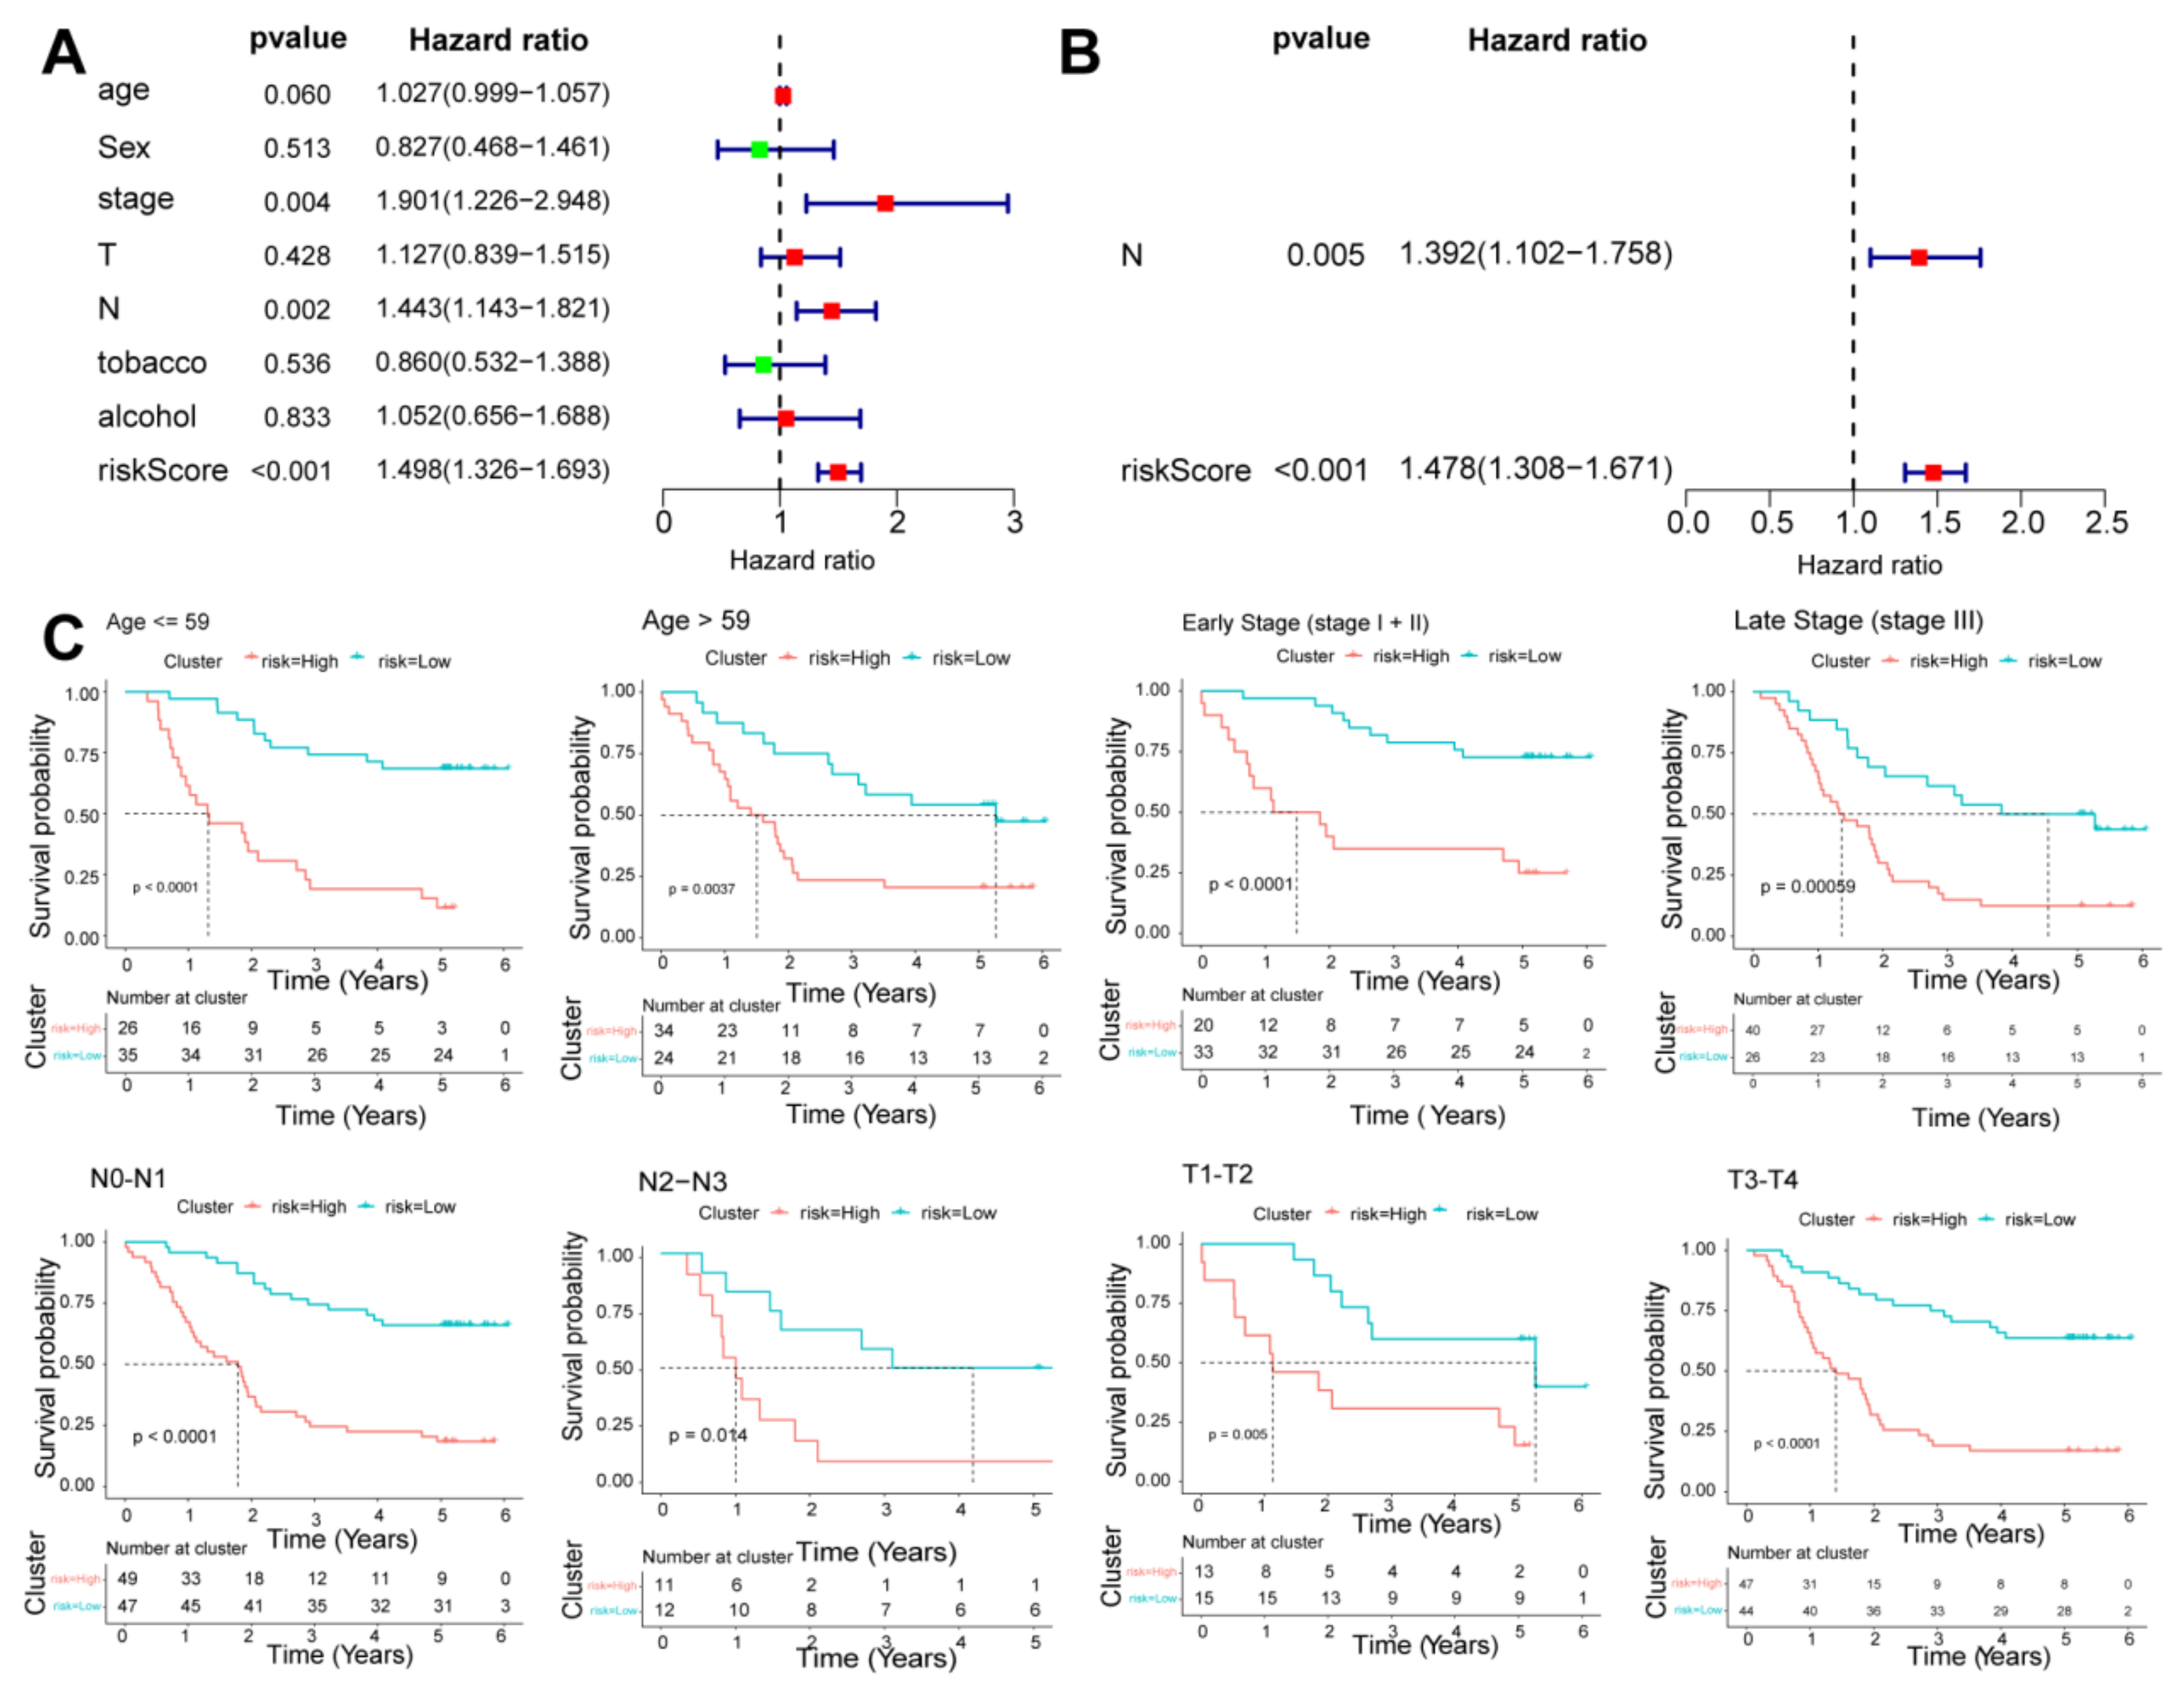
2.6. Independence Prognostic of the Risk Model
2.7. Construction of a ceRNA Network
2.8. Identification of DEGs and Functional and Pathway Enrichment Analyses
2.9. Drug Sensitivity Prediction
2.10. Validation of the Expression of the Six-DEARlncRNA by qRT-PCR
3. Results
3.1. Identification of ESCC-Related lncRNA Based on WGCNA Analysis
3.2. Screening of Candidate DEARlncRNAs
3.3. Construction of a Risk Model
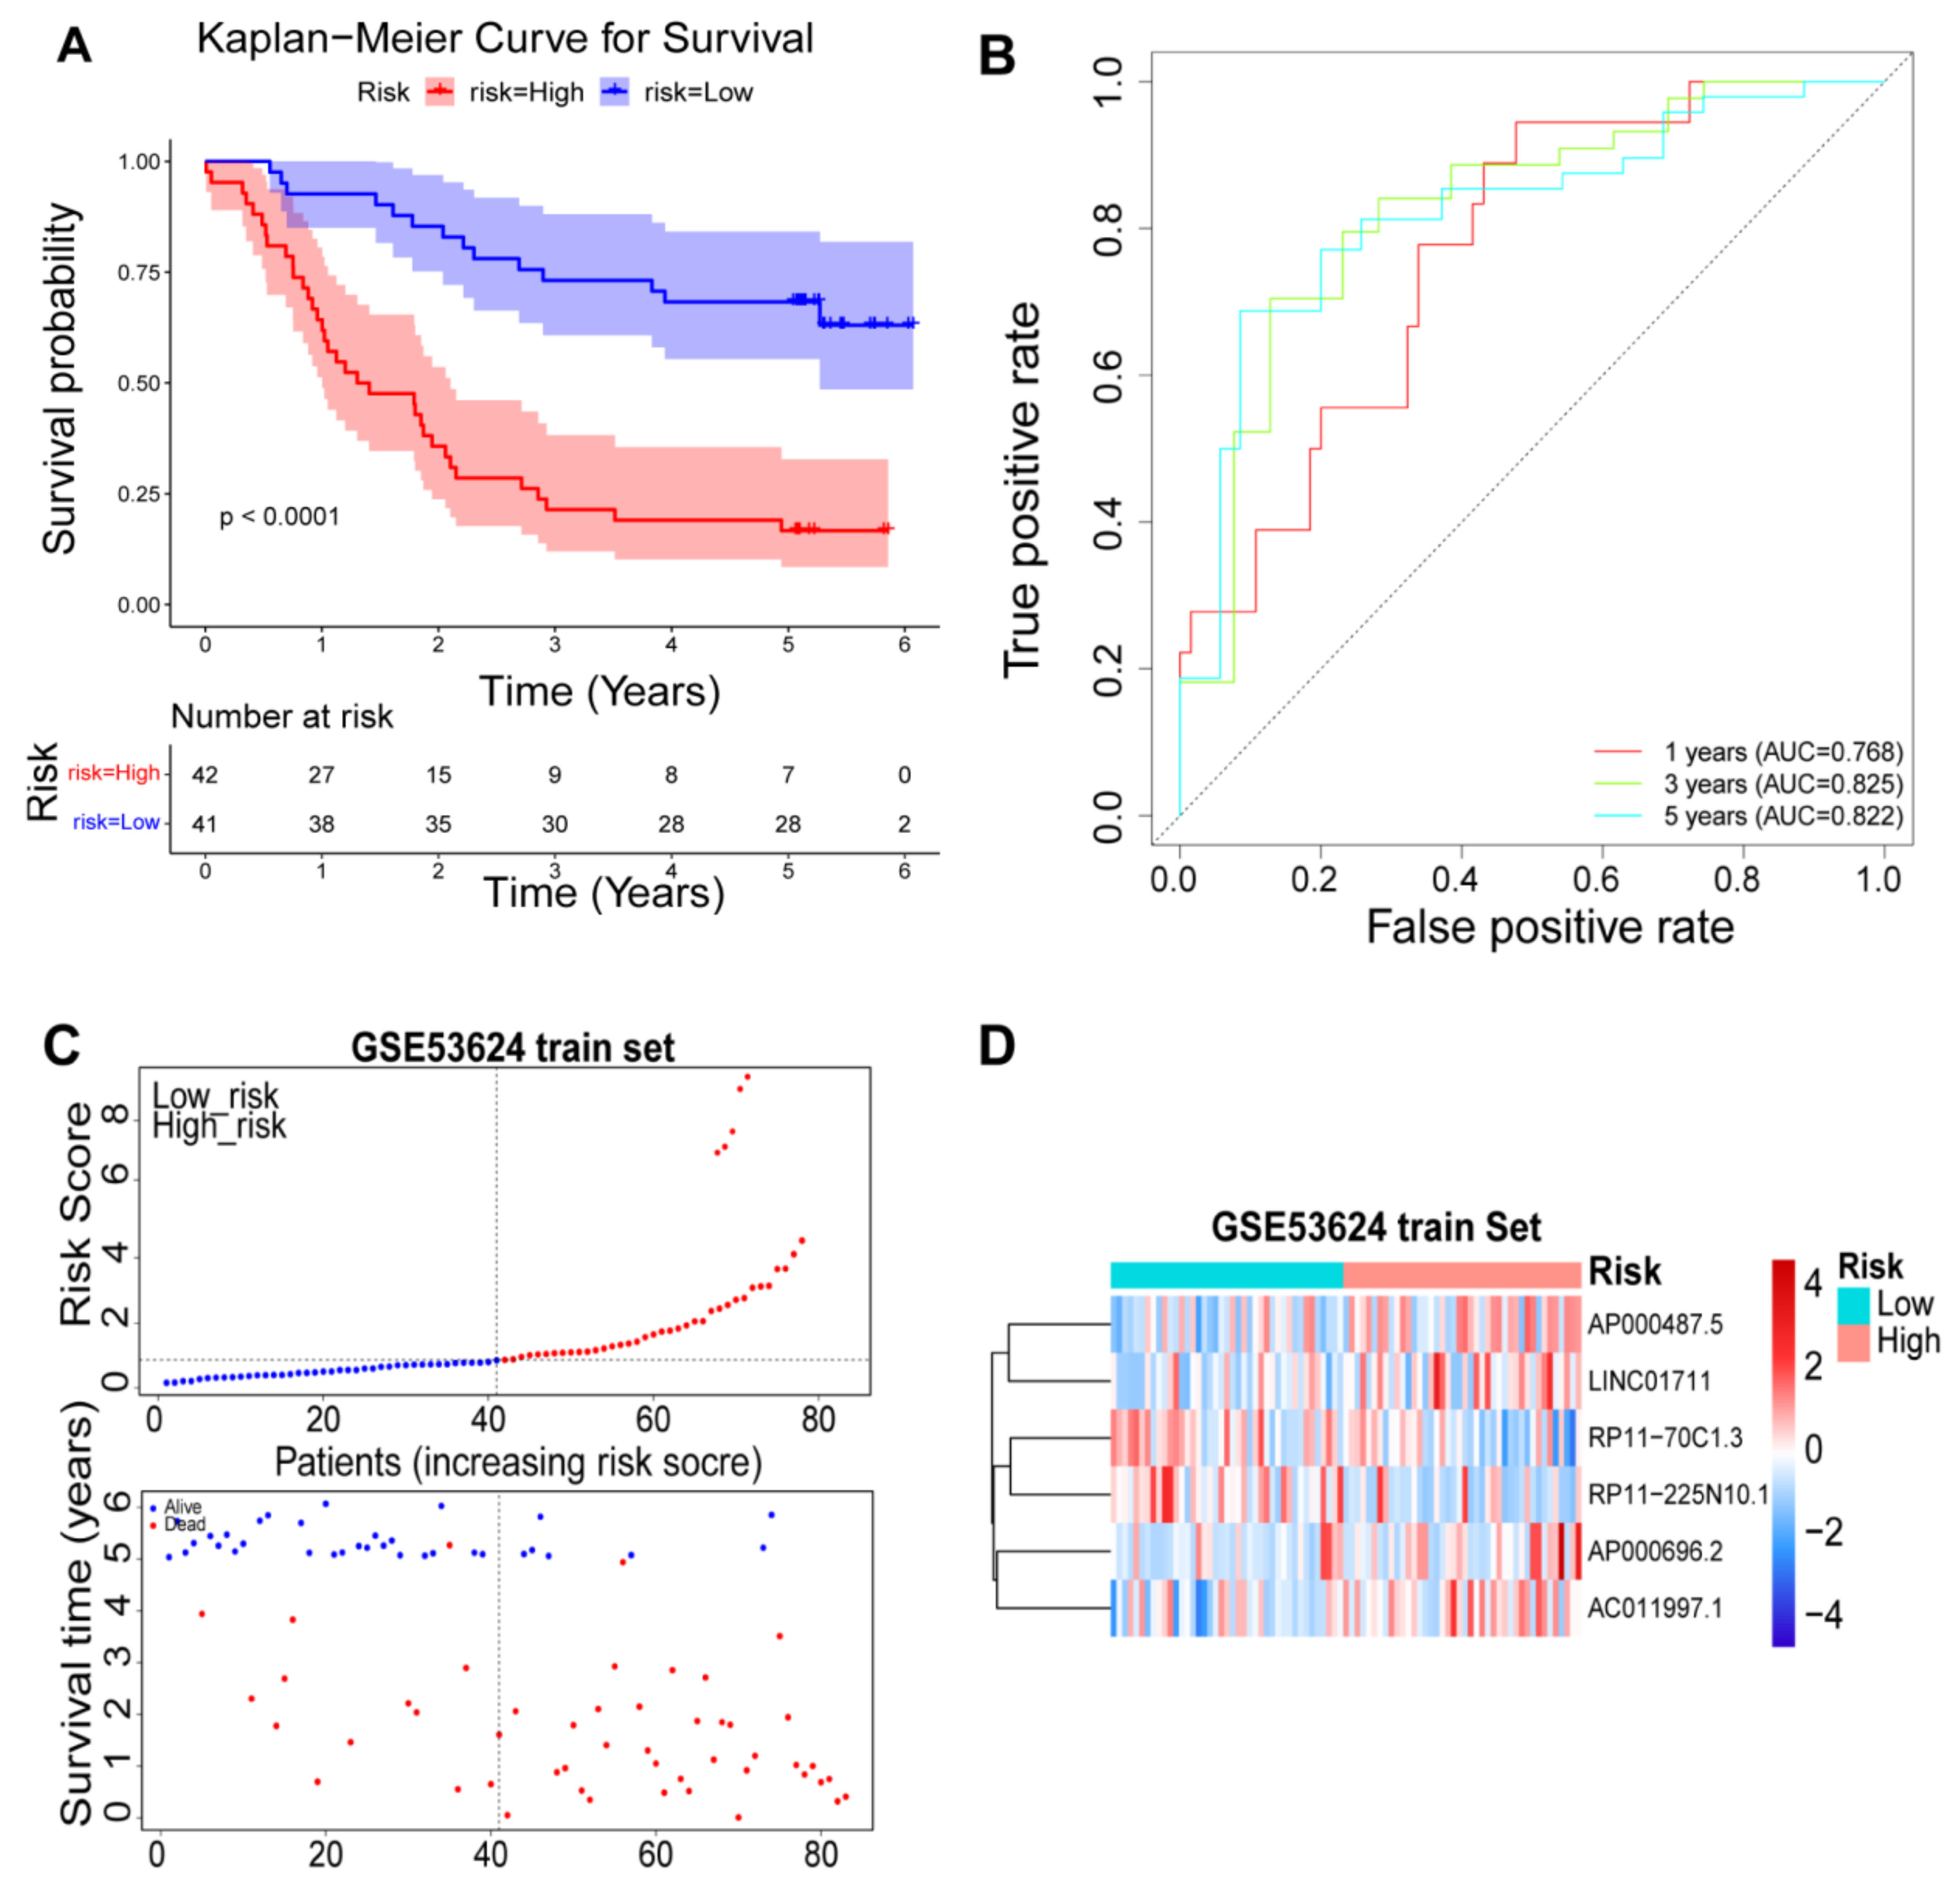
3.4. Validation of the Prognostic Risk Model
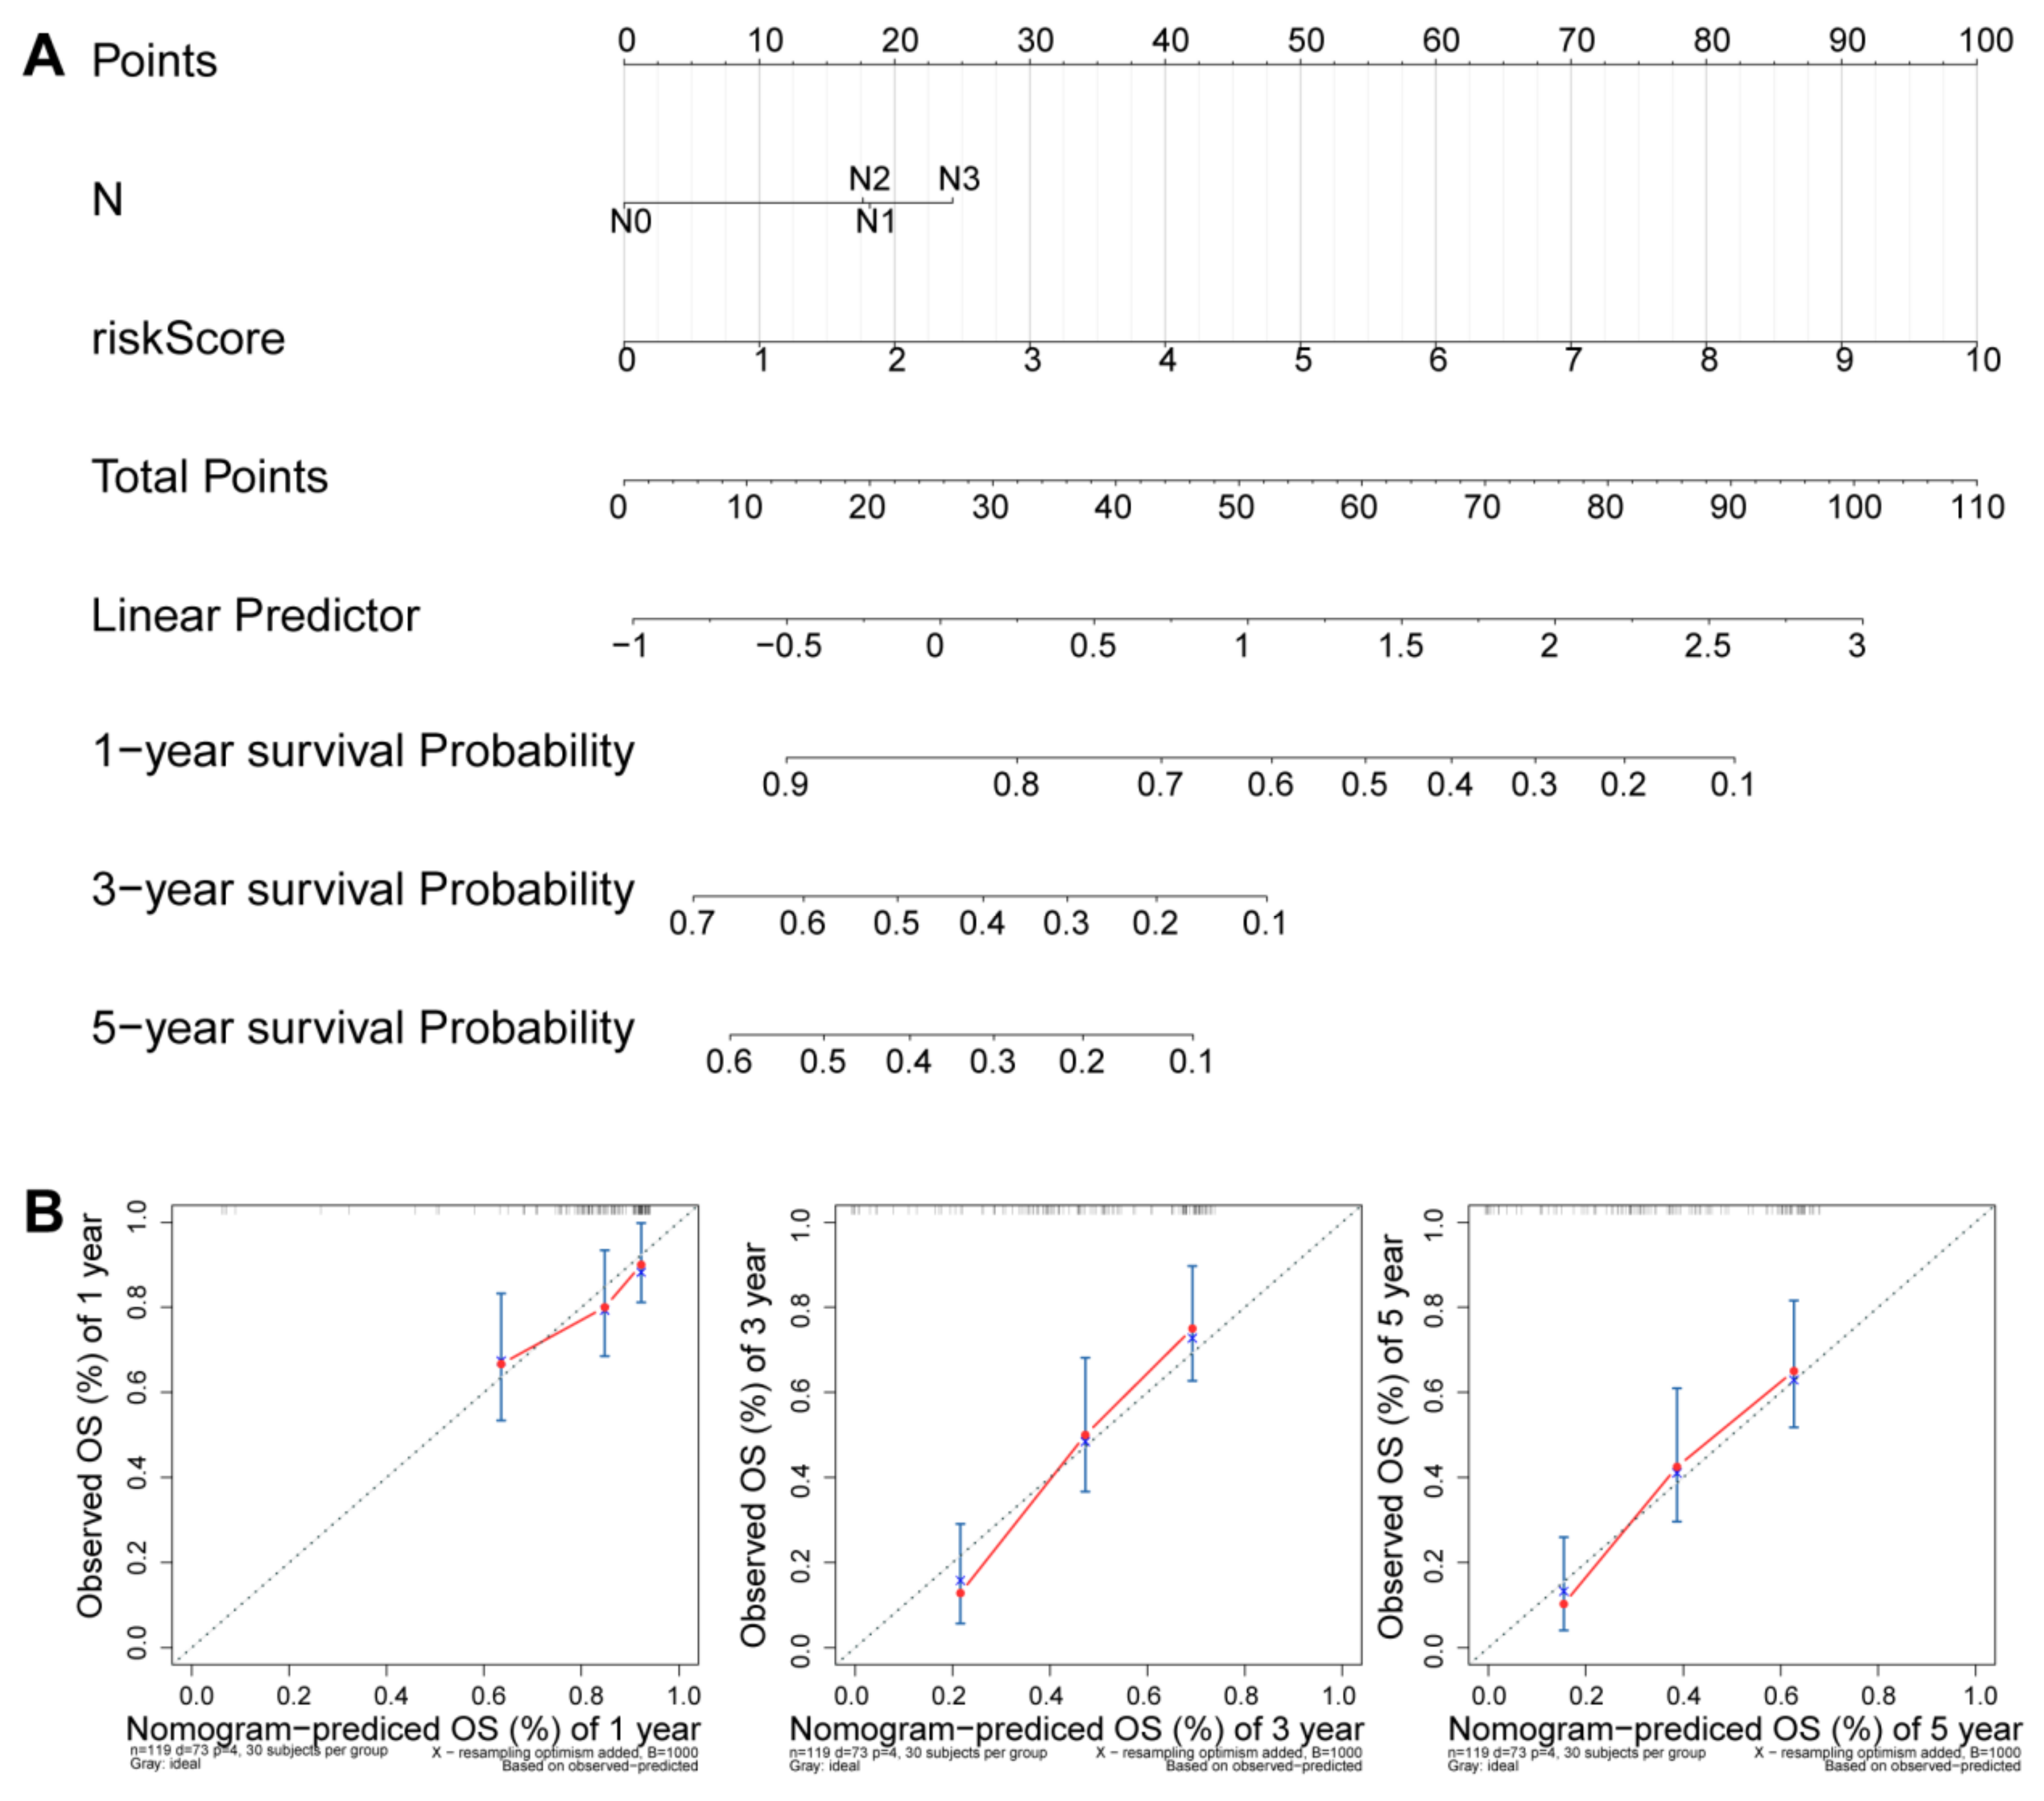
3.5. Independence Prognostic of the Risk Model
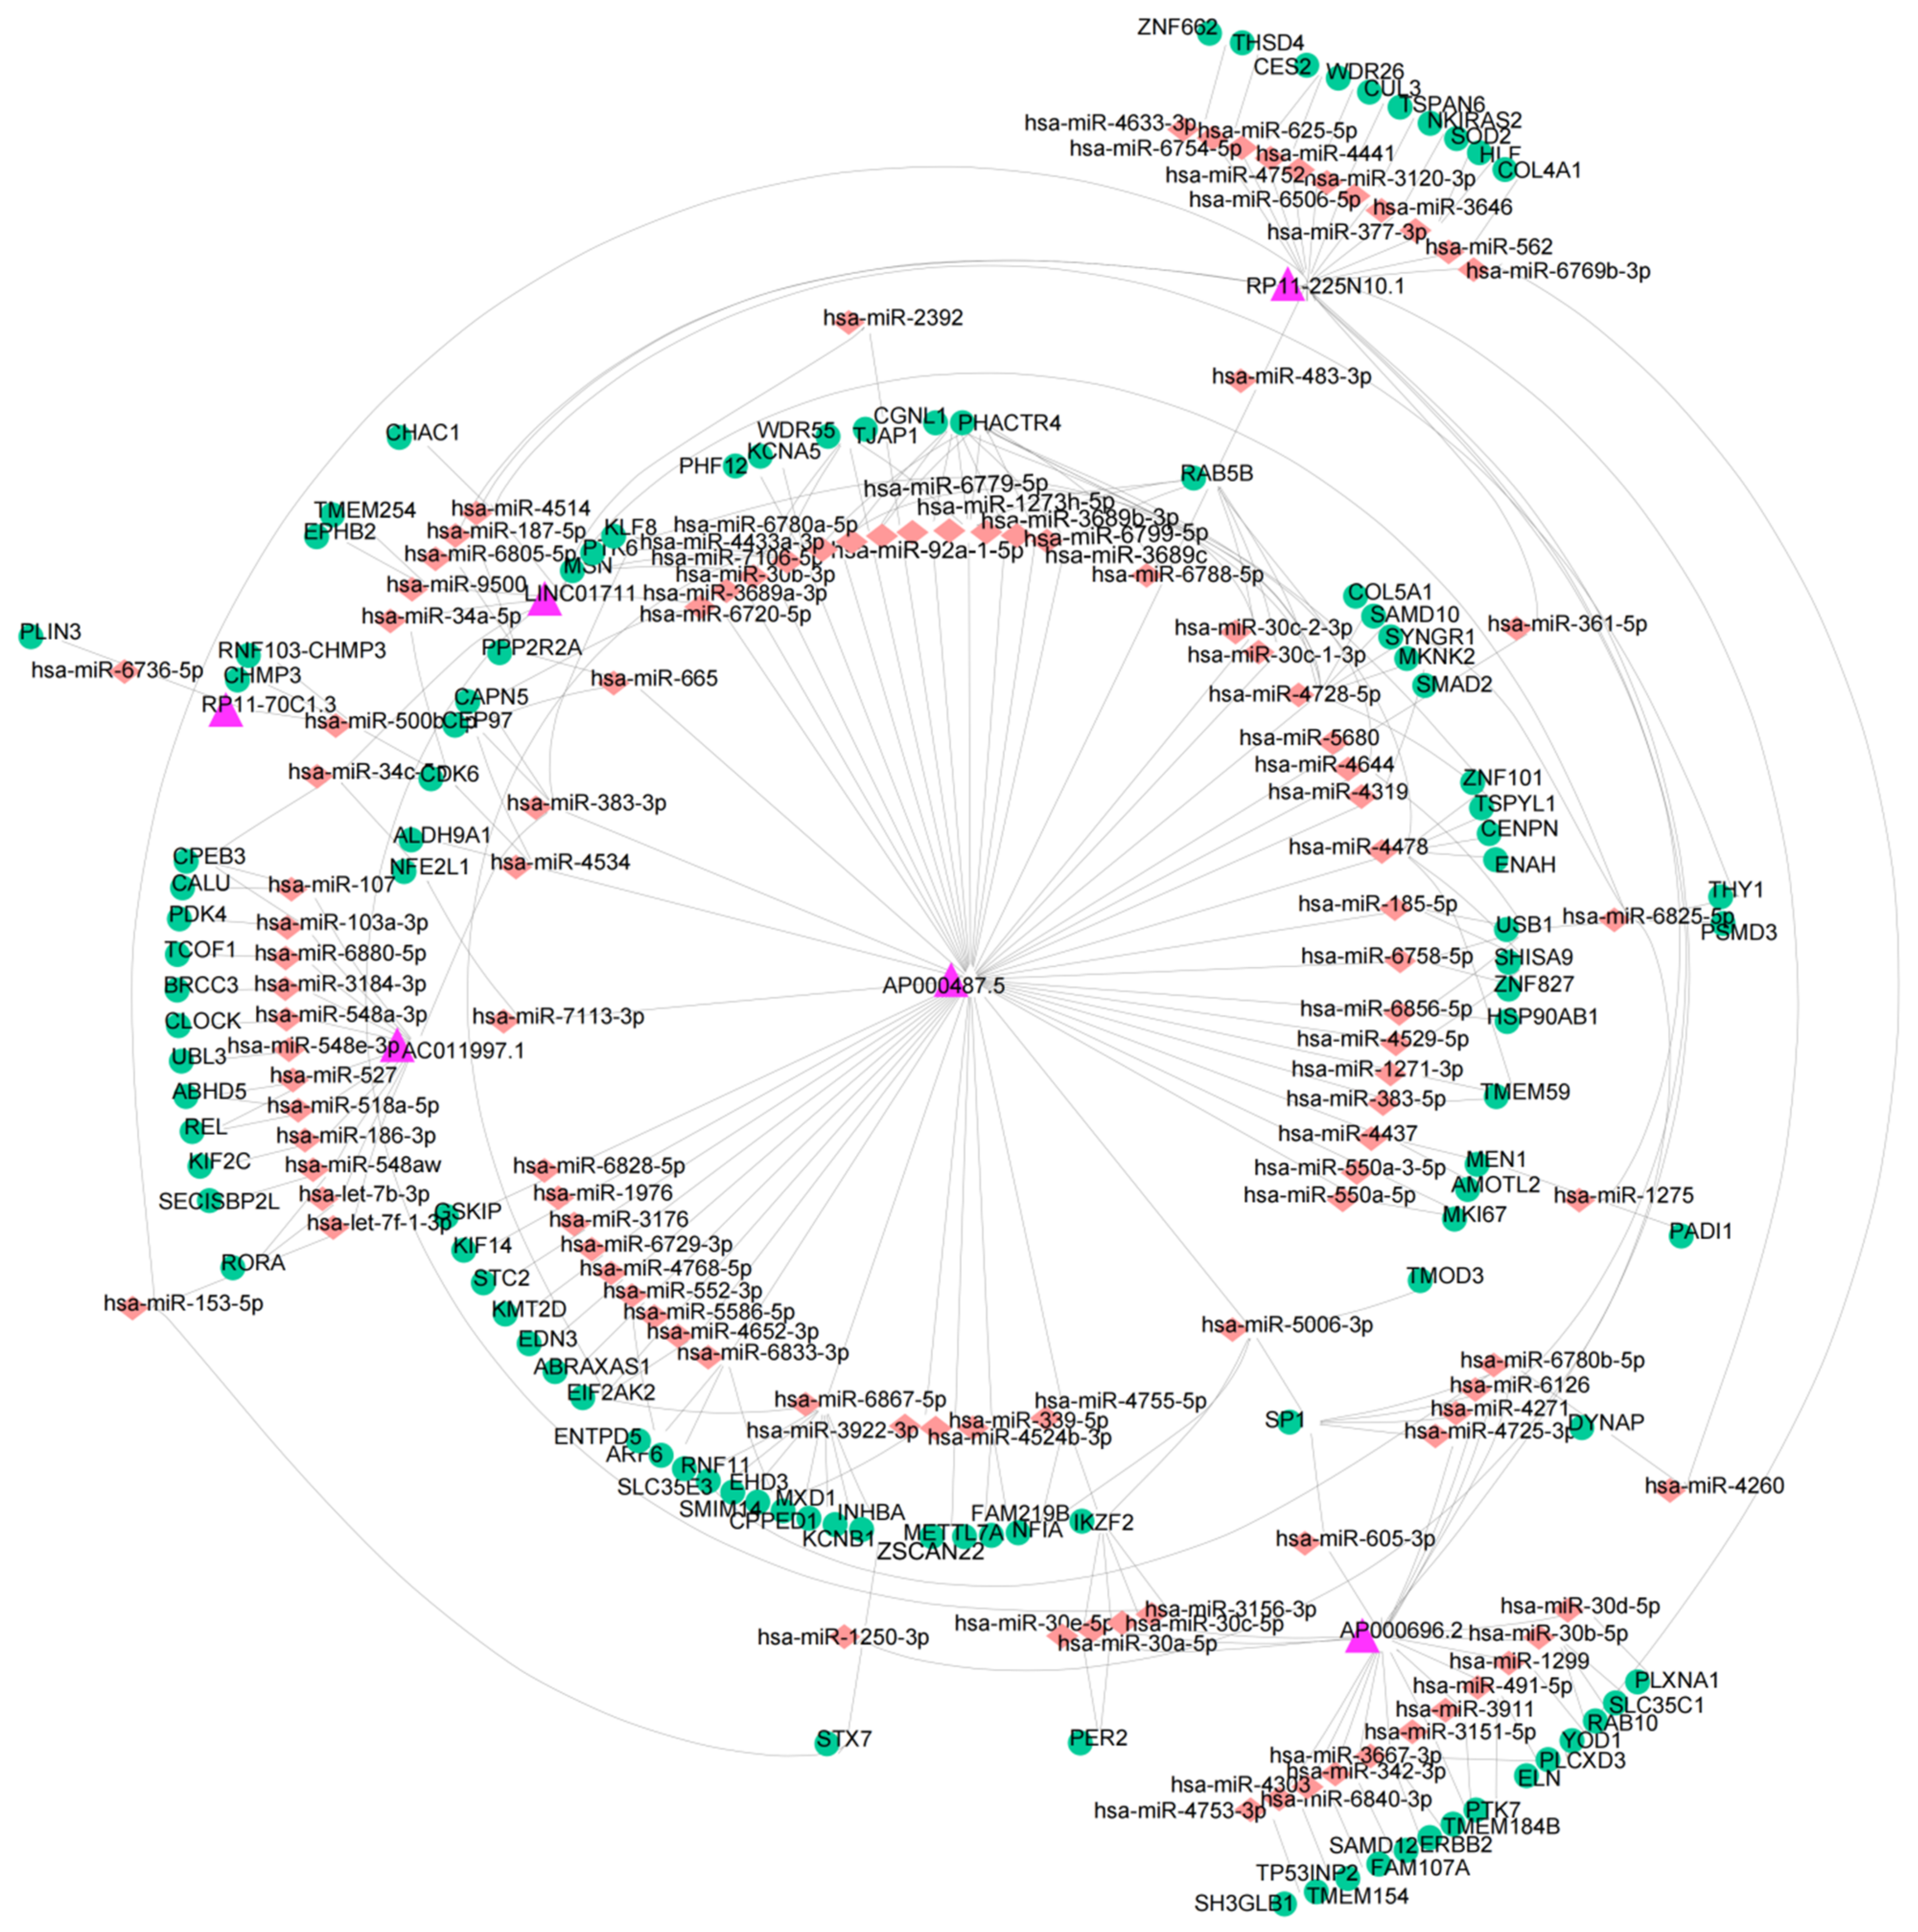
3.6. Construction of a ceRNA Network
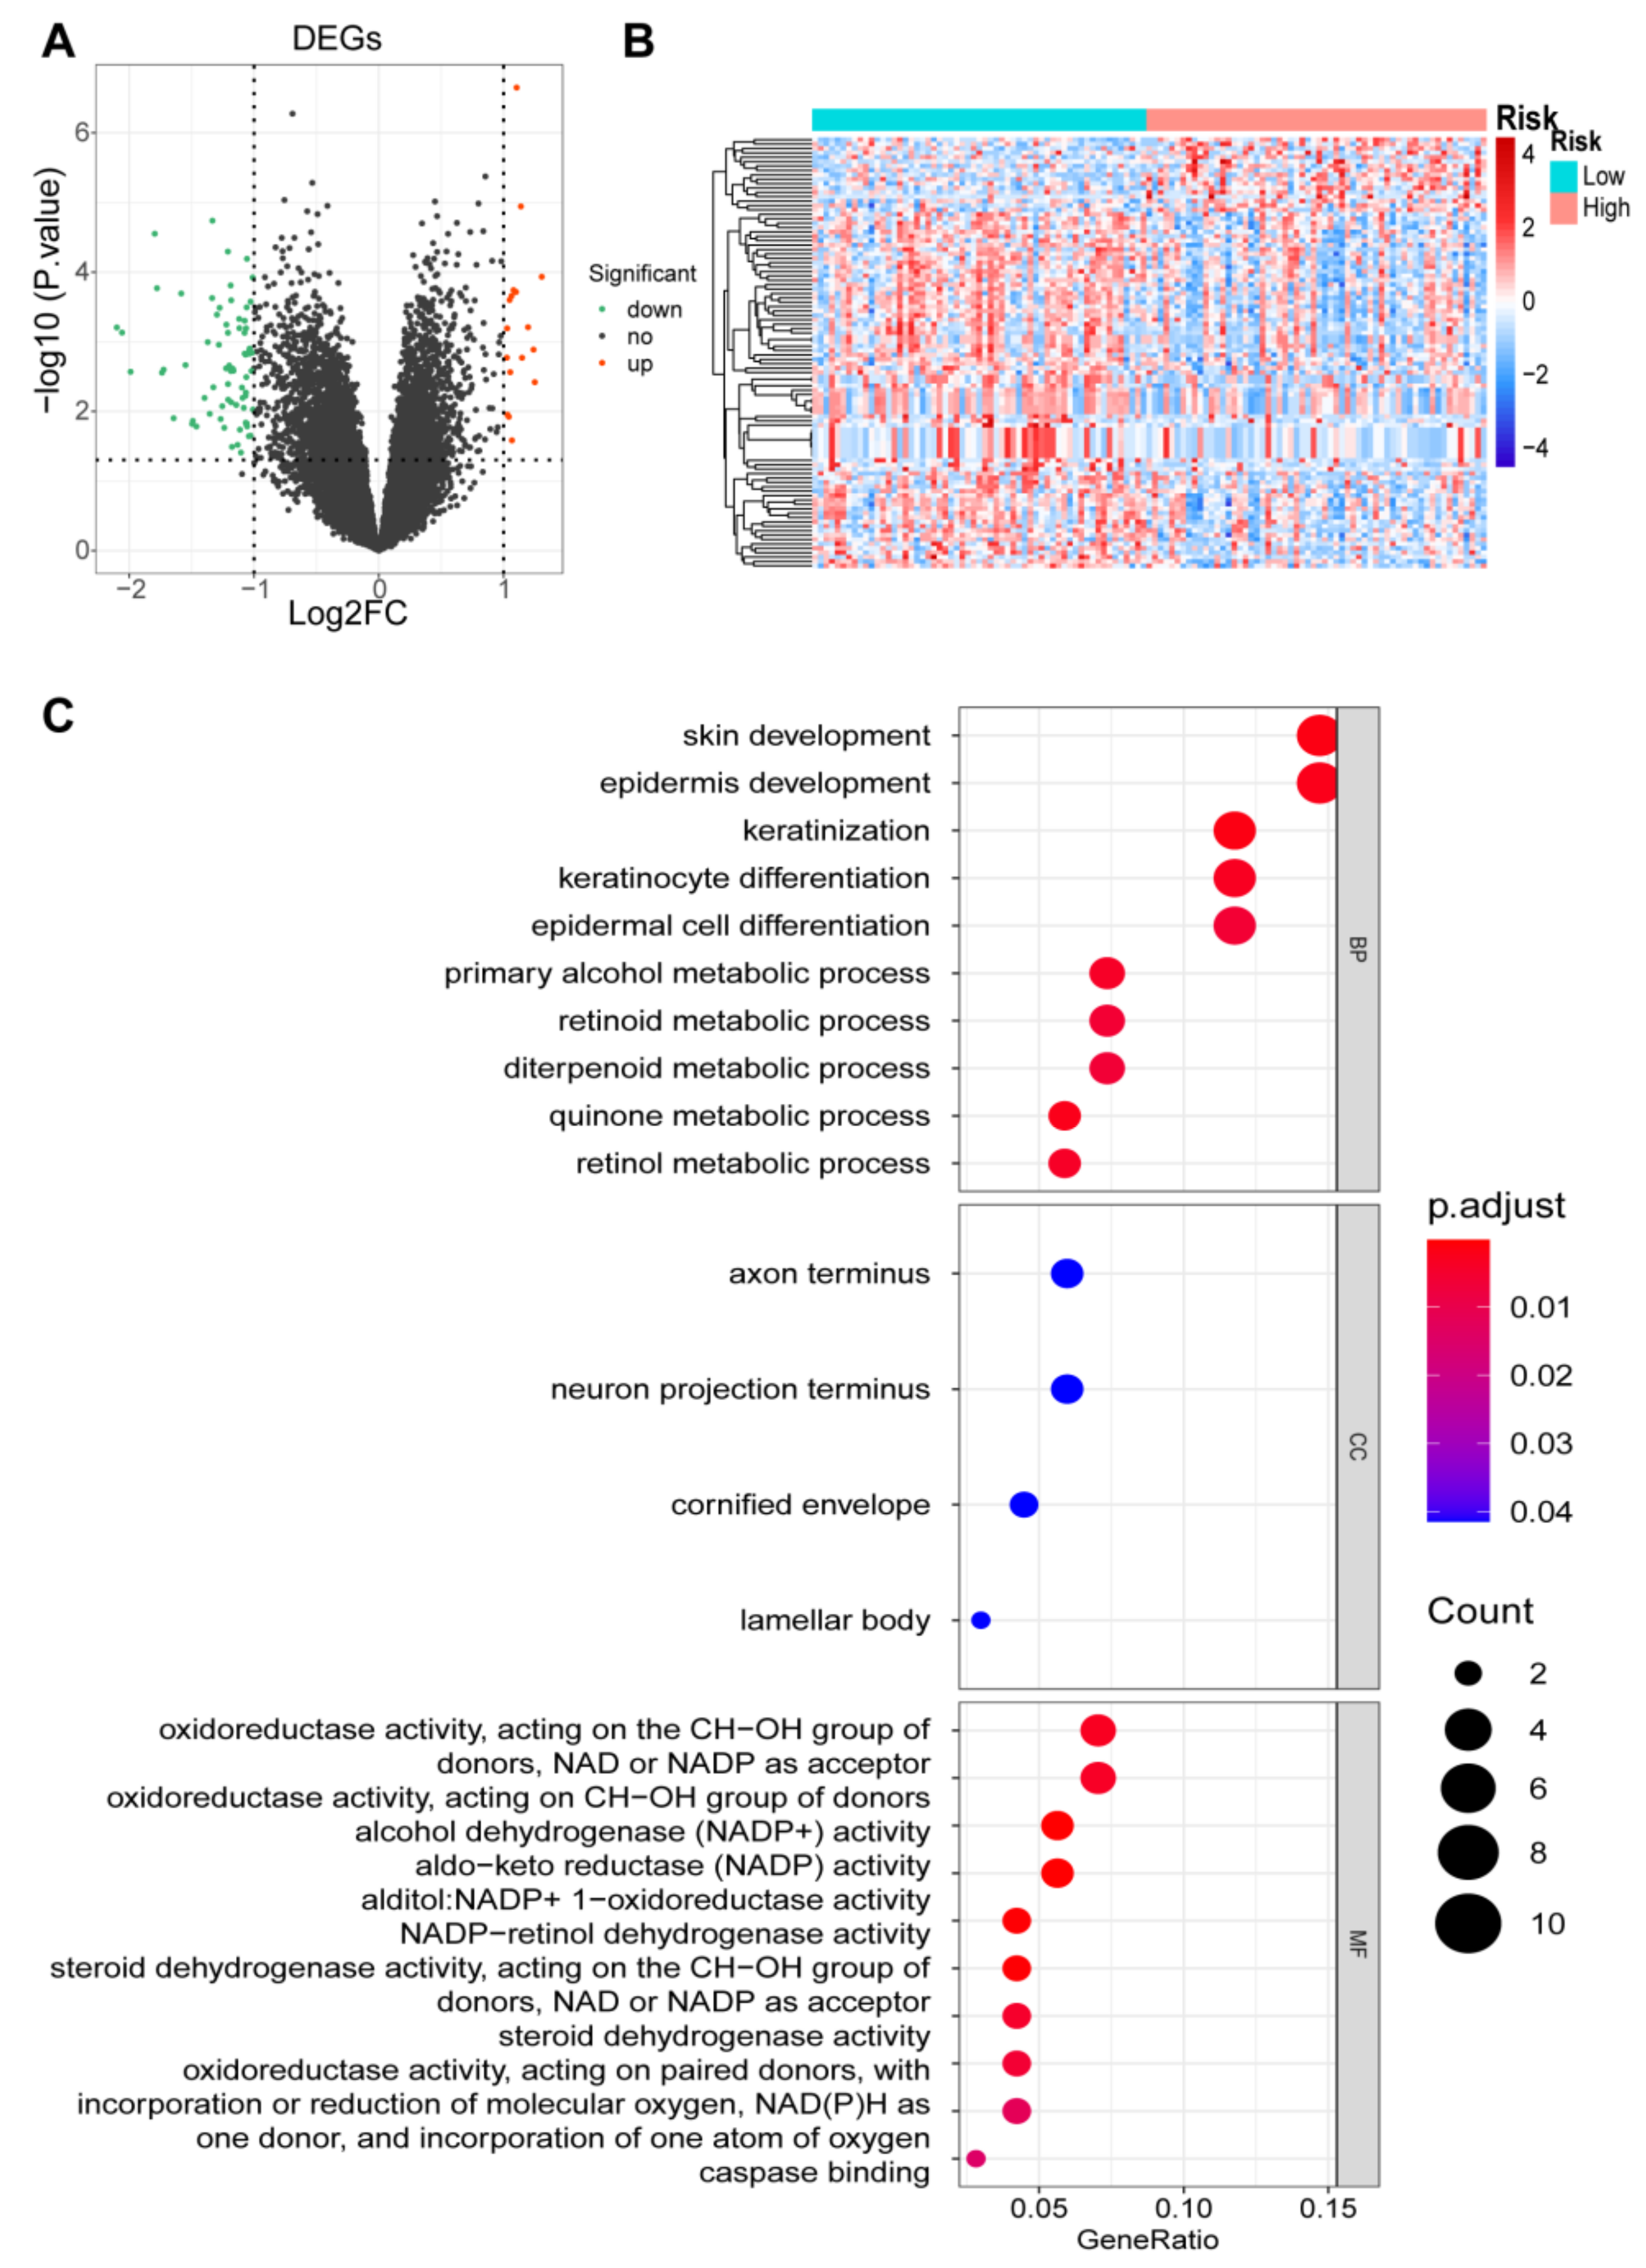
3.7. Identification of DEGs and Functional Enrichment Analyses
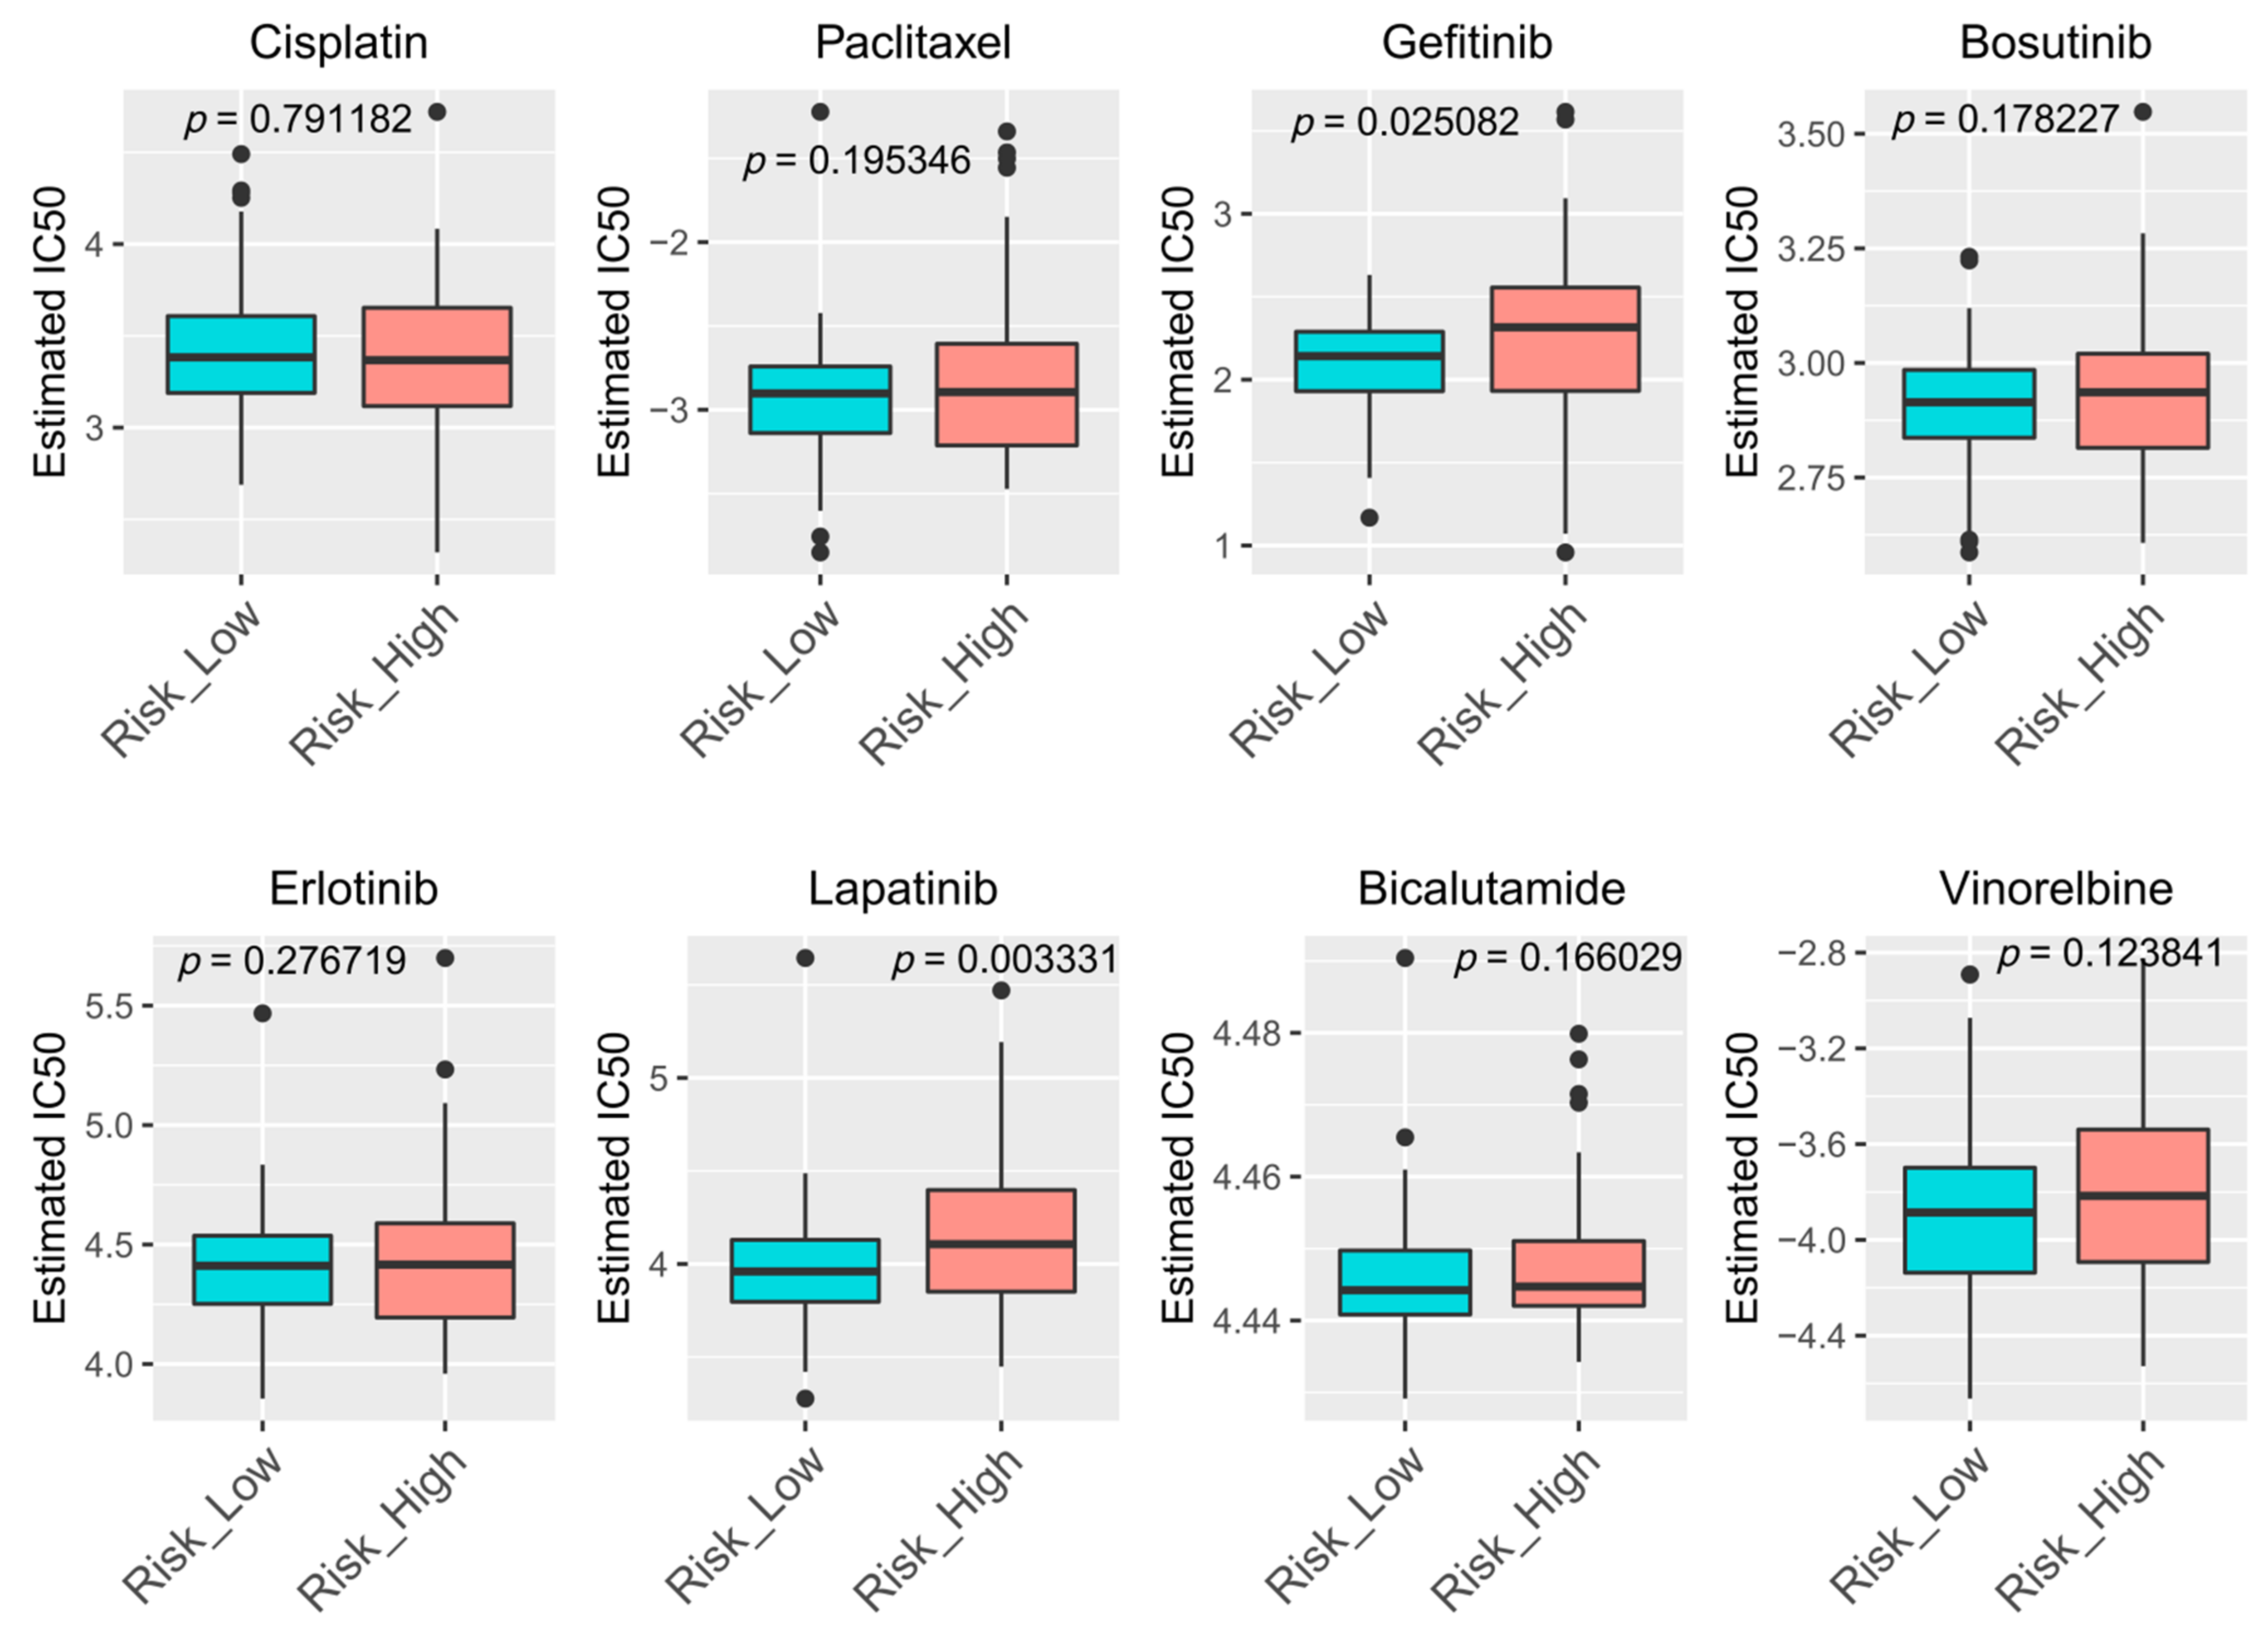
3.8. Drugs Sensitivity Prediction
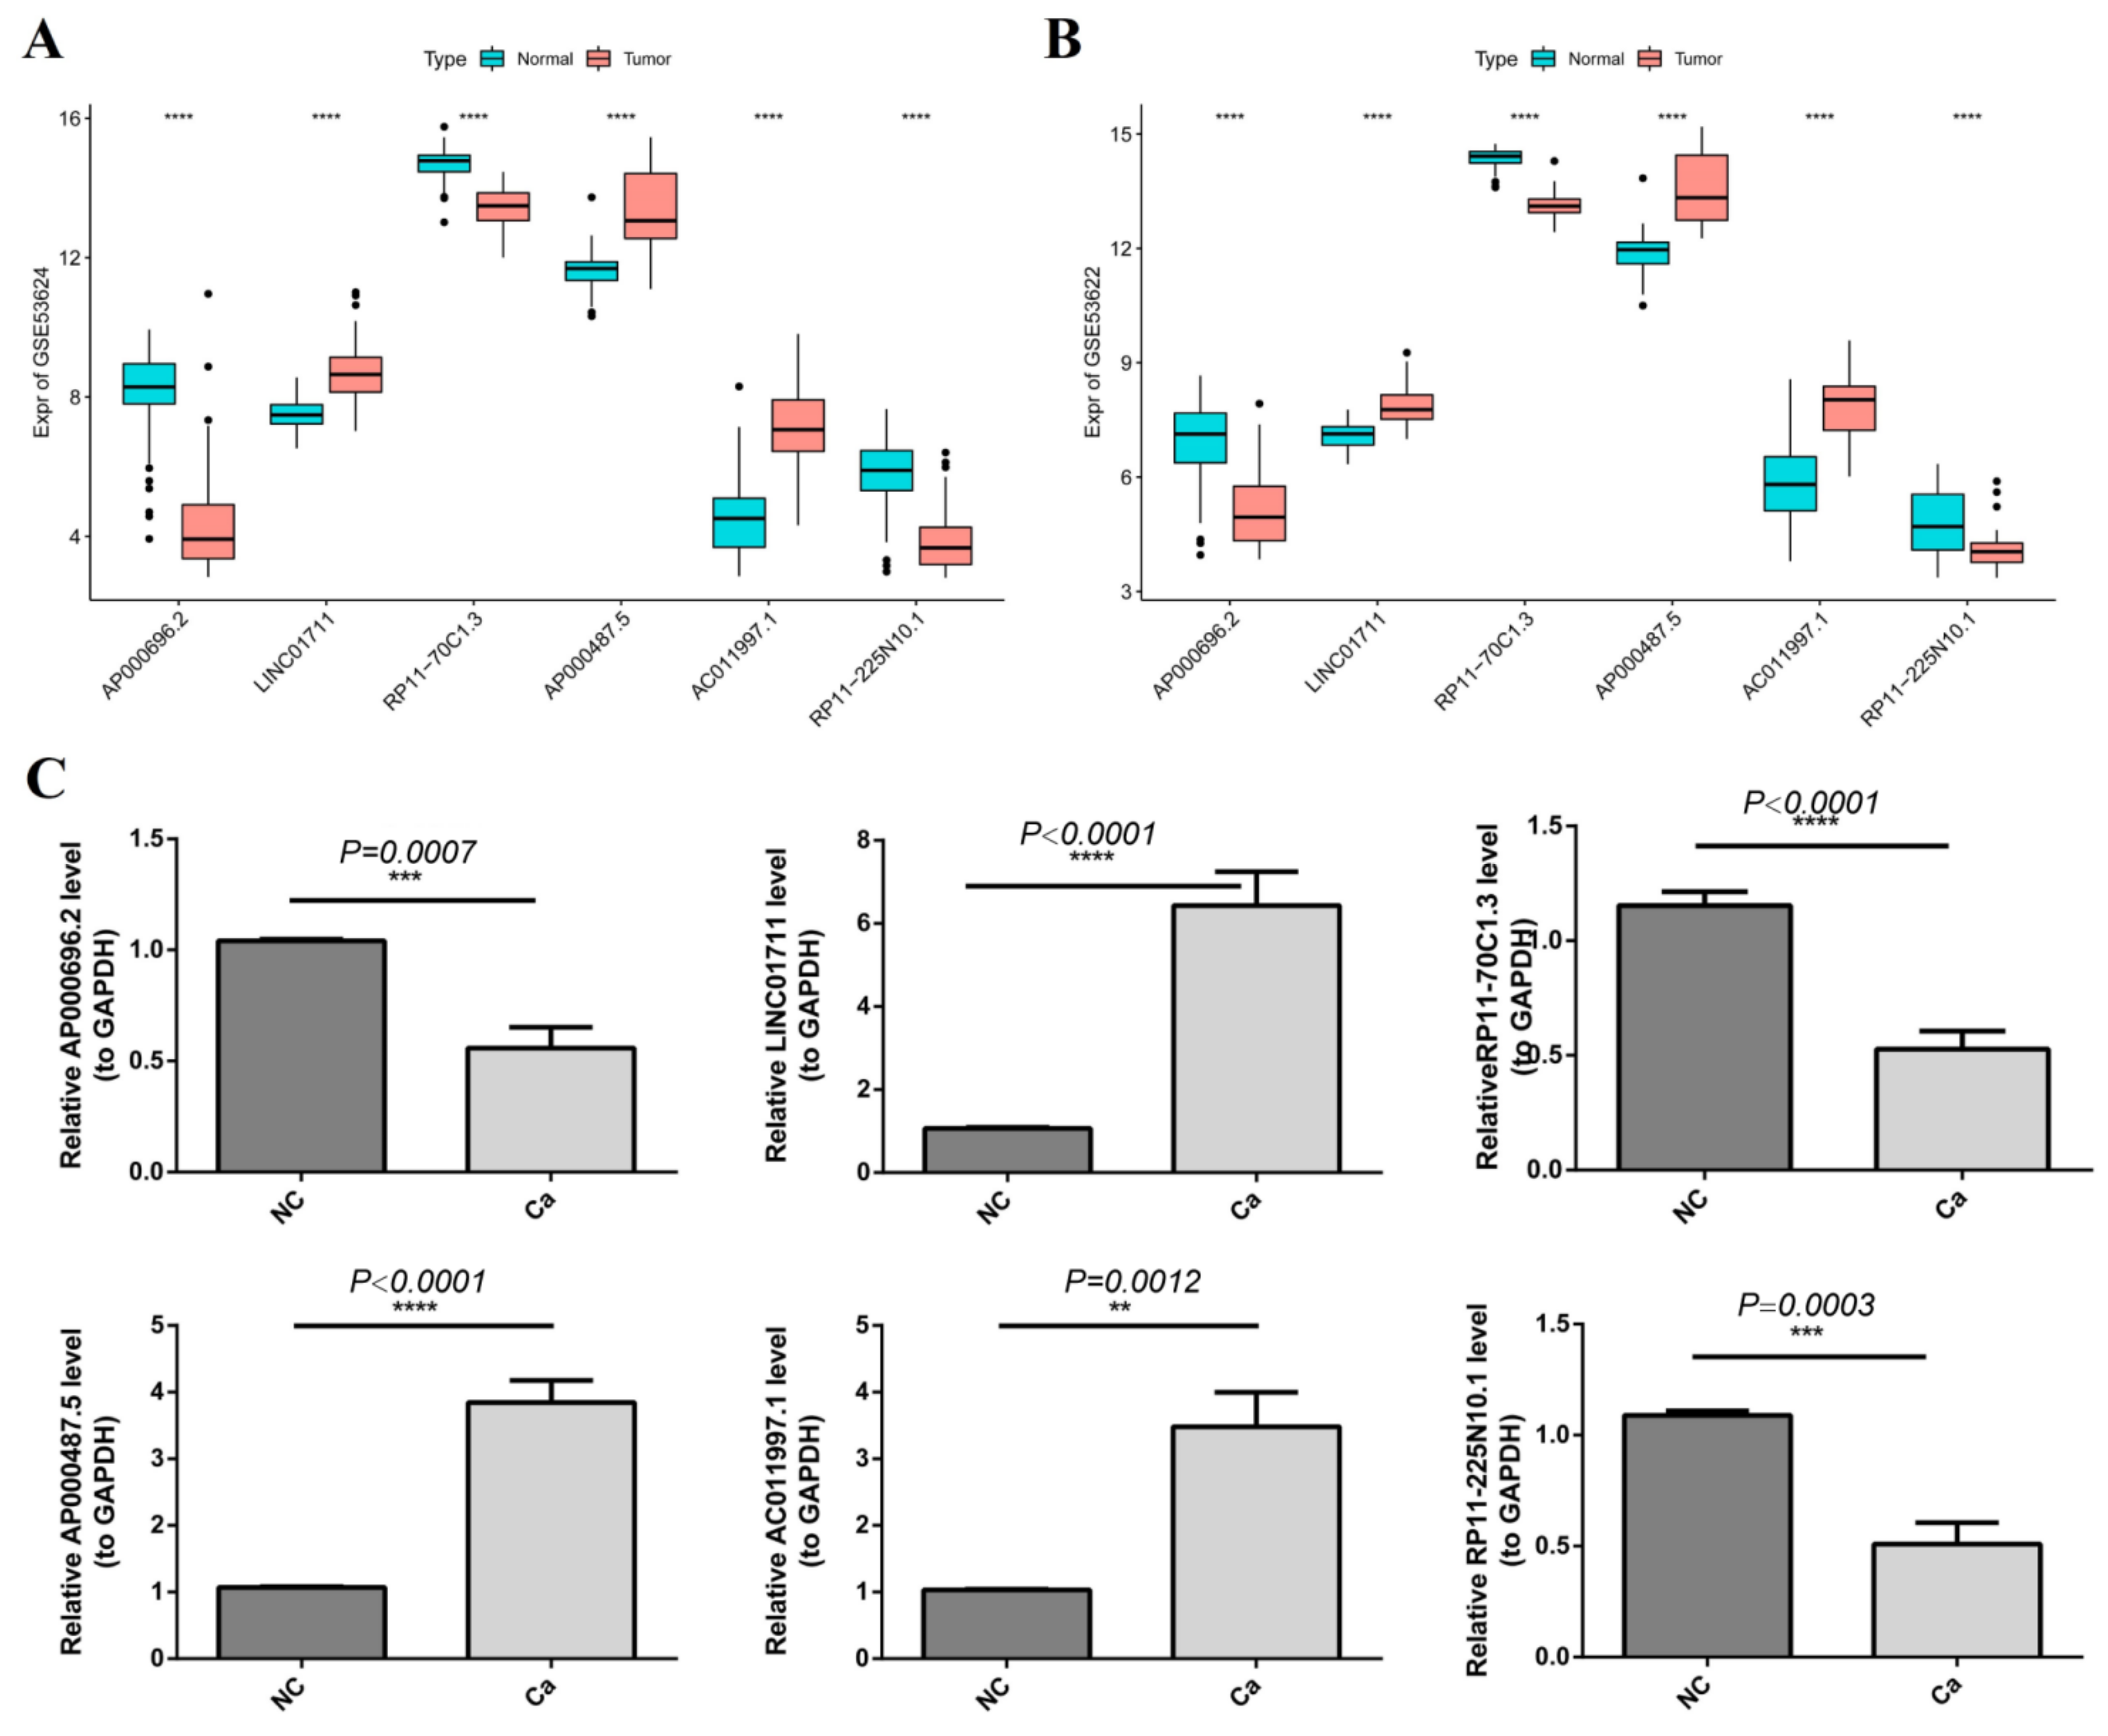
3.9. Validation of the Gene Expression by qRT-PCR
4. Discussion
5. Conclusions
Supplementary Materials
Author Contributions
Funding
Institutional Review Board Statement
Informed Consent Statement
Data Availability Statement
Conflicts of Interest
References
- Arnold, M.; Soerjomataram, I.; Ferlay, J.; Forman, D. Global incidence of oesophageal cancer by histological subtype in 2012. Gut 2015, 64, 381–387. [Google Scholar] [PubMed]
- Abbas, G.; Krasna, M. Overview of esophageal cancer. Ann. Cardiothorac. Surg. 2017, 6, 131–136. [Google Scholar] [CrossRef] [PubMed]
- Napier, K.J.; Scheerer, M.; Misra, S. Esophageal cancer: A Review of epidemiology, pathogenesis, staging workup and treatment modalities. World J. Gastrointest. Oncol. 2014, 6, 112–120. [Google Scholar] [CrossRef] [PubMed]
- Cobanoğlu, U.; Dülger, C.; Kemik, O.; Celik, S.; Sayir, F. A novel screening test for esophageal squamous cell carcinoma: Sirtuin-3. Eur. Rev. Med. Pharmacol. Sci. 2017, 21, 5399–5401. [Google Scholar] [PubMed]
- Shibuya, M. Vascular Endothelial Growth Factor (VEGF) and Its Receptor (VEGFR) Signaling in Angiogenesis: A Crucial Target for Anti- and Pro-Angiogenic Therapies. Genes Cancer 2011, 2, 1097–1105. [Google Scholar] [CrossRef]
- Brogi, E.; Wu, T.; Namiki, A.; Isner, J.M. Indirect angiogenic cytokines upregulate VEGF and bFGF gene expression in vascular smooth muscle cells, whereas hypoxia upregulates VEGF expression only. Circulation 1994, 90, 649–652. [Google Scholar] [PubMed]
- Fantin, A.; Schwarz, Q.; Davidson, K.; Normando, E.M.; Denti, L.; Ruhrberg, C. The cytoplasmic domain of neuropilin 1 is dispensable for angiogenesis, but promotes the spatial separation of retinal arteries and veins. Development 2011, 138, 4185–4191. [Google Scholar] [PubMed]
- Siekmann, A.F.; Lawson, N.D. Notch signalling and the regulation of angiogenesis. Cell Adh. Migr. 2007, 1, 104–106. [Google Scholar] [CrossRef] [PubMed]
- Millauer, B.; Wizigmann-Voos, S.; Schnürch, H.; Martinez, R.; Møller, N.P.; Risau, W.; Ullrich, A. High affinity VEGF binding and developmental expression suggest Flk-1 as a major regulator of vasculogenesis and angiogenesis. Cell 1993, 72, 835–846. [Google Scholar]
- Gibb, E.A.; Brown, C.J.; Lam, W.L. The functional role of long non-coding RNA in human carcinomas. Mol. Cancer 2011, 10, 38. [Google Scholar]
- Esteller, M. Non-coding RNAs in human disease. Nat. Rev. Genet. 2011, 12, 861–874. [Google Scholar] [PubMed]
- Fatica, A.; Bozzoni, I. Long non-coding RNAs: New players in cell differentiation and development. Nat. Rev. Genet. 2014, 15, 7–21. [Google Scholar] [PubMed]
- Wang, Y.; Chen, L.; Chen, B.; Li, X.; Kang, J.; Fan, K.; Hu, Y.; Xu, J.; Yi, L.; Yang, J.; et al. Mammalian ncRNA-disease repository: A global view of ncRNA-mediated disease network. Cell Death Dis. 2013, 4, e765. [Google Scholar] [CrossRef] [PubMed]
- Wilusz, J.E. Long noncoding RNAs: Re-writing dogmas of RNA processing and stability. Biochim. Biophys. Acta 2016, 1859, 128–138. [Google Scholar] [PubMed]
- Li, J.; Chen, Z.; Tian, L.; Zhou, C.; He, M.Y.; Gao, Y.; Wang, S.; Zhou, F.; Shi, S.; Feng, X.; et al. LncRNA profile study reveals a three-lncRNA signature associated with the survival of patients with oesophageal squamous cell carcinoma. Gut 2014, 63, 1700–1710. [Google Scholar]
- Yu, S.; Li, Y.; Liao, Z.; Wang, Z.; Wang, Z.; Li, Y.; Qian, L.; Zhao, J.; Zong, H.; Kang, B.; et al. Plasma extracellular vesicle long RNA profiling identifies a diagnostic signature for the detection of pancreatic ductal adenocarcinoma. Gut 2020, 69, 540–550. [Google Scholar] [CrossRef]
- Charles Richard, J.L.; Eichhorn, P.J.A. Platforms for Investigating LncRNA Functions. SLAS Technol. 2018, 23, 493–506. [Google Scholar]
- Yang, G.; Lu, X.; Yuan, L. LncRNA: A link between RNA and cancer. Biochim. Biophys. Acta 2014, 1839, 1097–1109. [Google Scholar]
- Yu, B.; Wang, S. Angio-LncRs: LncRNAs that regulate angiogenesis and vascular disease. Theranostics 2018, 8, 3654–3675. [Google Scholar] [CrossRef]
- Zhao, Z.; Sun, W.; Guo, Z.; Zhang, J.; Yu, H.; Liu, B. Mechanisms of lncRNA/microRNA interactions in angiogenesis. Life Sci. 2020, 254, 116900. [Google Scholar]
- Sun, S.L.; Shu, Y.G.; Tao, M.Y. LncRNA CCAT2 promotes angiogenesis in glioma through activation of VEGFA signalling by sponging miR-424. Mol. Cell. Biochem. 2020, 468, 69–82. [Google Scholar] [PubMed]
- Lin, X.; Yang, F.; Qi, X.; Li, Q.; Wang, D.; Yi, T.; Yin, R.; Zhao, X.; Zhong, X.; Bian, C. LncRNA DANCR promotes tumor growth and angiogenesis in ovarian cancer through direct targeting of miR-145. Mol. Carcinog. 2019, 58, 2286–2296. [Google Scholar] [CrossRef] [PubMed]
- Teng, F.; Zhang, J.X.; Chang, Q.M.; Wu, X.B.; Tang, W.G.; Wang, J.F.; Feng, J.F.; Zhang, Z.P.; Hu, Z.Q. LncRNA MYLK-AS1 facilitates tumor progression and angiogenesis by targeting miR-424-5p/E2F7 axis and activating VEGFR-2 signaling pathway in hepatocellular carcinoma. J. Exp. Clin. Cancer Res. 2020, 39, 235. [Google Scholar] [CrossRef]
- Ding, X.; Jia, X.; Wang, C.; Xu, J.; Gao, S.J.; Lu, C. A DHX9-lncRNA-MDM2 interaction regulates cell invasion and angiogenesis of cervical cancer. Cell Death Differ. 2019, 26, 1750–1765. [Google Scholar] [CrossRef] [PubMed]
- Wang, P.; Chen, Y.; Zheng, Y.; Fu, Y.; Ding, Z. Identification of Epithelial-Mesenchymal Transition- (EMT-) Related LncRNA for Prognostic Prediction and Risk Stratification in Esophageal Squamous Cell Carcinoma. Dis. Markers 2021, 2021, 5340240. [Google Scholar] [CrossRef] [PubMed]
- Zhao, X.; Li, W. Gene coexpression network analysis identified potential biomarkers in gestational diabetes mellitus progression. Mol. Genet. Genomic Med. 2019, 7, e00515. [Google Scholar] [CrossRef] [PubMed]
- Yu, W.; Yu, W.; Yang, Y.; Lü, Y. Exploring the Key Genes and Identification of Potential Diagnosis Biomarkers in Alzheimer’s Disease Using Bioinformatics Analysis. Front. Aging Neurosci. 2021, 13, 602781. [Google Scholar] [CrossRef]
- Van, P.; Jiang, W.; Gottardo, R.; Finak, G. ggCyto: Next generation open-source visualization software for cytometry. Bioinformatics 2018, 34, 3951–3953. [Google Scholar] [CrossRef]
- Lu, T.; Xu, R.; Li, Q.; Zhao, J.Y.; Peng, B.; Zhang, H.; Guo, J.D.; Zhang, S.Q.; Li, H.W.; Wang, J.; et al. Systematic profiling of ferroptosis gene signatures predicts prognostic factors in esophageal squamous cell carcinoma. Mol. Ther. Oncolytics 2021, 21, 134–143. [Google Scholar] [CrossRef]
- Shi, X.; Liu, X.; Pan, S.; Ke, Y.; Li, Y.; Guo, W.; Wang, Y.; Ruan, Q.; Zhang, X.; Ma, H. A Novel Autophagy-Related Long Non-Coding RNA Signature to Predict Prognosis and Therapeutic Response in Esophageal Squamous Cell Carcinoma. Int. J. Gen. Med. 2021, 14, 8325–8339. [Google Scholar] [CrossRef]
- Pang, J.; Pan, H.; Yang, C.; Meng, P.; Xie, W.; Li, J.; Li, Y.; Xiao, S.Y. Prognostic Value of Immune-Related Multi-IncRNA Signatures Associated with Tumor Microenvironment in Esophageal Cancer. Front. Genet. 2021, 12, 722601. [Google Scholar] [CrossRef] [PubMed]
- Zhou, R.S.; Zhang, E.X.; Sun, Q.F.; Ye, Z.J.; Liu, J.W.; Zhou, D.H.; Tang, Y. Integrated analysis of lncRNA-miRNA-mRNA ceRNA network in squamous cell carcinoma of tongue. BMC Cancer 2019, 19, 779. [Google Scholar] [CrossRef] [PubMed]
- Yu, G.; Wang, L.G.; Han, Y.; He, Q.Y. clusterProfiler: An R package for comparing biological themes among gene clusters. Omics 2012, 16, 284–287. [Google Scholar] [CrossRef] [PubMed]
- Geeleher, P.; Cox, N.J.; Huang, R.S. Clinical drug response can be predicted using baseline gene expression levels and in vitrodrug sensitivity in cell lines. Genome Biol. 2014, 15, R47. [Google Scholar] [CrossRef] [PubMed]
- Geeleher, P.; Cox, N.; Huang, R.S. pRRophetic: An R package for prediction of clinical chemotherapeutic response from tumor gene expression levels. PLoS ONE 2014, 9, e107468. [Google Scholar] [CrossRef] [PubMed]
- Yang, W.; Soares, J.; Greninger, P.; Edelman, E.J.; Lightfoot, H.; Forbes, S.; Bindal, N.; Beare, D.; Smith, J.A.; Thompson, I.R.; et al. Genomics of Drug Sensitivity in Cancer (GDSC): A resource for therapeutic biomarker discovery in cancer cells. Nucleic Acids Res. 2013, 41, D955–D961. [Google Scholar] [CrossRef] [Green Version]
- Hanahan, D.; Weinberg, R.A. Hallmarks of cancer: The next generation. Cell 2011, 144, 646–674. [Google Scholar] [PubMed]
- Feng, Q.; Zhang, H.; Yao, D.; Chen, W.D.; Wang, Y.D. Emerging Role of Non-Coding RNAs in Esophageal Squamous Cell Carcinoma. Int. J. Mol. Sci. 2019, 21, 258. [Google Scholar] [CrossRef]
- Deng, H.Y.; Wang, Y.C.; Ni, P.Z.; Lin, Y.D.; Chen, L.Q. Long noncoding RNAs are novel potential prognostic biomarkers for esophageal squamous cell carcinoma: An overview. J. Thorac. Dis. 2016, 8, E653–E659. [Google Scholar] [CrossRef]
- Li, Z.; Yao, Q.; Zhao, S.; Wang, Y.; Li, Y.; Wang, Z. Comprehensive analysis of differential co-expression patterns reveal transcriptional dysregulation mechanism and identify novel prognostic lncRNAs in esophageal squamous cell carcinoma. Onco Targets Ther. 2017, 10, 3095–3105. [Google Scholar] [CrossRef]
- Kern, F.; Niault, T.; Baccarini, M. Ras and Raf pathways in epidermis development and carcinogenesis. Br. J. Cancer 2011, 104, 229–234. [Google Scholar] [CrossRef] [PubMed]
- Xu, M.L.; Liu, T.C.; Dong, F.X.; Meng, L.X.; Ling, A.X.; Liu, S. Exosomal lncRNA LINC01711 facilitates metastasis of esophageal squamous cell carcinoma via the miR-326/FSCN1 axis. Aging 2021, 13, 19776–19788. [Google Scholar] [CrossRef]
- Li, W.; Liu, J.; Zhao, H. Identification of a nomogram based on long non-coding RNA to improve prognosis prediction of esophageal squamous cell carcinoma. Aging 2020, 12, 1512–1526. [Google Scholar] [CrossRef] [PubMed]
- Vishnubalaji, R.; Alajez, N.M. Epigenetic regulation of triple negative breast cancer (TNBC) by TGF-β signaling. Sci. Rep. 2021, 11, 15410. [Google Scholar] [CrossRef] [PubMed]
- Ilieva, M.; Miller, H.E.; Agarwal, A.; Paulus, G.K.; Madsen, J.H.; Bishop, A.J.R.; Kauppinen, S.; Uchida, S. FibroDB: Expression Analysis of Protein-Coding and Long Non-Coding RNA Genes in Fibrosis. Noncoding RNA 2022, 8, 13. [Google Scholar] [CrossRef] [PubMed]


Publisher’s Note: MDPI stays neutral with regard to jurisdictional claims in published maps and institutional affiliations. |
© 2022 by the authors. Licensee MDPI, Basel, Switzerland. This article is an open access article distributed under the terms and conditions of the Creative Commons Attribution (CC BY) license (https://creativecommons.org/licenses/by/4.0/).
Share and Cite
Cao, S.; Wang, X.; Liu, X.; Li, J.; Duan, L.; Gao, Z.; Lun, S.; Zhu, Y.; Yang, H.; Zhang, H.; et al. Integrative Analysis of Angiogenesis-Related Long Non-Coding RNA and Identification of a Six-DEARlncRNA Signature Associated with Prognosis and Therapeutic Response in Esophageal Squamous Cell Carcinoma. Cancers 2022, 14, 4195. https://doi.org/10.3390/cancers14174195
Cao S, Wang X, Liu X, Li J, Duan L, Gao Z, Lun S, Zhu Y, Yang H, Zhang H, et al. Integrative Analysis of Angiogenesis-Related Long Non-Coding RNA and Identification of a Six-DEARlncRNA Signature Associated with Prognosis and Therapeutic Response in Esophageal Squamous Cell Carcinoma. Cancers. 2022; 14(17):4195. https://doi.org/10.3390/cancers14174195
Chicago/Turabian StyleCao, Shasha, Xiaomin Wang, Xiaohui Liu, Junkuo Li, Lijuan Duan, Zhaowei Gao, Shumin Lun, Yanju Zhu, Haijun Yang, Hao Zhang, and et al. 2022. "Integrative Analysis of Angiogenesis-Related Long Non-Coding RNA and Identification of a Six-DEARlncRNA Signature Associated with Prognosis and Therapeutic Response in Esophageal Squamous Cell Carcinoma" Cancers 14, no. 17: 4195. https://doi.org/10.3390/cancers14174195
APA StyleCao, S., Wang, X., Liu, X., Li, J., Duan, L., Gao, Z., Lun, S., Zhu, Y., Yang, H., Zhang, H., & Zhou, F. (2022). Integrative Analysis of Angiogenesis-Related Long Non-Coding RNA and Identification of a Six-DEARlncRNA Signature Associated with Prognosis and Therapeutic Response in Esophageal Squamous Cell Carcinoma. Cancers, 14(17), 4195. https://doi.org/10.3390/cancers14174195