Thyroid Disease Prediction Using Selective Features and Machine Learning Techniques
Abstract
:Simple Summary
Abstract
1. Introduction
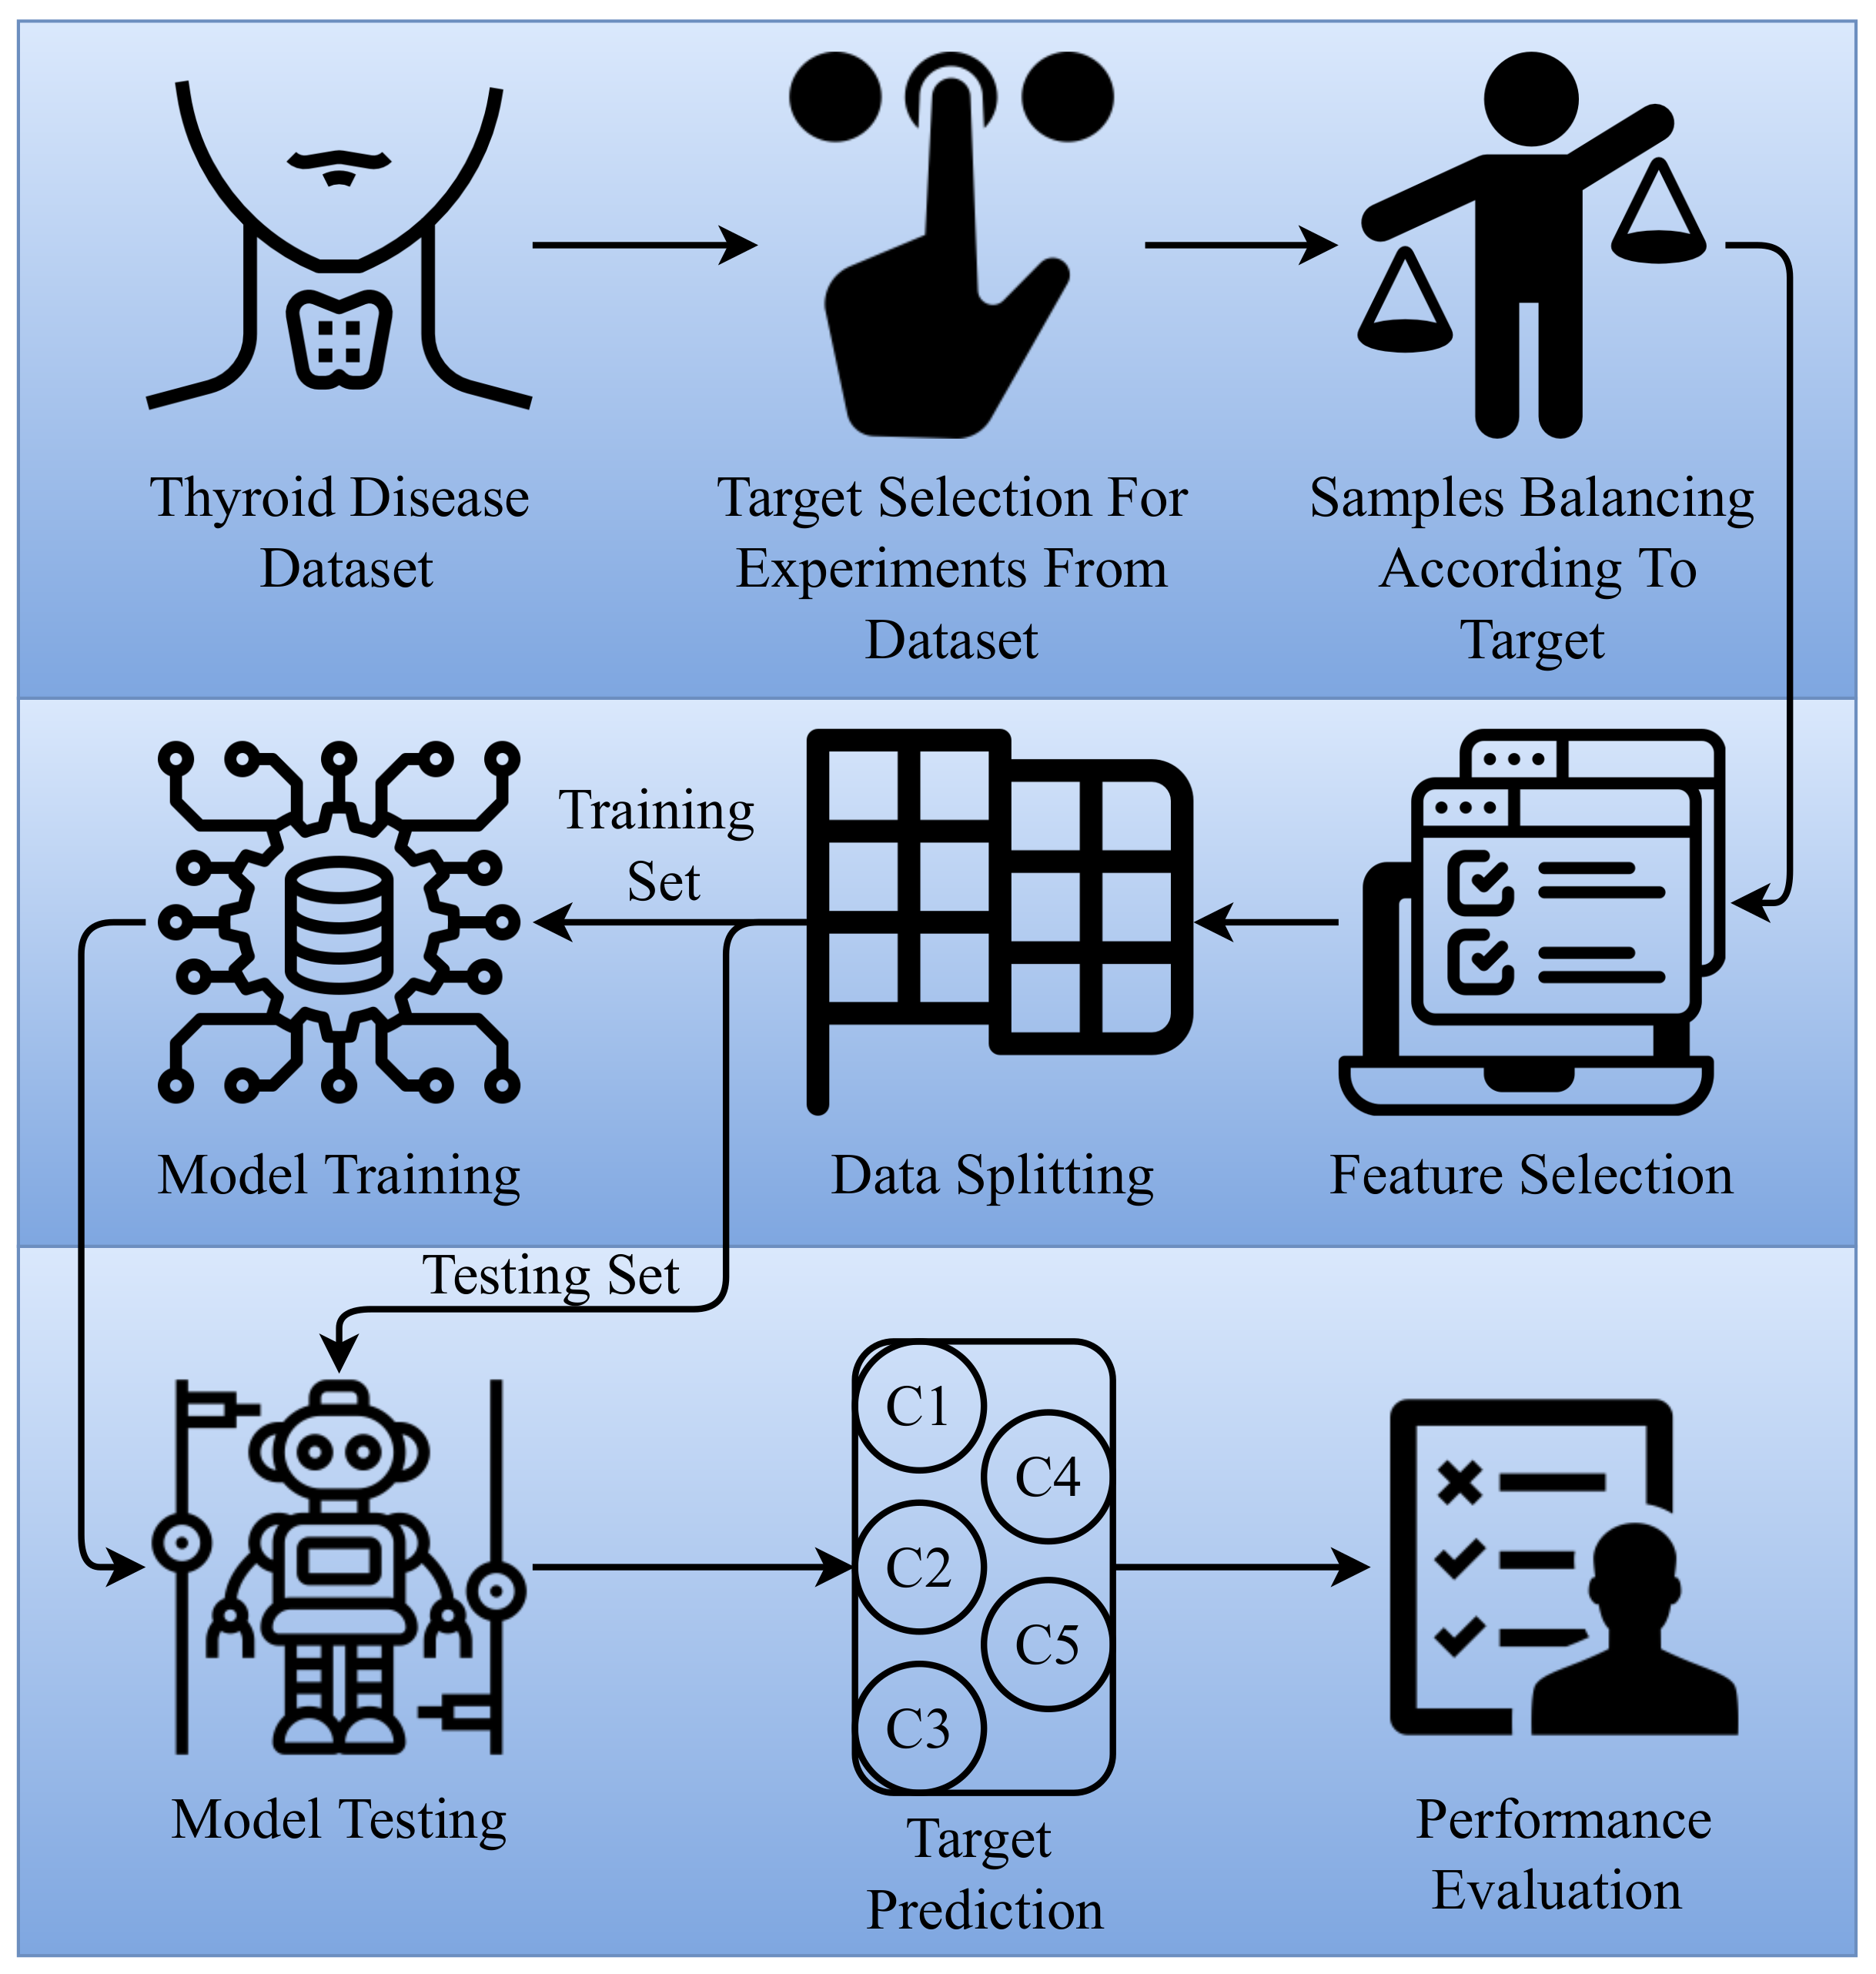
- A novel machine learning-based thyroid disease prediction approach is proposed that focus on the multi-class problem. Contrary to previous studies that focus on the binary or three-class problem, this study considers a five-class disease prediction problem.
- Four feature engineering approaches are investigated in this study to analyze their efficacy for the problem at hand. It includes forward feature selection (FFS), backward feature elimination (BFE), bidirectional feature elimination (BiDFE), and machine learning-based feature selection using an extra tree classifier.
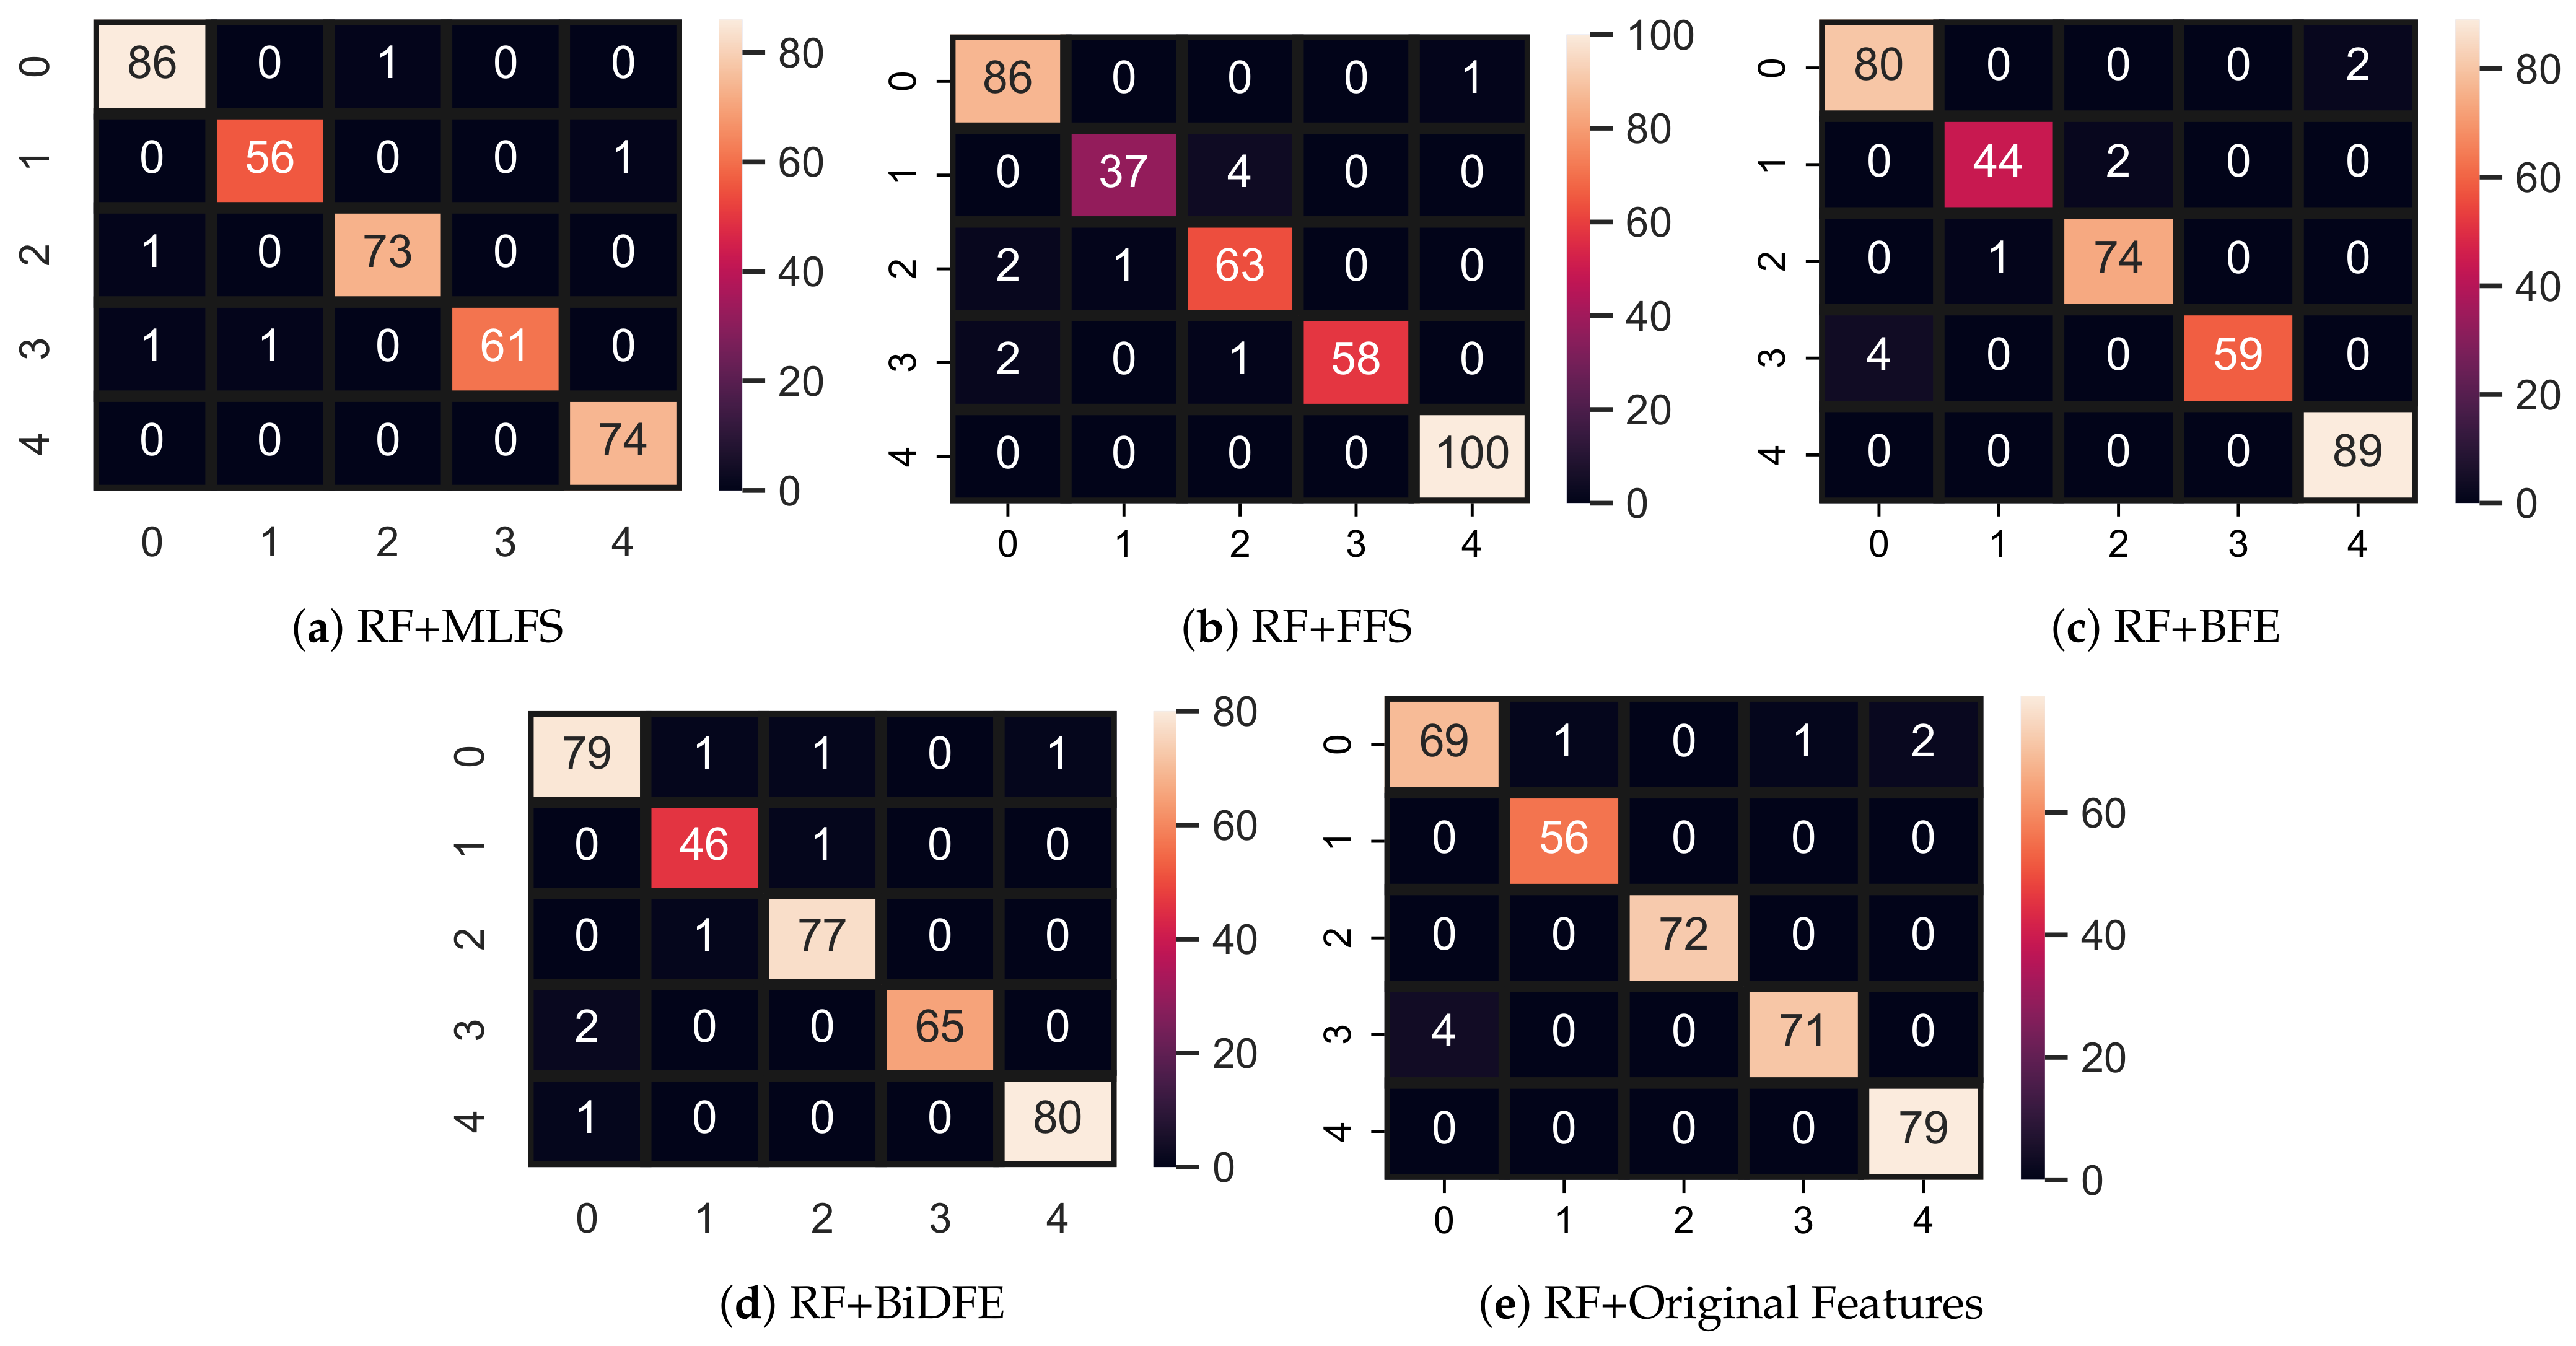
- For experiments, five machine learning models are selected based on their reported performance for disease prediction, including random forest (RF), logistic regression, support vector machine (SVM), AdaBoost (ADA), and Gradient boosting machine (GBM). Moreover, three deep learning models are adopted as well, which include convolutional neural network, long short-term memory (LSTM) network, and CNN-LSTM. Performance is evaluated in terms of confusion matrix, 10-fold cross-validation, and standard deviation, in addition to accuracy, precision, recall, and F1 score.
2. Literature Review
2.1. Thyroid Cancer Detection
2.2. Thyroid Disease Prediction
3. Proposed Methodology
3.1. Dataset Acquisition
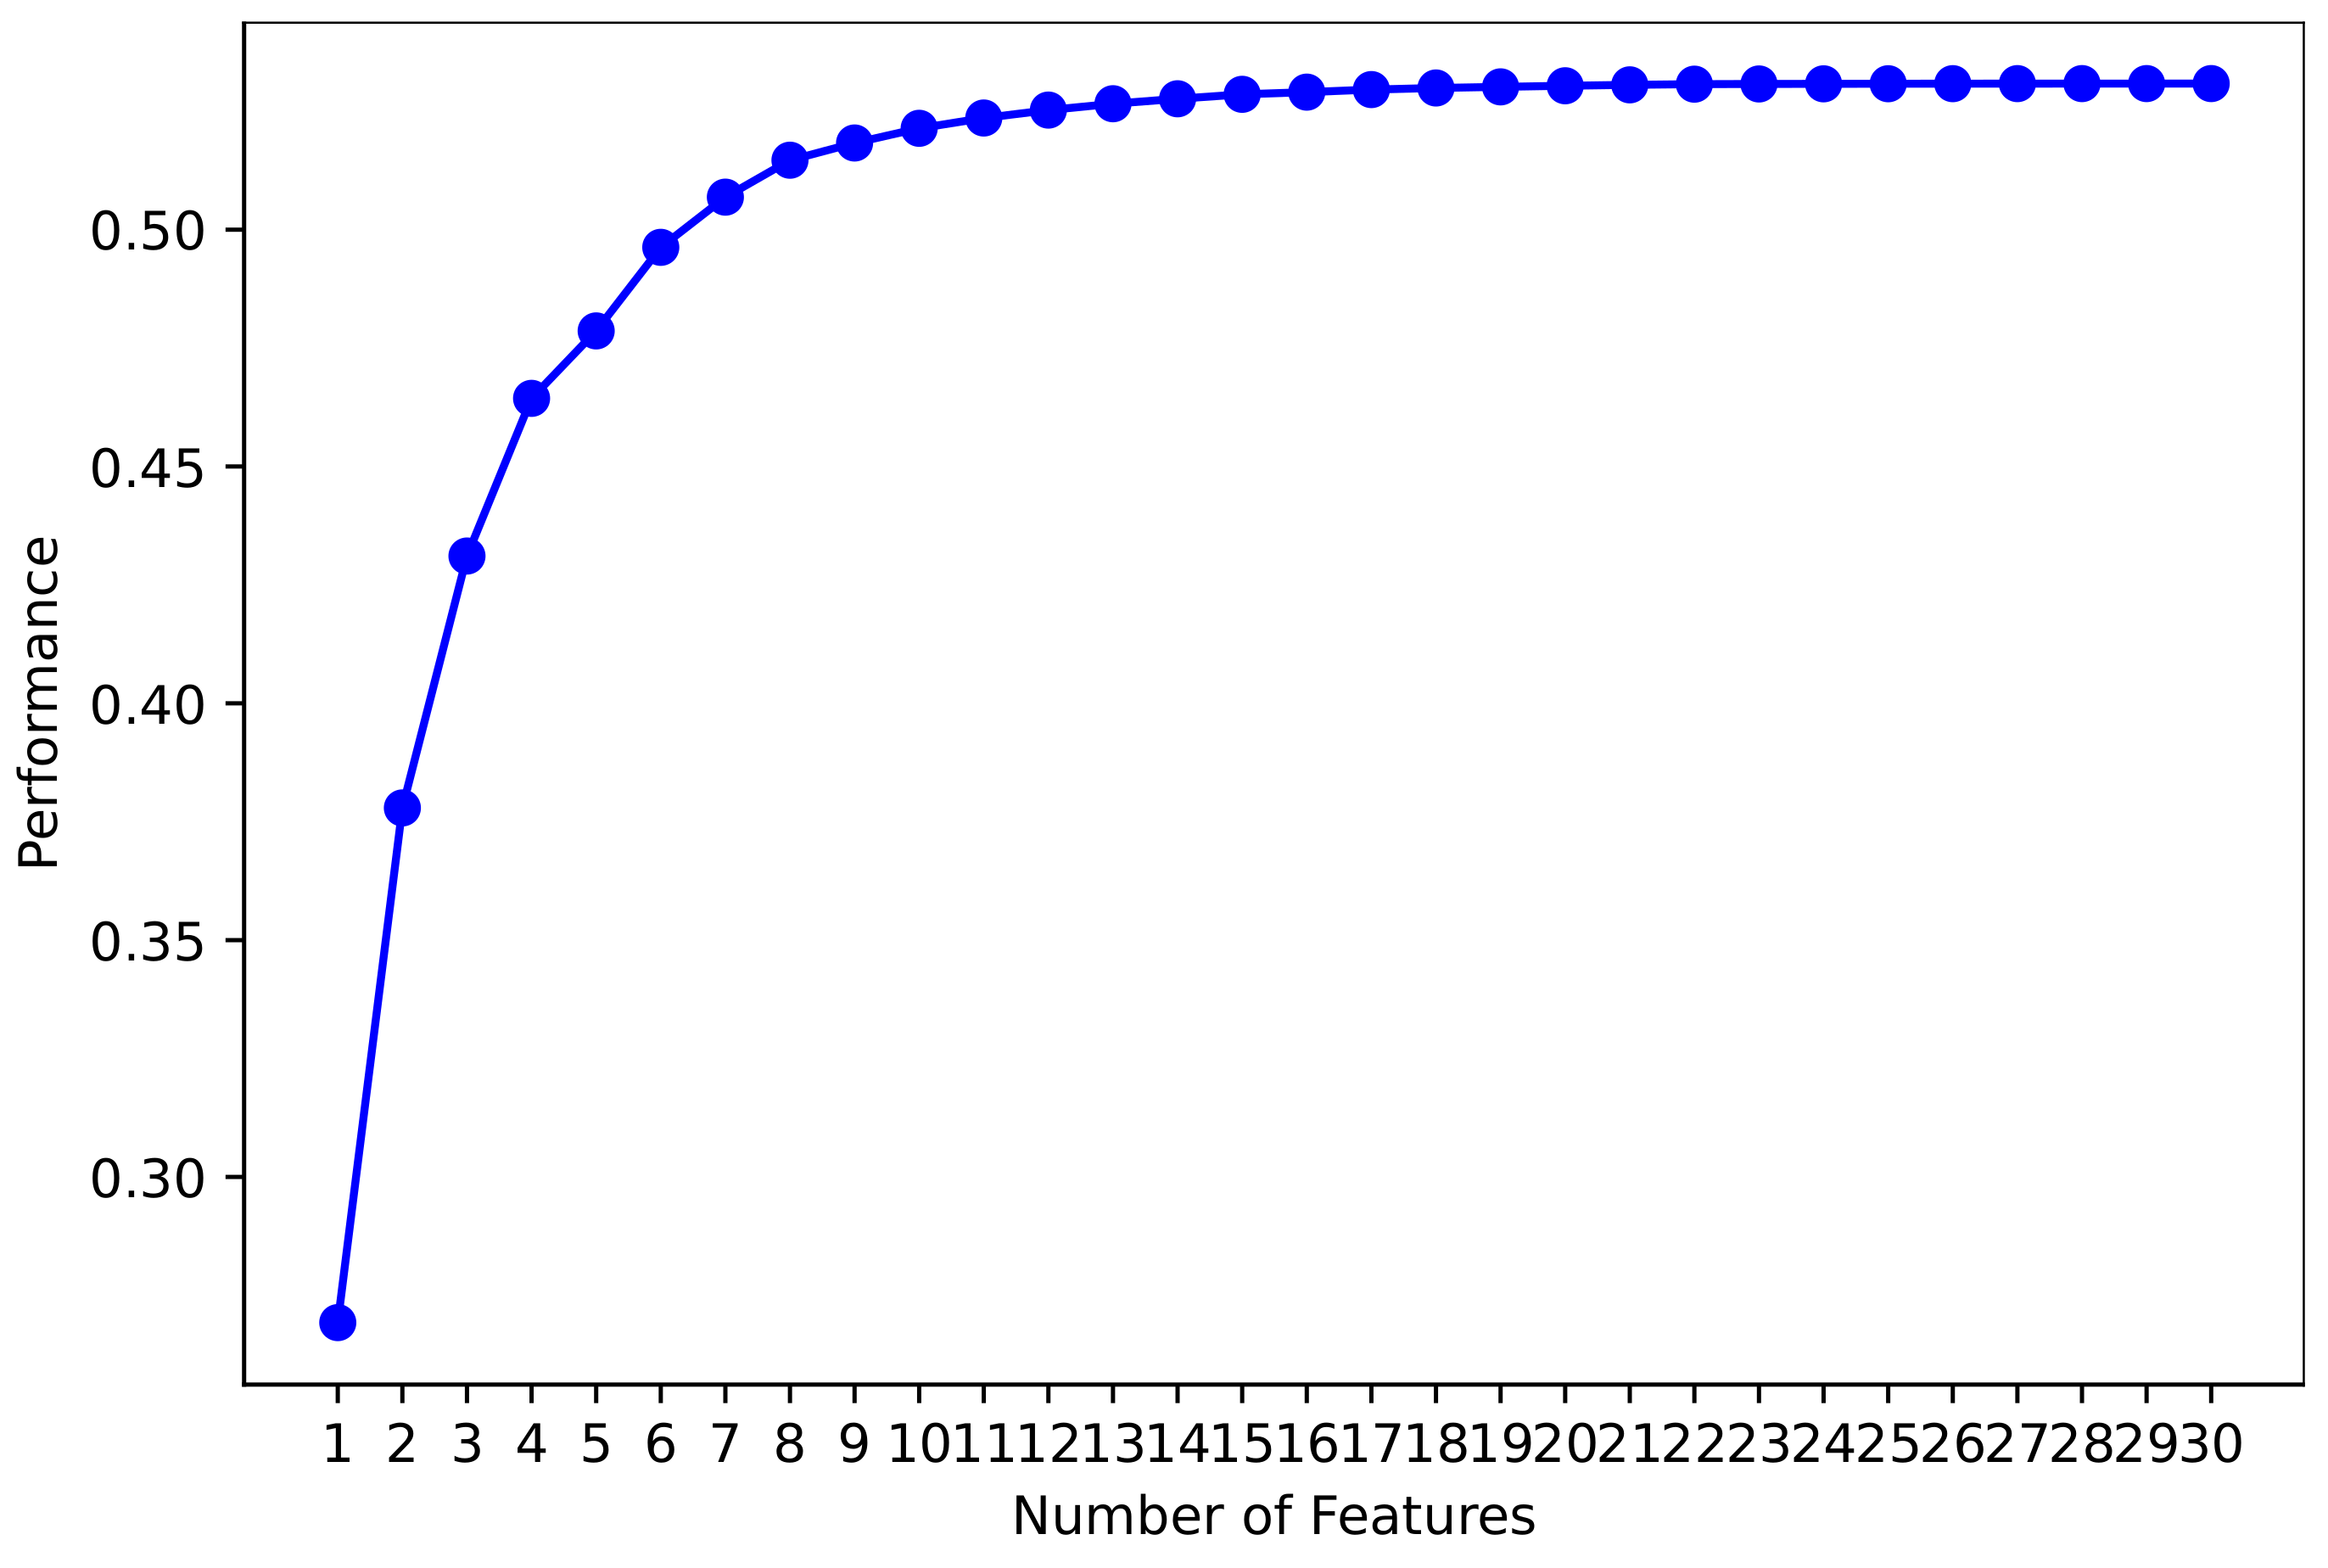
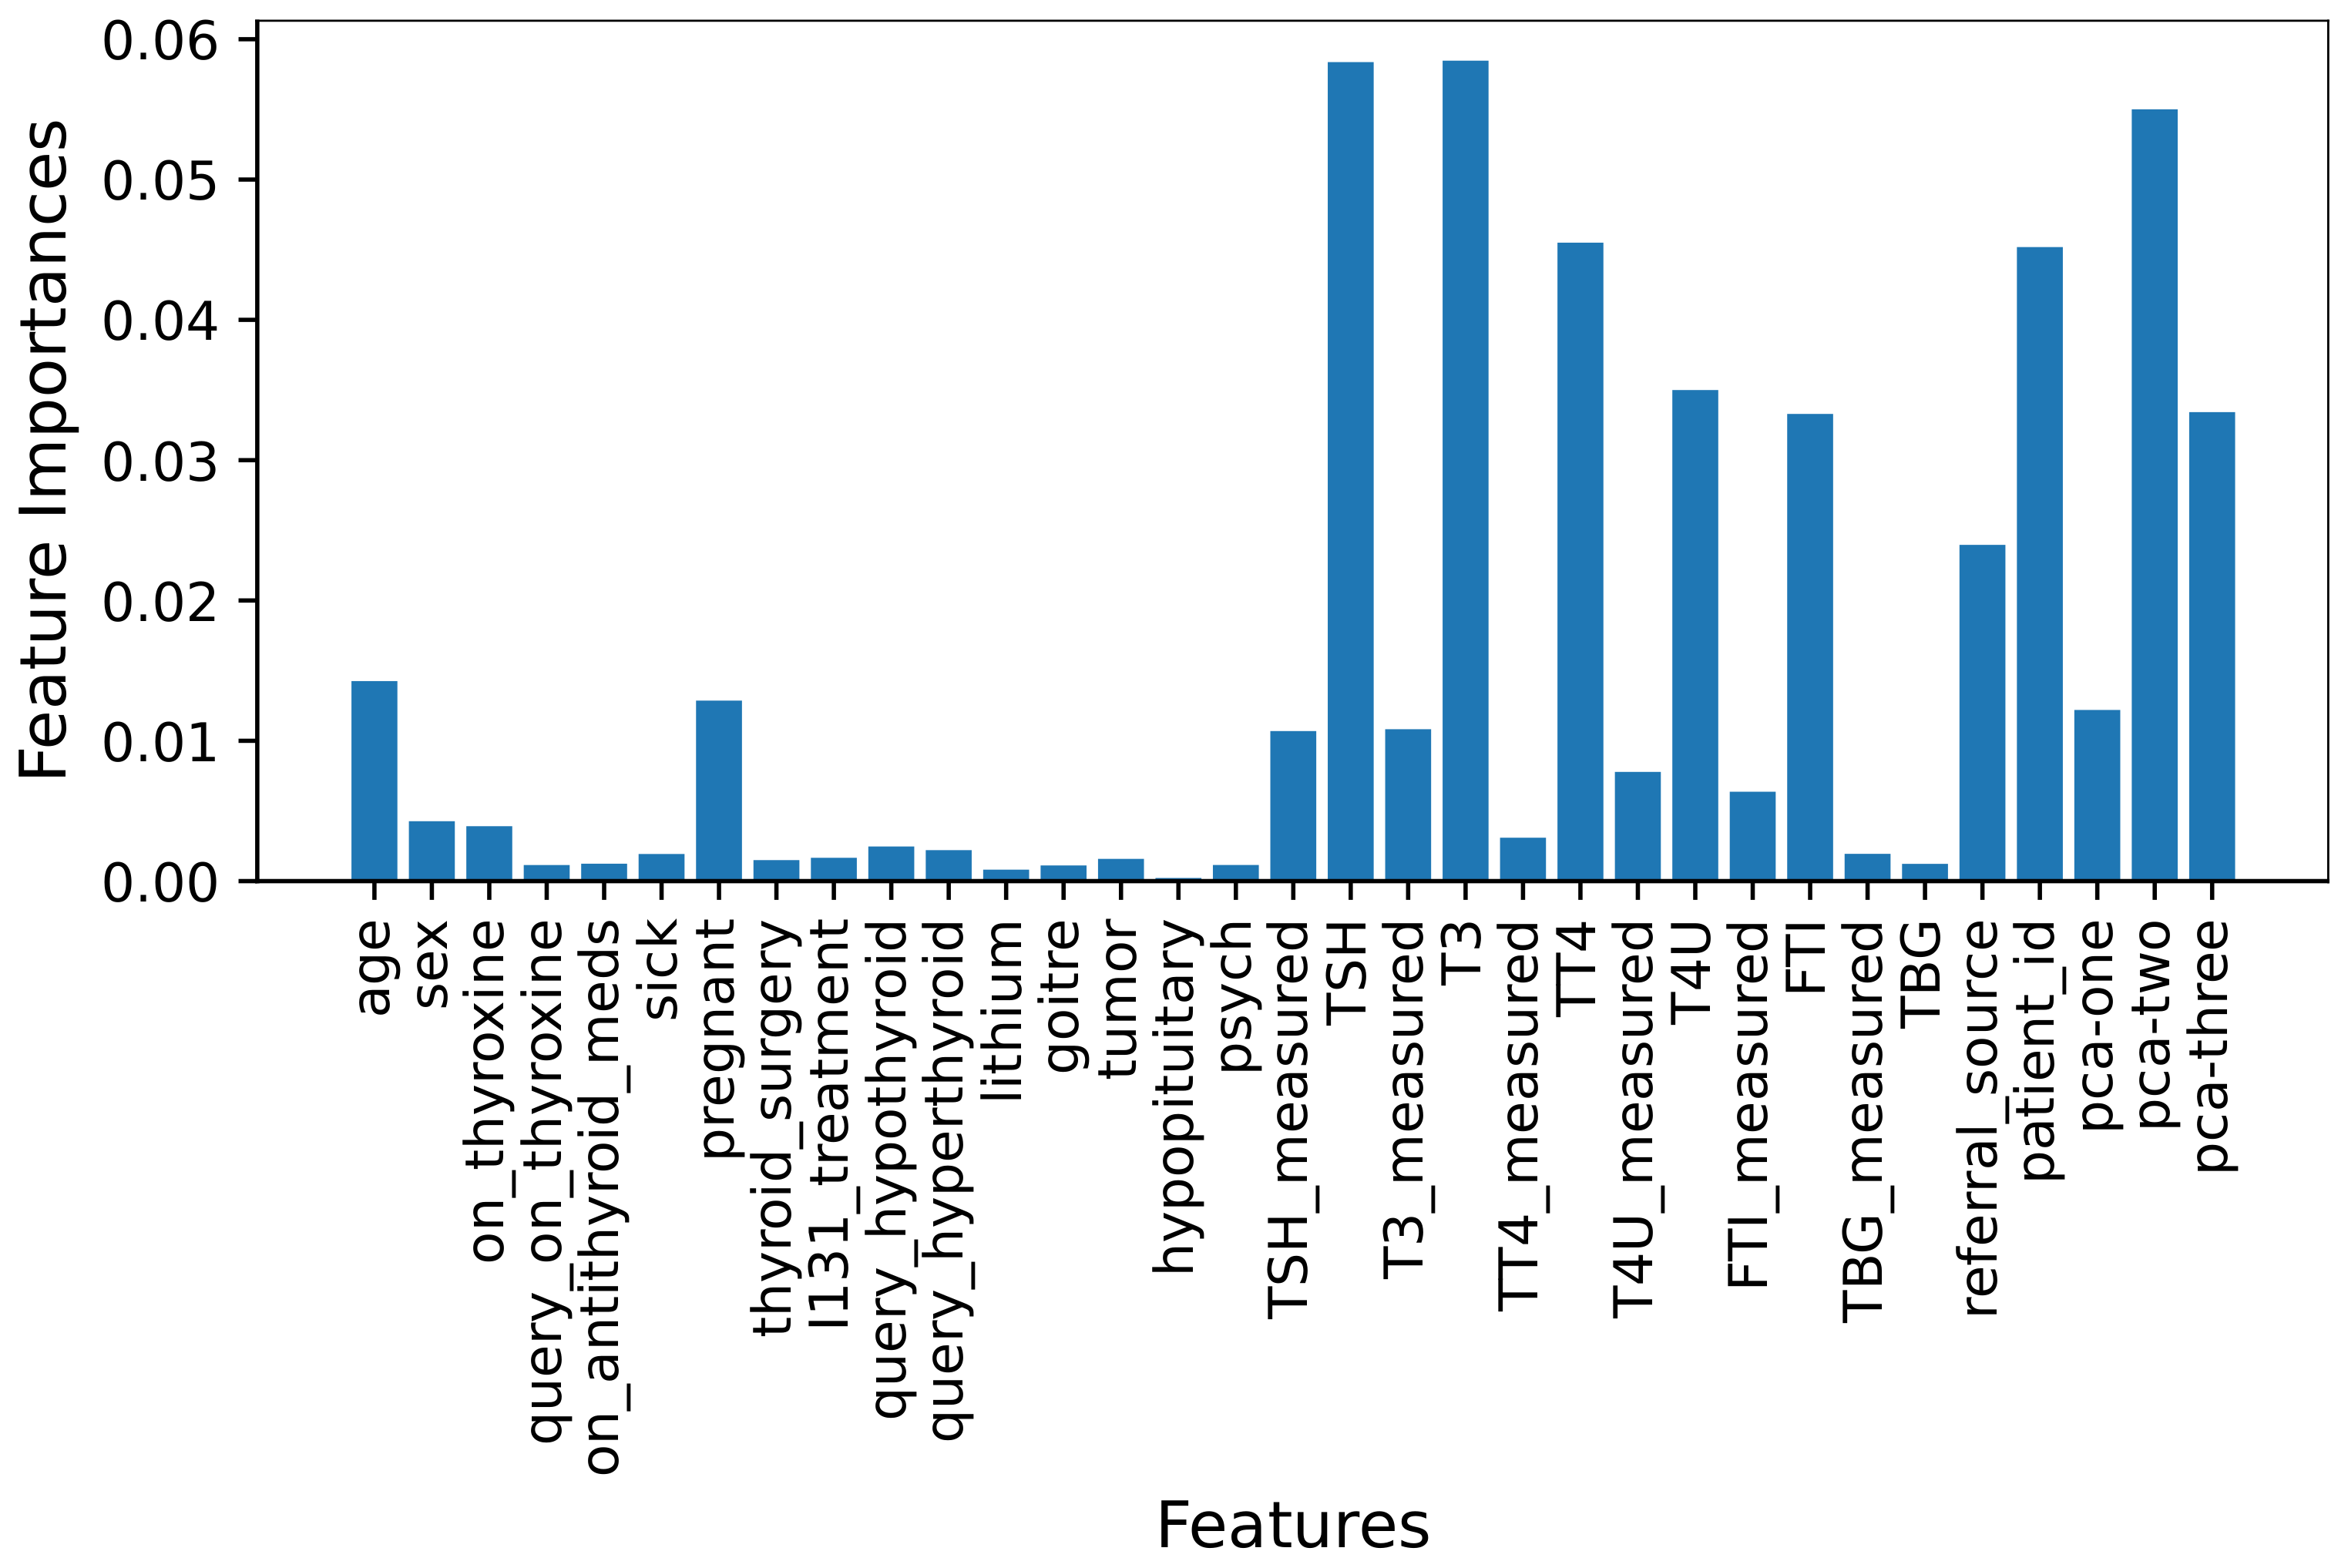
3.2. Feature Selection
3.2.1. Forward Feature Selection
- Step 1:
- Choose the significance level value (S) and start with null set [26].
- Step 2:
- Select the first feature using some criteria. For example, pick a random feature from the list of features. The below equation represents the selection of minimum p-value feature selection out of all the features used for selection.
- Step 3:
- The identified minimum p-value feature is updated to the list of all the existing minimum p-value features. The iteration k value is incremented by 1. At this point, repeat, go back to step 2, and continue the process until all the feature’s p-value is less than the Significance level. The iterative process stops when and the k value is the total number of features.
3.2.2. Backward Feature Elimination
- Step 1:
- Start with all features to fit the model.
- Step 2:
- Identify the high p-value feature from the feature list. The high p-value feature is compared with the significance level value (S). The condition should be satisfied to consider the feature for elimination [26].
- Step 3:
- The high p-value is removed from the list and goes back to step 2 to perform the next iteration () feature elimination. When the k value is zero, the final list of features represents the selected feature list using BFE.
3.2.3. Bi-Directional Elimination
- Step 1:
- We start with an empty set. Initially, a feature is selected based on the defined criteria. We use the forward feature selection to include the features in the list [26].
- Step 2:
- The next best feature is selected using the p-value comparison. A typical forward feature selection process is followed to select the essential features.
- Step 3:
- The next best feature is selected using the p-value comparison. A typical forward feature selection process is followed to choose the next feature; then backward feature elimination process kicks in to eliminate any selected features that are unimportant. We can go back to step 2 to repeat this process and continue until the k value reaches the total number of features count.
3.2.4. Machine Learning Feature Selection
3.3. Machine Learning Models
4. Results and Discussion
4.1. Results Using Original Feature Set
4.2. Performance of Models with FFS
4.3. Results Using BFE Features
4.4. Models’ Performance Using BiDFE Features
4.5. Performance of Models Using MLFS Features
4.6. K-Fold Cross-Validation for Models
4.7. Deep Learning Models Results
4.8. Limitations of Current Study
4.9. Comparison with Other Studies
4.10. Discussion on Hyperthyroidism and Hypothyroidism
5. Conclusions
Author Contributions
Funding
Institutional Review Board Statement
Informed Consent Statement
Data Availability Statement
Conflicts of Interest
References
- Chaubey, G.; Bisen, D.; Arjaria, S.; Yadav, V. Thyroid disease prediction using machine learning approaches. Natl. Acad. Sci. Lett. 2021, 44, 233–238. [Google Scholar] [CrossRef]
- Ioniţă, I.; Ioniţă, L. Prediction of thyroid disease using data mining techniques. BRAIN Broad Res. Artif. Intell. Neurosci. 2016, 7, 115–124. [Google Scholar]
- Webster, A.; Wyatt, S. Health, Technology and Society; Springer: Berlin/Heidelberg, Germany, 2020. [Google Scholar]
- Hong, L.; Luo, M.; Wang, R.; Lu, P.; Lu, W.; Lu, L. Big data in health care: Applications and challenges. Data Inf. Manag. 2018, 2, 175–197. [Google Scholar] [CrossRef]
- Association, A.T. General Information/Press Room|American Thyroid Association. Available online: https://www.thyroid.org/media-main/press-room/ (accessed on 7 April 2022).
- Chen, D.; Hu, J.; Zhu, M.; Tang, N.; Yang, Y.; Feng, Y. Diagnosis of thyroid nodules for ultrasonographic characteristics indicative of malignancy using random forest. BioData Min. 2020, 13, 14. [Google Scholar] [CrossRef] [PubMed]
- Kwon, M.R.; Shin, J.; Park, H.; Cho, H.; Hahn, S.; Park, K. Radiomics study of thyroid ultrasound for predicting BRAF mutation in papillary thyroid carcinoma: Preliminary results. Am. J. Neuroradiol. 2020, 41, 700–705. [Google Scholar] [CrossRef] [PubMed]
- Idarraga, A.J.; Luong, G.; Hsiao, V.; Schneider, D.F. False Negative Rates in Benign Thyroid Nodule Diagnosis: Machine Learning for Detecting Malignancy. J. Surg. Res. 2021, 268, 562–569. [Google Scholar] [CrossRef] [PubMed]
- Garcia de Lomana, M.; Weber, A.G.; Birk, B.; Landsiedel, R.; Achenbach, J.; Schleifer, K.J.; Mathea, M.; Kirchmair, J. In silico models to predict the perturbation of molecular initiating events related to thyroid hormone homeostasis. Chem. Res. Toxicol. 2020, 34, 396–411. [Google Scholar] [CrossRef]
- Leng, L.; Li, M.; Kim, C.; Bi, X. Dual-source discrimination power analysis for multi-instance contactless palmprint recognition. Multimed. Tools Appl. 2017, 76, 333–354. [Google Scholar] [CrossRef]
- Razia, S.; SwathiPrathyusha, P.; Krishna, N.V.; Sumana, N.S. A Comparative study of machine learning algorithms on thyroid disease prediction. Int. J. Eng. Technol. 2018, 7, 315. [Google Scholar] [CrossRef]
- Shankar, K.; Lakshmanaprabu, S.; Gupta, D.; Maseleno, A.; De Albuquerque, V.H.C. Optimal feature-based multi-kernel SVM approach for thyroid disease classification. J. Supercomput. 2020, 76, 1128–1143. [Google Scholar] [CrossRef]
- Das, R.; Saraswat, S.; Chandel, D.; Karan, S.; Kirar, J.S. An AI Driven Approach for Multiclass Hypothyroidism Classification. In Proceedings of the International Conference on Advanced Network Technologies and Intelligent Computing, Varanasi, India, 17–18 December 2021; pp. 319–327. [Google Scholar]
- Riajuliislam, M.; Rahim, K.Z.; Mahmud, A. Prediction of Thyroid Disease (Hypothyroid) in Early Stage Using Feature Selection and Classification Techniques. In Proceedings of the 2021 International Conference on Information and Communication Technology for Sustainable Development (ICICT4SD), Dhaka, Bangladesh, 27–28 February 2021; pp. 60–64. [Google Scholar]
- Salman, K.; Sonuç, E. Thyroid Disease Classification Using Machine Learning Algorithms. J. Phys. Conf. Ser. IOP Publ. 2021, 1963, 012140. [Google Scholar]
- Hosseinzadeh, M.; Ahmed, O.H.; Ghafour, M.Y.; Safara, F.; Hama, H.; Ali, S.; Vo, B.; Chiang, H.S. A multiple multilayer perceptron neural network with an adaptive learning algorithm for thyroid disease diagnosis in the internet of medical things. J. Supercomput. 2021, 77, 3616–3637. [Google Scholar] [CrossRef]
- Abbad Ur Rehman, H.; Lin, C.Y.; Mushtaq, Z. Effective K-Nearest Neighbor Algorithms Performance Analysis of Thyroid Disease. J. Chin. Inst. Eng. 2021, 44, 77–87. [Google Scholar] [CrossRef]
- Mishra, S.; Tadesse, Y.; Dash, A.; Jena, L.; Ranjan, P. Thyroid disorder analysis using random forest classifier. In Intelligent and Cloud Computing; Springer: Berlin/Heidelberg, Germany, 2021; pp. 385–390. [Google Scholar]
- Alyas, T.; Hamid, M.; Alissa, K.; Faiz, T.; Tabassum, N.; Ahmad, A. Empirical Method for Thyroid Disease Classification Using a Machine Learning Approach. BioMed Res. Int. 2022, 2022, 9809932. [Google Scholar] [CrossRef]
- Jha, R.; Bhattacharjee, V.; Mustafi, A. Increasing the Prediction Accuracy for Thyroid Disease: A Step towards Better Health for Society. Wirel. Pers. Commun. 2022, 122, 1921–1938. [Google Scholar] [CrossRef]
- Sankar, S.; Potti, A.; Chandrika, G.N.; Ramasubbareddy, S. Thyroid Disease Prediction Using XGBoost Algorithms. J. Mob. Multimed. 2022, 18, 1–18. [Google Scholar] [CrossRef]
- UCI. UCI Machine Learning Repository: Thyroid Disease Data Set. Available online: https://archive.ics.uci.edu/ml/datasets/thyroid+disease (accessed on 7 March 2022).
- Wajner, S.M.; Maia, A.L. New insights toward the acute non-thyroidal illness syndrome. Front. Endocrinol. 2012, 3, 8. [Google Scholar] [CrossRef]
- Cai, J.; Luo, J.; Wang, S.; Yang, S. Feature selection in machine learning: A new perspective. Neurocomputing 2018, 300, 70–79. [Google Scholar] [CrossRef]
- Solorio-Fernández, S.; Carrasco-Ochoa, J.A.; Martínez-Trinidad, J.F. A review of unsupervised feature selection methods. Artif. Intell. Rev. 2020, 53, 907–948. [Google Scholar] [CrossRef]
- Tech, G. FeatureSelection. Available online: https://faculty.cc.gatech.edu/~bboots3/CS4641-Fall2018/Lecture16/16_FeatureSelection.pdf (accessed on 7 May 2022).
- Baby, D.; Devaraj, S.J.; Hemanth, J.; Anishin Raj, M.M. Leukocyte classification based on feature selection using extra trees classifier: Atransfer learning approach. Turk. J. Electr. Eng. Comput. Sci. 2021, 29, 2742–2757. [Google Scholar] [CrossRef]
- Leng, L.; Zhang, J. Palmhash code vs. palmphasor code. Neurocomputing 2013, 108, 1–12. [Google Scholar] [CrossRef]
- Rustam, F.; Ishaq, A.; Munir, K.; Almutairi, M.; Aslam, N.; Ashraf, I. Incorporating CNN Features for Optimizing Performance of Ensemble Classifier for Cardiovascular Disease Prediction. Diagnostics 2022, 12, 1474. [Google Scholar] [CrossRef]
| Authors | Year | Sample Size | Dataset Source | Model | Classes | Evaluation Metrics | Results |
|---|---|---|---|---|---|---|---|
| [9] | 2020 | - | ToxCast | LR RF SVM XGB ANN | 2 | F1-score | (TPO) XGB-83% and (TR) RF-81% |
| [11] | 2018 | 7200 samples, 21 attributes | UCI | SVM, Multiple Linear Regression(MLR), NB and DT | 2 | Accuracy | MLR 91.59% SVM 96.04% Naive Bayes 6.31% Decision Trees 99.23% |
| [12] | 2020 | 7547, 30 features | UCI | multi-kernel SVM | 3 | Accuracy, Sensitivity, and Specificity | Accuracy (97.49%), Sensitivity (99.05%), and Specificity (94.5%) |
| [13] | 2021 | 3771 samples, 30 attributes | UCI | DT, KNN, RF, and SVM | 4 | Accuracy | KNN 98.3% SVM 96.1% DT 99.5% RF 99.81% |
| [14] | 2021 | 519 samples | diagnostic center Dhaka, Bangladesh | SVM, DT, RF, LR, and NB. Recursive Feature Selection (RFE), Univariate Feature Selection (UFS) and PCA | 4 | Accuracy | RFE, SVM, DT, RF, LR accuracy—99.35% |
| [15] | 2021 | 1250 with 17 attributes | external hospitals and laboratories | SVM, RF, DT, NB, LR, KNN, MLP, linear discriminant analysis (LDA) and DT | 3 | Accuracy | DT 90.13, SVM 92.53 RF 91.2 NB 90.67 LR 91.73 LDA 83.2 KNN 91.47 MLP 96.4 |
| [16] | 2021 | 7200 patients, with 21 features | UCI | multiple MLP | 3 | Accuracy | multiple MLP 99% |
| [17] | 2021 | 690 samples, 13 features | datasets from KEEL repo and District Headquarters teaching hospital, Pakistan | KNN without feature selection, KNN using L1-based feature selection, and KNN using chi-square-based feature selection | 3 | Accuracy | KNN 98% |
| [18] | 2021 | 3772 and 30 attributes | UCI | RF, sequential minimal optimization (SMO), DT, and K-star classifier | 2 | Accuracy | K = 6, RF 99.44%, DT 98.97%, K-star 94.67%, and SMO 93.67% |
| [19] | 2022 | 3163 | UCI | DT, RF, KNN, and ANN | 2 | Accuracy | Best performance Accuracy RF 94.8% |
| [21] | 2022 | 215 with 5 features | UCI | KNN, XGB, LR, DT | 3 | Accuracy | KNN 81.25 XGBoost 87.5 LR 96.875 DT 98.59 |
| [20] | 2022 | 3152, 23 features | UCI | DNN | 2 | Accuracy | Accuracy 99.95% |
| Features | Sample Count |
|---|---|
| 31 | 9172 |
| Attribute | Description | Data Type |
|---|---|---|
| age | age of the patient | (int) |
| sex | sex patient identifies | (str) |
| on_thyroxine | whether patient is on thyroxine | (bool) |
| query on thyroxine | whether patient is on thyroxine | (bool) |
| on antithyroid meds | whether the patient is on antithyroid meds | (bool) |
| sick | whether patient is sick | (bool) |
| pregnant | whether patient is pregnant | (bool) |
| thyroid_surgery | whether patient has undergone thyroid surgery | (bool) |
| I131_treatment | whether patient is undergoing I131 treatment | (bool) |
| query_hypothyroid | whether the patient believes they have hypothyroid | (bool) |
| query_hyperthyroid | whether the patient believes they have hyperthyroid | (bool) |
| lithium | whether patient * lithium | (bool) |
| goitre | whether patient has goitre | (bool) |
| tumor | whether patient has tumor | (bool) |
| hypopituitary | whether patient * hyperpituitary gland | (float) |
| psych | whether patient * psych | (bool) |
| TSH_measured | whether TSH was measured in the blood | (bool) |
| TSH | TSH level in blood from lab work | (float) |
| T3_measured | whether T3 was measured in the blood | (bool) |
| T3 | T3 level in blood from lab work | (float) |
| TT4_measured | whether TT4 was measured in the blood | (bool) |
| TT4 | TT4 level in blood from lab work | (float) |
| T4U_measured | whether T4U was measured in the blood | (bool) |
| T4U | T4U level in blood from lab work | (float) |
| FTI_measured | whether FTI was measured in the blood | (bool) |
| FTI | FTI level in blood from lab work | (float) |
| TBG_measured | whether TBG was measured in the blood | (bool) |
| TBG | TBG level in blood from lab work | (float) |
| referral_source | (str) | |
| target | hyperthyroidism medical diagnosis | (str) |
| patient_id | unique id of the patient | (str) |
| Condition | Diagnosis Class | Count |
|---|---|---|
| hyperthyroid | hyperthyroid (A) | 147 |
| T3 toxic (B) | 21 | |
| toxic goiter (C) | 6 | |
| secondary toxic (D) | 8 | |
| hypothyroid | hypothyroid (E) | 1 |
| primary hypothyroid (F) | 233 | |
| compensated hypothyroid (G) | 359 | |
| secondary hypothyroid (H) | 8 | |
| binding protein: | increased binding protein (I) | 346 |
| decreased binding protein (J) | 30 | |
| general health | concurrent non-thyroidal illness (K) | 436 |
| replacement therapy: | underreplaced (M) | 111 |
| consistent with replacement therapy (L) | 115 | |
| overreplaced (N) | 110 | |
| antithyroid treatment: | antithyroid drugs (O) | 14 |
| I131 treatment (P) | 5 | |
| surgery (Q) | 14 | |
| miscellaneous: | discordant assay results (R) | 196 |
| elevated TBG (S) | 85 | |
| elevated thyroid hormones (T) | 0 | |
| no condition | (-) | 6771 |
| Class | Prepossessed Count | Final Count |
|---|---|---|
| Normal | 6771 | 400 |
| primary hypothyroid | 233 | 233 |
| increased binding protein | 346 | 346 |
| compensated hypothyroid | 359 | 359 |
| concurrent non-thyroidal illness | 436 | 436 |
| age | sex | on_thyroxine | query_on_thyroxine | on_antithyroid_meds | sick | pregnant | thyroid_surgery |
|---|---|---|---|---|---|---|---|
| 29 | F | f | f | f | f | f | f |
| 71 | F | t | f | f | f | f | f |
| 61 | M | f | f | f | t | f | f |
| 88 | F | f | f | f | f | f | f |
| I131_treatment | query_hypothyroid | query_hyperthyroid | lithium | goitre | tumor | hypopituitary | psych |
| f | t | f | f | f | f | f | f |
| f | f | f | f | f | f | f | f |
| f | f | f | f | f | f | f | f |
| f | f | f | f | f | f | f | f |
| TSH_measured | TSH | T3_measured | T3 | TT4_measured | TT4 | T4U_measured | T4U |
| t | 0.3 | f | f | f | |||
| t | 0.05 | f | t | 126 | t | 1.38 | |
| t | 9.799999 | t | 1.2 | t | 114 | t | 0.84 |
| t | 0.2 | t | 0.4 | t | 98 | t | 0.73 |
| FTI_measured | FTI | TBG_measured | TBG | referral_source | target | patient_id | |
| f | f | other | - | ||||
| t | 91 | f | other | I | |||
| t | 136 | f | other | G | |||
| t | 134 | f | other | K |
| Class | Hyper-Parameters | Tuning Range |
|---|---|---|
| LR | solver = liblinear, C = 5.0 | solver = {liblinear, saga, sag}, C = {1.0 to 8.0} |
| SVM | kernel = ‘linear’, C = 5.0 | kernel = {‘linear’, ‘poly’, ‘sigmoid’} C = {1.0 to 8.0} |
| RF | n_estimators = 200, max_depth = 20 | n_estimators = {10 to 300}, max_depth = {2 to 50} |
| GBM | n_estimators = 200, max_depth = 20, learning_rat = 0.5 | n_estimators = {10 to 300}, max_depth = {2 to 50}, learning_rat = {0.1 to 0.9} |
| ADA | n_estimators = 200, max_depth = 20, learning_rat = 0.5 | n_estimators = {10 to 300}, max_depth = {2 to 50}, learning_rat = {0.1 to 0.9} |
| Target Class | Training | Testing | Total |
|---|---|---|---|
| “_” (0) | 325 | 75 | 400 |
| F (1) | 190 | 43 | 233 |
| G (2) | 280 | 79 | 359 |
| I (3) | 271 | 75 | 346 |
| K (4) | 353 | 83 | 436 |
| Model | Accuracy | Precision | Recall | F1 Score |
|---|---|---|---|---|
| RF | 0.98 | 0.98 | 0.98 | 0.98 |
| GBM | 0.97 | 0.98 | 0.98 | 0.98 |
| ADA | 0.97 | 0.97 | 0.97 | 0.97 |
| LR | 0.85 | 0.85 | 0.85 | 0.85 |
| SVM | 0.85 | 0.85 | 0.85 | 0.85 |
| Model | Accuracy | Precision | Recall | F1 Score |
|---|---|---|---|---|
| RF | 0.97 | 0.97 | 0.96 | 0.96 |
| GBM | 0.97 | 0.97 | 0.96 | 0.96 |
| ADA | 0.93 | 0.92 | 0.92 | 0.92 |
| LR | 0.83 | 0.83 | 0.82 | 0.82 |
| SVM | 0.92 | 0.92 | 0.92 | 0.92 |
| Model | Accuracy | Precision | Recall | F1 Score |
|---|---|---|---|---|
| RF | 0.96 | 0.96 | 0.95 | 0.95 |
| GBM | 0.92 | 0.92 | 0.91 | 0.91 |
| ADA | 0.83 | 0.84 | 0.83 | 0.83 |
| LR | 0.83 | 0.83 | 0.82 | 0.82 |
| SVM | 0.92 | 0.92 | 0.92 | 0.92 |
| Model | Accuracy | Precision | Recall | F1 Score |
|---|---|---|---|---|
| RF | 0.98 | 0.98 | 0.98 | 0.98 |
| GBM | 0.96 | 0.96 | 0.96 | 0.96 |
| ADA | 0.84 | 0.87 | 0.85 | 0.84 |
| LR | 0.81 | 0.83 | 0.81 | 0.81 |
| SVM | 0.92 | 0.92 | 0.92 | 0.92 |
| Model | Accuracy | Precision | Recall | F1 Score |
|---|---|---|---|---|
| RF | 0.99 | 0.99 | 0.99 | 0.99 |
| GBM | 0.98 | 0.98 | 0.98 | 0.98 |
| ADA | 0.97 | 0.97 | 0.97 | 0.97 |
| LR | 0.87 | 0.88 | 0.87 | 0.87 |
| SVM | 0.92 | 0.92 | 0.92 | 0.92 |
| Feature | Model | Accuracy | SD | Time |
|---|---|---|---|---|
| Original | RF | 0.94 | +/−0.10 | 1.689 |
| GBM | 0.93 | +/−0.13 | 3.831 | |
| ADA | 0.93 | +/−0.08 | 1.758 | |
| LR | 0.84 | +/−0.13 | 0.330 | |
| SVM | 0.88 | +/−0.12 | 243.126 | |
| FS | RF | 0.93 | +/−0.10 | 0.440 |
| GBM | 0.90 | +/−0.14 | 1.349 | |
| ADA | 0.89 | +/−0.08 | 0.743 | |
| LR | 0.78 | +/−0.13 | 0.330 | |
| SVM | 0.90 | +/−0.15 | 210.65 | |
| BE | RF | 0.93 | +/−0.11 | 0.601 |
| GBM | 0.90 | +/−0.14 | 1.380 | |
| ADA | 0.87 | +/−0.07 | 0.635 | |
| LR | 0.78 | +/−0.13 | 0.111 | |
| SVM | 0.90 | +/−0.15 | 173.80 | |
| BiDFE | RF | 0.93 | +/−0.03 | 0.677 |
| GBM | 0.90 | +/−0.02 | 8.733 | |
| ADA | 0.89 | +/−0.06 | 0.617 | |
| LR | 0.78 | +/−0.06 | 0.111 | |
| SVM | 0.90 | +/−0.04 | 42.496 | |
| ML FS | RF | 0.94 | +/−0.01 | 1.689 |
| GBM | 0.93 | +/−0.13 | 3.831 | |
| ADA | 0.93 | +/−0.08 | 1.758 | |
| LR | 0.84 | +/−0.13 | 0.330 | |
| SVM | 0.91 | +/−0.13 | 365.51 |
| Model | Hyperparameters |
|---|---|
| LSTM | Embedding (4000, 100, input_length = …) Dropout (0.5) LSTM (128) Dense (5, activation = ‘softmax’) |
| CNN | Embedding (4000, 100, input_length = …) Conv1D (128, 5, activation = ‘relu’) MaxPooling1D (pool_size = 5) Activation (‘relu’) Dropout (rate = 0.5) Flatten() Dense (5, activation = ‘softmax’) |
| CNN-LSTM | Embedding (4000, 100, input_length = …) Conv1D (128, 5, activation = ‘relu’) MaxPooling1D (pool_size = 5) LSTM (100) Dense (5, activation = ‘softmax’) |
| loss = ‘categorical_crossentropy’, optimizer = ‘adam’, epochs = 100, batch_size = 16 | |
| Feature | Model | Accuracy | Precision | Recall | F1 Score |
|---|---|---|---|---|---|
| Original | LSTM | 0.84 | 0.84 | 0.83 | 0.83 |
| CNN | 0.93 | 0.94 | 0.92 | 0.93 | |
| CNN-LSTM | 0.90 | 0.90 | 0.88 | 0.88 | |
| FS | LSTM | 0.62 | 0.63 | 0.59 | 0.59 |
| CNN | 0.86 | 0.87 | 0.84 | 0.85 | |
| CNN-LSTM | 0.77 | 0.78 | 0.73 | 0.74 | |
| BE | LSTM | 0.57 | 0.61 | 0.54 | 0.54 |
| CNN | 0.86 | 0.87 | 0.84 | 0.84 | |
| CNN-LSTM | 0.86 | 0.87 | 0.84 | 0.85 | |
| BiDFE | LSTM | 0.83 | 0.83 | 0.80 | 0.80 |
| CNN | 0.85 | 0.84 | 0.81 | 0.82 | |
| CNN-LSTM | 0.87 | 0.88 | 0.84 | 0.86 | |
| ML FS | LSTM | 0.57 | 0.63 | 0.54 | 0.55 |
| CNN | 0.89 | 0.89 | 0.87 | 0.88 | |
| CNN-LSTM | 0.92 | 0.91 | 0.91 | 0.91 |
| Model | FFS | BFE | BiDFE | MLFS | Original |
|---|---|---|---|---|---|
| LSTM | 44.975 | 87.842 | 98.067 | 66.361 | 170.28 |
| CNN | 83.088 | 37.796 | 131.48 | 30.852 | 56.436 |
| CNN-LSTM | 150.53 | 65.992 | 214.96 | 47.922 | 97.662 |
Publisher’s Note: MDPI stays neutral with regard to jurisdictional claims in published maps and institutional affiliations. |
© 2022 by the authors. Licensee MDPI, Basel, Switzerland. This article is an open access article distributed under the terms and conditions of the Creative Commons Attribution (CC BY) license (https://creativecommons.org/licenses/by/4.0/).
Share and Cite
Chaganti, R.; Rustam, F.; De La Torre Díez, I.; Mazón, J.L.V.; Rodríguez, C.L.; Ashraf, I. Thyroid Disease Prediction Using Selective Features and Machine Learning Techniques. Cancers 2022, 14, 3914. https://doi.org/10.3390/cancers14163914
Chaganti R, Rustam F, De La Torre Díez I, Mazón JLV, Rodríguez CL, Ashraf I. Thyroid Disease Prediction Using Selective Features and Machine Learning Techniques. Cancers. 2022; 14(16):3914. https://doi.org/10.3390/cancers14163914
Chicago/Turabian StyleChaganti, Rajasekhar, Furqan Rustam, Isabel De La Torre Díez, Juan Luis Vidal Mazón, Carmen Lili Rodríguez, and Imran Ashraf. 2022. "Thyroid Disease Prediction Using Selective Features and Machine Learning Techniques" Cancers 14, no. 16: 3914. https://doi.org/10.3390/cancers14163914
APA StyleChaganti, R., Rustam, F., De La Torre Díez, I., Mazón, J. L. V., Rodríguez, C. L., & Ashraf, I. (2022). Thyroid Disease Prediction Using Selective Features and Machine Learning Techniques. Cancers, 14(16), 3914. https://doi.org/10.3390/cancers14163914


