
Identification of Immune Cell Components in Breast Tissues by a Multiparametric Flow Cytometry Approach


 , , and
Abstract
:Simple Summary
Abstract
1. Introduction
2. Materials and Methods
2.1. Patient Samples
2.2. Hematoxylin and Eosin (H&E) Staining
2.3. Breast Tissue Digestion and Flow Cytometry Analysis
2.4. Statistical Analysis
3. Results
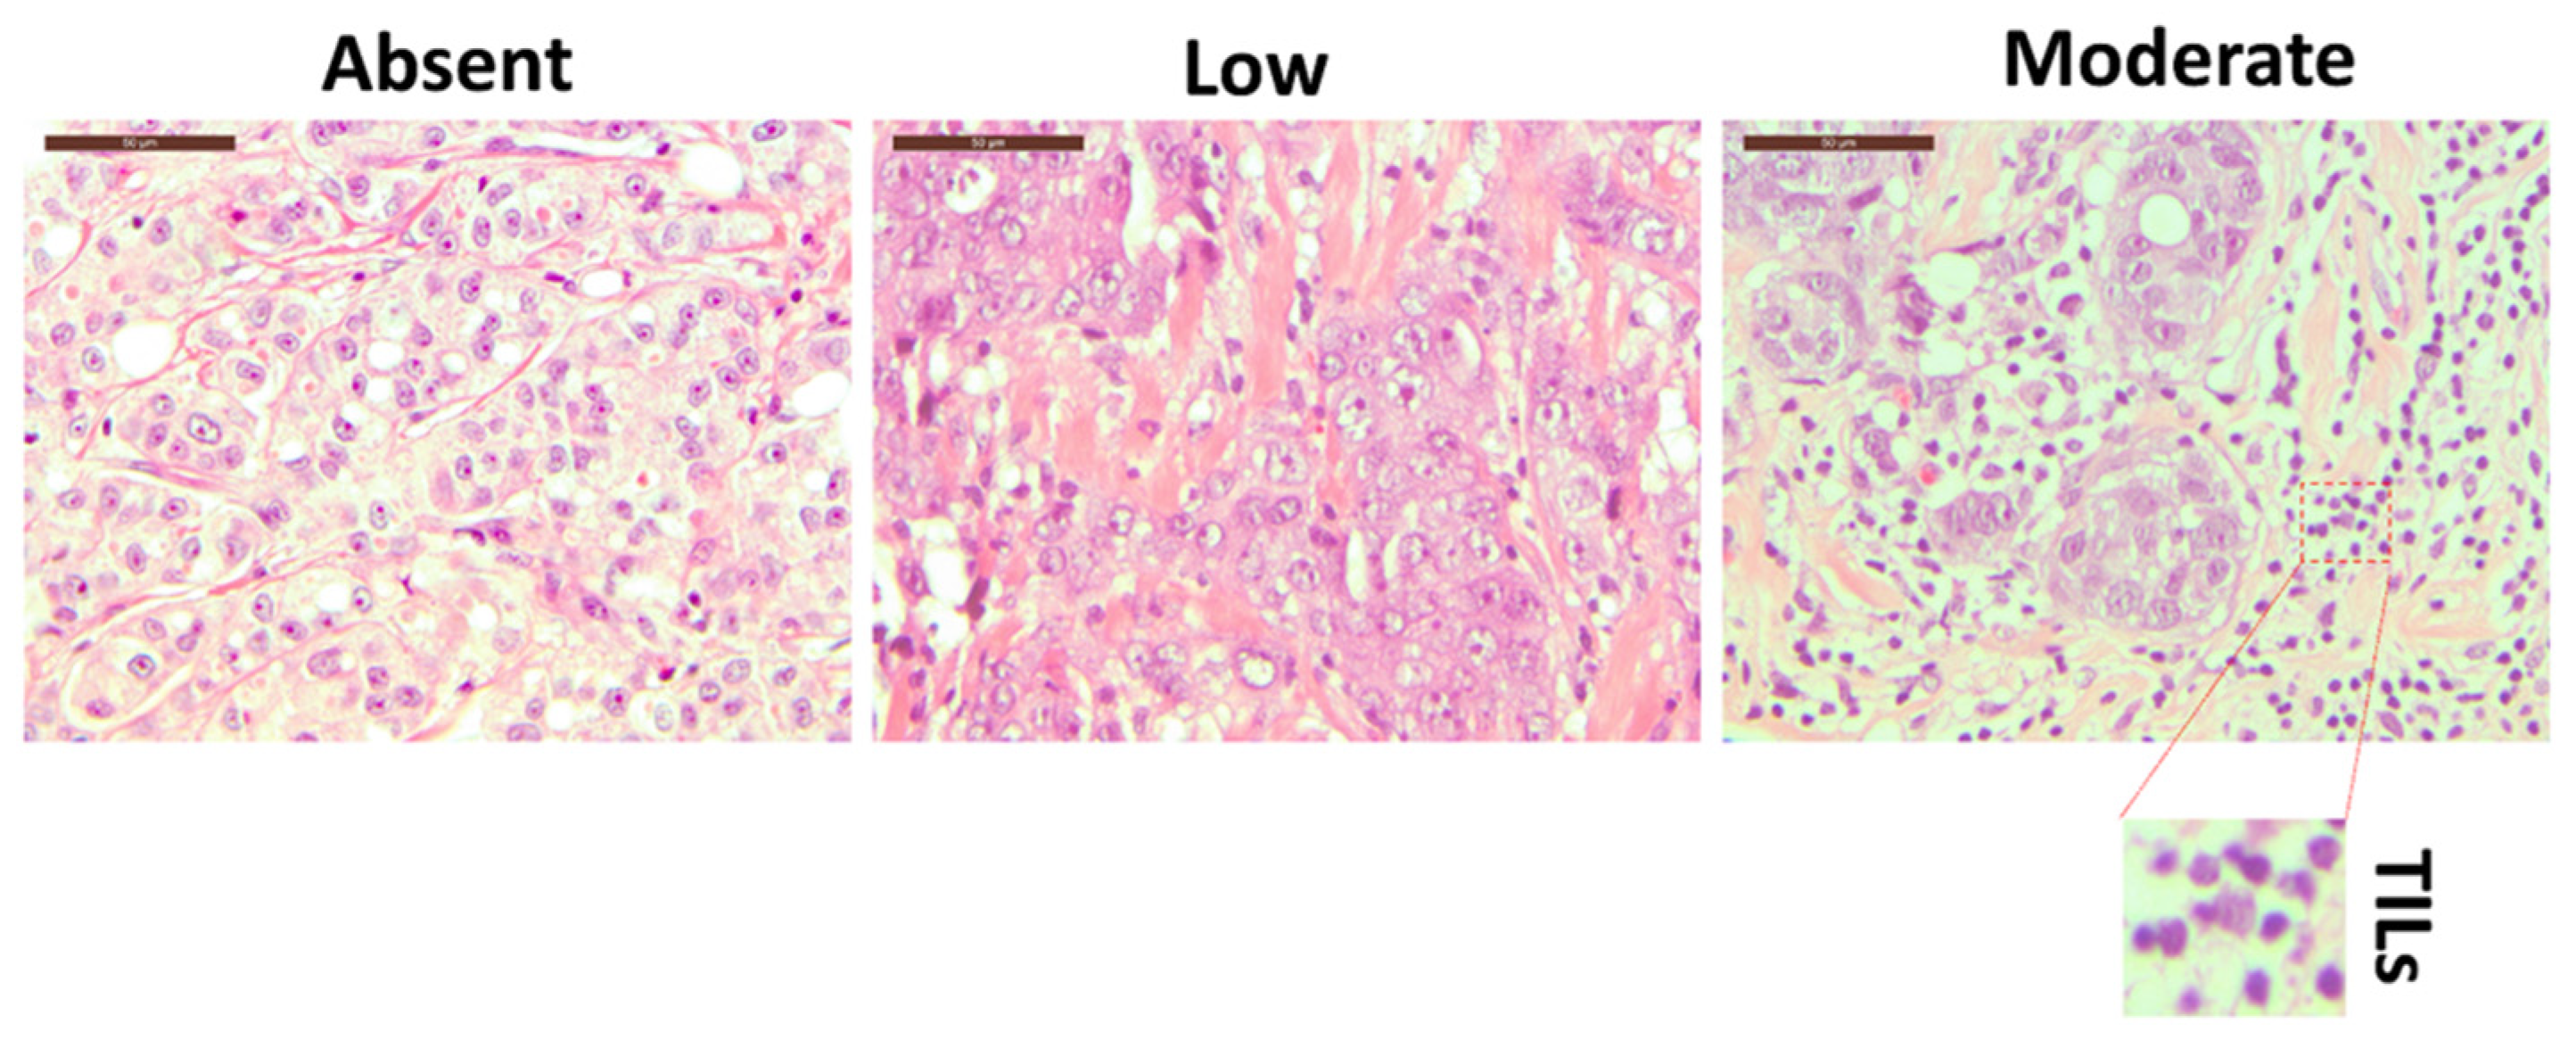
3.1. Breast Tissue Morphological Evaluation
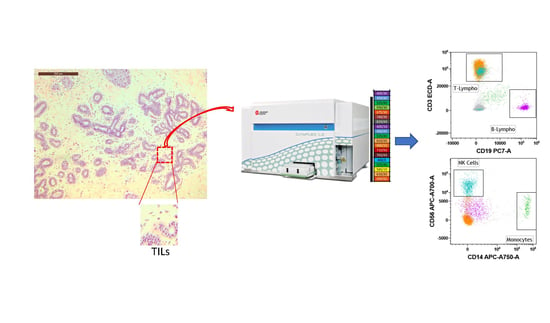
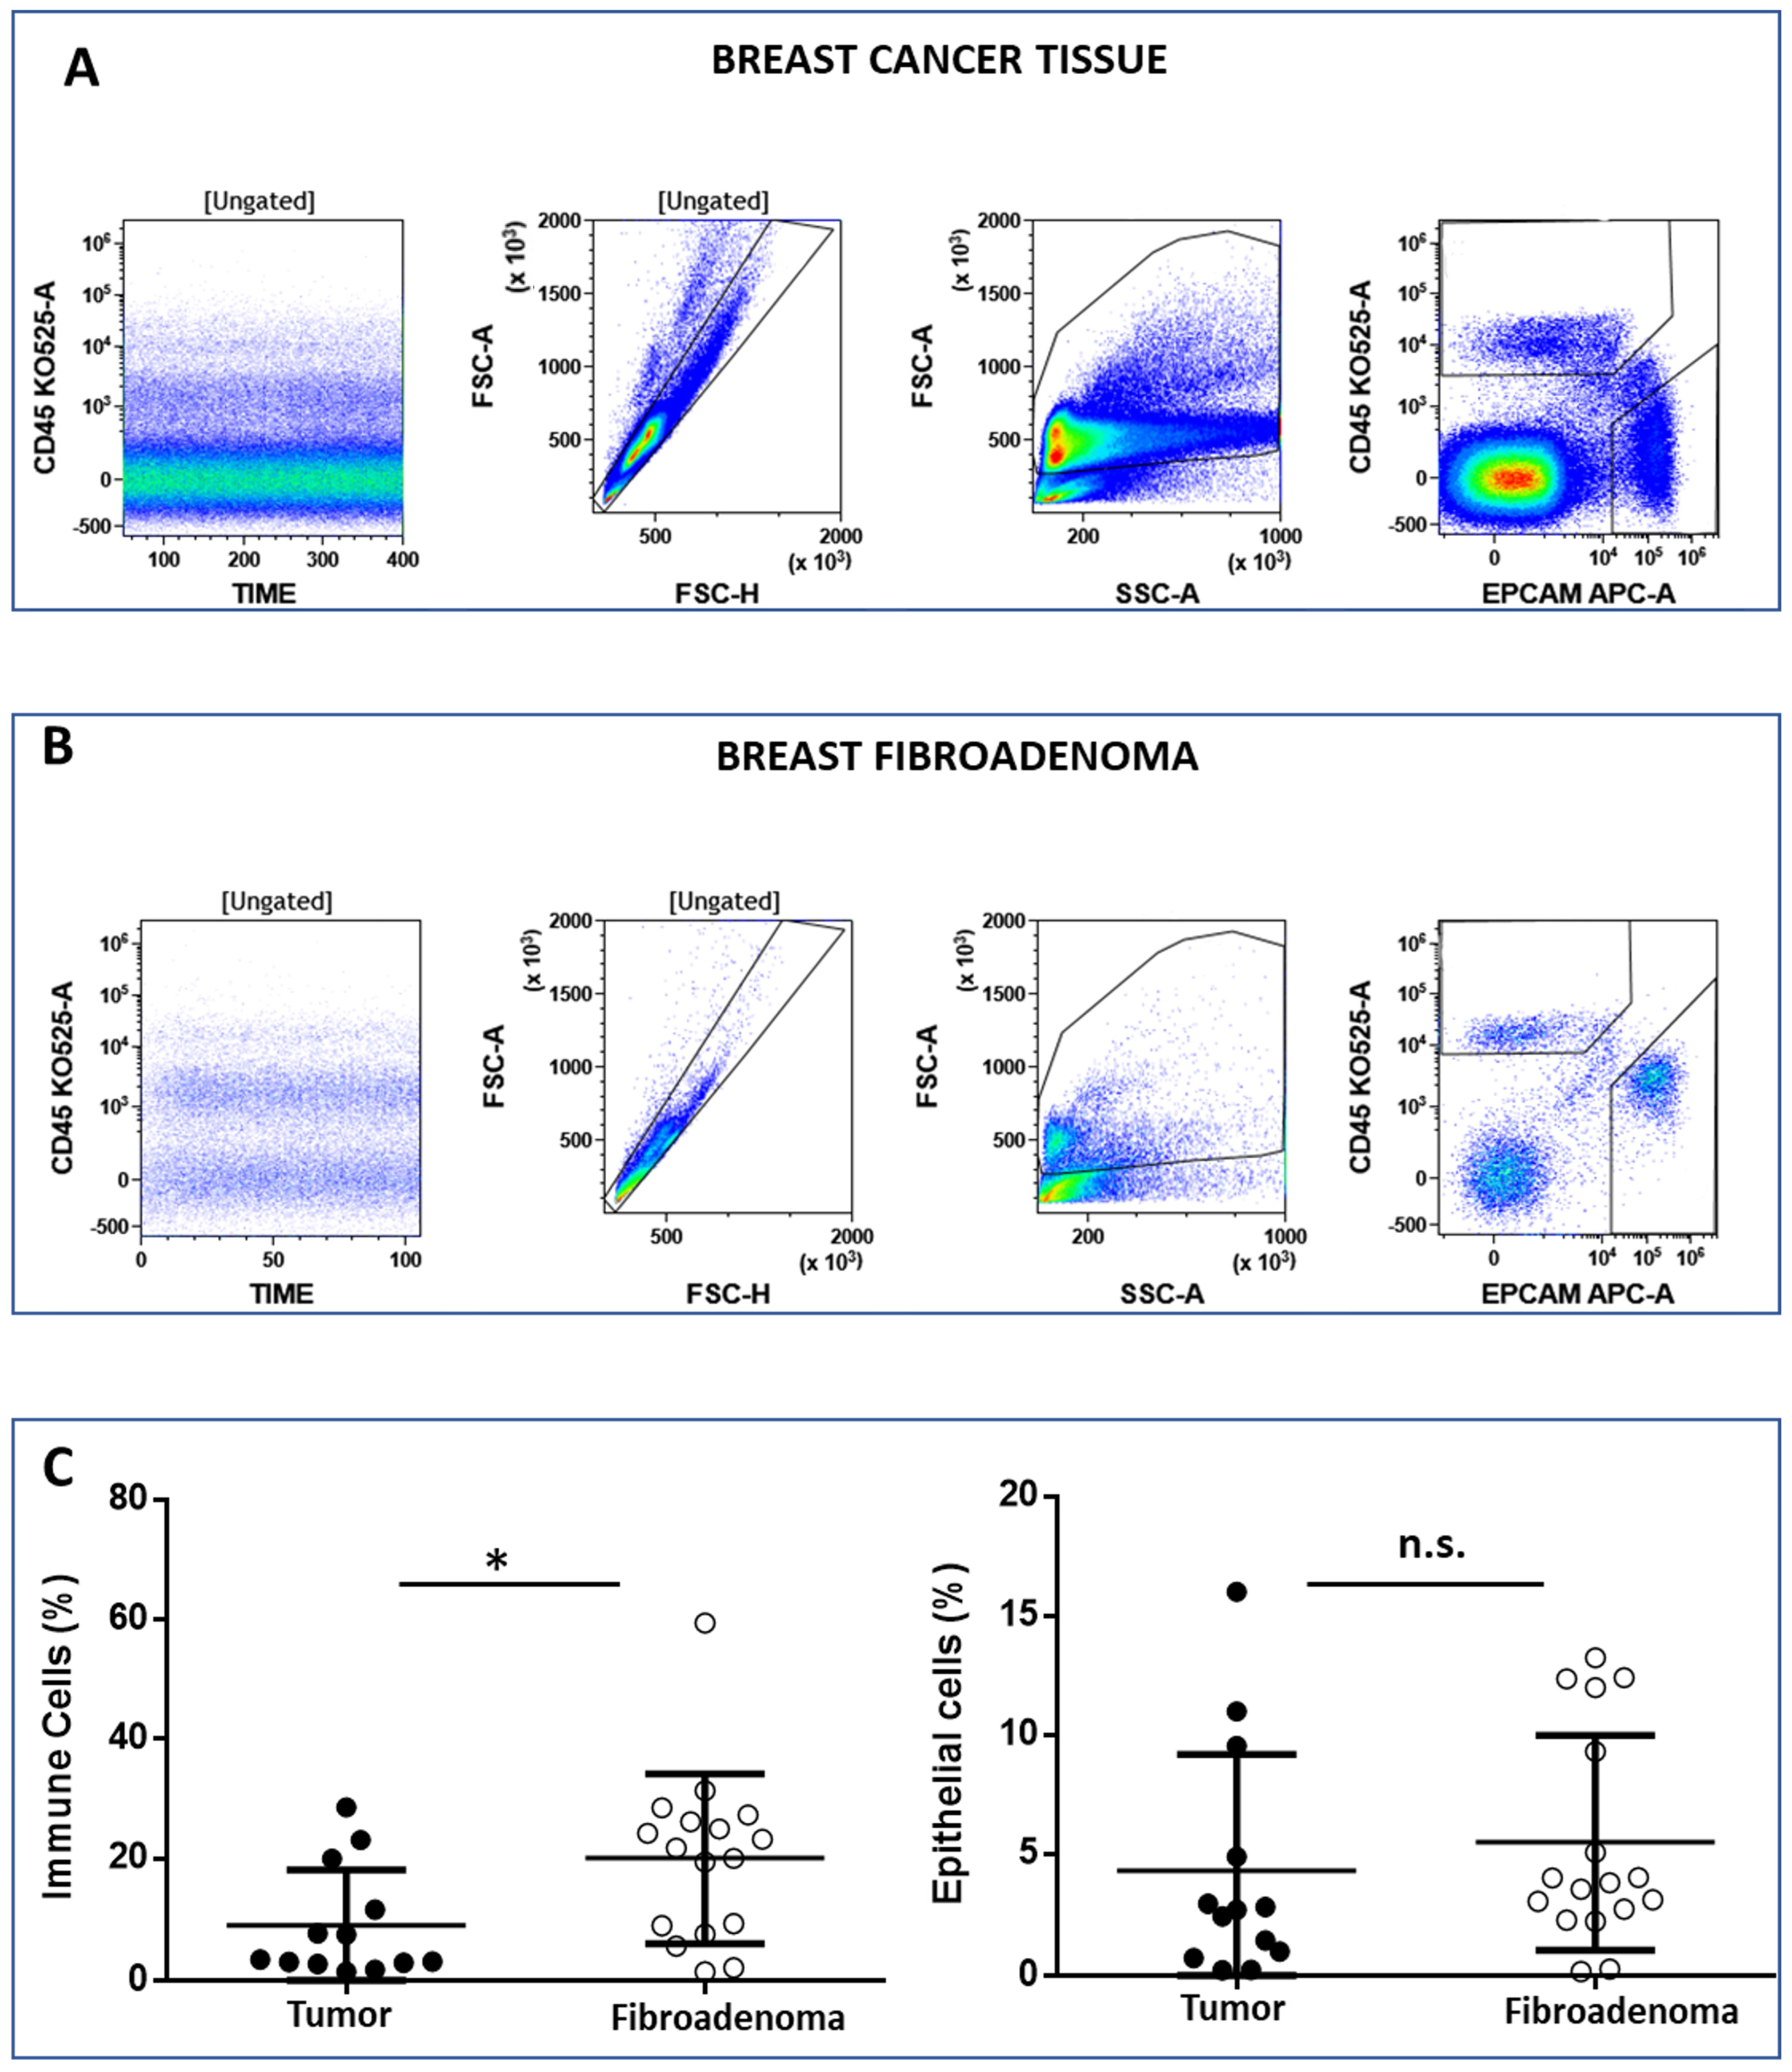
3.2. Analysis of Breast-Infiltrating Immune Cells by Multicolor Flow Cytometry
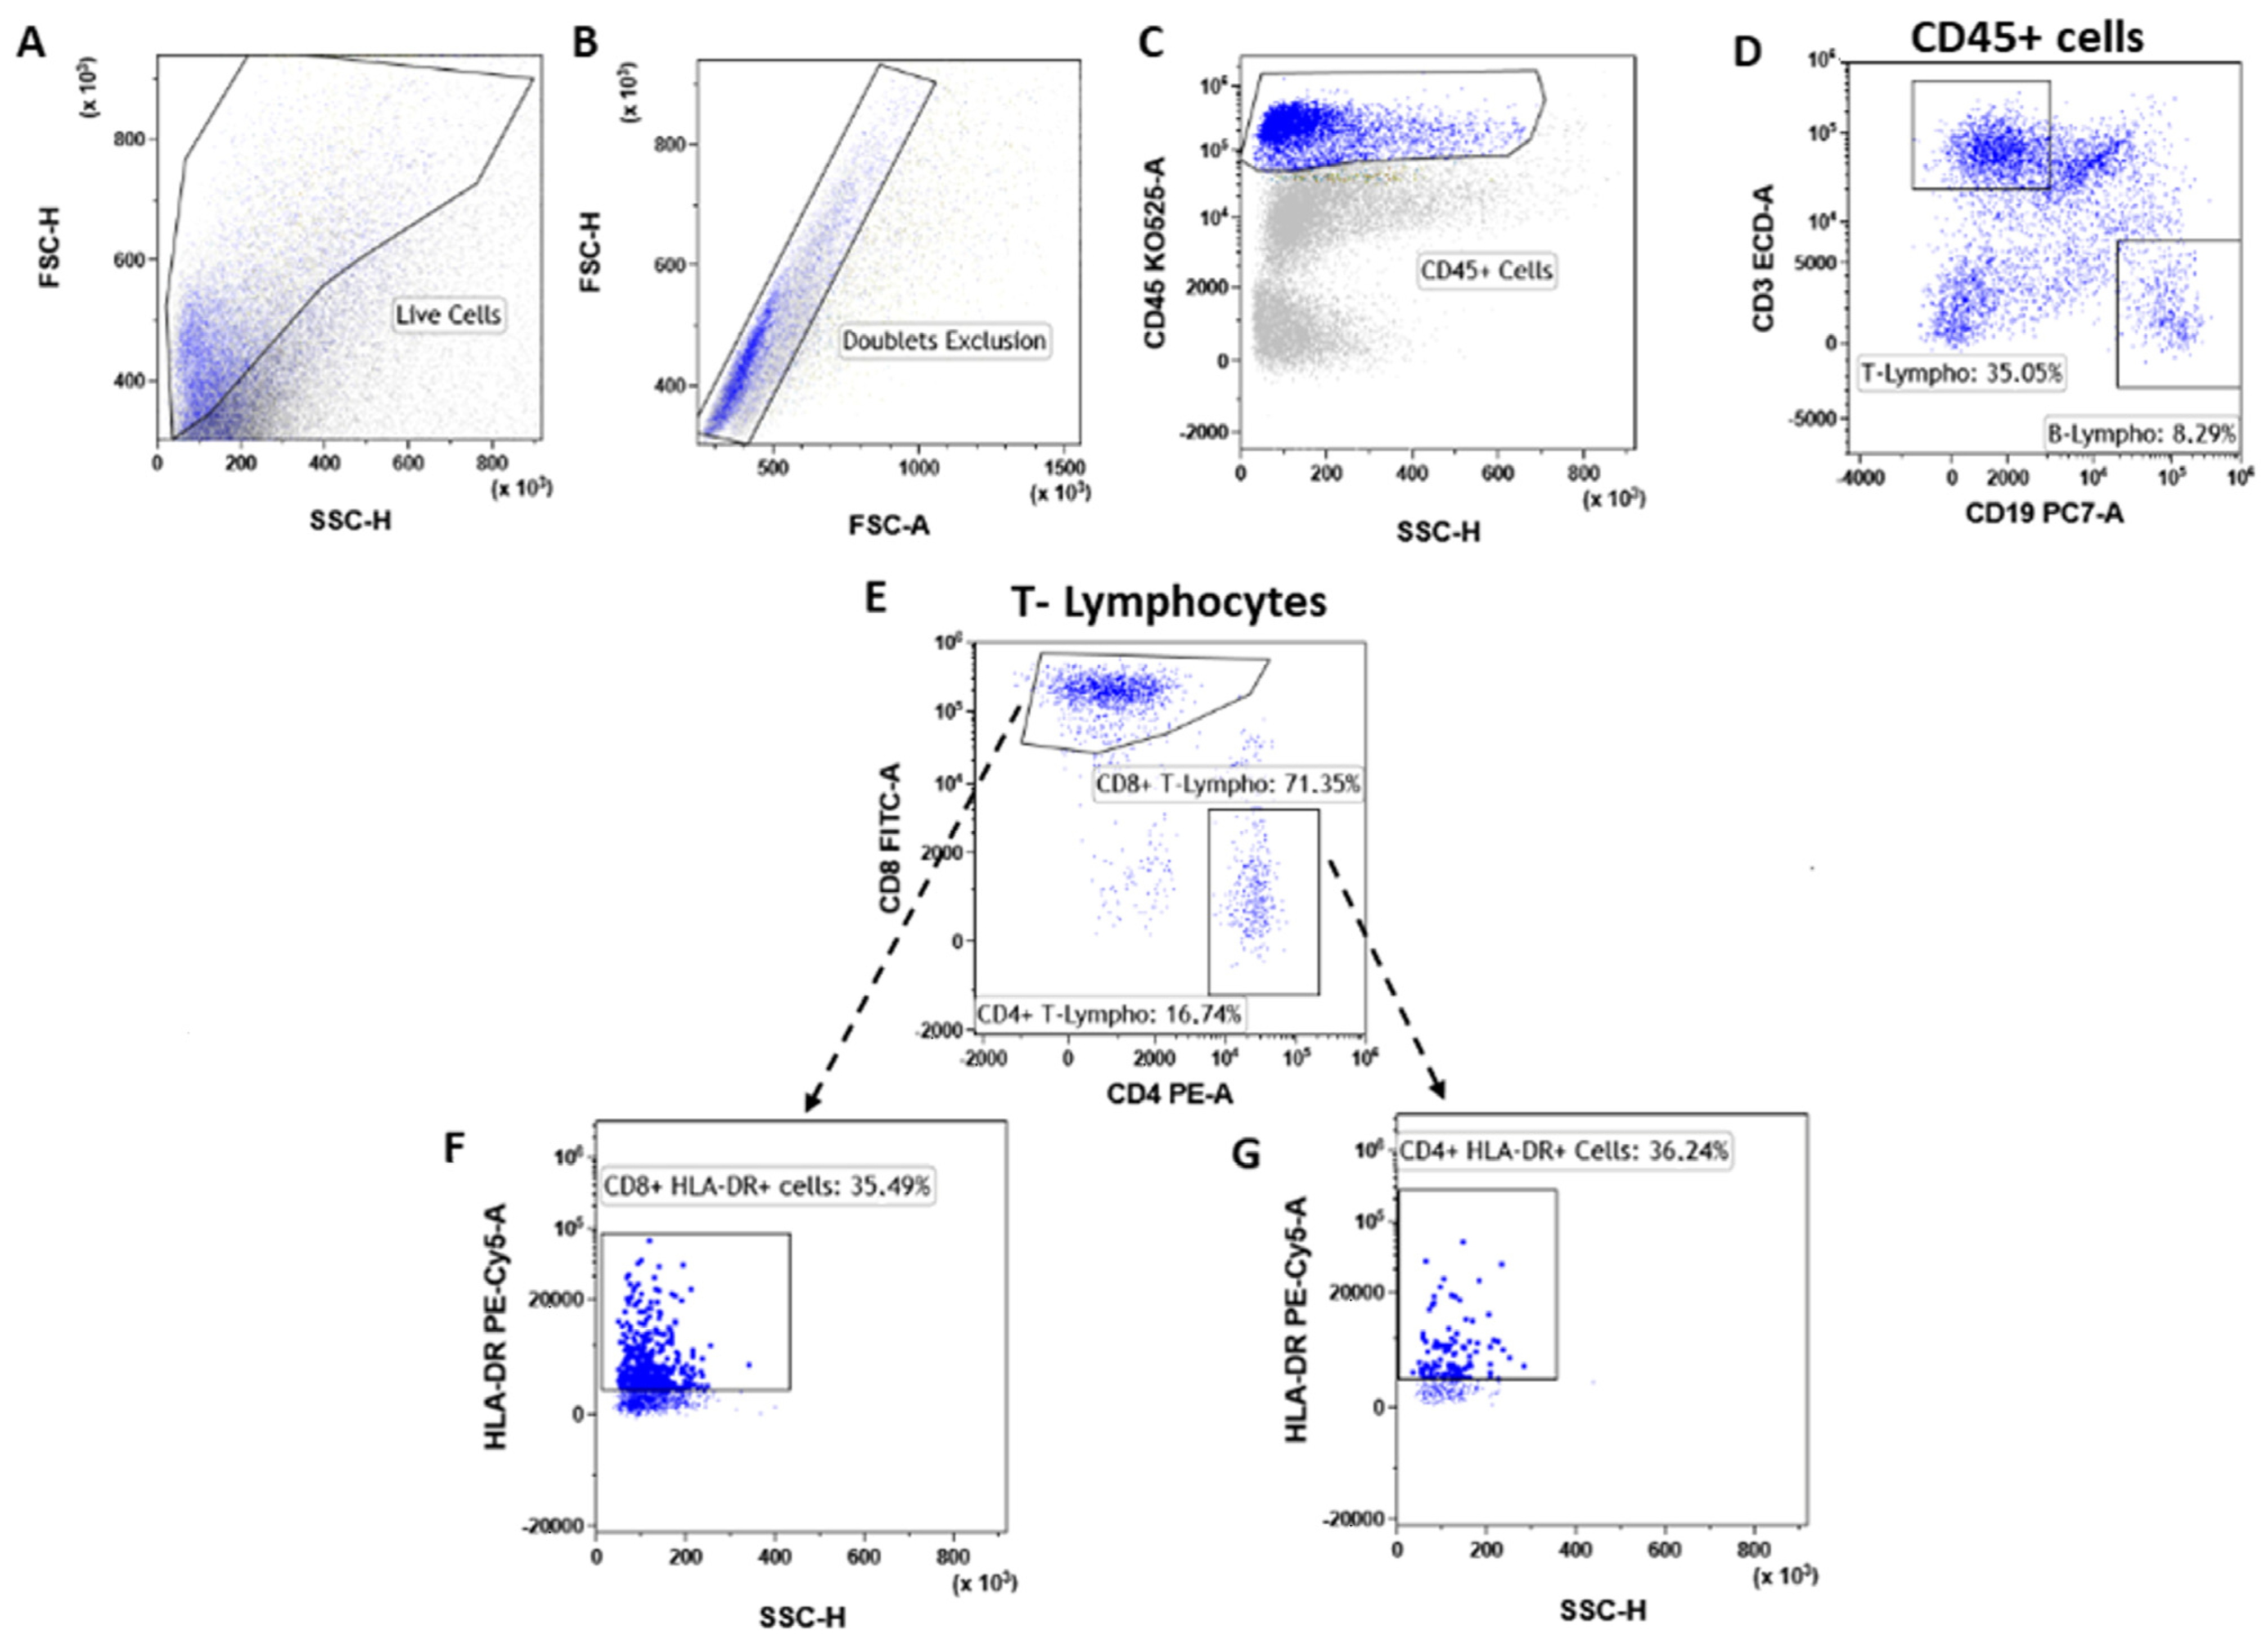
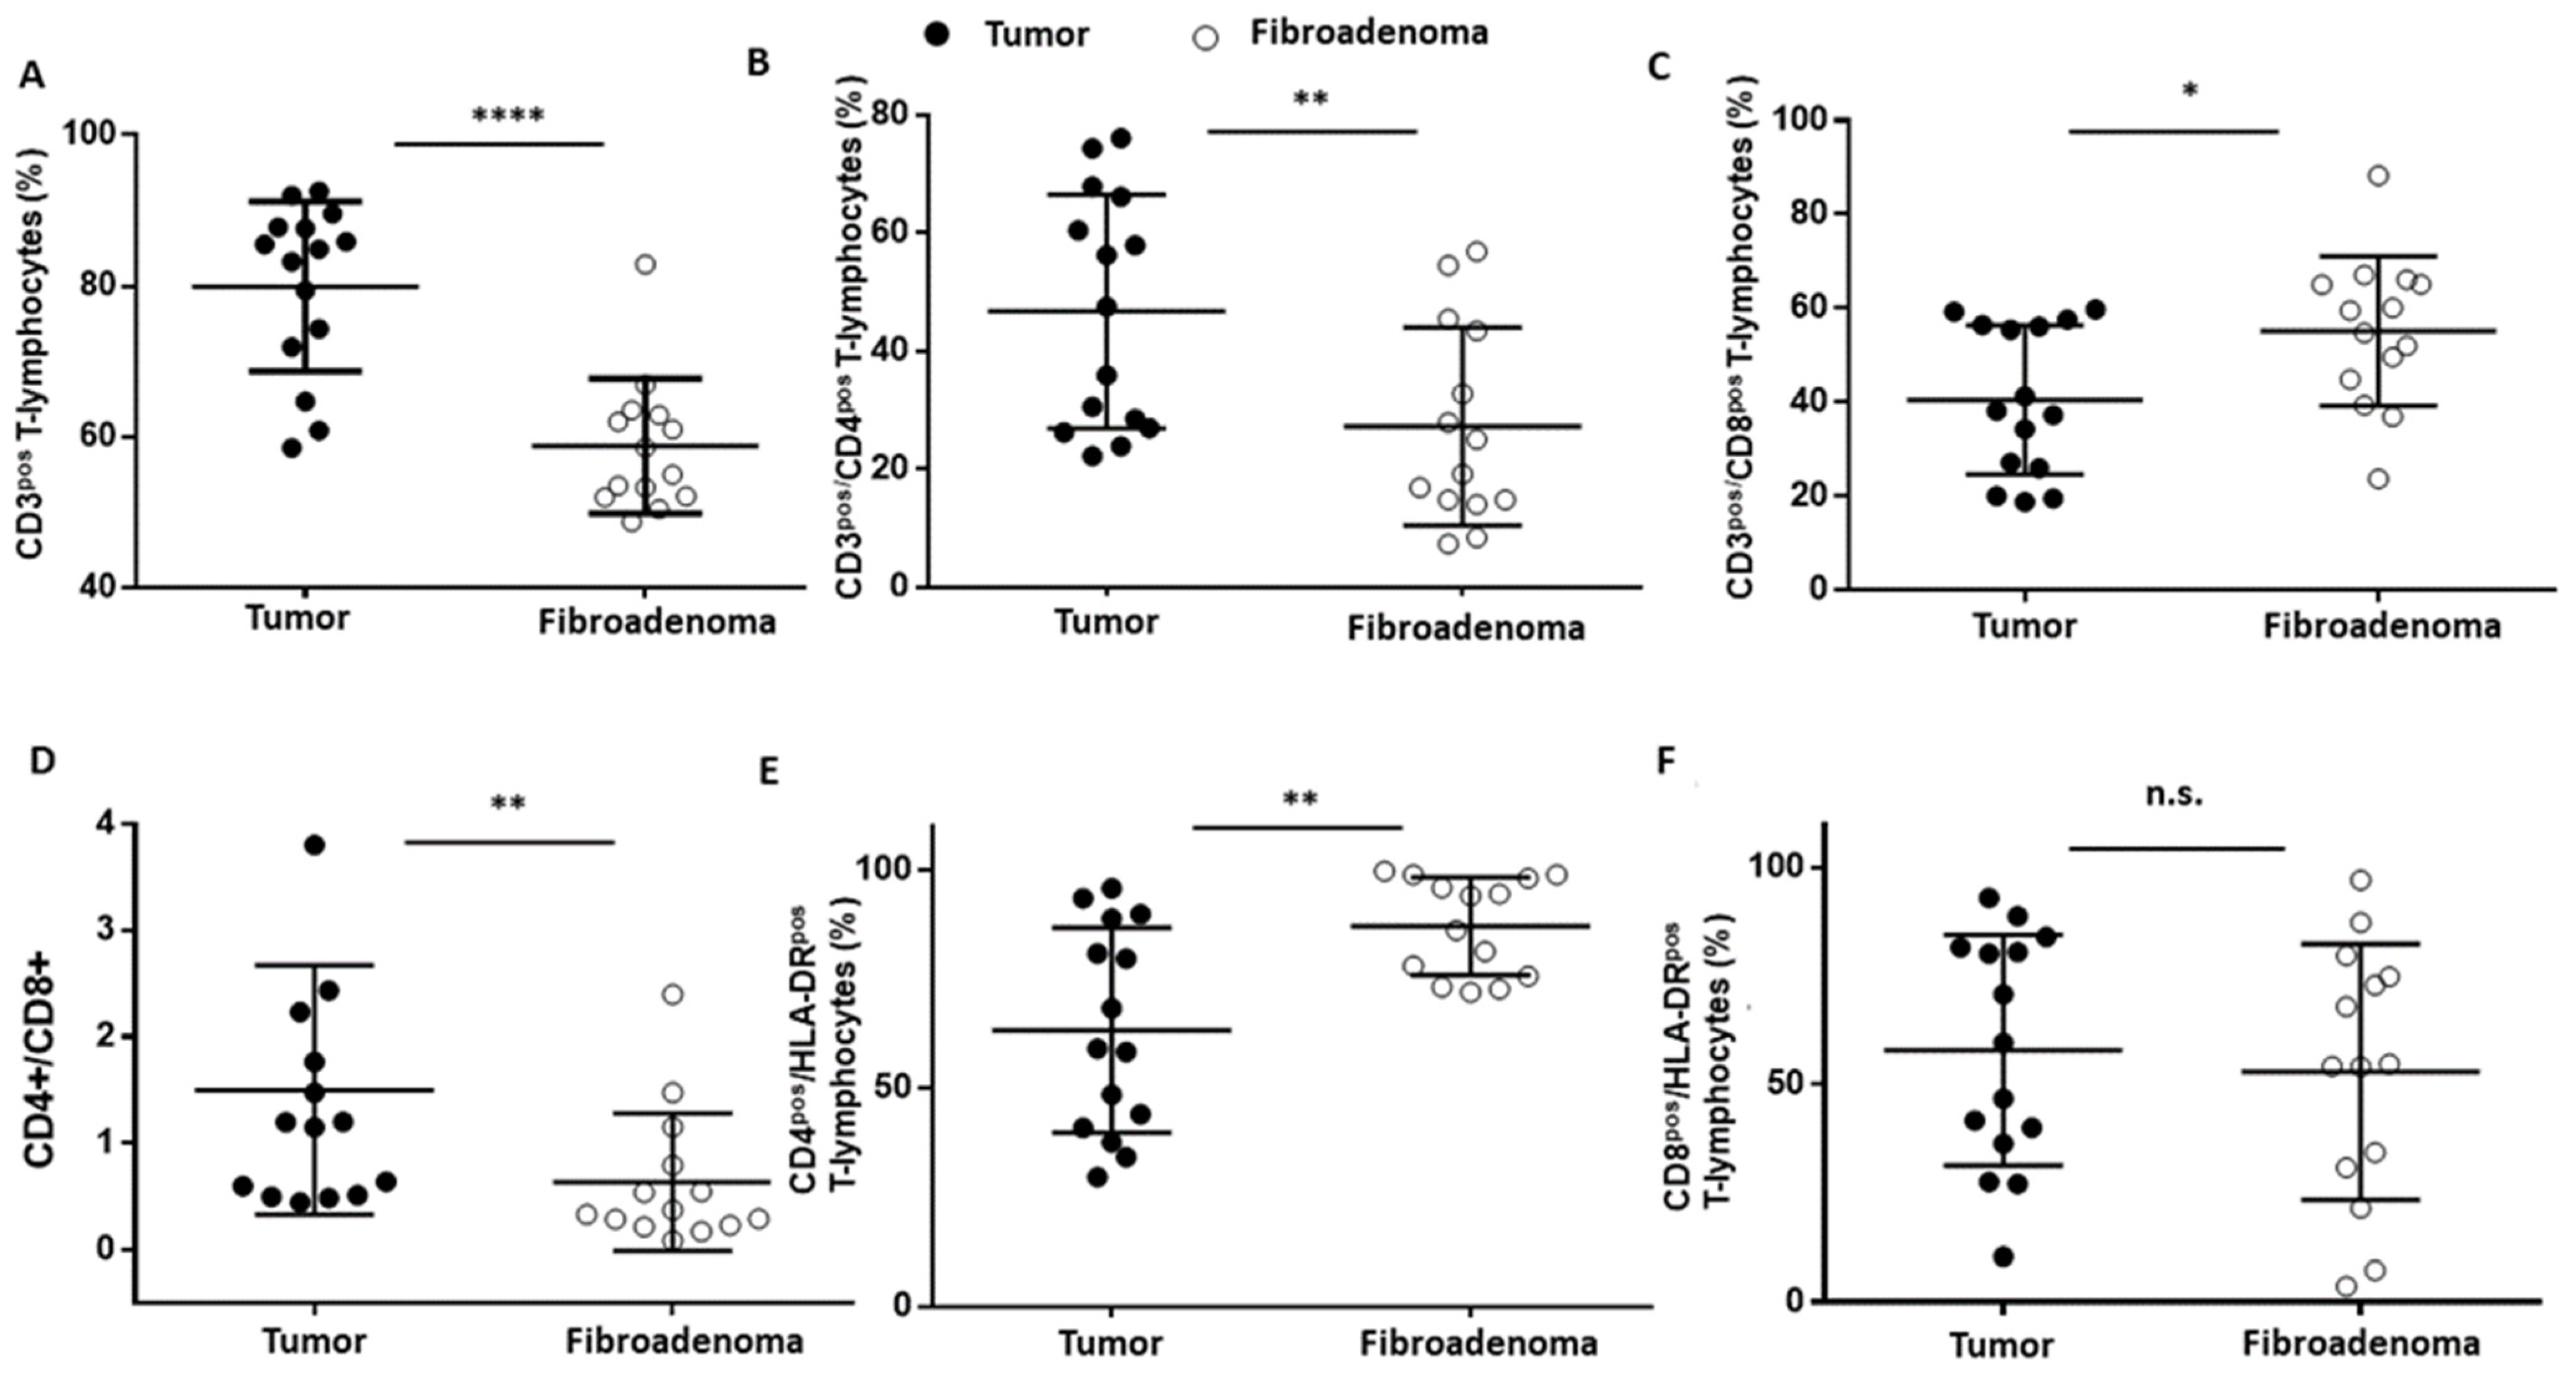
3.3. T Lymphocytes
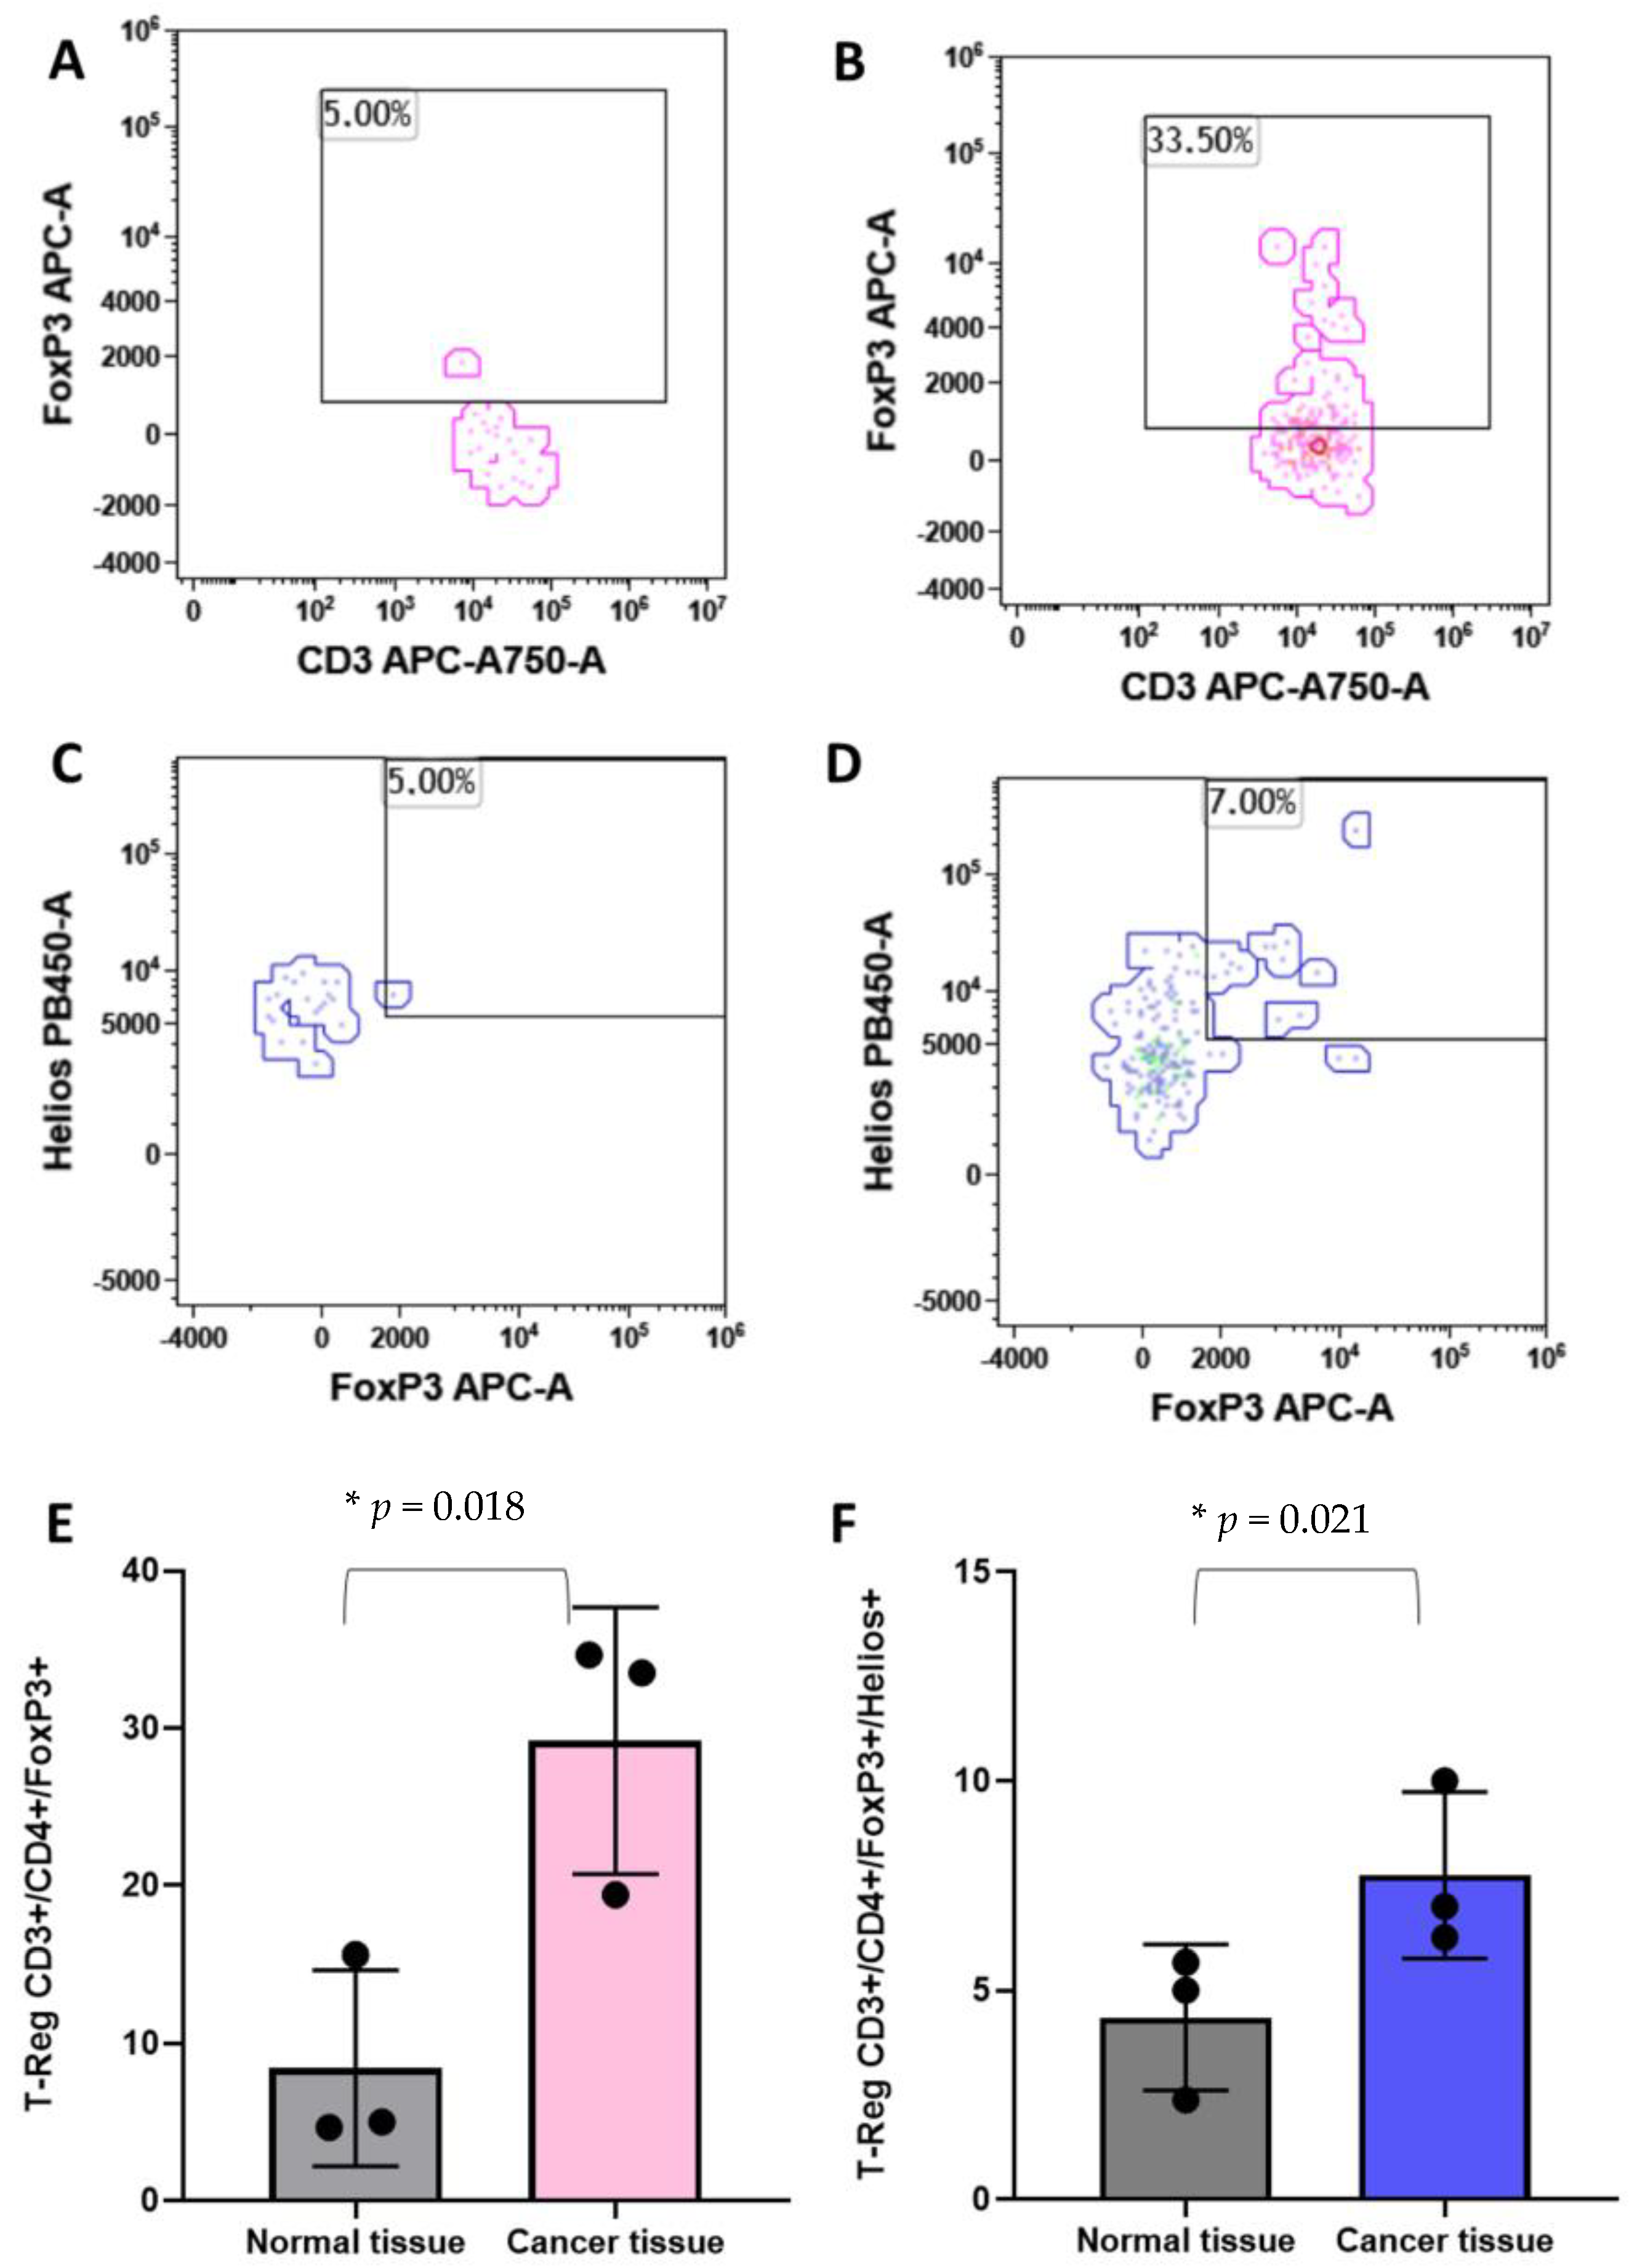
3.4. T-Reg
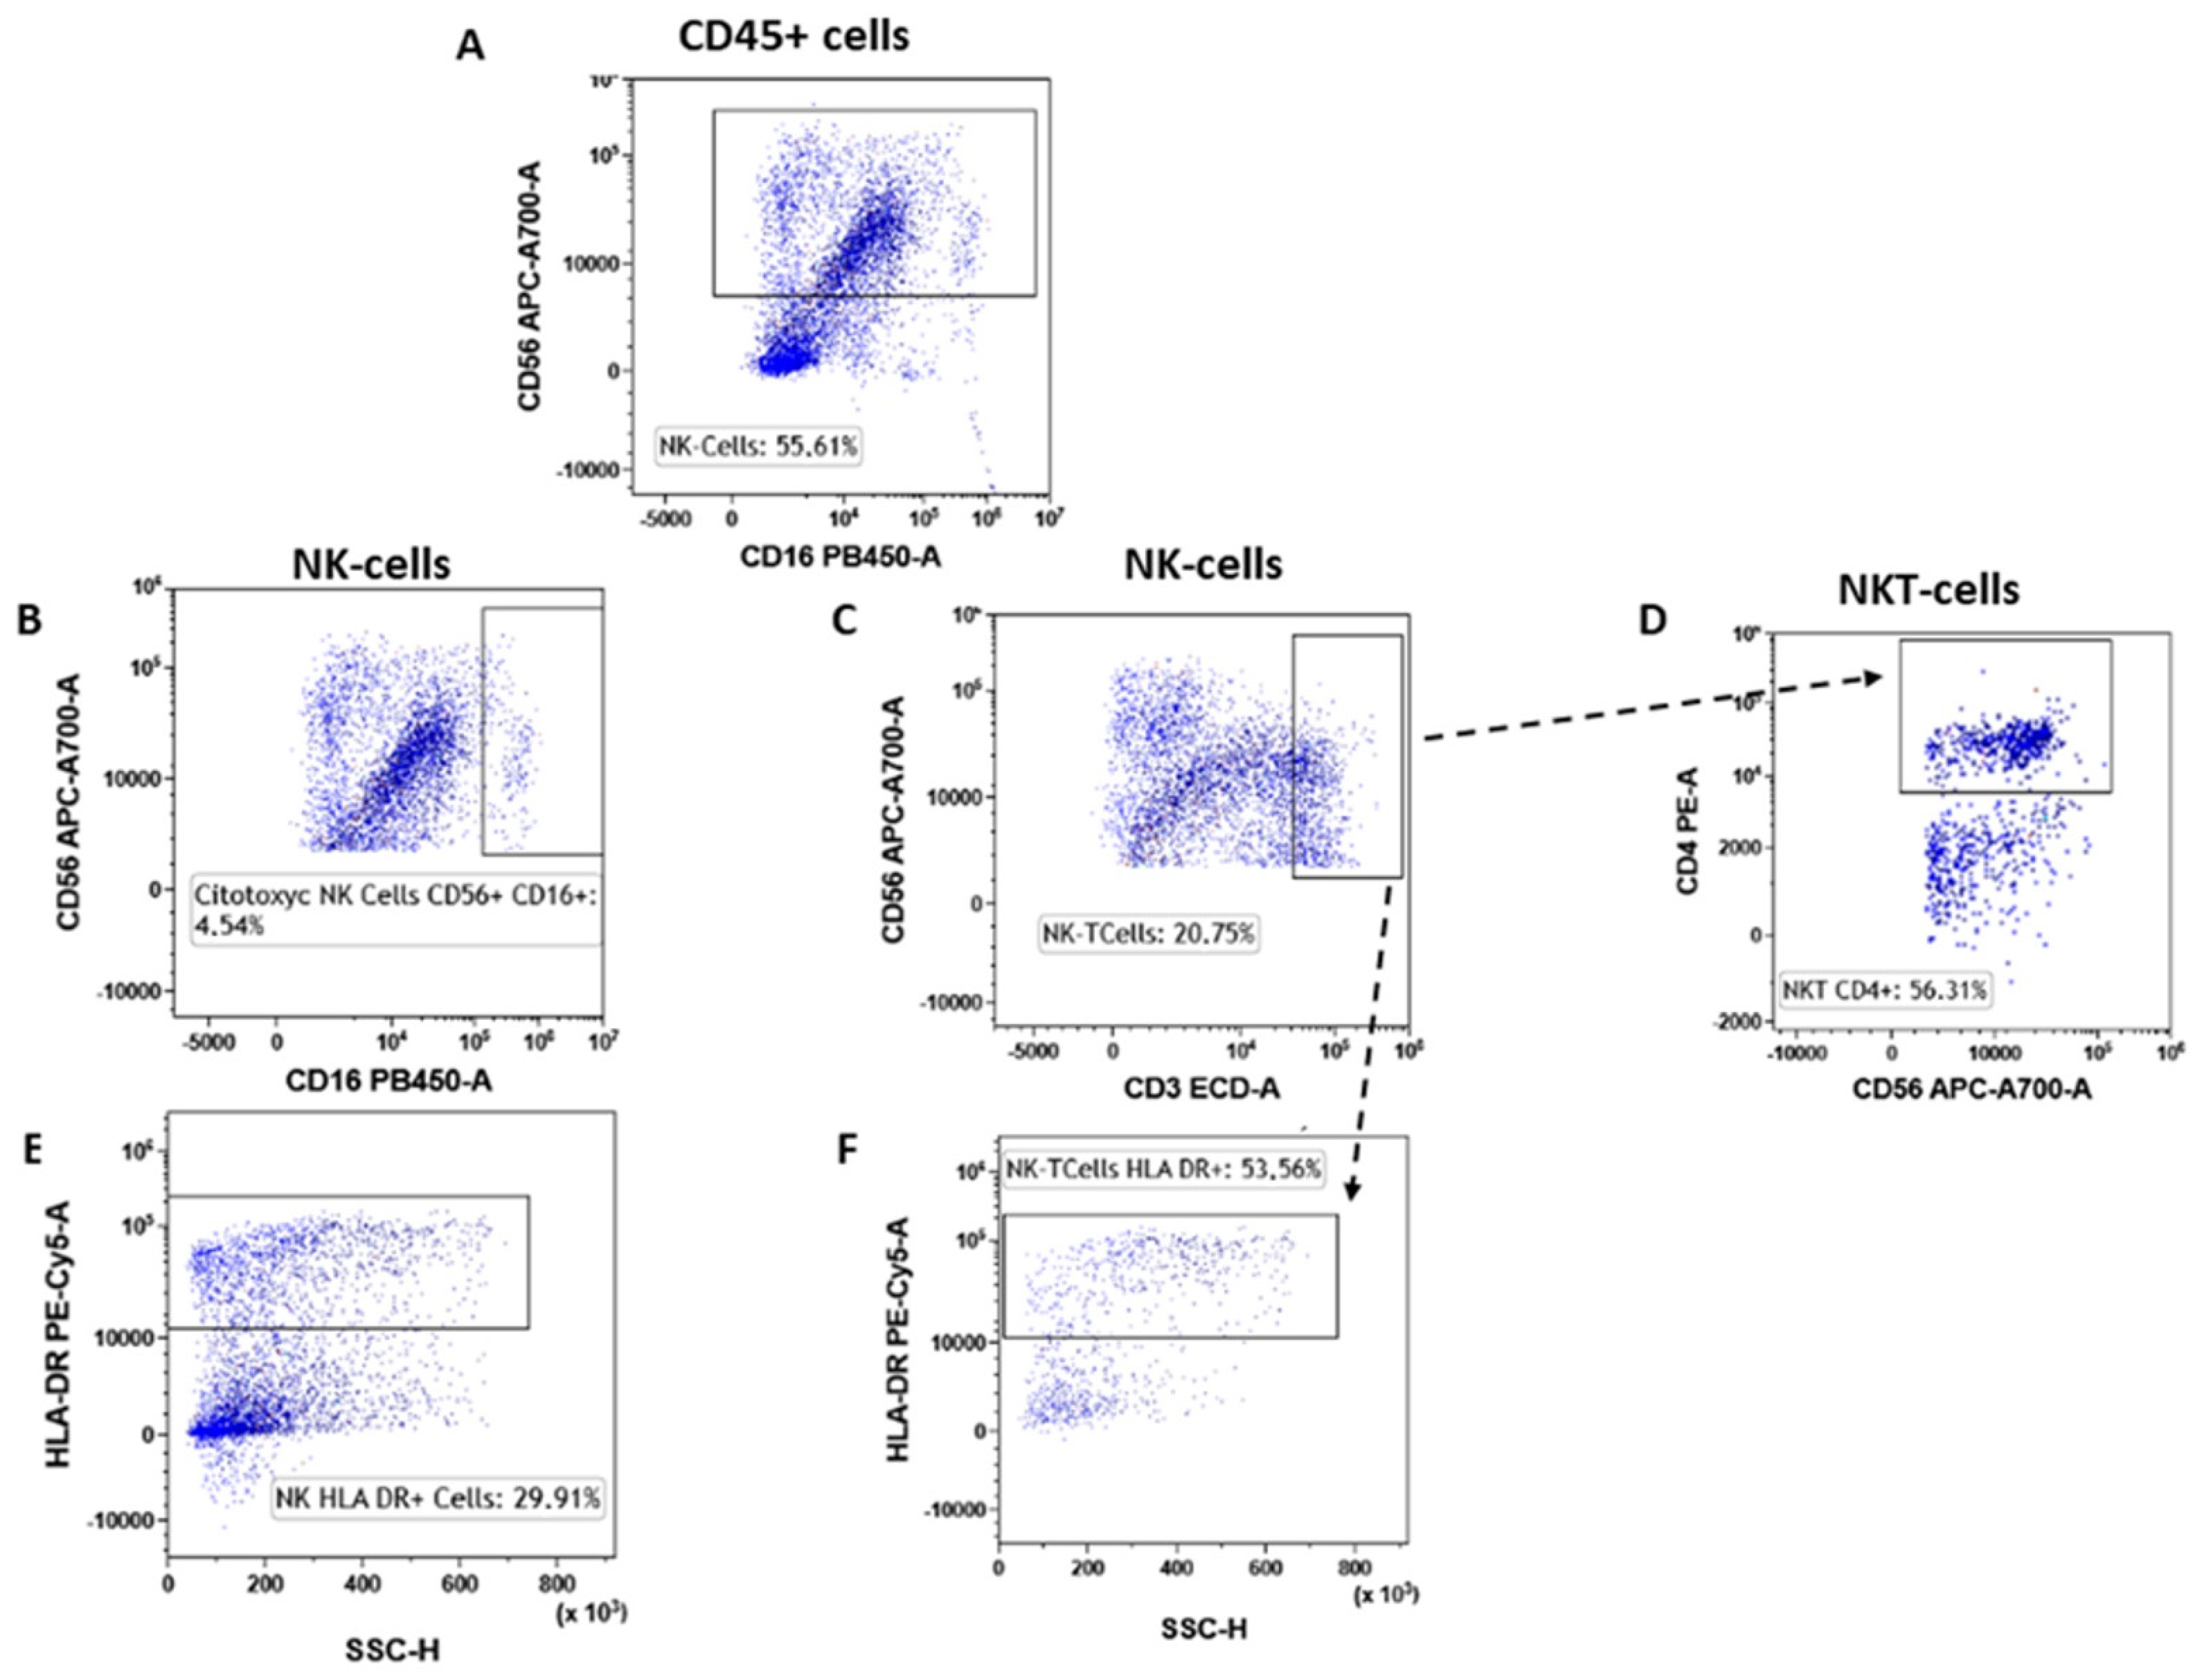
3.5. NK Lymphocytes
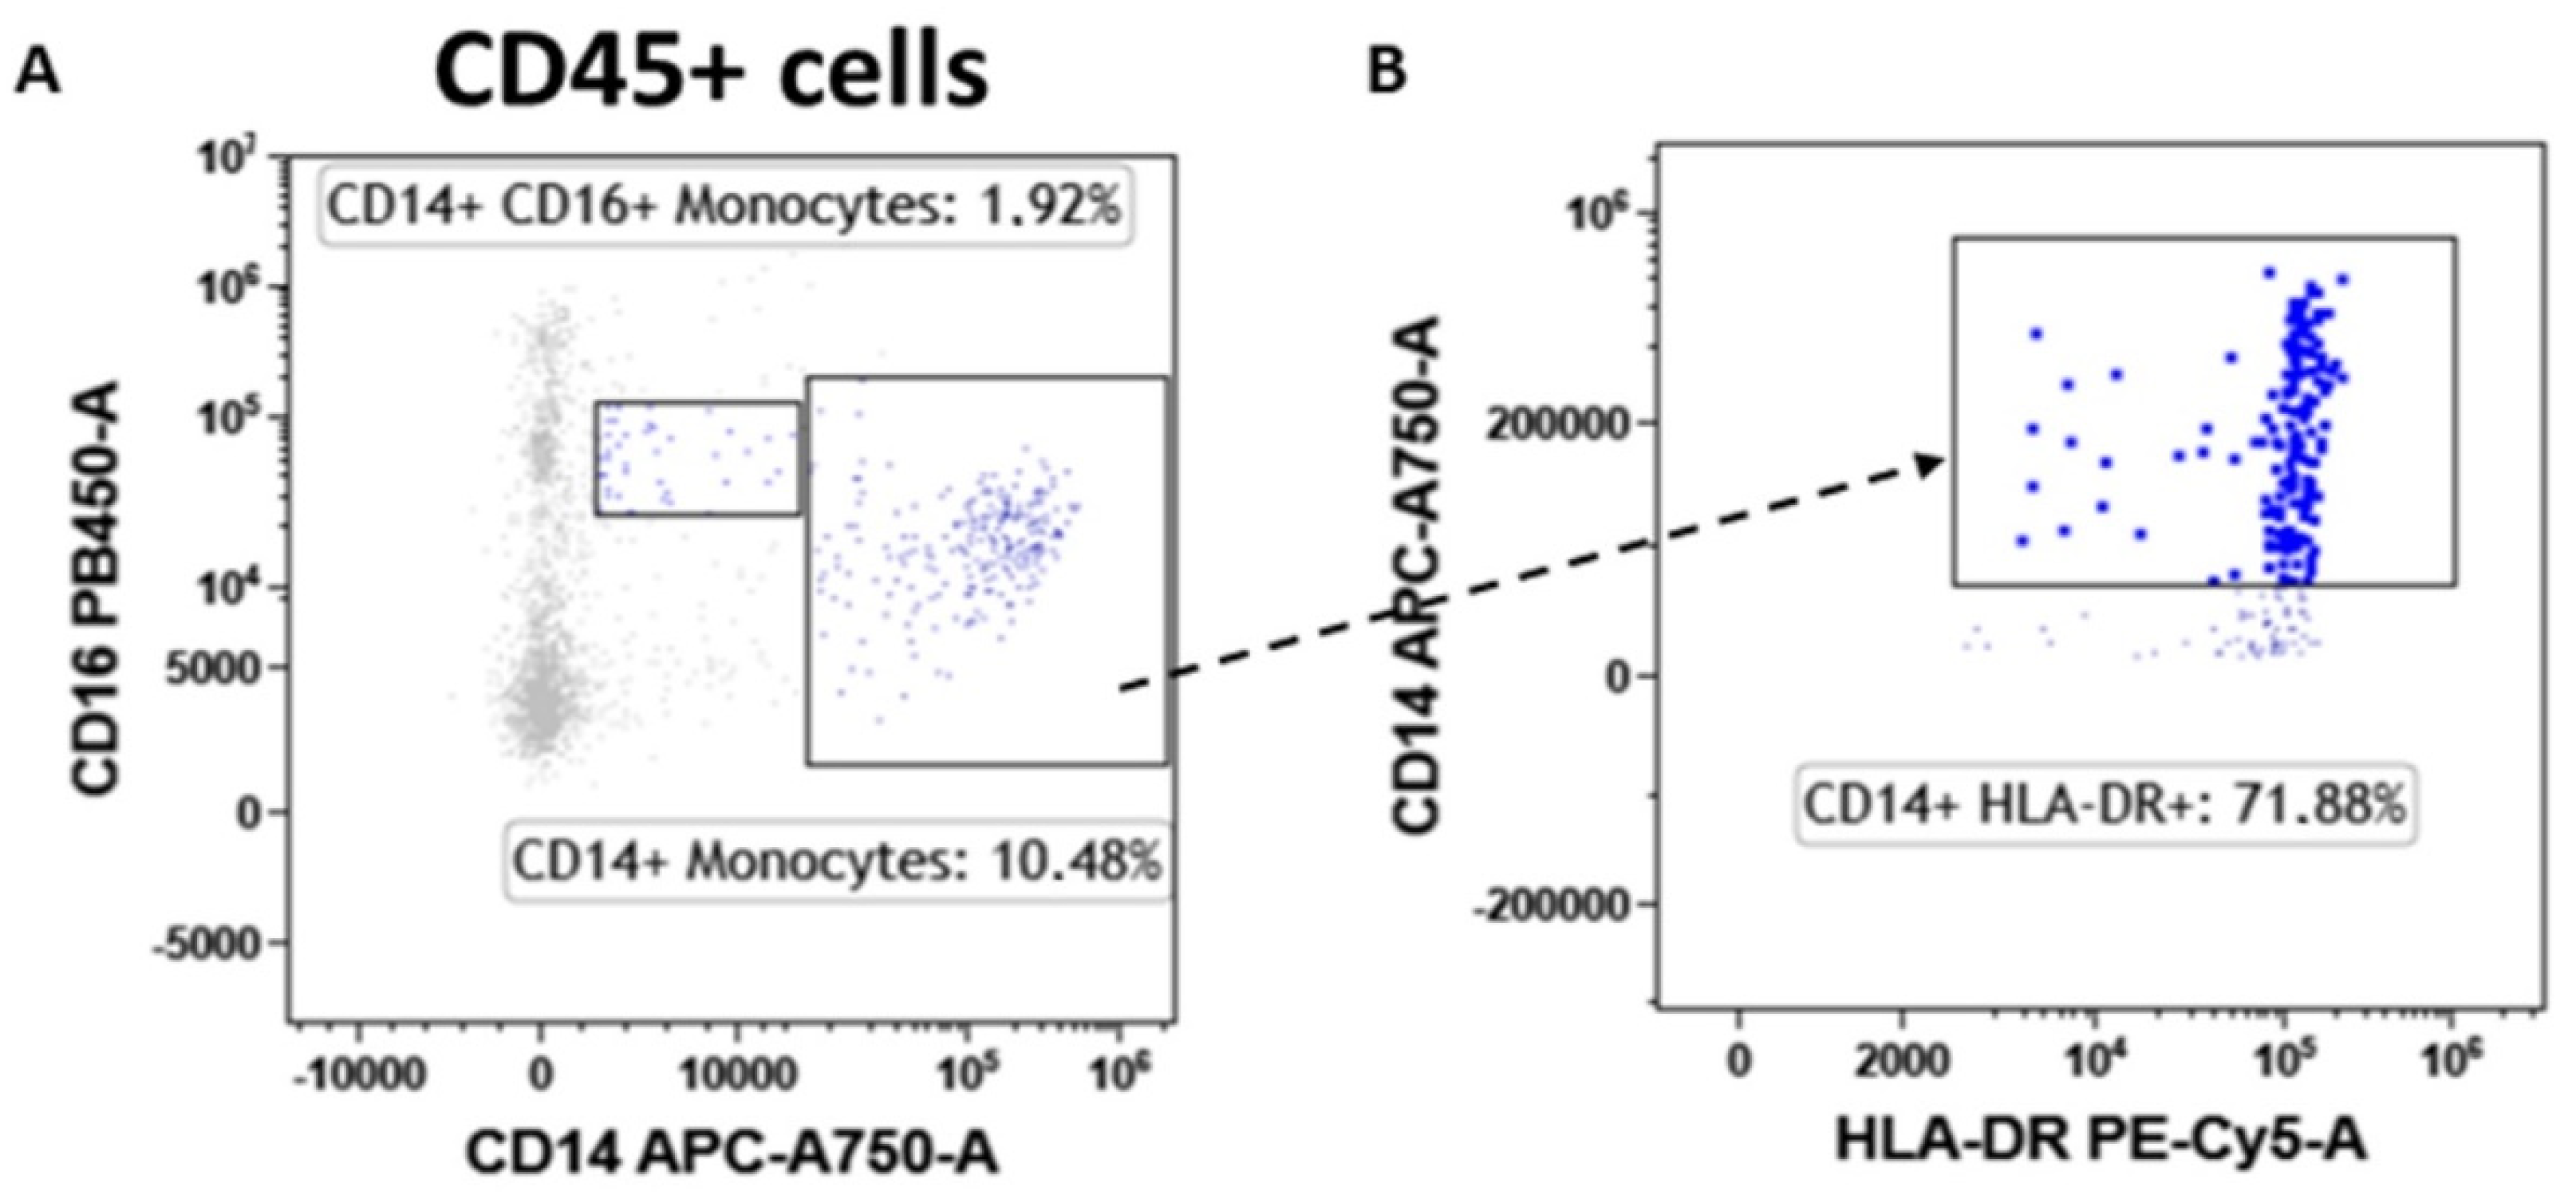
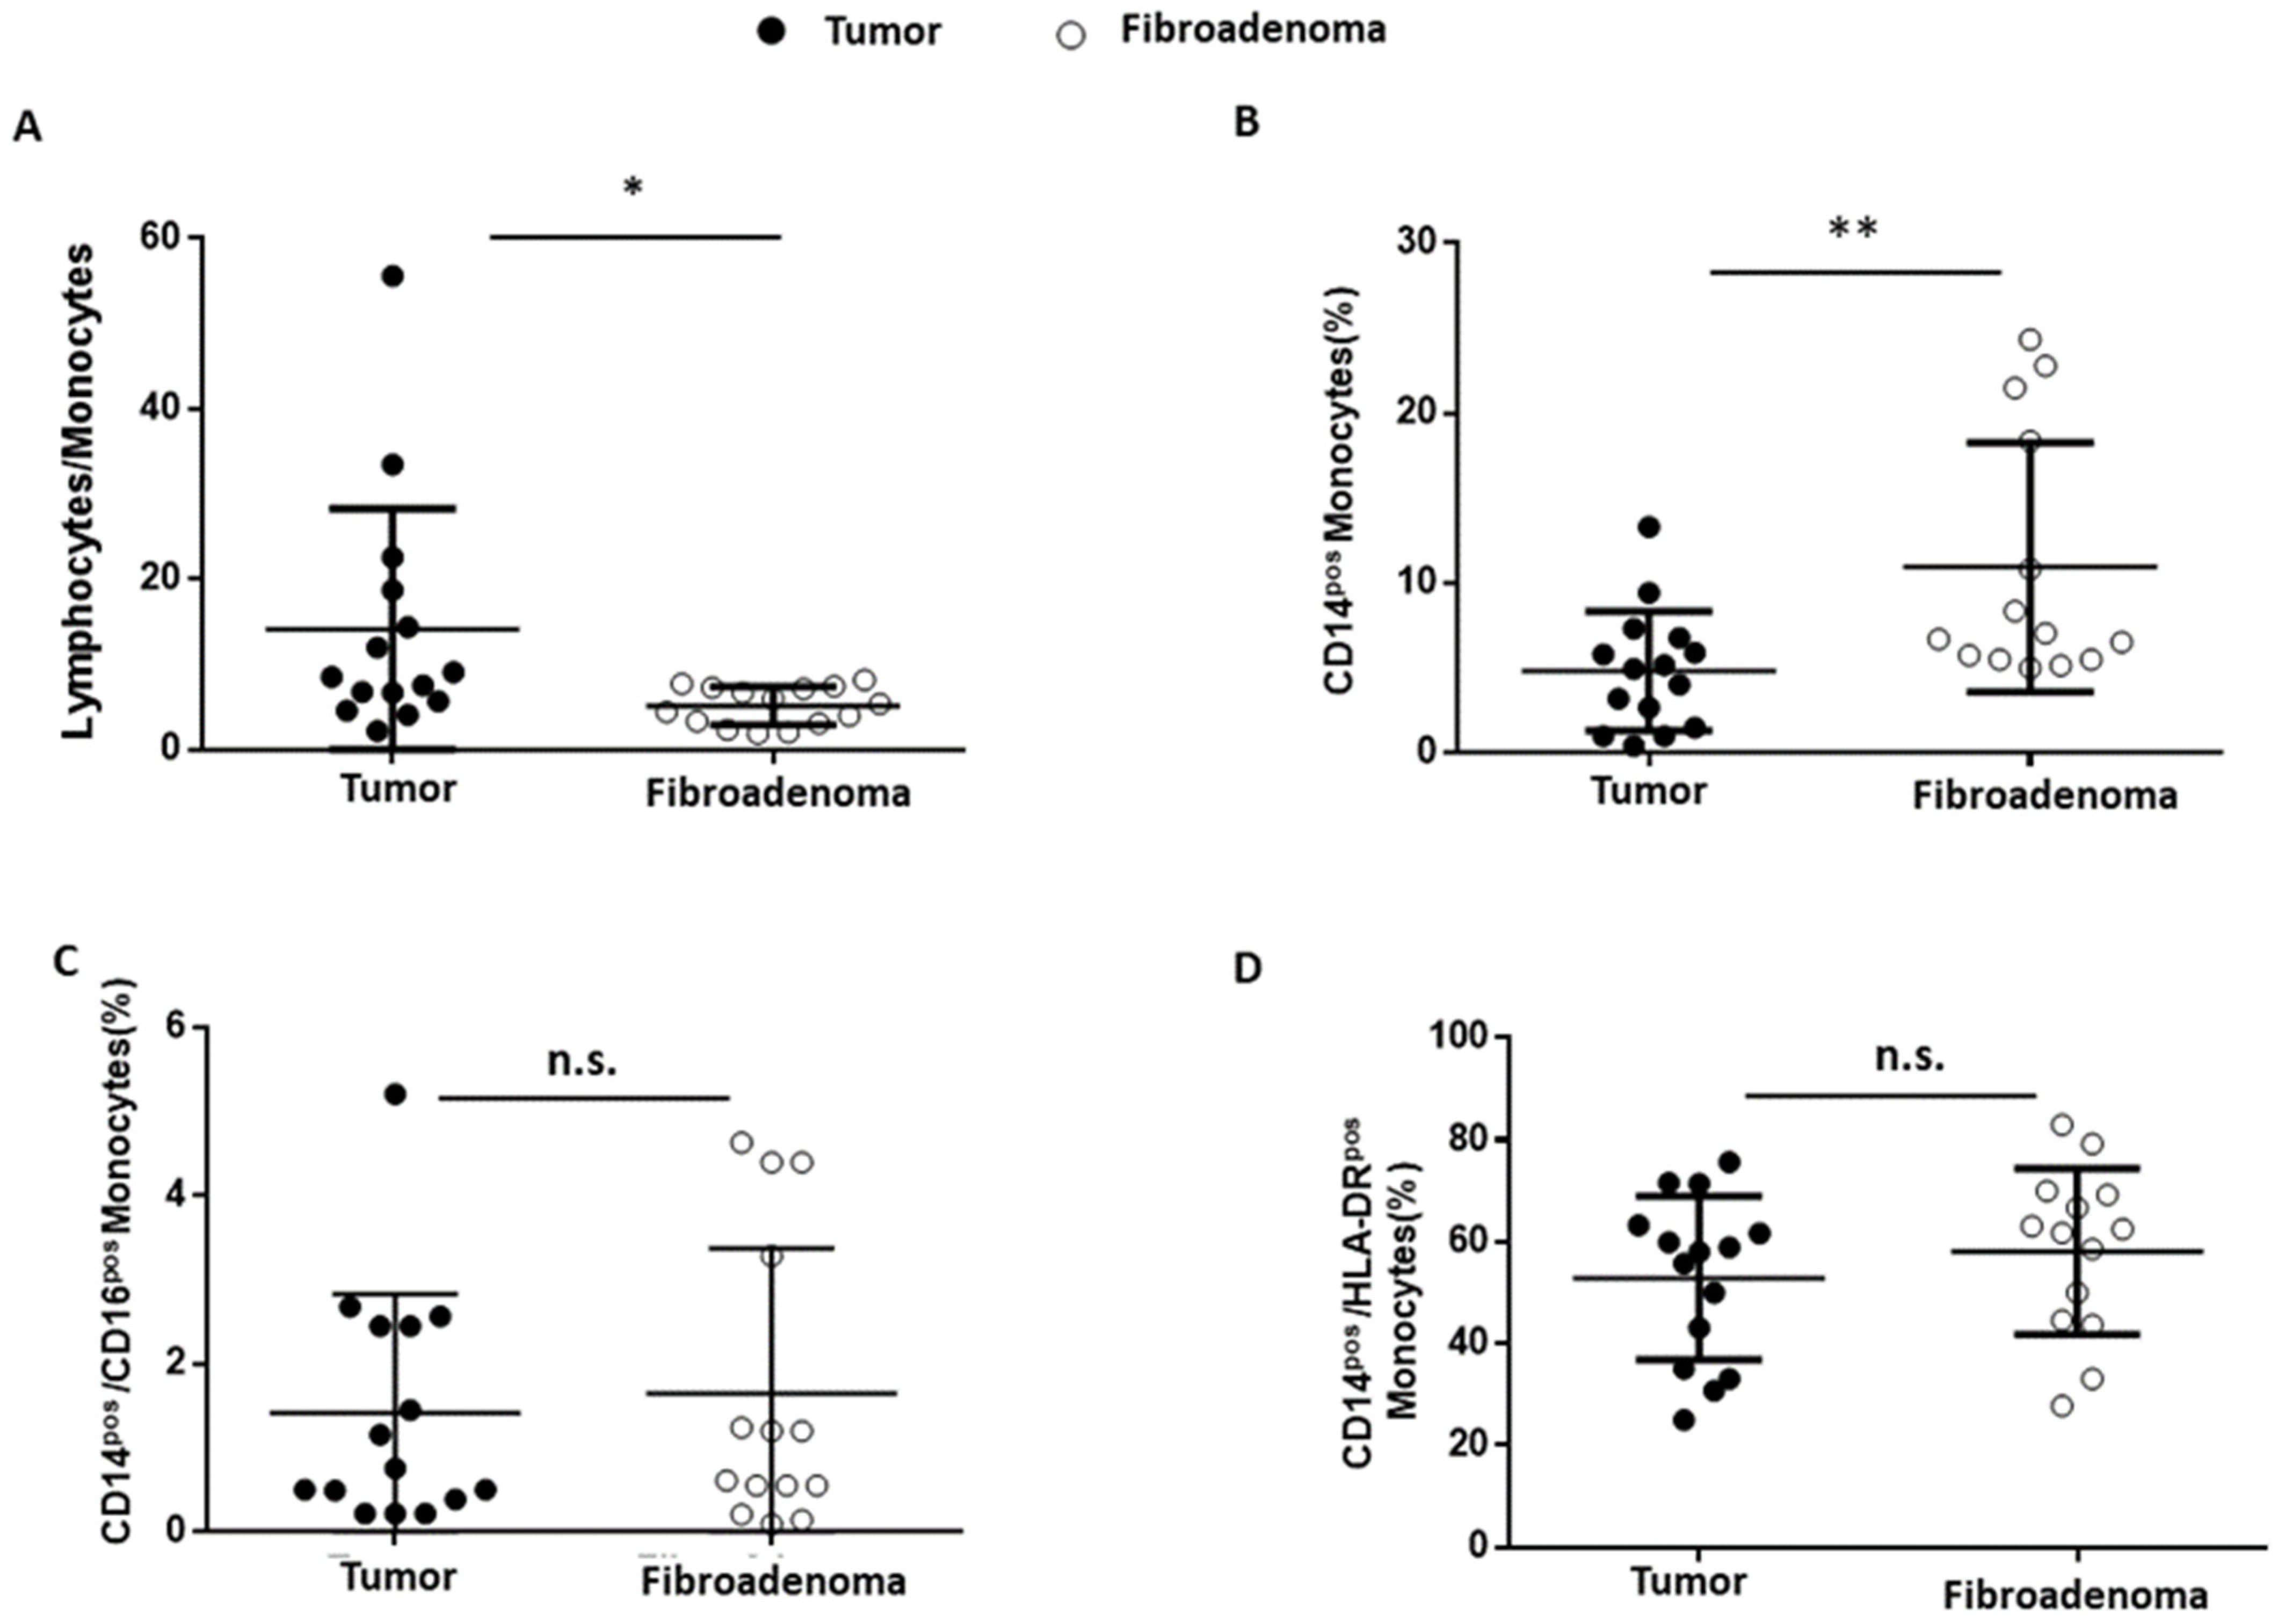
3.6. Monocytes
4. Discussion
5. Conclusions
Supplementary Materials
Author Contributions
Funding
Institutional Review Board Statement
Informed Consent Statement
Acknowledgments
Conflicts of Interest
References
- Sung, H.; Ferlay, J.; Siegel, R.L.; Laversanne, M.; Soerjomataram, I.; Jemal, A.; Bray, F. Global Cancer Statistics 2020: GLOBOCAN Estimates of Incidence and Mortality Worldwide for 36 Cancers in 185 Countries . CA Cancer J. Clin. 2021, 71, 209–249. [Google Scholar] [CrossRef] [PubMed]
- Mehraj, U.; Dar, A.H.; Wani, N.A.; Mir, M.A. Tumor Microenvironment Promotes Breast Cancer Chemoresistance. Cancer Chemother. Pharmacol. 2021, 87, 147–158. [Google Scholar] [CrossRef] [PubMed]
- Pagès, F.; Kirilovsky, A.; Mlecnik, B.; Asslaber, M.; Tosolini, M.; Bindea, G.; Lagorce, C.; Wind, P.; Marliot, F.; Bruneval, P.; et al. In Situ Cytotoxic and Memory T Cells Predict Outcome in Patients With Early-Stage Colorectal Cancer. J. Clin. Oncol. 2009, 27, 5944–5951. [Google Scholar] [CrossRef] [PubMed]
- Dieu-Nosjean, M.-C.; Antoine, M.; Danel, C.; Heudes, D.; Wislez, M.; Poulot, V.; Rabbe, N.; Laurans, L.; Tartour, E.; de Chaisemartin, L.; et al. Long-Term Survival for Patients With Non–Small-Cell Lung Cancer With Intratumoral Lymphoid Structures. J. Clin. Oncol. 2008, 26, 4410–4417. [Google Scholar] [CrossRef] [PubMed] [Green Version]
- Denkert, C.; Loibl, S.; Noske, A.; Roller, M.; Müller, B.M.; Komor, M.; Budczies, J.; Darb-Esfahani, S.; Kronenwett, R.; Hanusch, C.; et al. Tumor-Associated Lymphocytes as an Independent Predictor of Response to Neoadjuvant Chemotherapy in Breast Cancer. J. Clin. Oncol. Off. J. Am. Soc. Clin. Oncol. 2010, 28, 105–113. [Google Scholar] [CrossRef]
- Raskov, H.; Orhan, A.; Christensen, J.P.; Gögenur, I. Cytotoxic CD8+ T Cells in Cancer and Cancer Immunotherapy. Br. J. Cancer 2021, 124, 359–367. [Google Scholar] [CrossRef]
- Stanton, S.E.; Disis, M.L. Clinical Significance of Tumor-Infiltrating Lymphocytes in Breast Cancer. J. Immunother. Cancer 2016, 4, 59. [Google Scholar] [CrossRef] [Green Version]
- Merlo, A.; Casalini, P.; Carcangiu, M.L.; Malventano, C.; Triulzi, T.; Mènard, S.; Tagliabue, E.; Balsari, A. FOXP3 Expression and Overall Survival in Breast Cancer. J. Clin. Oncol. Off. J. Am. Soc. Clin. Oncol. 2009, 27, 1746–1752. [Google Scholar] [CrossRef]
- Mittendorf, E.A.; Peoples, G.E.; Singletary, S.E. Breast Cancer Vaccines: Promise for the Future or Pipe Dream? Cancer 2007, 110, 1677–1686. [Google Scholar] [CrossRef]
- McArthur, H.L.; Page, D.B. Immunotherapy for the Treatment of Breast Cancer: Checkpoint Blockade, Cancer Vaccines, and Future Directions in Combination Immunotherapy. Clin. Adv. Hematol. Oncol. 2016, 14, 922–933. [Google Scholar]
- Degnim, A.C.; Brahmbhatt, R.D.; Radisky, D.C.; Hoskin, T.L.; Stallings-Mann, M.; Laudenschlager, M.; Mansfield, A.; Frost, M.H.; Murphy, L.; Knutson, K.; et al. Immune Cell Quantitation in Normal Breast Tissue Lobules with and without Lobulitis. Breast Cancer Res. Treat. 2014, 144, 539–549. [Google Scholar] [CrossRef] [PubMed] [Green Version]
- Kolberg-Liedtke, C.; Oleg, G.; Fred, H.; Friedrich, F.; Hans, K.; Michael, C.; Benno, N.; Wolfram, M.; Toralf, R.; Rachel, W.; et al. Association of TILs with Clinical Parameters, Recurrence Score® Results, and Prognosis in Patients with Early HER2-Negative Breast Cancer (BC)—A Translational Analysis of the Prospective WSG PlanB Trial. Breast Cancer Res. BCR 2020, 22, 47. [Google Scholar] [CrossRef] [PubMed]
- Savas, P.; Salgado, R.; Denkert, C.; Sotiriou, C.; Darcy, P.K.; Smyth, M.J.; Loi, S. Clinical Relevance of Host Immunity in Breast Cancer: From TILs to the Clinic. Nat. Rev. Clin. Oncol. 2016, 13, 228–241. [Google Scholar] [CrossRef]
- El Bairi, K.; Haynes, H.R.; Blackley, E.; Fineberg, S.; Shear, J.; Turner, S.; de Freitas, J.R.; Sur, D.; Amendola, L.C.; Gharib, M.; et al. The Tale of TILs in Breast Cancer: A Report from The International Immuno-Oncology Biomarker Working Group. NPJ Breast Cancer 2021, 7, 150. [Google Scholar] [CrossRef]
- Turkki, R.; Linder, N.; Kovanen, P.E.; Pellinen, T.; Lundin, J. Identification of Immune Cell Infiltration in Hematoxylin-Eosin Stained Breast Cancer Samples: Conference on Medical Imaging—Digital Pathology. Med. IMAGING 2016 Digit. Pathol. 2016, 9791, 273–279. [Google Scholar] [CrossRef]
- Stanton, S.E.; Adams, S.; Disis, M.L. Variation in the Incidence and Magnitude of Tumor-Infiltrating Lymphocytes in Breast Cancer Subtypes: A Systematic Review. JAMA Oncol. 2016, 2, 1354–1360. [Google Scholar] [CrossRef]
- Lo Presti, E.; Dieli, F.; Meraviglia, S. Tumor-Infiltrating Γδ T Lymphocytes: Pathogenic Role, Clinical Significance and Differential Programming in the Tumor Microenvironment. Front. Immunol. 2014, 5, 607. [Google Scholar] [CrossRef] [PubMed] [Green Version]
- Salgado, R.; Denkert, C.; Demaria, S.; Sirtaine, N.; Klauschen, F.; Pruneri, G.; Wienert, S.; Van den Eynden, G.; Baehner, F.L.; Penault-Llorca, F.; et al. The Evaluation of Tumor-Infiltrating Lymphocytes (TILs) in Breast Cancer: Recommendations by an International TILs Working Group 2014. Ann. Oncol. Off. J. Eur. Soc. Med. Oncol. 2015, 26, 259–271. [Google Scholar] [CrossRef]
- Hendry, S.; Salgado, R.; Gevaert, T.; Russell, P.A.; John, T.; Thapa, B.; Christie, M.; van de Vijver, K.; Estrada, M.V.; Gonzalez-Ericsson, P.I.; et al. Assessing Tumor Infiltrating Lymphocytes in Solid Tumors: A Practical Review for Pathologists and Proposal for a Standardized Method from the International Immuno-Oncology Biomarkers Working Group: Part 1: Assessing the Host Immune Response, TILs in Invasive Breast Carcinoma and Ductal Carcinoma in Situ, Metastatic Tumor Deposits and Areas for Further Research. Adv. Anat. Pathol. 2017, 24, 235. [Google Scholar] [CrossRef] [Green Version]
- Goff, S.L.; Danforth, D.N. The Role of Immune Cells in Breast Tissue and Immunotherapy for the Treatment of Breast Cancer. Clin. Breast Cancer 2021, 21, e63–e73. [Google Scholar] [CrossRef]
- Wistuba-Hamprecht, K.; Gouttefangeas, C.; Weide, B.; Pawelec, G. Immune Signatures and Survival of Patients With Metastatic Melanoma, Renal Cancer, and Breast Cancer. Front. Immunol. 2020, 11, 1152. [Google Scholar] [CrossRef] [PubMed]
- Rovati, B.; Mariucci, S.; Delfanti, S.; Grasso, D.; Tinelli, C.; Torre, C.; De Amici, M.; Pedrazzoli, P. Simultaneous Detection of Circulating Immunological Parameters and Tumor Biomarkers in Early Stage Breast Cancer Patients during Adjuvant Chemotherapy. Cell. Oncol. Dordr. 2016, 39, 211–228. [Google Scholar] [CrossRef] [PubMed]
- Della Porta, M.G.; Lanza, F.; Del Vecchio, L. Italian Society of Cytometry (GIC) Flow Cytometry Immunophenotyping for the Evaluation of Bone Marrow Dysplasia. Cytometry B Clin. Cytom. 2011, 80, 201–211. [Google Scholar] [CrossRef] [PubMed]
- Nalio Ramos, R.; Missolo-Koussou, Y.; Gerber-Ferder, Y.; Bromley, C.P.; Bugatti, M.; Núñez, N.G.; Tosello Boari, J.; Richer, W.; Menger, L.; Denizeau, J.; et al. Tissue-Resident FOLR2+ Macrophages Associate with CD8+ T Cell Infiltration in Human Breast Cancer. Cell 2022, 185, 1189–1207.e25. [Google Scholar] [CrossRef]
- Engelbrecht, L.K.; Twigger, A.-J.; Ganz, H.M.; Gabka, C.J.; Bausch, A.R.; Lickert, H.; Sterr, M.; Kunze, I.; Khaled, W.T.; Scheel, C.H. A Strategy to Address Dissociation-Induced Compositional and Transcriptional Bias for Single-Cell Analysis of the Human Mammary Gland. bioRxiv 2021. [Google Scholar] [CrossRef]
- Whitford, P.; Mallon, E.A.; George, W.D.; Campbell, A.M. Flow Cytometric Analysis of Tumour Infiltrating Lymphocytes in Breast Cancer. Br. J. Cancer 1990, 62, 971–975. [Google Scholar] [CrossRef] [Green Version]
- Sugiyama, D.; Nishikawa, H.; Maeda, Y.; Nishioka, M.; Tanemura, A.; Katayama, I.; Ezoe, S.; Kanakura, Y.; Sato, E.; Fukumori, Y.; et al. Anti-CCR4 MAb Selectively Depletes Effector-Type FoxP3+CD4+ Regulatory T Cells, Evoking Antitumor Immune Responses in Humans. Proc. Natl. Acad. Sci. USA 2013, 110, 17945–17950. [Google Scholar] [CrossRef] [Green Version]
- Pujani, M.; Jain, H.; Chauhan, V.; Agarwal, C.; Singh, K.; Singh, M. Evaluation of Tumor Infiltrating Lymphocytes in Breast Carcinoma and Their Correlation with Molecular Subtypes, Tumor Grade and Stage. Breast Dis. 2020, 39, 61–69. [Google Scholar] [CrossRef]
- Demir, L.; Yigit, S.; Ellidokuz, H.; Erten, C.; Somali, I.; Kucukzeybek, Y.; Alacacioglu, A.; Cokmert, S.; Can, A.; Akyol, M.; et al. Predictive and Prognostic Factors in Locally Advanced Breast Cancer: Effect of Intratumoral FOXP3+ Tregs. Clin. Exp. Metastasis 2013, 30, 1047–1062. [Google Scholar] [CrossRef]
- Plitas, G.; Konopacki, C.; Wu, K.; Bos, P.; Morrow, M.; Putintseva, E.V.; Chudakov, D.M.; Rudensky, A.Y. Regulatory T Cells Exhibit Distinct Features in Human Breast Cancer. Immunity 2016, 45, 1122–1134. [Google Scholar] [CrossRef] [Green Version]
- Danforth, D.N. The Role of Chronic Inflammation in the Development of Breast Cancer. Cancers 2021, 13, 3918. [Google Scholar] [CrossRef] [PubMed]
- Locy, H.; Verhulst, S.; Cools, W.; Waelput, W.; Brock, S.; Cras, L.; Schiettecatte, A.; Jonckheere, J.; van Grunsven, L.A.; Vanhoeij, M.; et al. Assessing Tumor-Infiltrating Lymphocytes in Breast Cancer: A Proposal for Combining Immunohistochemistry and Gene Expression Analysis to Refine Scoring. Front. Immunol. 2022, 13, 794175. [Google Scholar] [CrossRef] [PubMed]
- Waldman, A.D.; Fritz, J.M.; Lenardo, M.J. A Guide to Cancer Immunotherapy: From T Cell Basic Science to Clinical Practice. Nat. Rev. Immunol. 2020, 20, 651–668. [Google Scholar] [CrossRef] [PubMed]
- Baselice, S.; Castaldo, R.; Giannatiempo, R.; Casaretta, G.; Franzese, M.; Salvatore, M.; Mirabelli, P. Impact of Breast Tumor Onset on Blood Count, Carcinoembryonic Antigen, Cancer Antigen 15-3 and Lymphoid Subpopulations Supported by Automatic Classification Approach: A Pilot Study. Cancer Control J. Moffitt Cancer Cent. 2021, 28, 10732748211048612. [Google Scholar] [CrossRef] [PubMed]
- Shohdy, K.S.; Almeldin, D.S.; Ghaly, R.; Kassem, L.; Pagani, O. Prognostic Impact of Cytotoxic CD4 T Cells in Tumor Immune Microenvironment of Patients with Breast Cancer. J. Immunother. Precis. Oncol. 2021, 5, 7–9. [Google Scholar] [CrossRef] [PubMed]
- Deshmukh, A.V.; Gupta, A.; Rathod, R.R.; Gangane, N.M. Role of CD4- and CD8-Positive T Cells in Breast Cancer Progression and Outcome: A Pilot Study of 47 Cases in Central India Region. Indian J. Gynecol. Oncol. 2020, 18, 109. [Google Scholar] [CrossRef]
- Pinho, M.P.; Barbuto, J.M. Breast Cancer Patients Have Multifunctional Tumor-Reactive CD4 T Cells in Both Blood and Tumor. Eur. J. Cancer 2019, 110, S32. [Google Scholar] [CrossRef]
- Borst, J.; Ahrends, T.; Bąbała, N.; Melief, C.J.M.; Kastenmüller, W. CD4+ T Cell Help in Cancer Immunology and Immunotherapy. Nat. Rev. Immunol. 2018, 18, 635–647. [Google Scholar] [CrossRef]
- Tay, R.E.; Richardson, E.K.; Toh, H.C. Revisiting the Role of CD4+ T Cells in Cancer Immunotherapy—New Insights into Old Paradigms. Cancer Gene Ther. 2021, 28, 5–17. [Google Scholar] [CrossRef]
- Guisier, F.; Barros-Filho, M.C.; Rock, L.D.; Strachan-Whaley, M.; Marshall, E.A.; Dellaire, G.; Lam, W.L. Janus or Hydra: The Many Faces of T Helper Cells in the Human Tumour Microenvironment. Adv. Exp. Med. Biol. 2020, 1224, 35–51. [Google Scholar] [CrossRef]
- Huntington, N.D.; Cursons, J.; Rautela, J. The Cancer–Natural Killer Cell Immunity Cycle. Nat. Rev. Cancer 2020, 20, 437–454. [Google Scholar] [CrossRef] [PubMed]
- Wu, S.-Y.; Fu, T.; Jiang, Y.-Z.; Shao, Z.-M. Natural Killer Cells in Cancer Biology and Therapy. Mol. Cancer 2020, 19, 120. [Google Scholar] [CrossRef]
- Liu, H. Emerging Agents and Regimens for AML. J. Hematol. Oncol. J. Hematol Oncol 2021, 14, 49. [Google Scholar] [CrossRef] [PubMed]
- Shimasaki, N.; Jain, A.; Campana, D. NK Cells for Cancer Immunotherapy. Nat. Rev. Drug Discov. 2020, 19, 200–218. [Google Scholar] [CrossRef] [PubMed]
- Krijgsman, D.; Hokland, M.; Kuppen, P.J.K. The Role of Natural Killer T Cells in Cancer-A Phenotypical and Functional Approach. Front. Immunol. 2018, 9, 367. [Google Scholar] [CrossRef] [PubMed]
- Kiss, M.; Caro, A.A.; Raes, G.; Laoui, D. Systemic Reprogramming of Monocytes in Cancer. Front. Oncol. 2020, 10, 1399. [Google Scholar] [CrossRef]
- Xu, Y.; Lan, S.; Zheng, Q. Prognostic Significance of Infiltrating Immune Cell Subtypes in Invasive Ductal Carcinoma of the Breast. Tumori 2018, 104, 196–201. [Google Scholar] [CrossRef]
- Miligy, I.; Mohan, P.; Gaber, A.; Aleskandarany, M.A.; Nolan, C.C.; Diez-Rodriguez, M.; Mukherjee, A.; Chapman, C.; Ellis, I.O.; Green, A.R.; et al. Prognostic Significance of Tumour Infiltrating B Lymphocytes in Breast Ductal Carcinoma in Situ. Histopathology 2017, 71, 258–268. [Google Scholar] [CrossRef]
- Thompson, E.; Taube, J.M.; Elwood, H.; Sharma, R.; Meeker, A.; Warzecha, H.N.; Argani, P.; Cimino-Mathews, A.; Emens, L.A. The Immune Microenvironment of Breast Ductal Carcinoma in Situ. Mod. Pathol. 2016, 29, 249–258. [Google Scholar] [CrossRef] [Green Version]
- Shen, M.; Wang, J.; Ren, X. New Insights into Tumor-Infiltrating B Lymphocytes in Breast Cancer: Clinical Impacts and Regulatory Mechanisms. Front. Immunol. 2018, 9, 470. [Google Scholar] [CrossRef] [Green Version]
- Denkert, C.; Wienert, S.; Poterie, A.; Loibl, S.; Budczies, J.; Badve, S.; Bago-Horvath, Z.; Bane, A.; Bedri, S.; Brock, J.; et al. Standardized Evaluation of Tumor-Infiltrating Lymphocytes in Breast Cancer: Results of the Ring Studies of the International Immuno-Oncology Biomarker Working Group. Mod. Pathol. 2016, 29, 1155–1164. [Google Scholar] [CrossRef] [PubMed]
- Nardone, A.; Cavaliere, C.; Corvigno, S.; Limite, G.; De Placido, S.; Veneziani, B.M. A Banking Strategy toward Customized Therapy in Breast Cancer. Cell Tissue Bank. 2009, 10, 301. [Google Scholar] [CrossRef] [PubMed]
- Hines, W.C.; Su, Y.; Kuhn, I.; Polyak, K.; Bissell, M.J. Sorting out the FACS: A Devil in the Details. Cell Rep. 2014, 6, 779–781. [Google Scholar] [CrossRef] [PubMed] [Green Version]
- O’Flanagan, C.H.; Campbell, K.R.; Zhang, A.W.; Kabeer, F.; Lim, J.L.P.; Biele, J.; Eirew, P.; Lai, D.; McPherson, A.; Kong, E.; et al. Dissociation of Solid Tumor Tissues with Cold Active Protease for Single-Cell RNA-Seq Minimizes Conserved Collagenase-Associated Stress Responses. Genome Biol. 2019, 20, 210. [Google Scholar] [CrossRef] [PubMed] [Green Version]


| Fibroadenomas Sample (n = 15) | ||
|---|---|---|
| 18–50 (29) | ||
| Breast Cancer Sample (n=14) | ||
| 32–77 (56) | ||
| Sex | ||
| Woman | 29 | |
| Man | 0 | |
| Histologic Types | ||
| 14 Invasive breast cancer “no special type” | ||
| 1 Invasive lobular carcinoma | ||
| 15 Fibroadenoma | ||
| Ki67 | ||
| Low (0–29%) | 11 | |
| High (30–100%) | 4 | |
| Grade | ||
| G1 | 3 | |
| G2 | 10 | |
| G3 | 2 | |
| Tumor size | ||
| Breast malignancies | Fibroadenoma | |
| (0.1–2 cm) | 3 | 4 |
| (2–5 cm) | 12 | 11 |
| Breast tumor TILs grade (n) | ||
| Absent | Mild | Moderate |
| 7 | 7 | 1 |
| T-Lymphocytes | CD4+ T-Lymphocytes | CD8+ T-Lymphocytes | ||||
|---|---|---|---|---|---|---|
| Tumors | Fibroadenoma | Tumors | Fibroadenoma | Tumors | Fibroadenoma | |
| Minimum | 58.57 | 48.76 | 22.24 | 7.360 | 18.82 | 23.70 |
| 25% percentile | 71.93 | 52.12 | 26.94 | 14.61 | 25.95 | 43.54 |
| Median | 84.89 | 56.82 | 47.47 | 22.08 | 38.17 | 57.15 |
| 75% percentile | 87.76 | 63.07 | 66.07 | 43.93 | 56.48 | 65.4 |
| Maximum | 92.54 | 82.86 | 76.06 | 56.85 | 59.79 | 88.27 |
| CD4+-CD8+ Ratio | CD4+/HLA-DR+ T-Lymphocytes | CD8+/HLA-DR+ T-Lymphocytes | ||||
| Tumors | Fibroadenoma | Tumors | Fibroadenoma | Tumors | Fibroadenoma | |
| Minimum | 0.4418 | 0.08338 | 29.52 | 71.92 | 10.4 | 3.61 |
| 25% percentile | 0.511 | 0.2249 | 40.83 | 74.94 | 36.33 | 28.52 |
| Median | 1.195 | 0.3511 | 58.98 | 90.06 | 59.53 | 54.41 |
| 75% percentile | 2.23 | 0.8828 | 88.79 | 98.27 | 81.54 | 75.97 |
| Maximum | 4.041 | 2.399 | 95.73 | 99.73 | 92.91 | 96.99 |
| NK cells | CD56+/CD16+ NK Cells | CD56+/CD3+ NK-T Cells | ||||
|---|---|---|---|---|---|---|
| Tumors | Fibroadenoma | Tumors | Fibroadenoma | Tumors | Fibroadenoma | |
| Minimum | 4.56 | 4.18 | 2.00 | 2.38 | 2.84 | 5.28 |
| 25% percentile | 9.95 | 14.48 | 5.45 | 4.838 | 27.24 | 6.98 |
| Median | 18.47 | 24.76 | 13.43 | 10.69 | 35.26 | 14.8 |
| 75% percentile | 31.7 | 37.19 | 22.39 | 12.88 | 56.15 | 24.56 |
| Maximum | 59.6 | 42.01 | 35.38 | 56.84 | 74.39 | 31.08 |
| CD56+/CD3+/CD4+ NK cells | CD56+/HLA-DR+ NK cells | CD56+/CD3+/HLA-DR+ NK cells | ||||
| Tumors | Fibroadenoma | Tumors | Fibroadenoma | Tumors | Fibroadenoma | |
| Minimum | 16.88 | 4.35 | 13.71 | 5.56 | 16.22 | 1.790 |
| 25% percentile | 30.3 | 8.053 | 29.53 | 8.15 | 41.52 | 22.61 |
| Median | 48.29 | 20.35 | 33.94 | 25.19 | 66.94 | 38.04 |
| 75% percentile | 60.48 | 49.69 | 71.04 | 34.56 | 87.88 | 59.92 |
| Maximum | 72.73 | 63.86 | 89.91 | 80.45 | 96.88 | 67.00 |
| Lymphocytes/Monocytes Ratio | CD14+ Monocytes | |||
|---|---|---|---|---|
| Tumors | Fibroadenoma | Tumors | Fibroadenoma | |
| Minimum | 2.175 | 1.863 | 0.4300 | 5.000 |
| 25% percentile | 5.656 | 3.074 | 1.510 | 5.515 |
| Median | 8.52 | 5.377 | 4.970 | 6.890 |
| 75% percentile | 18.72 | 7.265 | 6.790 | 19.14 |
| Maximum | 55.64 | 8.158 | 13.32 | 24.34 |
| CD14+/CD16+ Monocytes | CD14+/HLA-DR+ Monocytes | |||
| Tumors | Fibroadenoma | Tumors | Fibroadenoma | |
| Minimum | 0.2200 | 0.0900 | 25.00 | 27.83 |
| 25% percentile | 0.3900 | 0.4650 | 35.11 | 44.38 |
| Median | 0.7600 | 0.9050 | 58.02 | 62.14 |
| 75% percentile | 2.450 | 3.568 | 63.27 | 69.47 |
| Maximum | 5.220 | 4.640 | 75.68 | 83.02 |
Publisher’s Note: MDPI stays neutral with regard to jurisdictional claims in published maps and institutional affiliations. |
© 2022 by the authors. Licensee MDPI, Basel, Switzerland. This article is an open access article distributed under the terms and conditions of the Creative Commons Attribution (CC BY) license (https://creativecommons.org/licenses/by/4.0/).
Share and Cite
Coppola, L.; Smaldone, G.; D’aiuto, M.; D’aiuto, G.; Mossetti, G.; Rinaldo, M.; Verticilo, S.; Nicolai, E.; Salvatore, M.; Mirabelli, P. Identification of Immune Cell Components in Breast Tissues by a Multiparametric Flow Cytometry Approach. Cancers 2022, 14, 3869. https://doi.org/10.3390/cancers14163869
Coppola L, Smaldone G, D’aiuto M, D’aiuto G, Mossetti G, Rinaldo M, Verticilo S, Nicolai E, Salvatore M, Mirabelli P. Identification of Immune Cell Components in Breast Tissues by a Multiparametric Flow Cytometry Approach. Cancers. 2022; 14(16):3869. https://doi.org/10.3390/cancers14163869
Chicago/Turabian StyleCoppola, Luigi, Giovanni Smaldone, Massimiliano D’aiuto, Giuseppe D’aiuto, Gennaro Mossetti, Massimo Rinaldo, Simona Verticilo, Emanuele Nicolai, Marco Salvatore, and Peppino Mirabelli. 2022. "Identification of Immune Cell Components in Breast Tissues by a Multiparametric Flow Cytometry Approach" Cancers 14, no. 16: 3869. https://doi.org/10.3390/cancers14163869
APA StyleCoppola, L., Smaldone, G., D’aiuto, M., D’aiuto, G., Mossetti, G., Rinaldo, M., Verticilo, S., Nicolai, E., Salvatore, M., & Mirabelli, P. (2022). Identification of Immune Cell Components in Breast Tissues by a Multiparametric Flow Cytometry Approach. Cancers, 14(16), 3869. https://doi.org/10.3390/cancers14163869