1. Introduction
Lung cancer is a major cause of cancer mortality worldwide with an estimated 1.8 million deaths in 2020 [
1]. Standard treatments for lung cancer include surgery, chemotherapy, radiotherapy, as well as molecularly targeted therapies and immunotherapy [
2,
3]. Surgery is the therapeutic option of choice for early-stage non-small cell lung cancer (NSCLC), although only less than 20% of NSCLC cases are diagnosed when the disease is confined to the primary site. Unfortunately, even in the case of localized, radically resected NSCLC, approximately one-third of patients experience disease recurrence; therefore, the global 5-year overall survival (OS) rate of 60% is still unsatisfactory [
4]. Currently, the main prognostic factor in radically resected NSCLC is represented by the post-operative stage; indeed, adjuvant chemotherapy is currently proposed if lymph node involvement or a tumor greater than 4.0 cm are confirmed. However, the global benefit from adjuvant chemotherapy is limited, being a 5-year absolute survival benefit equal to 4% [
5]. Notably, apart from the post-operative stage and the performance status, reliable prognostic factors able to predict the benefit from adjuvant treatments are still lacking [
6]. Therefore, the identification of new biological biomarkers capable of predicting clinical outcome and improving the management of patients with resected lung cancer remains a hitherto unmet need. To date, growing evidence shows that cancer progression might depend on a dual interconnection between cancer cells and the surrounding tumor microenvironment (TME) [
7,
8]. Liquid biopsy, intended as a minimally invasive and accessible tool, is an alternative method to tumor biopsy to investigate the connection between cancer cells and TME in this framework [
9]. Among all circulating bio-sources, extracellular vesicles, including exosomes, can be released from all cells, representing a source of unique information on TME [
10]. In particular, it has been suggested that they would mediate the intercellular crosstalk in both physiological and pathological conditions through the transfer of specific genetic molecules. Exosomal microRNAs (Exo-miRs), a class of regulatory elements of post-transcriptional gene expression, are the most enriched and most frequently studied as biomarkers [
11]. In addition to Exo-miRs, a low molecular weight protein fraction (LMW) can be found in biological fluids, and specific proteolytic degradation patterns have been correlated with patient outcomes in oncology. The origin of these circulating peptides identified in cancer patients is still a matter of scientific debate, although it has been suggested that they might derive from degradation of proteins involved in pathways activated by the primary tumor [
12]. In the last decade, the analysis of the serum peptidome has become a topic of great interest in the study of some cancers including NSCLC [
12,
13]. Both Exo-miRs [
14,
15,
16,
17] and peptidome [
18] have been proposed as promising prognostic biomarkers in NSCLC, although without reliable results, especially when considered individually. Indeed, increasing evidence supports the hypothesis that the combination of blood-based biomarkers can provide more accurate prognostic scores [
19,
20].
The aim of this study was to investigate the combined role of exo-miRs and peptidome, in association with clinical parameters, to predict disease recurrence of early-stage NSCLC patients surgically treated with curative intent. This composite prognostic signature might potentially allow the selection of patients at “high risk” of relapse to be proposed adjuvant treatments and who deserve post-surgical follow-up at shorter regular intervals. In addition, in vitro studies in NSCLC cell lines were performed to evaluate the effects of Exo-miRs.
2. Materials and Methods
2.1. Patient Selection and Biological Sample Collection
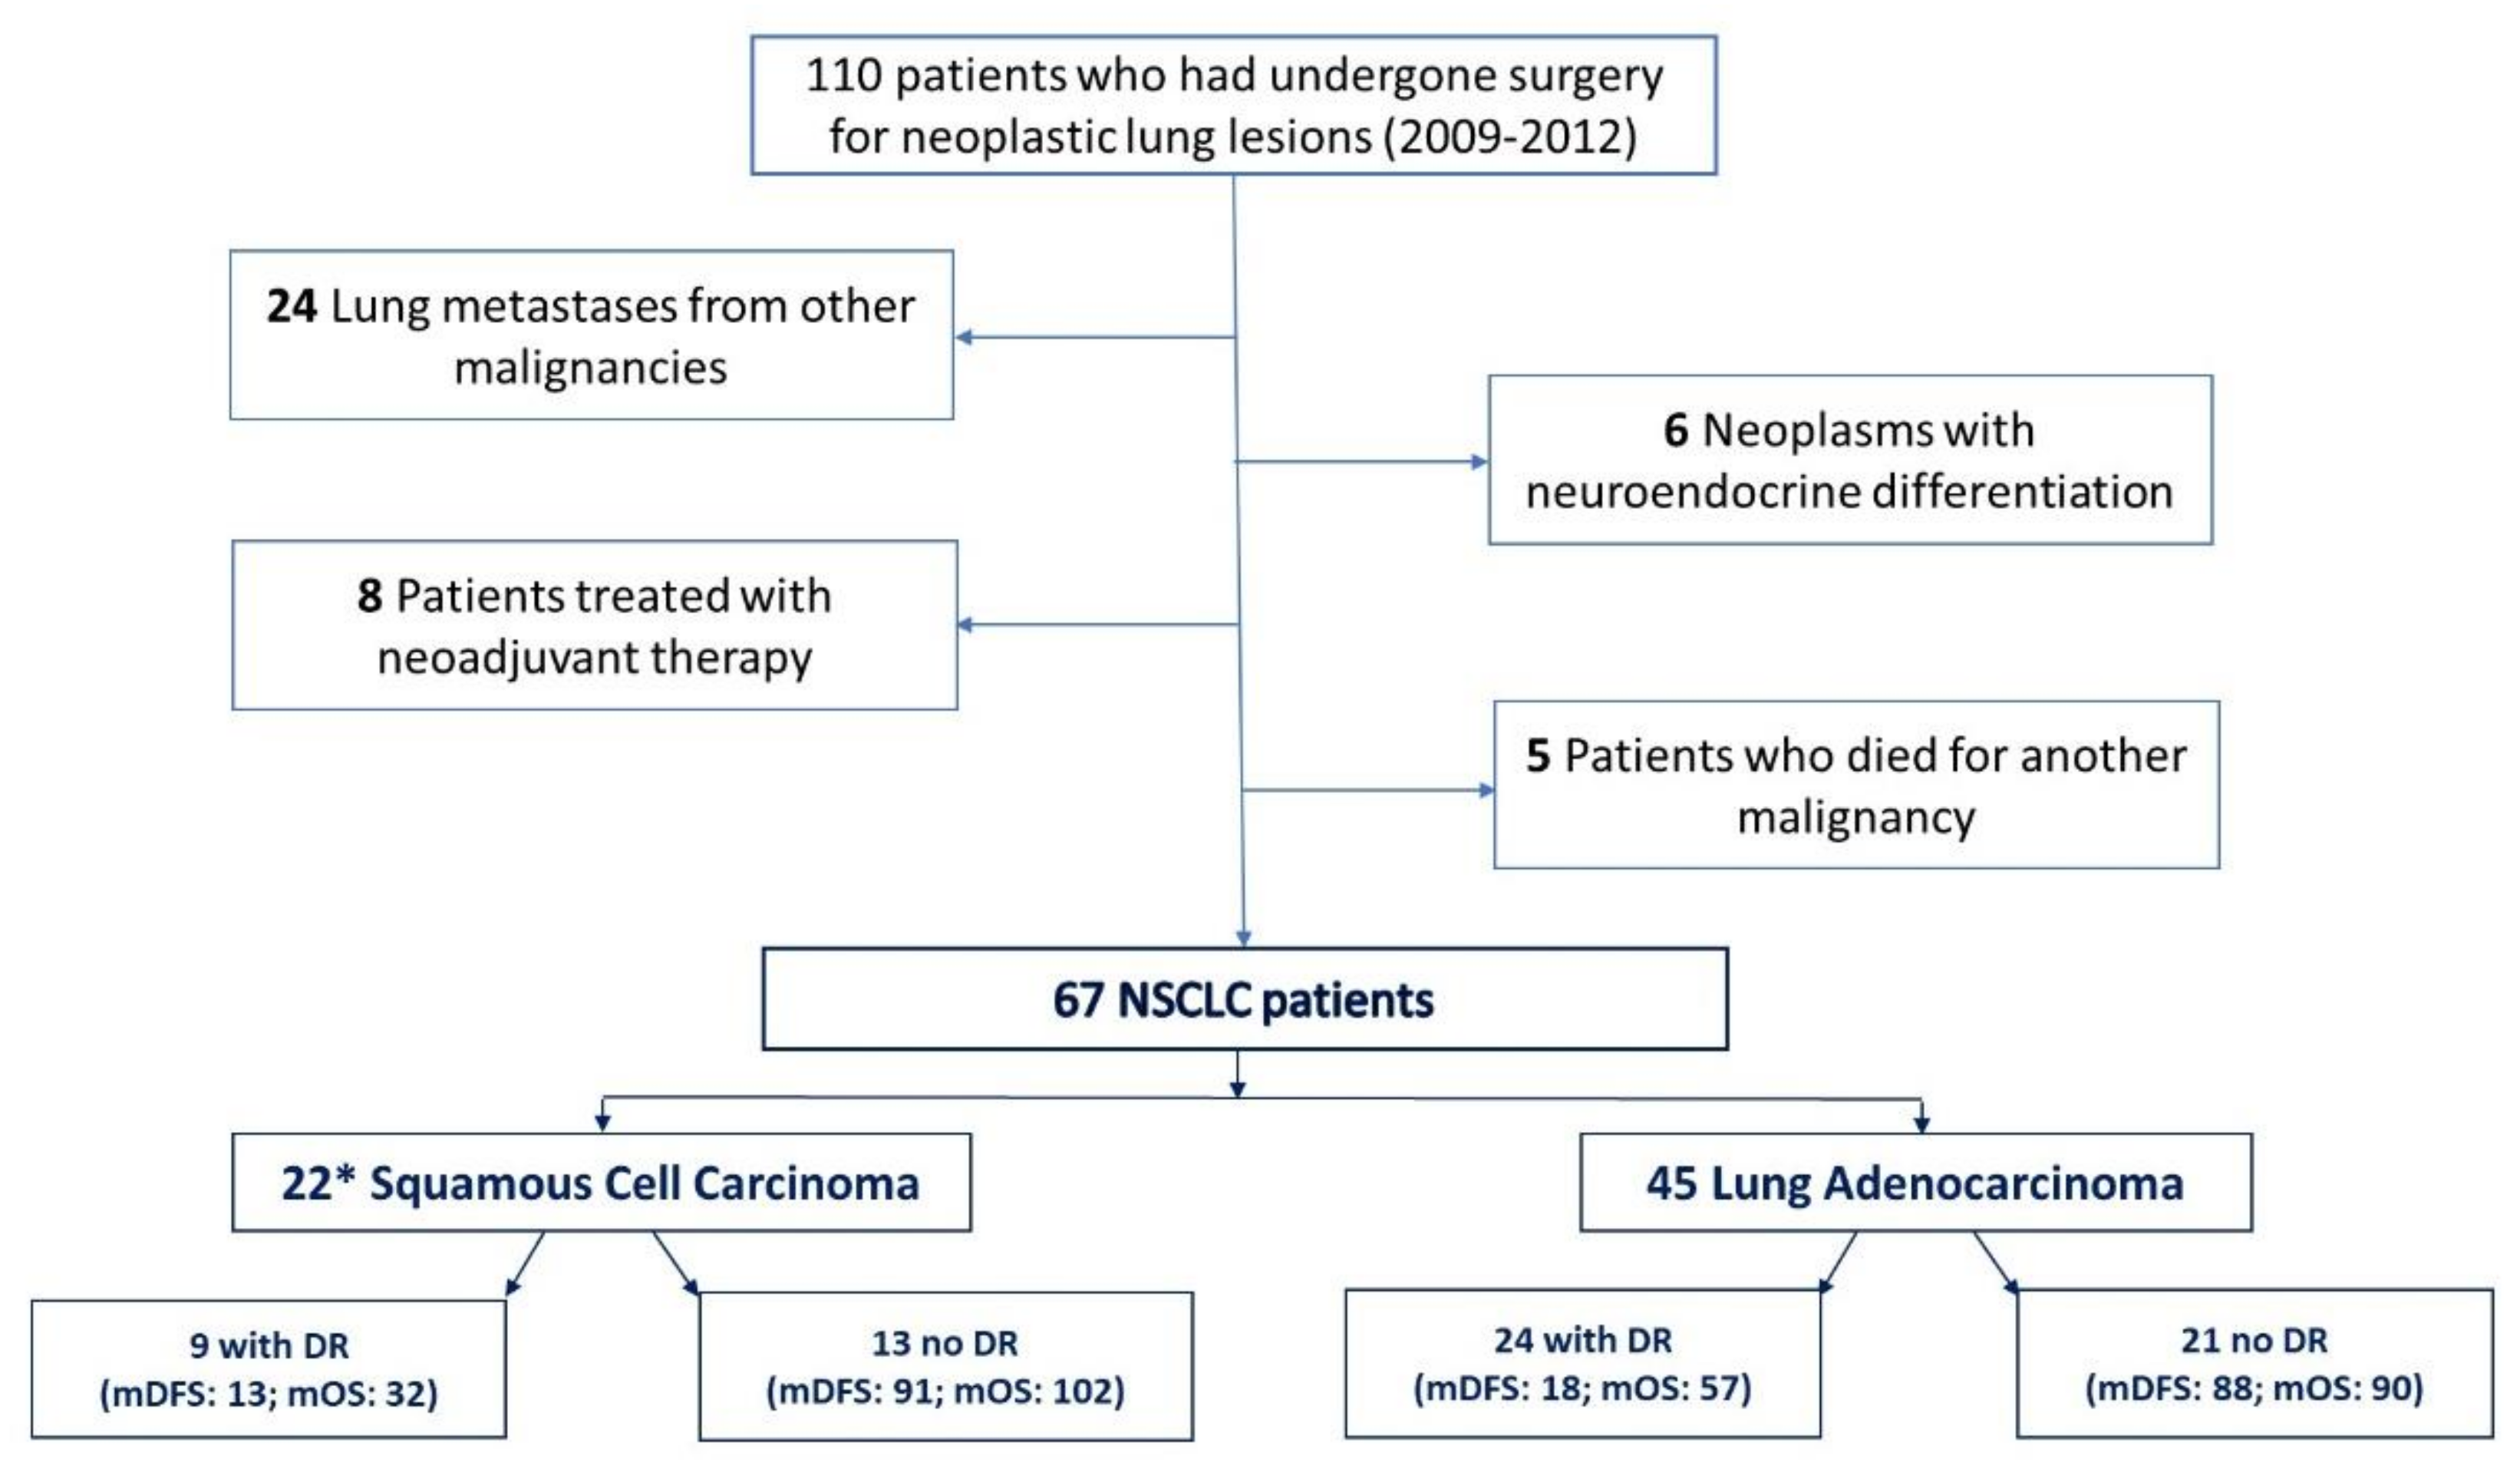
Biological samples (i.e., serum and plasma) from a cohort of 110 patients who had undergone surgery for a lung malignancy between 2009 and 2012 were obtained from the Biological Resource Center (CRB-HSM) of the IRCCS Ospedale Policlinico San Martino (Genova, Italy). The timespan was established in order to ensure that all the evaluated patients had an adequate follow-up for OS. All the biological samples were collected before surgical resection. Exclusion criteria were: (i) lung metastases from other malignancies; (ii) neoplasms with neuroendocrine differentiation (due to their different prognosis from adenocarcinomas and squamous-cell carcinoma); (iii) previous neoadjuvant therapy for NSCLC (due to its potential effect on the Exo-miR enrichment); (iv) death from a cause other than NSCLC; (v) unresectable IIIB and IV stage NSCLC (Tumor, Node, Metastasis (TNM) 7th International Union Against Cancer (UICC) Edition) [
21]. The present study has been approved by the Local Ethics Committee (126/2019) and conducted in compliance with the provisions of the Declaration of Helsinki. For each patient included in the study, a written informed consent was obtained.
2.2. Microarray Analysis
Exo total RNA was purified from 0.5 mL of plasma using the ExoRNeasy Midi Kit (Qiagen, Hilden, Germany) and the miR presence was assessed by Qubit™ using the microRNA Assay Kit (Thermo Fisher Scientific, San Jose, CA, USA). The Exo-miR expression was profiled according to our optimized protocol [
22]. Briefly, 8 µL of Exo-RNA with the spike-in controls were labeled and hybridized on SurePrint Human miR Microarrays 8 × 60 K (Agilent Technologies, Santa Clara, CA, USA; AMADID: 070156). We also added a synthetic 30-mer DNA poly-A oligonucleotide 3′ labeled pCp-Cy3 (50 amol) (TIB Molbiol SRL, Genova, Italy) to each hybridization mix to improve the Bright Corner signals for the automatic gridding. After 24 h of hybridization, the fluorescent signals of microarray were acquired using the G2565CA scanner (Agilent Technologies) and images were processed by Feature Extraction software v.9.5.3.1 (Agilent Technologies). Raw and processed data are available in the Gene Expression Omnibus (GEO;
https://www.ncbi.nlm.nih.gov/geo/; accessed on 1 May 2022, ID: GSE198958). Analyses were performed using R software environment for statistical computing. Pre-processing, filtering and a differential expression analysis were carried out using the Limma package for microarray analysis, using the normexp method with an offset = 20 for background correction and the scale method for between array normalization. Replicated probes for the same miR were then averaged. Pre-filtering based on logIntensity >7 was performed before carrying out statistical analyses.
2.3. MiR Expression Assessment by Droplet Digital and Quantitative PCR
The absolute quantification of prognostic Exo-miRs was assessed by QX200 Droplet Digital PCR System (ddPCR) (Bio-Rad Laboratories, Hercules, CA, USA) as already described [
23]. Briefly, 5.5 µL of Exo-RNA was reverse-transcribed (RT) using the miRCURY LNA RT Kit including the spike-in RNA control UniSp6 (Qiagen). Then, 4.5–9 µL of the diluted RT templates (1:50–5000) was amplified using the ddPCR™ EvaGreen Supermix (Bio-Rad Laboratories) and the specific miRCURY LNA miR PCR Assay (
Table S2). The data were analyzed using the QuantaSoft software (Bio-Rad). Each sample was run in duplicate with a negative template control (NTC) and the absolute quantification (copies/µL) was assessed as a merger of two replicates in bidimensional visualization applying the threshold based on the NTC signal. Samples were repeated when: (i) droplet number was below 10,000, (ii) there were too many positive droplets (i.e., higher than 50% of total droplets), (iii) the standard deviation was higher than 50 and/or higher than the mean of two replicates. The absolute quantification was obtained as ratio between the copy number of Exo-miRs and the UniSp6. The relative expression of miRs in the human NSCLC cells after transfection was assessed by qPCR. For each reaction, 60 ng of total RNA isolated by miRNeasy Kit, including a step of DNA digestion, was used. Each sample was amplified in duplicate on RealPlex2 system (Eppendorf) using iTaq Univer SYBR Green Supermix (Bio-Rad Laboratories) and normalized against U6 snRNA (
Table S2). The relative expression compared to the negative control (cells transfected with a scrambled control) was assessed by the formula 2
−∆∆CT.
2.4. NanoString Gene Expression Analysis
Gene expression analysis was performed on transfected NSCLC cell lines using the nCounter platform (NanoString Technologies, Seattle, WA, USA) according to the manufacturer’s instructions. Specifically, we used the Human PanCancer Progression Panel that includes 740 cancer genes involved in the tumor progression processes such as angiogenesis, extracellular matrix remodeling, epithelial-to-mesenchymal transition and metastasis, plus 30 internal reference controls. Briefly, 150 ng of total RNA were bound with a Reporter CodeSet and a Capture ProbeSet and then hybridized at 65 °C for 21 h. Samples were purified and then loaded onto the nCounter Cartridge by the nCounter Prep Station, and RNA was quantified by using the Digital nCounter Nanostring. RCC files deriving from counting process were first evaluated using nSolver 4.0 Analysis Software (Nanostring) performing a quality control through the fields of view count, binding density parameter and the eventual presence of any warning flags. Data were then analyzed using the Advanced Analysis 2.0 plug-in of nSolver system. Target genes which achieved ≥1.5 and ≤−1.5-fold change values and p-value < 0.05 were considered for analysis. Raw data are available in GEO (ID: GSE198957).
2.5. Cell Culture, miR Transfection and Apoptosis/Proliferation Assays
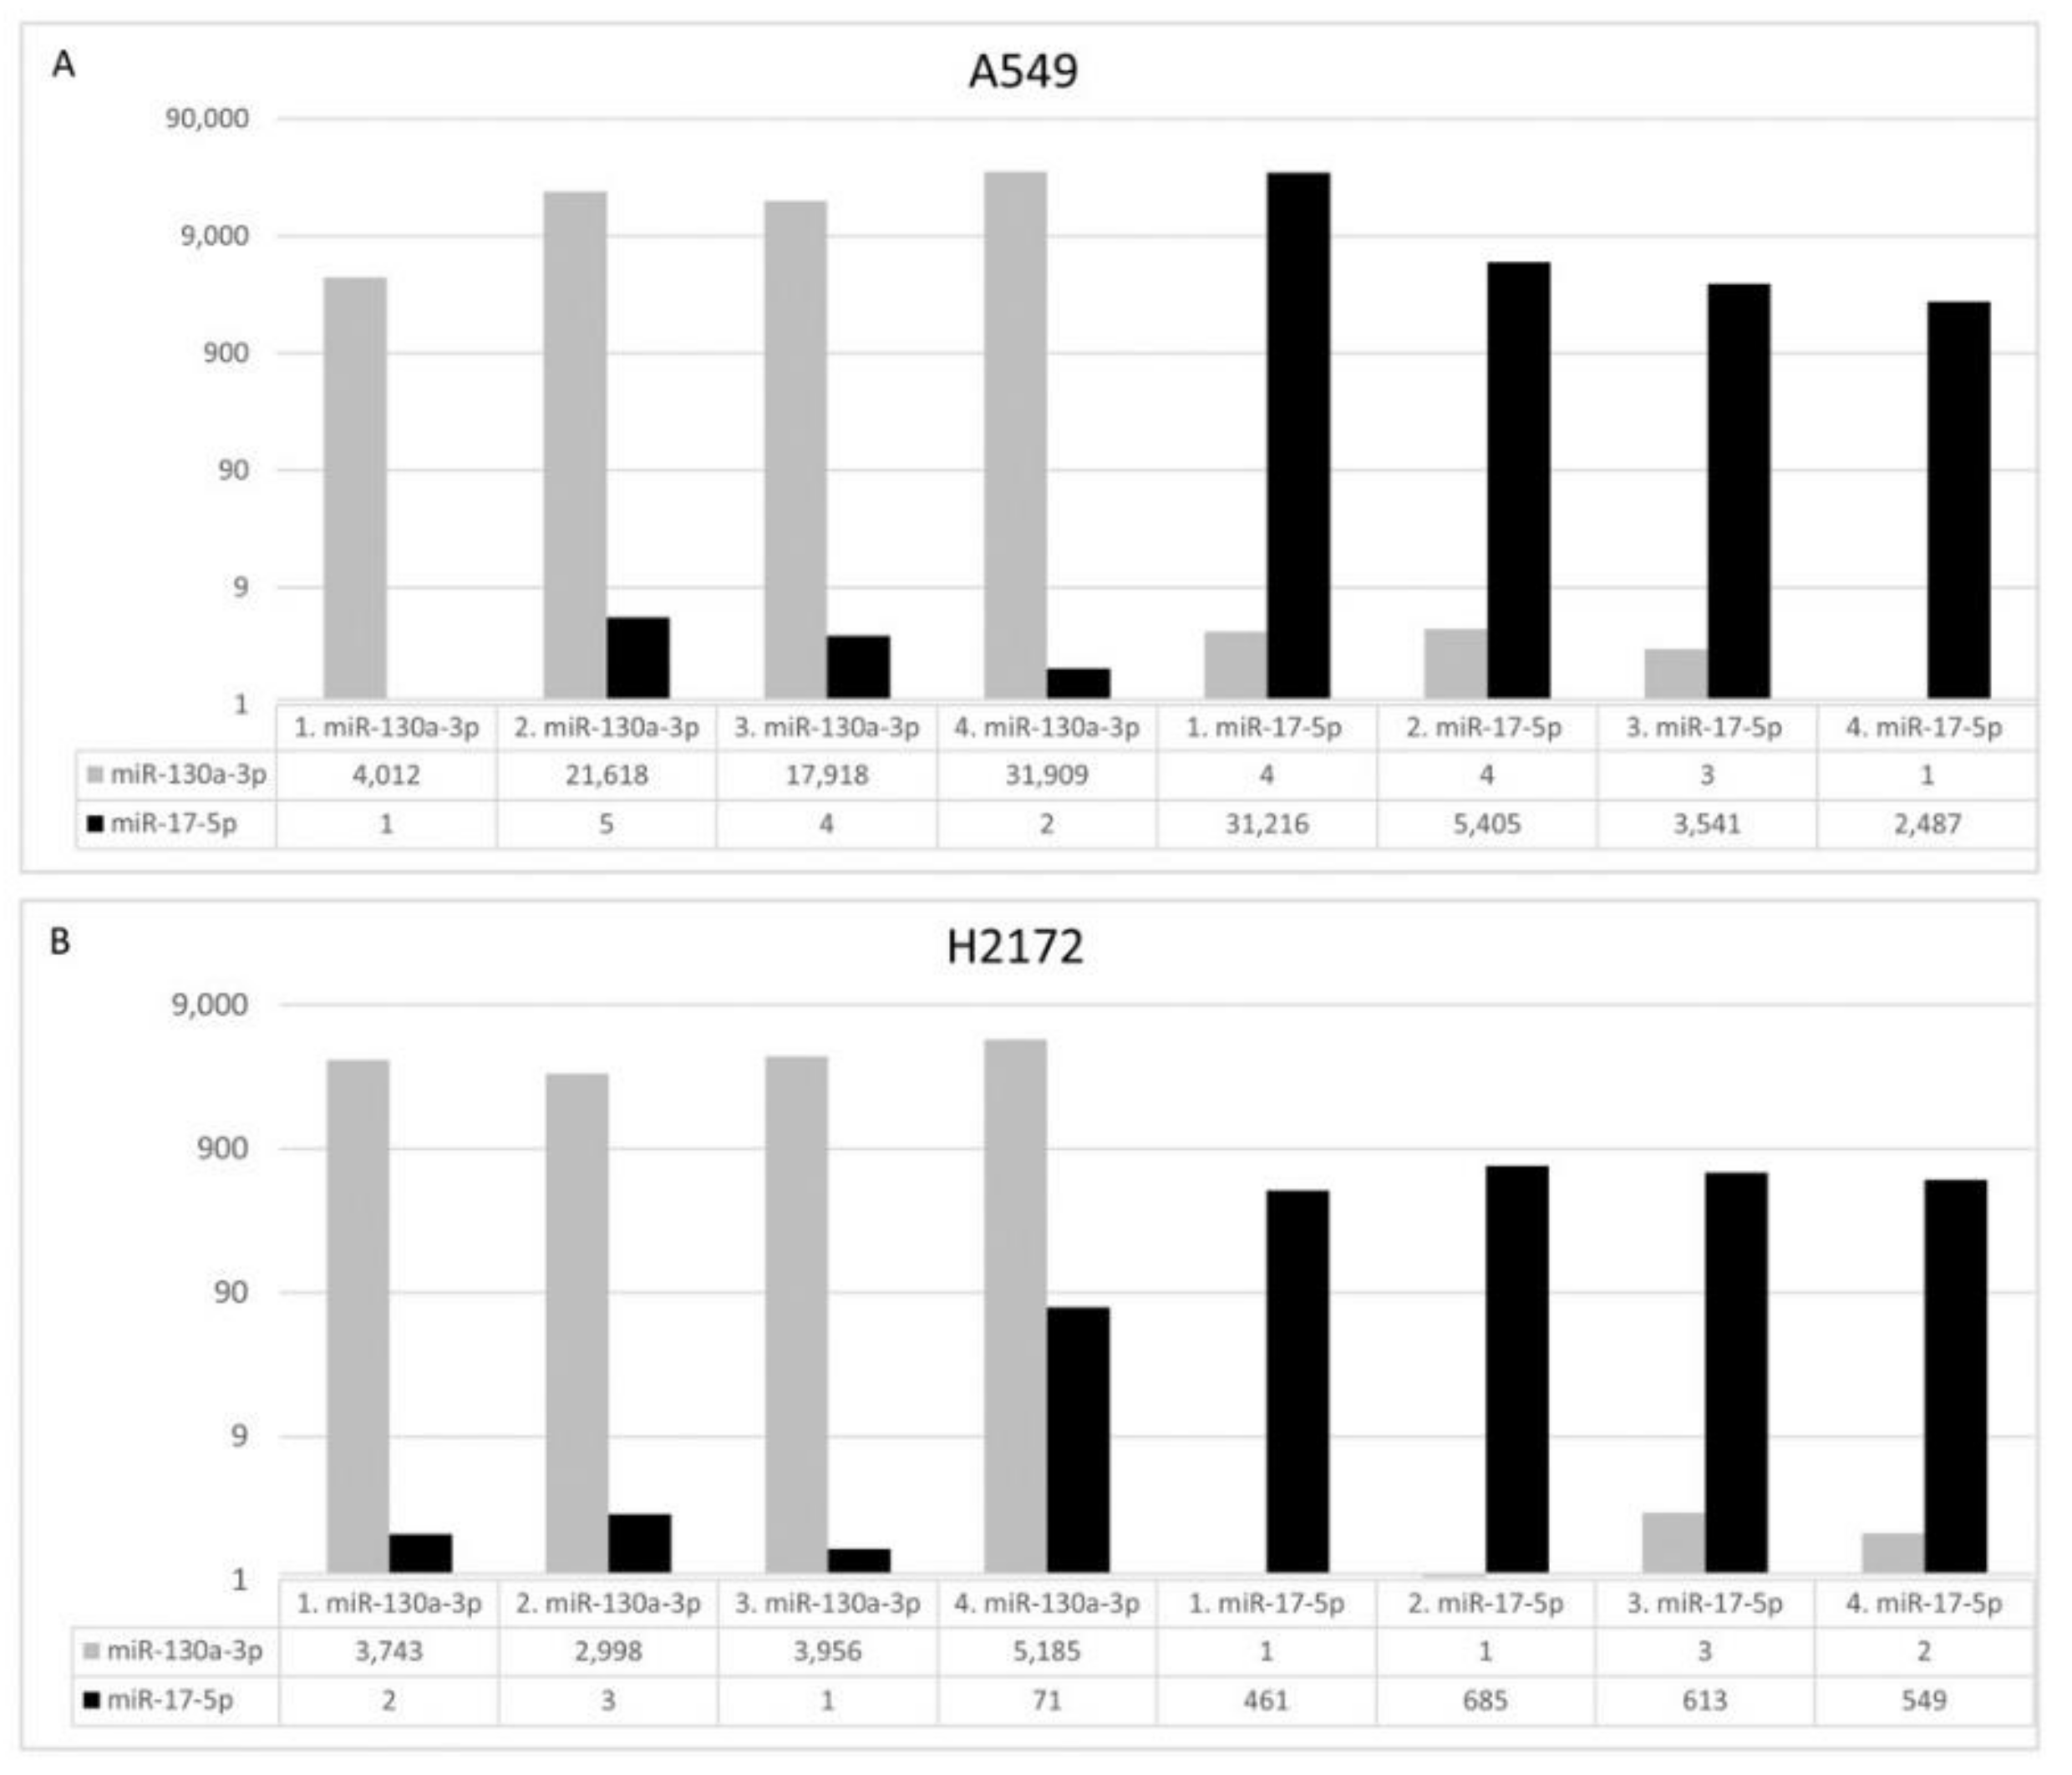
The human A549 and NCI-H2172 (H2172) cell lines were obtained from Interlab Cell Line Collection (ICLC; IRCCS Ospedale Policlinico San Martino, Genova, Italy) and American Type Culture Collection (ATCC, Manassas, VA, USA), respectively. The short tandem repeat profiles were confirmed prior the start of any in vitro experiments. NSCLC cells were cultured in RPMI culture medium and 10% fetal bovine serum under the standard conditions with 5% CO2 atmosphere at 37 °C. The hsa-miR-130a-3p (YM00472237-ADA), hsa-miR-17-5p (YM00471966-ADA) and Negative Control (NC; YM00479903-ADA) miRCURY miRs were purchased from Qiagen. A549 and H2172 cells were seeded at 5 × 10⁴/mL and 105, respectively, in 24-well plates and transfected with 50 nM miRCURY miR with lipofectamine 2000 (Thermo Fisher Scientific), according to manufacturer’s instructions. After 72 or 96 h, cells were seeded at 5 × 10⁴/mL in 24-well plates and transfected with 50 nM miRCURY miR with lipofectamine 2000 (Thermo Fisher Scientific), according to manufacturer’s instructions. After 72 h, cells were harvested to measure miR levels after transfection (qPCR) and evaluate proliferation (cell counts), apoptosis (Annexin V-FITC/PI Staining Assay) and cell cycle. For apoptosis detection, 1 × 10⁵ transfected cells were labeled with Annexin V-fluorescein isothiocyanate (FITC) and Propidium Iodide (PI) accordingly to manufacturer’s instructions (Thermo Fisher Scientific). Flow cytometer (FACSCalibur, Becton Dickinson, East Rutherford, NJ, USA) was utilized to acquire data and CellQuest (Becton Dickinson) software for data analysis. For the cell cycle analysis, 1 × 10⁵ transfected cells were incubated in PI staining solution. Cell cycle was determined using FACSCalibur (Becton Dickinson) and analyzed by ModFit (Becton Dickinson). For each analysis four biological replicates were performed.
2.6. Solid Phase Extraction and Atmospheric Pressure-Matrix Assisted Laser Desorption Ionization/Mass Spectrometry (AP-MALDI/MS) Analysis
The LMW protein fraction was extracted from serum samples as described in our previous study [
24] using functionalized magnetic beads (DynabeadsVR RPC 18 Life Technologies Dynal, Irvine, CA, USA) with a C18 alkyl-modified surface. A synthetic internal standard peptide (MW 1419.76) was spiked (3.5 pmol/L) in the eluting solution to normalize the data. A standard procedure has been used to prepare the target plates for the AP-MALDI/MS analysis [
25]. AP-MALDI analysis was acquired in positive mode on a Q-Exactive Plus Orbitrap mass spectrometer (Thermo Fisher Scientific) equipped with an AP-MALDI Ion Source (MassTech). We have applied the following parameters: spray voltage 3.8 kV, capillary temperature 320° C, S-lens RF level 100 and sheath and auxiliary gas flow rate were 3 and 1, respectively. High-resolution mass spectra, in the range from 800 to 3000 m/z, were acquired using a laser power at 35% of maximum, at resolution 70,000, autogain control 5e6 and maxIT 100ms. Full scan data were processed with Xcalibur v.4.1 (Thermo Fisher Scientific). Data acquisition was automated using Target NG 8.8.3 AP/MALDI PDF Control Software (MassTech) and programmed at a Laser Repetition Rate of 10,001 Hz. The irradiation program was automated using the spiral motion control of the PDF-MALDI ion source. Raw data were converted from the proprietary format (.RAW) to the mzML standard format by using MSconvert, a tool of the software suite ProteoWizard [
26]. Single acquisition scans were obtained from the mzML formatted data by means of the MALDIquant R package [
27]. Since each acquisition corresponded to five distinct aliquots of the same sample, five spectra, corresponding to the quintuplicated spots, were then determined for each sample by averaging 227 consecutive scans, corresponding to about 90 s of acquisition. In the resulting spectrum, two peaks may be considered separated if differing by at least 0.02 m/z. Software used for the identification of the starting and ending scans and for the computation of the spectra is available from the authors upon request by the interested parties. The integrity of each serum sample was tested by means of SeraDeg [
28], while Geena 2 [
29] was used for pre-processing of spectra which were then analyzed by using the SAM (Significance Analysis of Microarrays) statistical method in order to identify signals significantly different in the two groups (relapsed vs. non-relapsed patients). For each signal, the SAM analysis produced a
q-value, described as a
p-value adapted to a large number of comparisons, which was applied by using a threshold of 0.05 to assess the significance of the difference for that signal. The SAMR software that implements the SAM method by using the R statistical language was used to perform this task [
30].
2.7. Statistical Analysis
Univariate and multivariable stepwise Cox regression analyses were carried out using both biological and clinical variables by applying the coxph function from the survival R package. For microarray data, prefiltering based on fold-change >1.5 between cases with and without progression was done before applying univariate Cox regression analysis. Akaike’s Information Criterion (AIC), evaluated using the AIC function from the stat R package, was used to compare models, where lower AIC means better fitting of the model. The risk score to select patients according to their association to relapse was calculated by means of a weighted sum of the variables in the model, where the weights are the Cox regression coefficients (Hazard Ratio: HR). Predictor values are centered using their overall means. Cell line analyses were performed using PRISM 9 (Graph-Pad Software, San Diego, CA, USA), applying the unpaired Student’s t-test.
4. Discussion
The early detection of poor outcomes in patients with resected lung cancer represents the key to successful clinical management of this population of patients. To date, beyond disease stage at surgery, extremely limited predictive biomarkers have been identified in the post-operative setting [
6]. Furthermore, the adjuvant treatment for early-stage NSCLC has recently been updated due to the introduction of an immune checkpoint blockade [
31]; hence, improving the identification of patients with high risk of recurrence after resection might result in the optimization of adjuvant strategies for NSCLC. Growing evidence reports that tumor progression might also depend on a dual interconnection between cancer cells and the surrounding TME [
7]. The circulating exosome, entrapping genetic material such as miRs, has been demonstrated to be a potent mediator in the crosstalk between tumor and microenvironmental cells such as stromal and immune cells [
10]. Specific peptidome patterns have also been correlated with cancer patient outcomes [
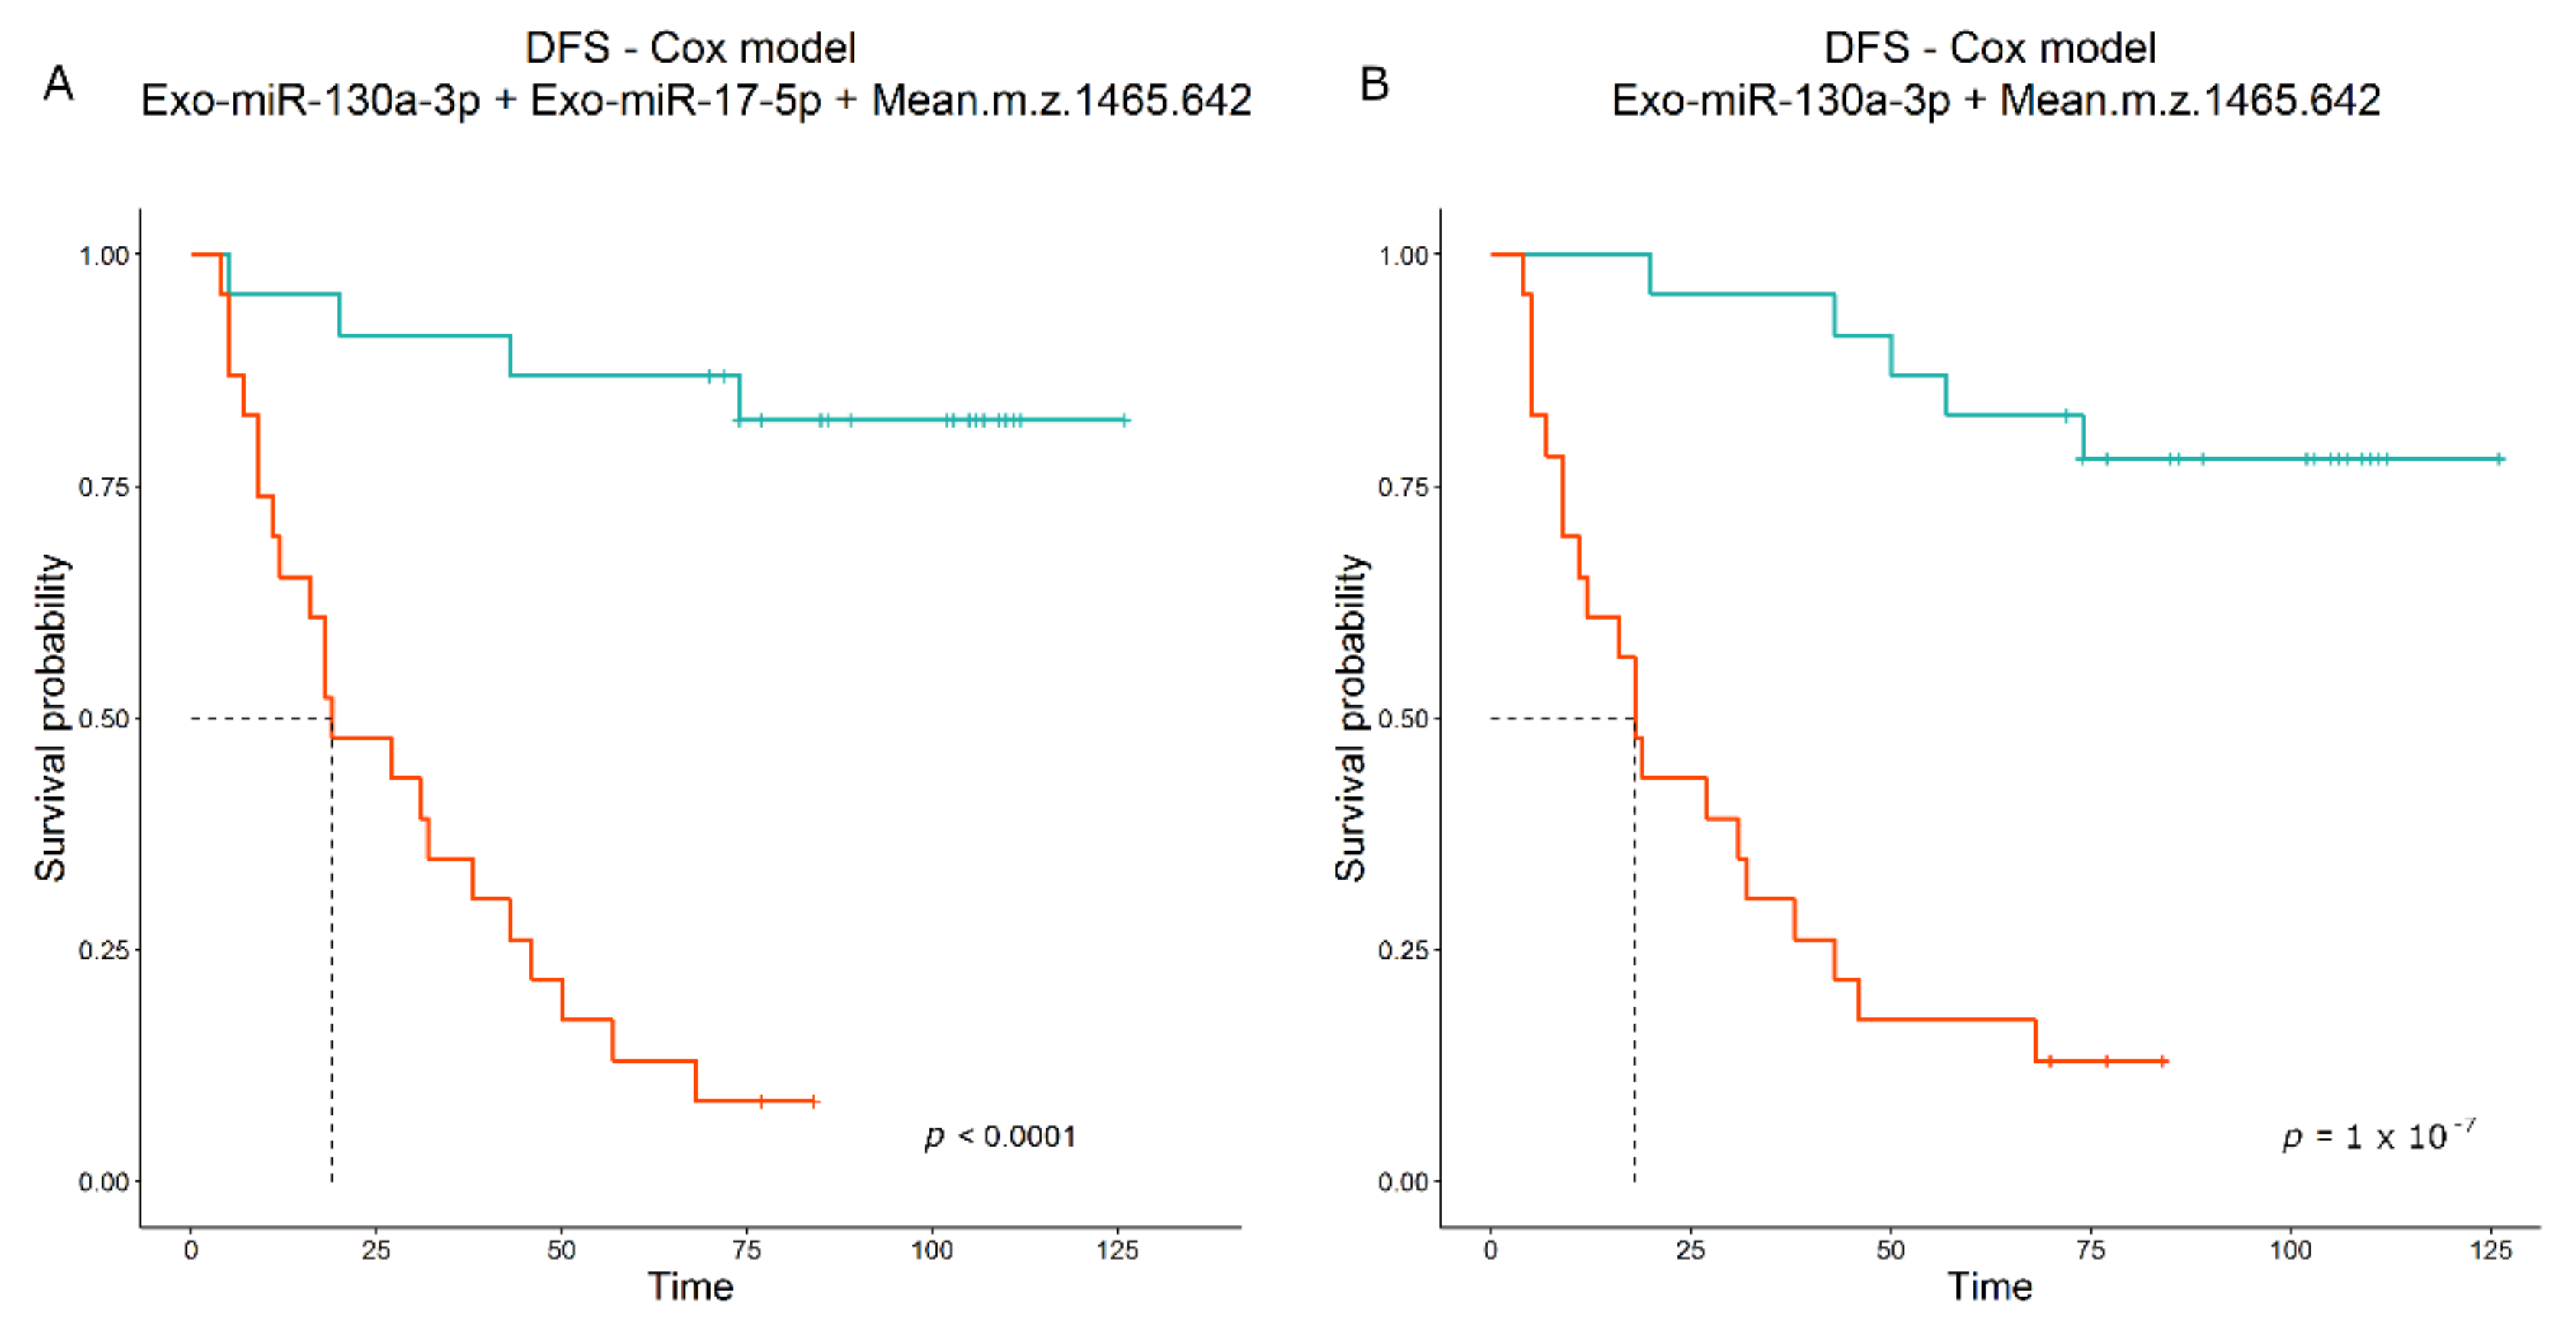
12]. In the present study, we performed an extensive analysis of circulome-derived markers, including Exo-miRnome and peptidome, to build a prognostic score that turned out to be an ideal model. The Exo-miR profiling showed a significant increase in Exo-miR-130a-3p in patients with relapse. MiR-130a-3p has mainly been described as down-modulated in lung cancer compared to normal lung tissue [
32], but the Exo associated form has been correlated with an unfavorable prognosis in some cancer types [
33,
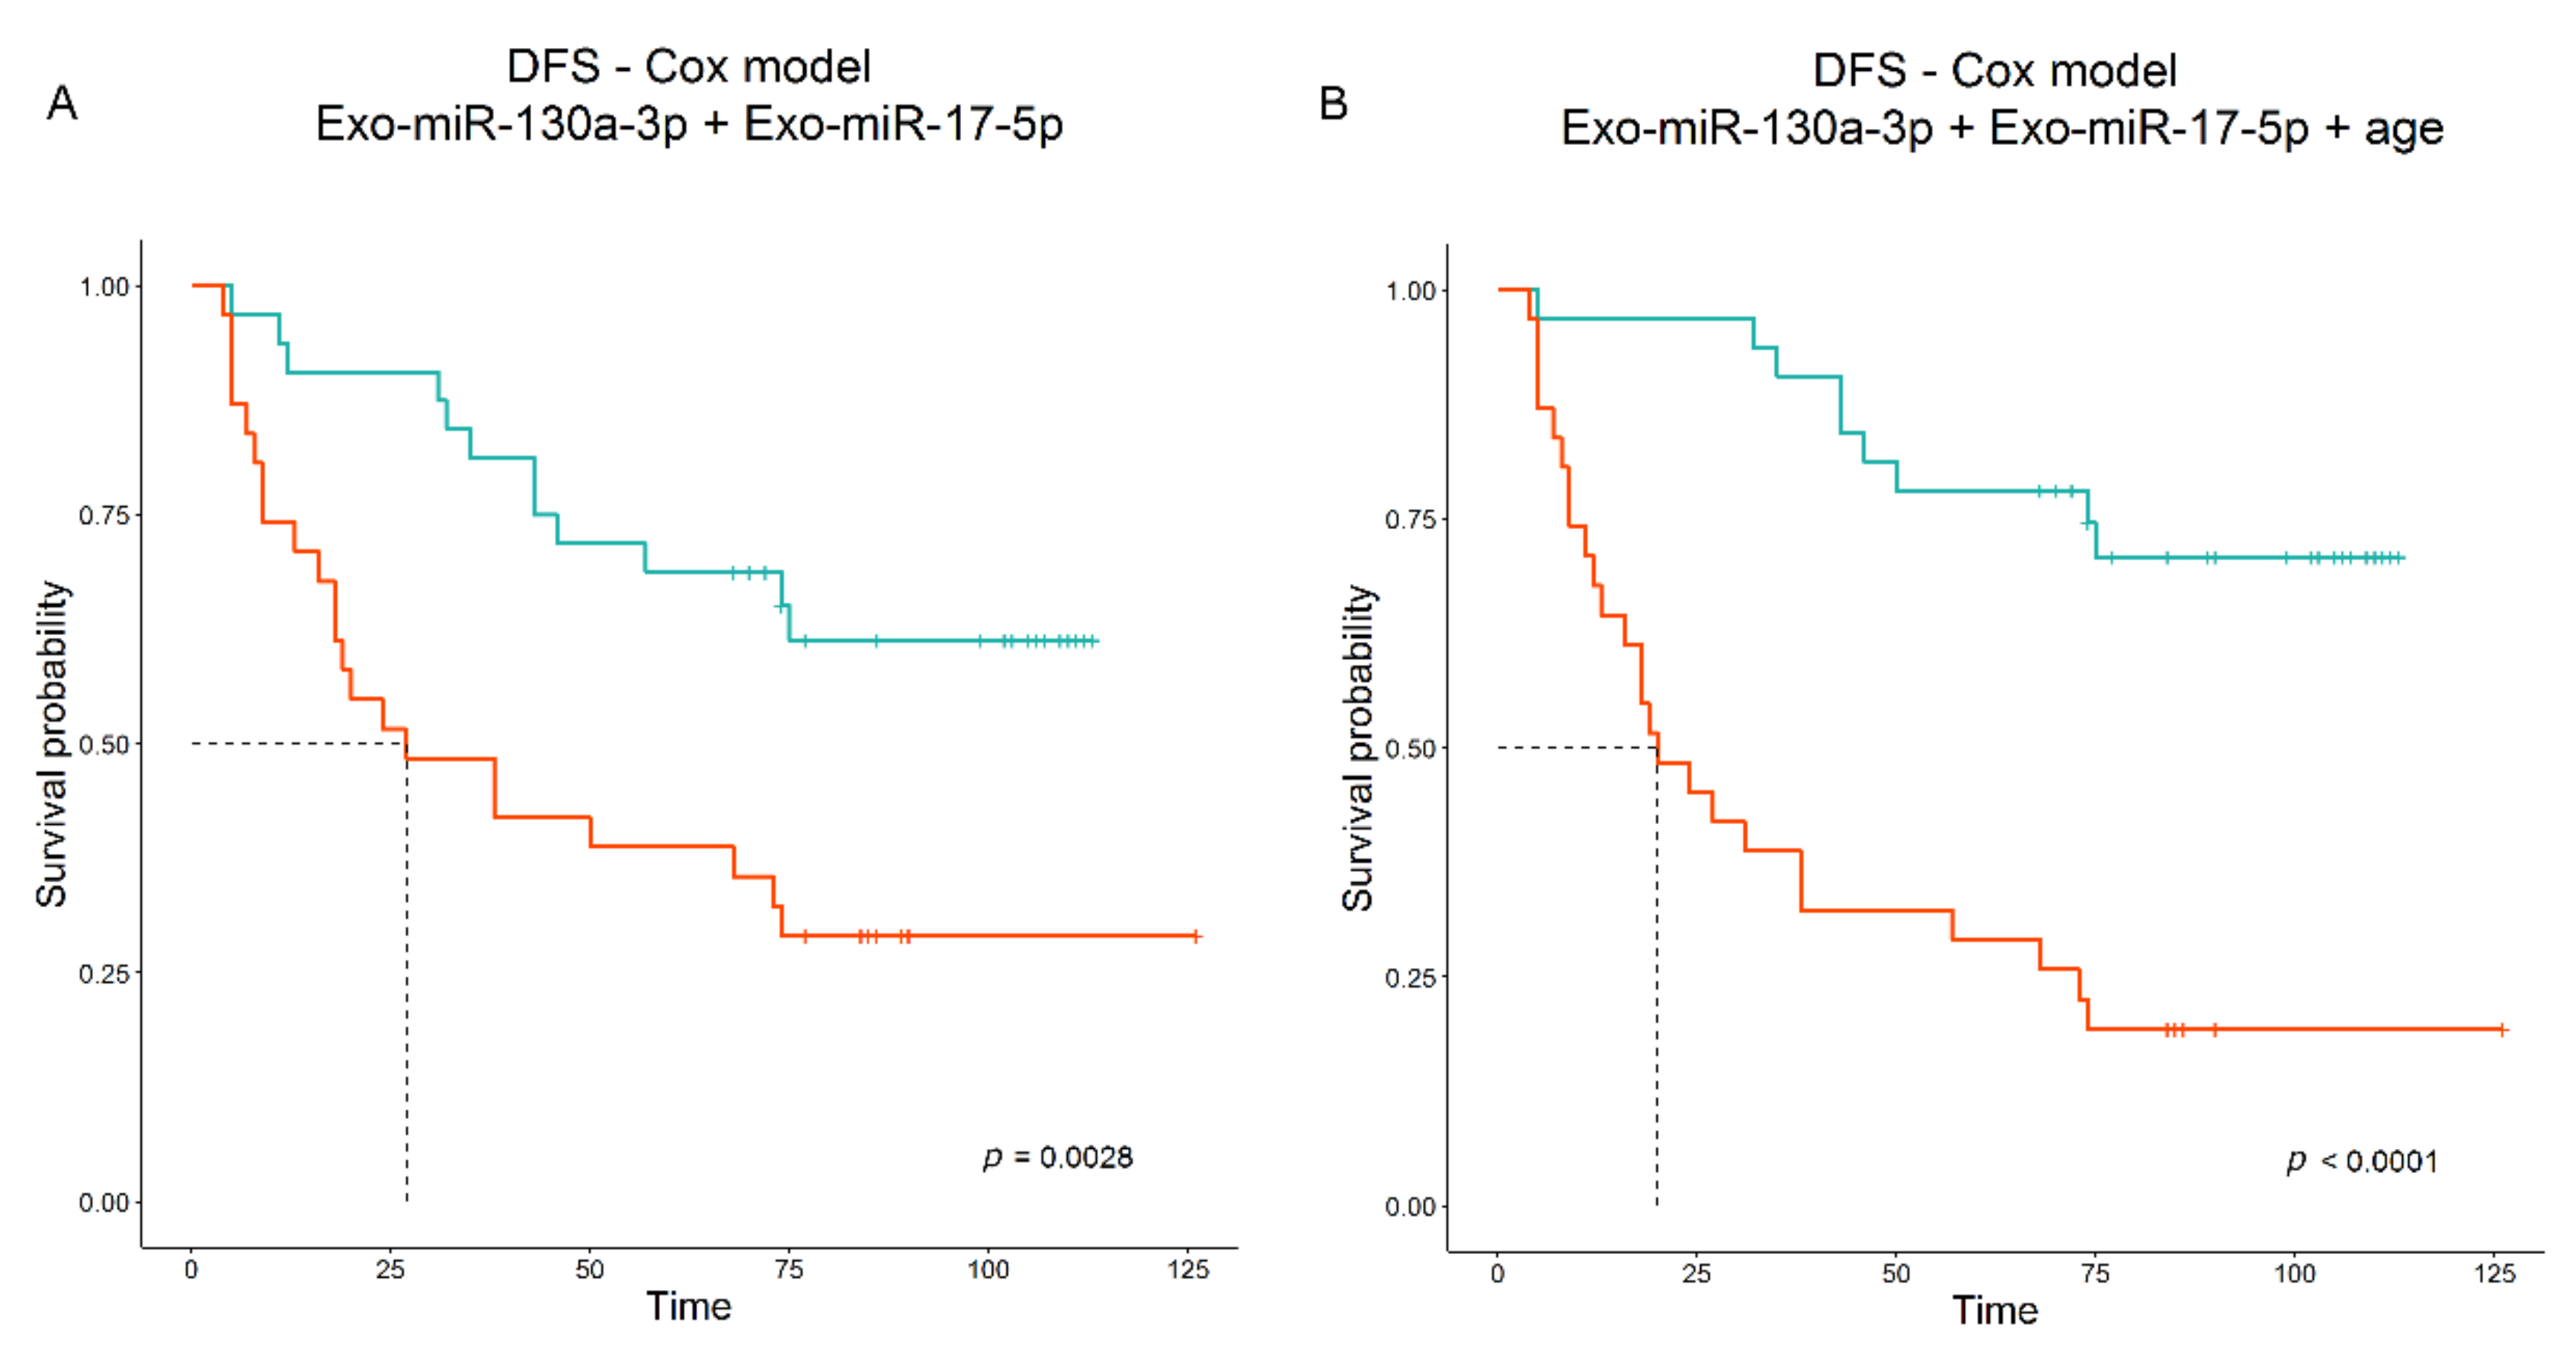
34]. This opposite effect is not surprising; indeed, Exo-miRs, as being circulating, can act not only on tumor cells but on immune and stromal cells as well, modifying their functions in a context-dependent manner. Notably, multivariable analysis yielded a combination of the Exo-miR-130a-3p with Exo-miR-17-5p as best model associated with DFS. Exo-miR-17-5p alone showed a slightly significant positive association with DFS by microarray data (HR = 1.253,
p-value = 0.023, n = 67) but it was not associated with DFS by ddPCR data (HR = 1.028,
p-value = 0.623, n = 63); however, when combined in a multivariable model, the HR of Exo-miR-17-5p became lower than “one” (i.e., negatively associated with DFS) and significant, underlying an interaction with miR-130a-3p that seems to balance its positive contribution to the final predictive score. The modification in HR value has already been documented previously [
35], and this event might be related to the low number of patients as well as to the small contribution of Exo-miR-17-5p in the model compared to Exo-miR-130a- 3p. Indeed, in the univariate analysis of 46 patients, the individual contribution of miR-17-5p was limited, as its HR was close to “one” and statistical significance was not reached (HR = 1.040;
p-value = 0.561).
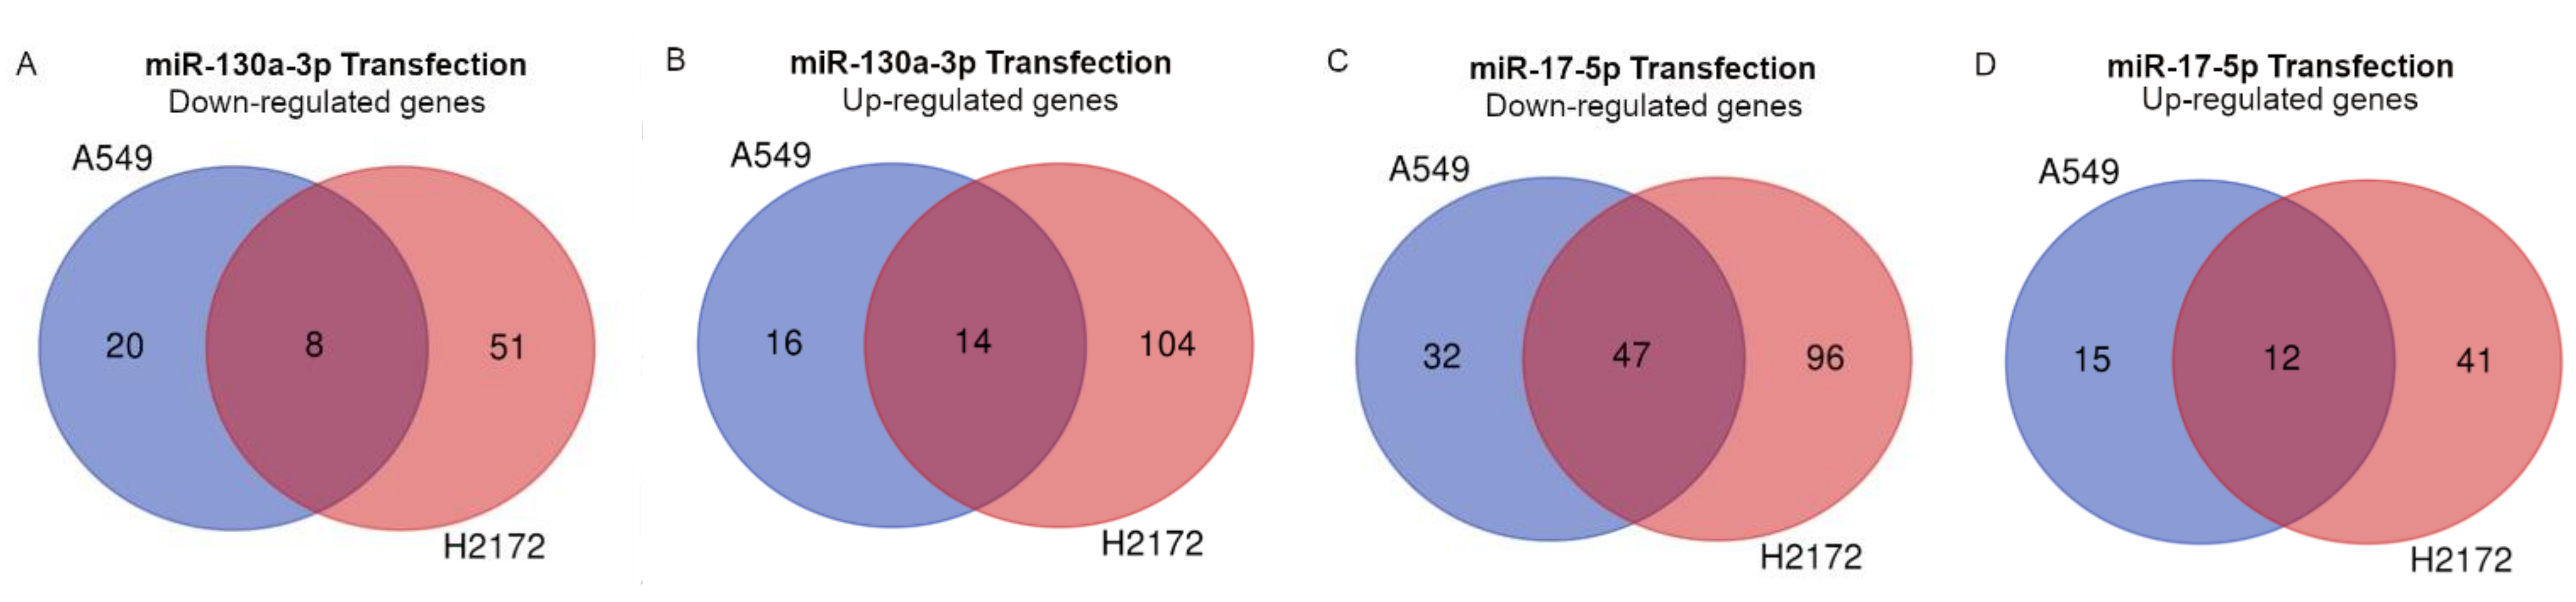
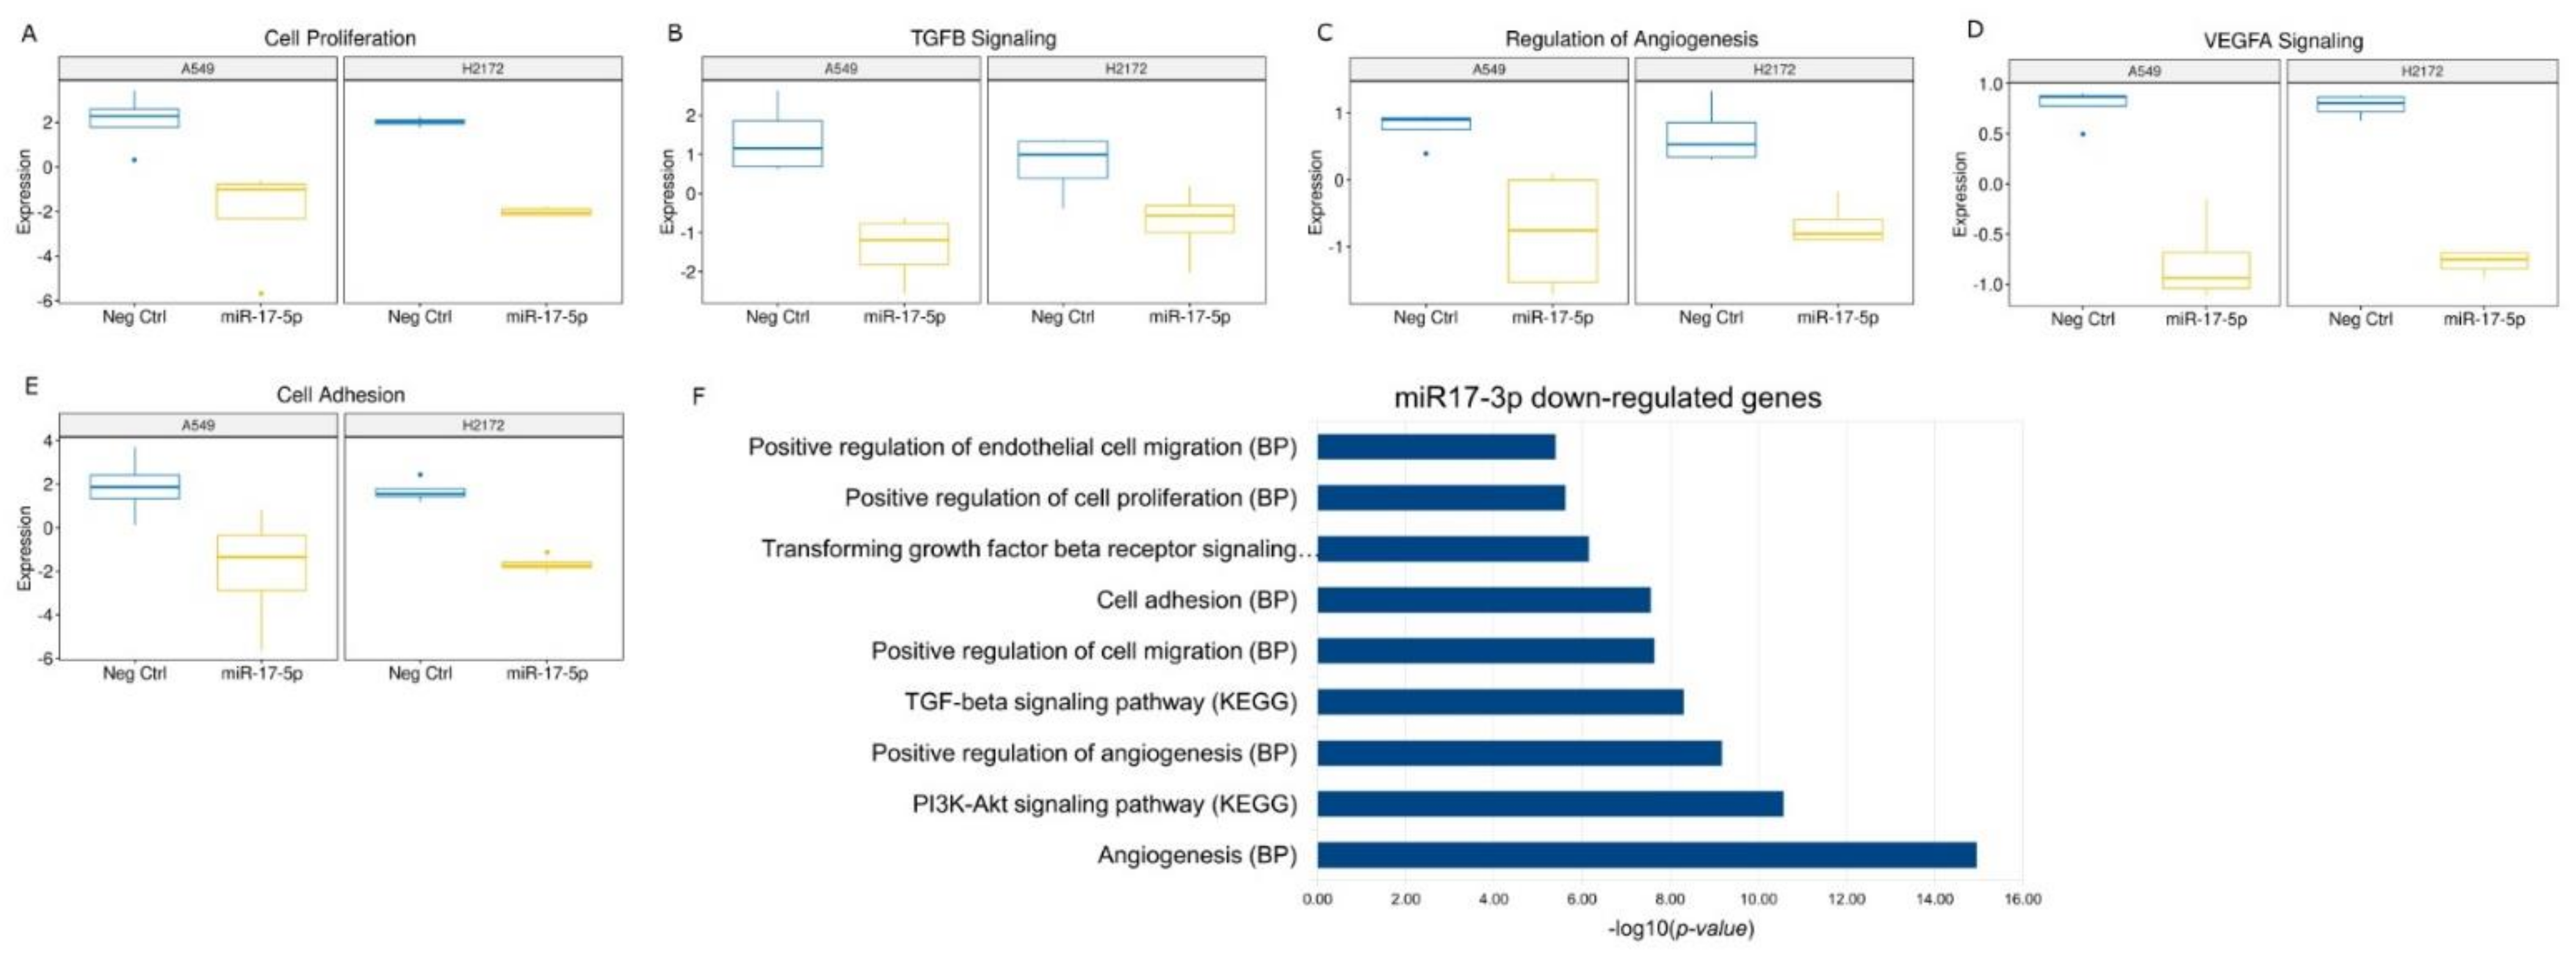
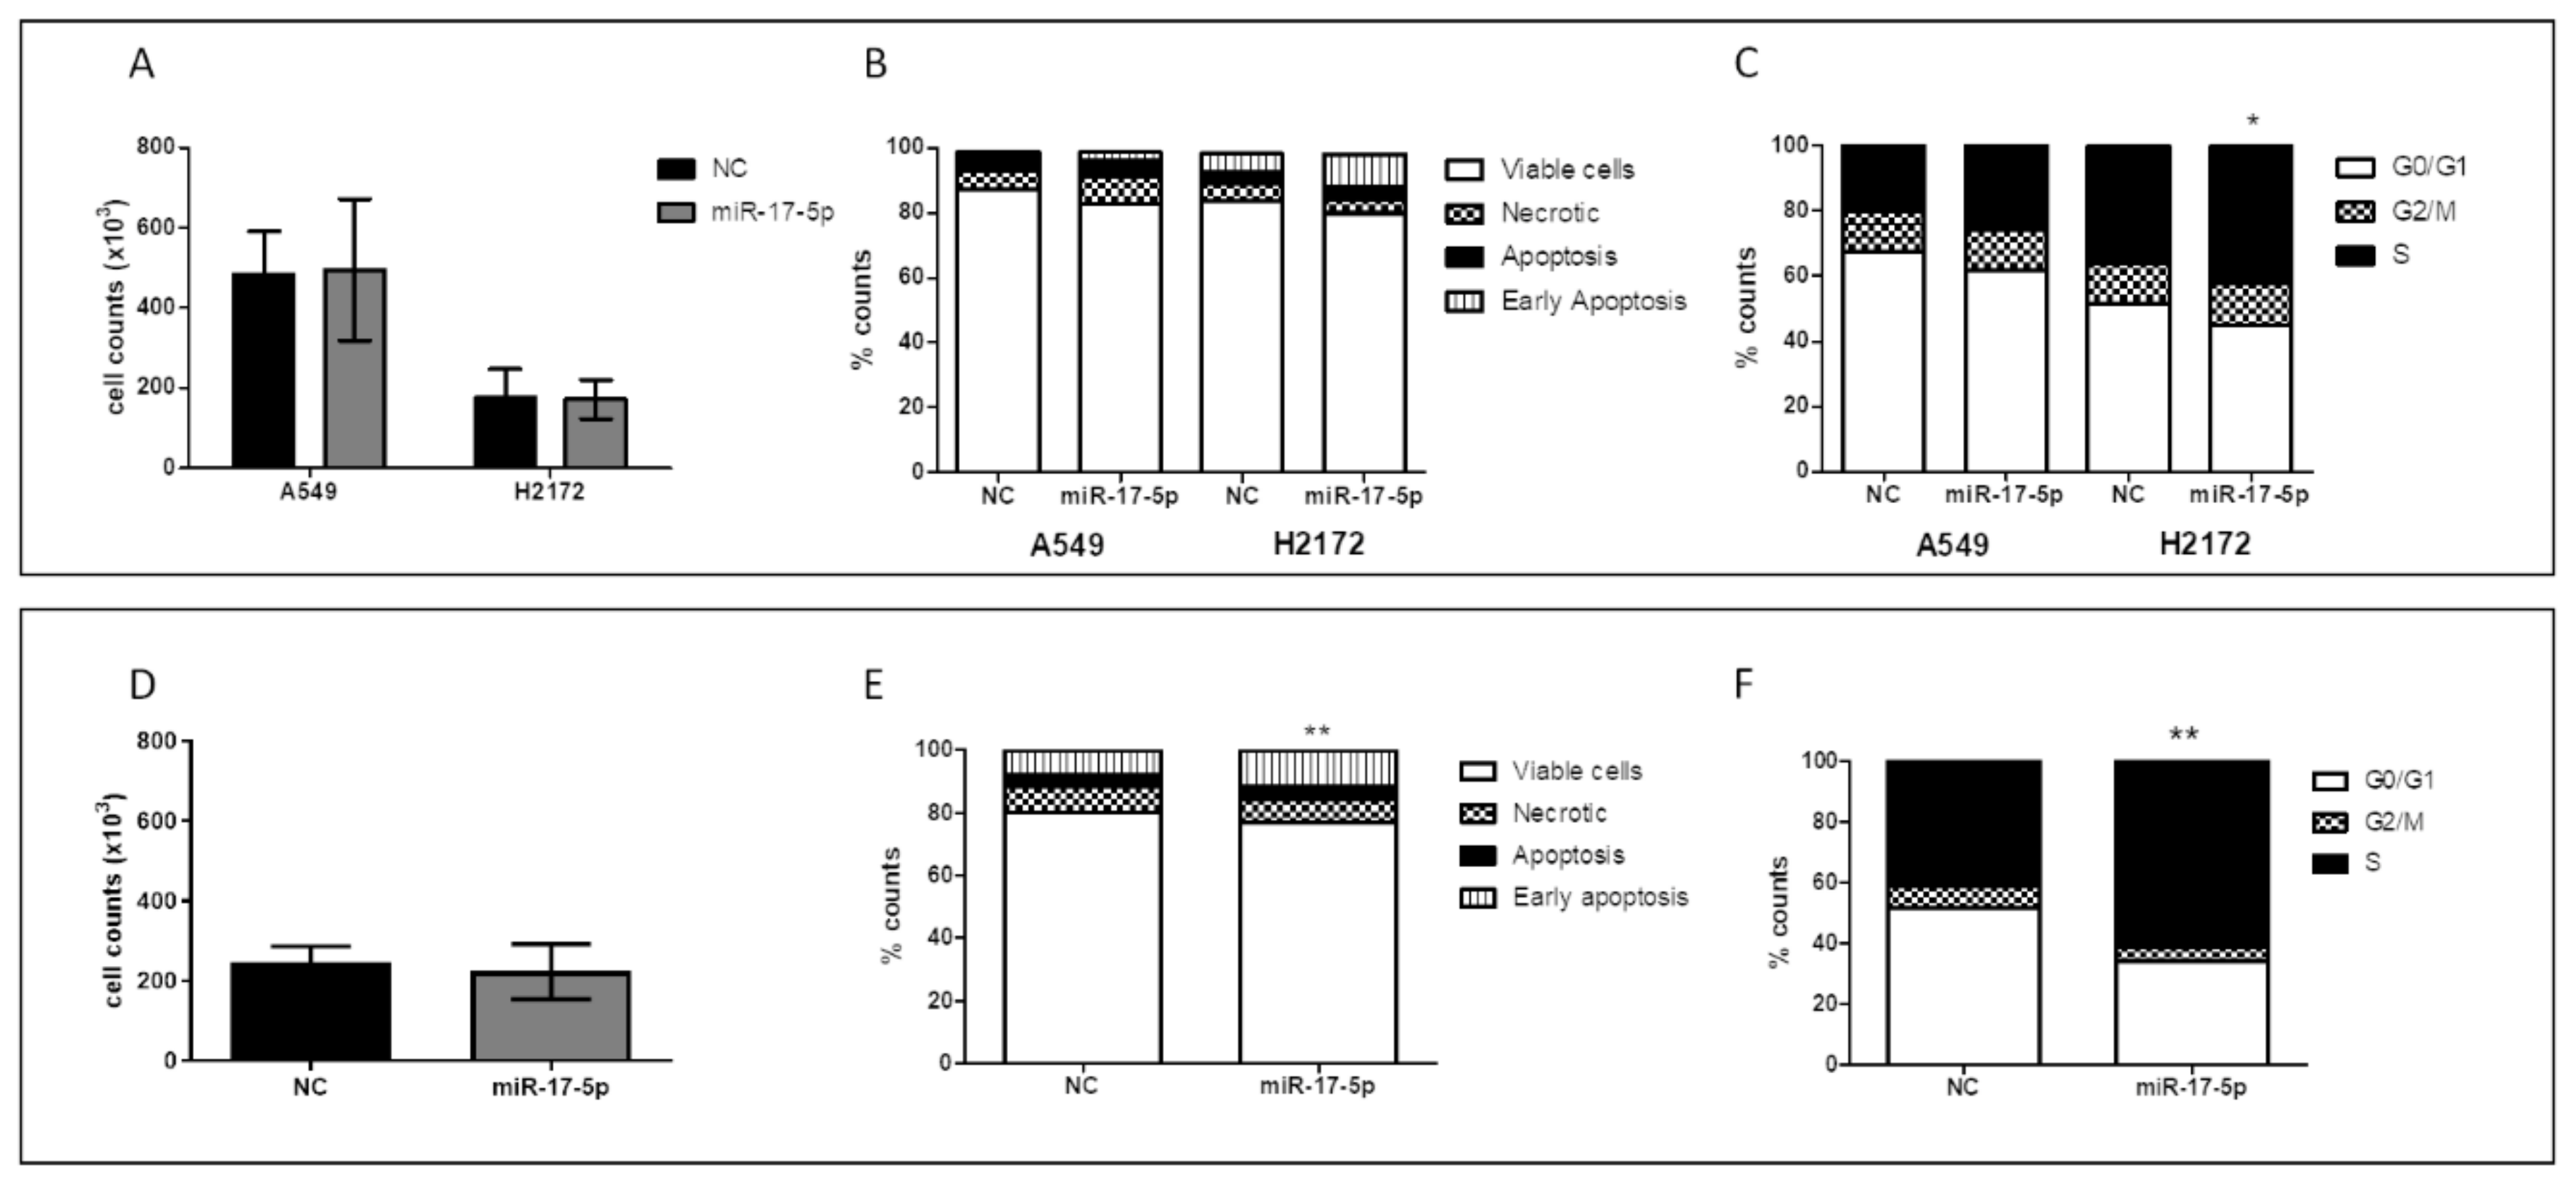
Hence, in order to understand the role of the two miRs in lung cancer progression, we also investigated their effects in the in vitro model. We generally found a silencing of the major pathways involved in cancer progression after miR-17-5p transfection, with also a significant increase in early apoptosis, particularly in the H2172 cell line. The absence of this effect in A549 cells could be due to the activating mutation in the
KRAS gene [
36], which in turn could limit the tumor suppressor effect of miR-17-5p, independently activating cell proliferation. We also observed an increase in S-phase cells after miR-17-5p transfection. Similar modifications in cell cycle profile have already been described after miR-17-5p overexpression [
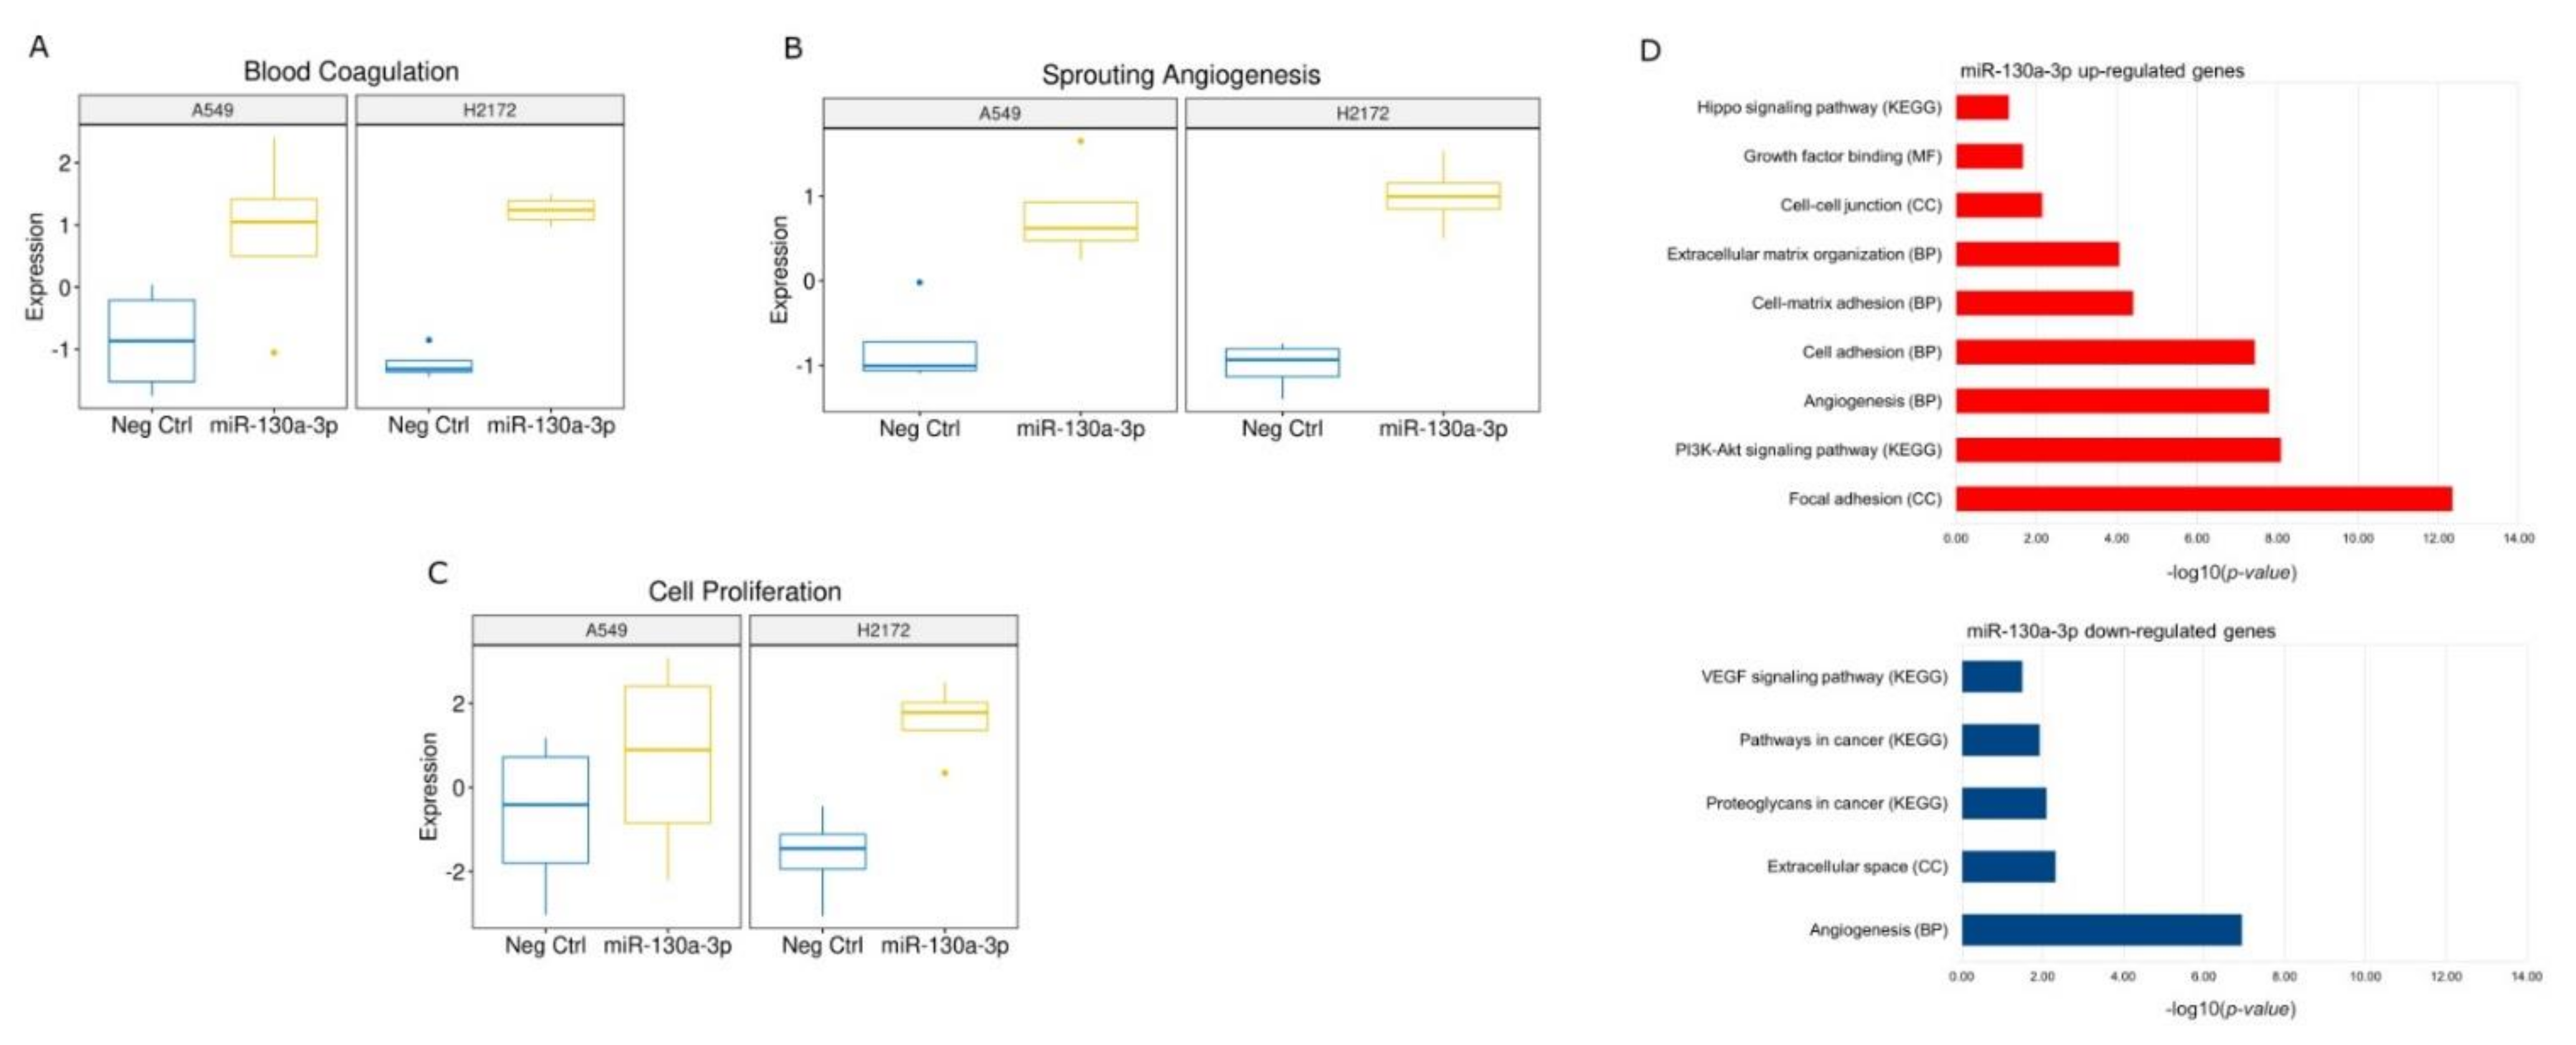
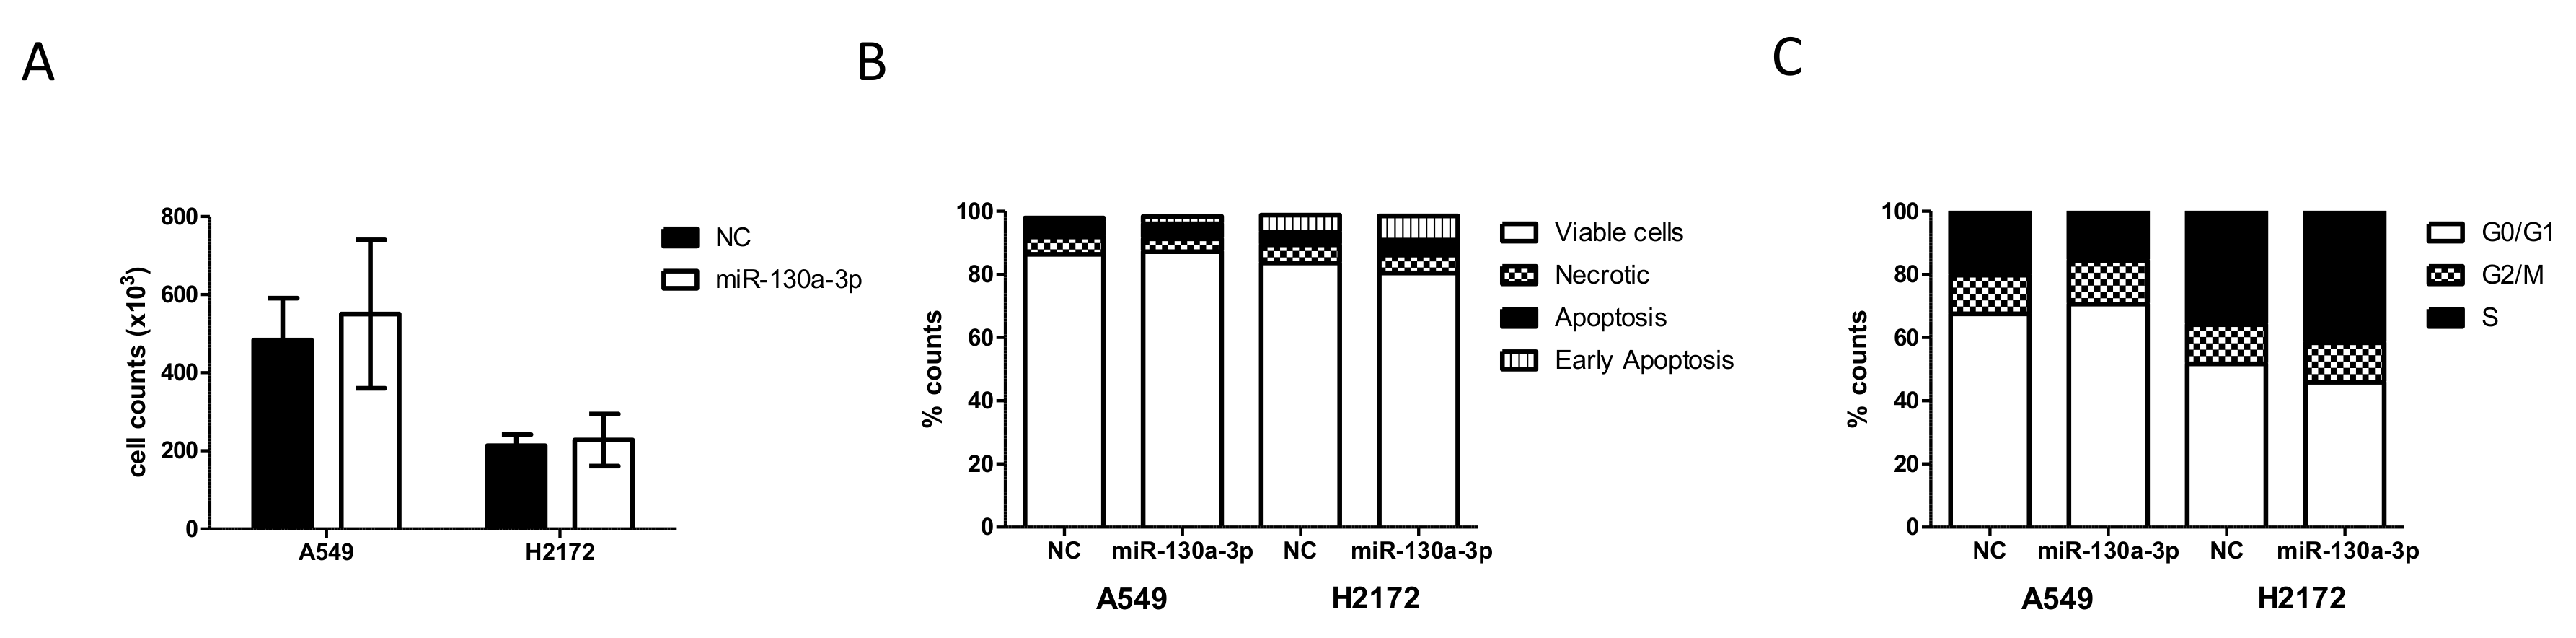
37]. In particular, the authors demonstrated that miR-17-5p was a key regulator of the G1/S phase transition acting both as an oncogene and as a tumor suppressor in different cellular settings. These data lead to hypothesize a main suppressive role of the miR in this context. Conversely, miR-130a-3p transfection showed activation of some crucial signaling pathways for tumor development. Among the commonly deregulated genes, we found a significant up-regulation of the Rac Family Small GTPase 1 (
RAC1) gene and neuropilin 2 (
NRP2), which are involved in tumor migration and invasion in different tumors [
38] including lung cancer [
39,
40]. In particular, Rac1 protein participates in the membrane protrusion formation, driving tumor cell migration [
41] and the formation of membrane ruffles [
42], also implicated in the metastatic potential of tumor cells [
43]. In addition, we also found deregulations of TME signaling involved in the onset and progression of cancer. Among these, angiogenesis was predicted in the miR-130a-3p transfections. Currently, a number of studies support the role of miR-130a-3p in angiogenesis activation [
44,
45,
46]. Among the commonly up-regulated genes after miR-130a-3p, we detected a significant increase in neuropilin 2 (
NRP2) involved in the formation of new blood vessels [
47]. In particular, very recently, Alghamdi and colleagues demonstrated that the NRP2 by RAC1 protein promote the adhesion and migration of the endothelial cells [
48]. Additionally, we also observed an up-regulation of the Integrin Subunit Beta 1 (
ITGB1), a protein involved in the vasculogenic mimicry, an alternative tumor mechanism of vessel-like structure formation [
49].
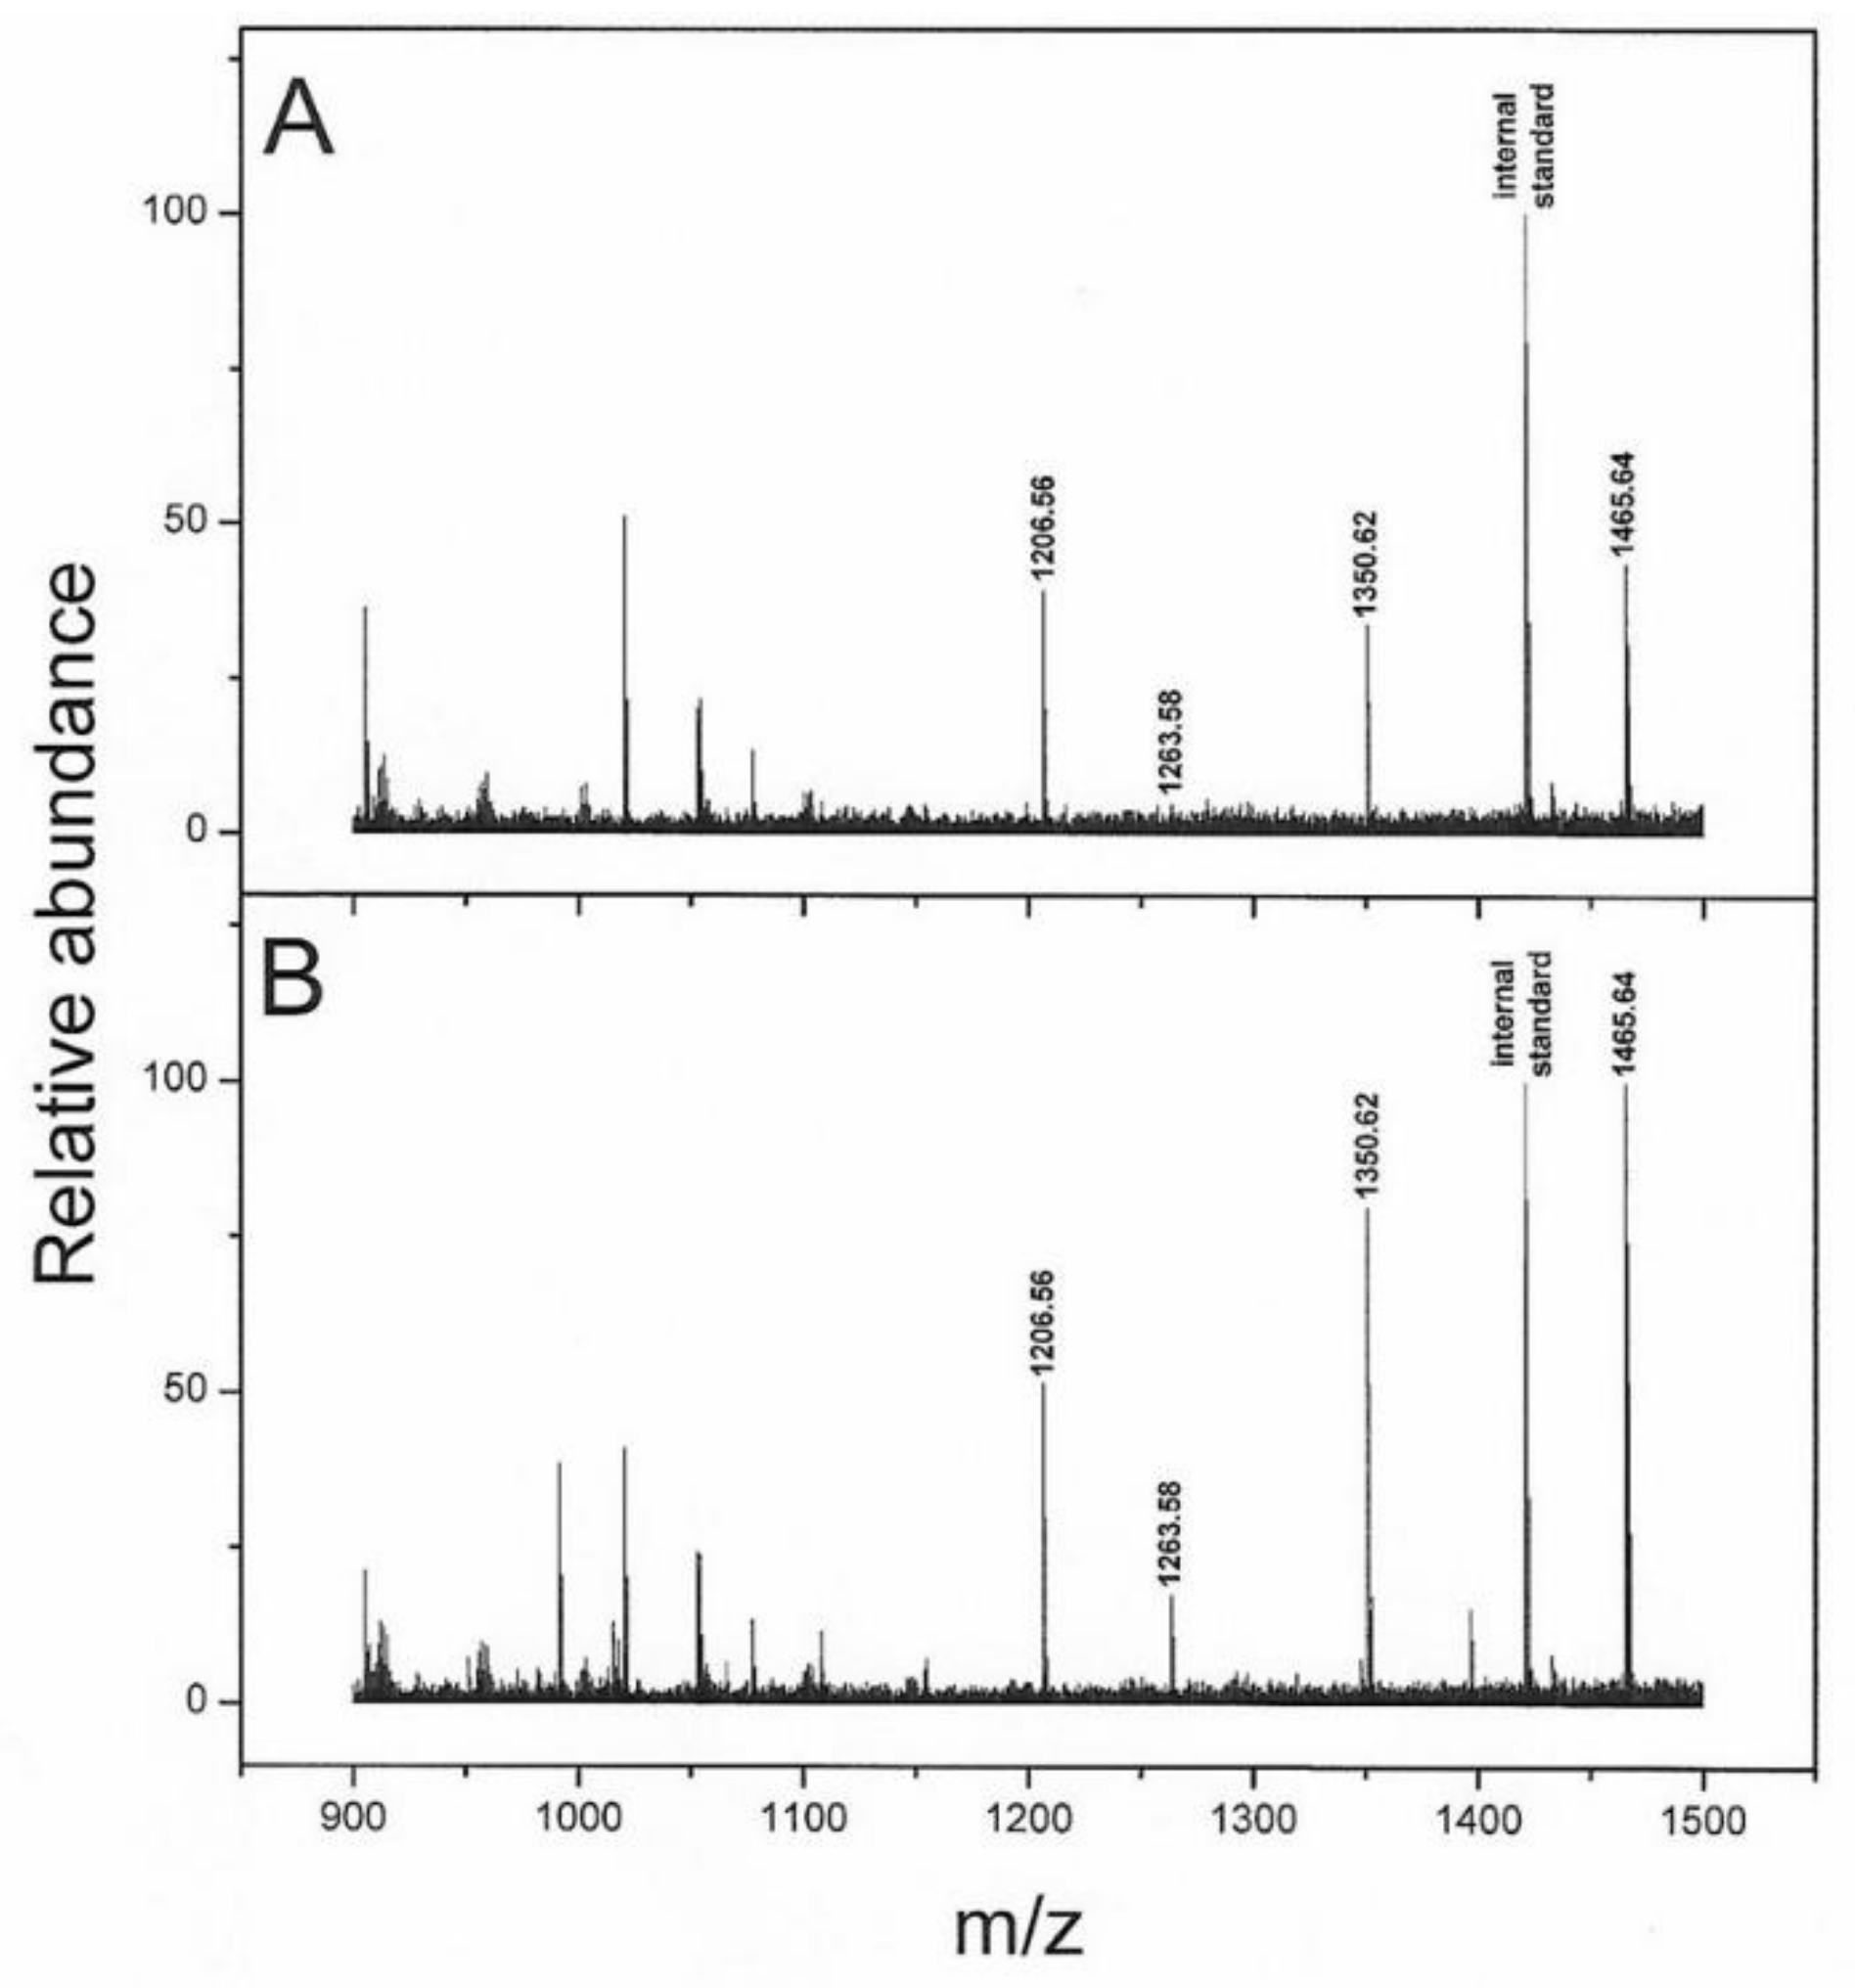
The serum peptidome analysis evidenced a lower abundance of four peptides (i.e., 1206.56, 1263.58, 1350.62 and 1465.64 m/z) in progressed patients and these peaks matched with the FpA. However, the presence of degradation fragments of fibrinogen was also used as a quality control (SeraDeg) in the selection of serum specimens, but in our control, low-quality samples are characterized by a reduction in FpA-derived fragments of greater mass (1350.62, 1465.64 m/z) and abundance in smaller ones (905.47, 1077.52 m/z) [
28]. In contrast, in our progressed patient cohort we observed a reduction in high mass spikes only, suggesting a cancer pattern. When we combined the peptides to Exo-miRs and clinical data in the multivariable analysis, the fragments improved the risk scores. Notably, the greater FpA-derived fragment with mean 1465.64 m/z (FpA(2–16)) was the only one retained by step-wise regression analysis. A number of serum peptidome studies have described distinctive FpA patterns associated to clinically-relevant outcomes; however, their biological significance in the blood of cancer patients is still debated. Although FpA-derived fragments were mainly found overexpressed in cancer patients [
18,
50,
51,
52,
53], a downmodulation has also been associated with several cancer conditions [
52,
54]. In 2006 Villanueva et al. published a study in which lower levels of FpA-derived fragments were found in serum from patients affected by prostate, bladder and breast cancer [
12]. Interestingly, the same authors found similar results in metastatic thyroid carcinoma supporting the hypothesis that low levels of FpA may be related to advanced cancer conditions [
13]. A possible explanation of our findings might be linked to a lower concentration of fibrinogen in the serum of relapsed patients, although no correlation was found in our patient cohort. Several tumor-related disorders of hemostasis have been described, including the fibrinogen fragmentation [
55,
56]. Furthermore, since serum peptidomes derive mainly from blood components, they particularly reflect proteolytic degradation products and can therefore be considered as indicators of endopeptidase activity in plasma. In this regard, it has also been reported how tumor cells can produce particular exopeptidases [
12], linked to the FpA tumor pattern [
54]. In light of these studies, we can hypothesize that depletion of FpA fragments in patients with progression may be the result of tumor-derived protease activation. In support of this, in both transfected cells we found a significant increase in metalloprotease (i.e., metallopeptidase domain 17,
ADAM17) and coagulation process such as
RAC1 gene, already described as a potent clotting activator in vitro [
57].
In spite of the intriguing results of our study, some potential limitations need to be considered. First, the patient cohort is relatively small and there is no validation in an independent population to assess the robustness of the generated risk score. Second, the lack of serum samples from healthy individuals collected simultaneously with patient serum and longitudinal sampling in the cancer cohort hampered definitive conclusions on the peptidome. Furthermore, clinical parameters such as coagulation status of patients were available for a limited selection of patients, and a fibrinolysis parameter (e.g., d-dimer) was lacking, which prevented us from understanding the role of coagulation in these patients. Last but not least, although numerous studies have already shown a connection between miR-130a-3p and angiogenesis, we have not performed in vitro studies proving its role in remodeling the TME.


 ,
, 


