
Diffusion Weighted Imaging in Gliomas: A Histogram-Based Approach for Tumor Characterization


 ,
,
Abstract
:Simple Summary
Abstract
1. Introduction
2. Materials and Methods
2.1. Patients
2.2. MRI Protocol
2.3. Histogram Analysis of ADC Volumes
2.4. Immunolabelling and Polymerase Chain Reaction (PCR)—Molecular Neuropathology
2.5. Statistical Analysis
3. Results
4. Discussion
5. Conclusions
Author Contributions
Funding
Institutional Review Board Statement
Informed Consent Statement
Data Availability Statement
Conflicts of Interest
References
- Ostrom, Q.T.; Cioffi, G.; Gittleman, H.; Patil, N.; Waite, K.; Kruchko, C.; Barnholtz-Sloan, J.S. CBTRUS Statistical Report: Primary Brain and Other Central Nervous System Tumors Diagnosed in the United States in 2012–2016. Neuro Oncol. 2019, 21 (Suppl. S5), v1–v100. [Google Scholar] [CrossRef] [PubMed]
- Stupp, R.; Mason, W.P.; van den Bent, M.J.; Weller, M.; Fisher, B.; Taphoorn, M.J.; Belanger, K.; Brandes, A.A.; Marosi, C.; Bogdahn, U.; et al. European Organisation for Research and Treatment of Cancer Brain Tumor and Radiotherapy Groups; National Cancer Institute of Canada Clinical Trials Group. Radiotherapy plus concomitant and adjuvant temozolomide for glioblastoma. N. Engl. J. Med. 2005, 352, 987–996. [Google Scholar] [CrossRef] [PubMed]
- Fernandez, C.; Figarella-Branger, D.; Girard, N.; Bouvier-Labit, C.; Gouvernet, J.; Paz Paredes, A.; Lena, G. Pilocytic astrocytomas in children: Prognostic factors—a retrospective study of 80 cases. Neurosurgery 2003, 53, 544–553. [Google Scholar] [CrossRef] [PubMed]
- Louis, D.N.; Perry, A.; Reifenberger, G.; von Deimling, A.; Figarella-Branger, D.; Cavenee, W.K.; Ohgaki, H.; Wiestler, O.D.; Kleihues, P.; Ellison, D.W. The 2016 World Health Organization Classification of Tumors of the Central Nervous System: A summary. Acta Neuropathol. 2016, 131, 803–820. [Google Scholar] [CrossRef] [Green Version]
- Wesseling, P.; Capper, D. WHO 2016 Classification of gliomas. Neuropathol. Appl. Neurobiol. 2018, 44, 139–150. [Google Scholar] [CrossRef]
- Mori, S.; Barker, P.B. Diffusion magnetic resonance imaging: Its principle and applications. Anat Rec. 1999, 257, 102–109. [Google Scholar] [CrossRef]
- Le Bihan, D. Apparent diffusion coefficient and beyond: What diffusion MR imaging can tell us about tissue structure. Radiology 2013, 268, 318–322. [Google Scholar] [CrossRef]
- Charles-Edwards, E.M.; deSouza, N.M. Diffusion-weighted magnetic resonance imaging and its application to cancer. Cancer Imaging 2006, 6, 135–143. [Google Scholar] [CrossRef] [Green Version]
- Yin, Y.; Tong, D.; Liu, X.Y.; Yuan, T.T.; Yan, Y.Z.; Ma, Y.; Zhao, R. Correlation of apparent diffusion coefficient with Ki-67 in the diagnosis of gliomas. Zhongguo Yi Xue Ke Xue Yuan Xue Bao 2012, 34, 503–508. [Google Scholar] [CrossRef]
- Gihr, G.A.; Horvath-Rizea, D.; Hekeler, E.; Ganslandt, O.; Henkes, H.; Hoffmann, K.T.; Scherlach, C.; Schob, S. Histogram Analysis of Diffusion Weighted Imaging in Low-Grade Gliomas: In Vivo Characterization of Tumor Architecture and Corresponding Neuropathology. Front. Oncol. 2020, 10, 206. [Google Scholar] [CrossRef] [Green Version]
- Zhang, L.; Min, Z.; Tang, M.; Chen, S.; Lei, X.; Zhang, X. The utility of diffusion MRI with quantitative ADC measurements for differentiating high-grade from low-grade cerebral gliomas: Evidence from a meta-analysis. J. Neurol. Sci. 2017, 373, 9–15. [Google Scholar] [CrossRef] [PubMed]
- Cui, Y.; Ma, L.; Chen, X.; Zhang, Z.; Jiang, H.; Lin, S. Lower apparent diffusion coefficients indicate distinct prognosis in low-grade and high-grade glioma. J. Neurooncol. 2014, 119, 377–385. [Google Scholar] [CrossRef] [PubMed]
- Horvath-Rizea, D.; Surov, A.; Hoffmann, K.T.; Garnov, N.; Vörkel, C.; Kohlhof-Meinecke, P.; Ganslandt, O.; Bäzner, H.; Gihr, G.A.; Kalman, M.; et al. The value of whole lesion ADC histogram profiling to differentiate between morphologically indistinguishable ring enhancing lesions-comparison of glioblastomas and brain abscesses. Oncotarget 2018, 9, 18148–18159. [Google Scholar] [CrossRef] [Green Version]
- Just, N. Improving tumour heterogeneity MRI assessment with histograms. Br. J. Cancer 2014, 111, 2205–2213. [Google Scholar] [CrossRef] [Green Version]
- Woo, S.; Cho, J.Y.; Kim, S.Y.; Kim, S.H. Histogram analysis of apparent diffusion coefficient map of diffusion-weighted MRI in endometrial cancer: A preliminary correlation study with histological grade. Acta Radiol. 2014, 55, 1270–1277. [Google Scholar] [CrossRef] [PubMed]
- Surov, A.; Gottschling, S.; Mawrin, C.; Prell, J.; Spielmann, R.P.; Wienke, A.; Fiedler, E. Diffusion-Weighted Imaging in Meningioma: Prediction of Tumor Grade and Association with Histopathological Parameters. Transl. Oncol. 2015, 8, 517–523. [Google Scholar] [CrossRef] [Green Version]
- Schob, S.; Meyer, J.; Gawlitza, M.; Frydrychowicz, C.; Müller, W.; Preuss, M.; Bure, L.; Quäschling, U.; Hoffmann, K.T.; Surov, A. Diffusion-Weighted MRI Reflects Proliferative Activity in Primary CNS Lymphoma. PLoS ONE 2016, 11, e0161386. [Google Scholar] [CrossRef]
- Schob, S.; Meyer, H.J.; Dieckow, J.; Pervinder, B.; Pazaitis, N.; Höhn, A.K.; Garnov, N.; Horvath-Rizea, D.; Hoffmann, K.T.; Surov, A. Histogram Analysis of Diffusion Weighted Imaging at 3T is Useful for Prediction of Lymphatic Metastatic Spread, Proliferative Activity, and Cellularity in Thyroid Cancer. Int. J. Mol. Sci. 2017, 18, 821. [Google Scholar] [CrossRef] [Green Version]
- Schob, S.; Meyer, H.J.; Pazaitis, N.; Schramm, D.; Bremicker, K.; Exner, M.; Höhn, A.K.; Garnov, N.; Surov, A. ADC Histogram Analysis of Cervical Cancer Aids Detecting Lymphatic Metastases-a Preliminary Study. Mol. Imaging Biol. 2017, 19, 953–962. [Google Scholar] [CrossRef]
- Gihr, G.A.; Horvath-Rizea, D.; Garnov, N.; Kohlhof-Meinecke, P.; Ganslandt, O.; Henkes, H.; Meyer, H.J.; Hoffmann, K.T.; Surov, A.; Schob, S. Diffusion Profiling via a Histogram Approach Distinguishes Low-grade from High-grade Meningiomas, Can Reflect the Respective Proliferative Potential and Progesterone Receptor Status. Mol. Imaging Biol. 2018, 20, 632–640. [Google Scholar] [CrossRef]
- Gihr, G.; Horvath-Rizea, D.; Hekeler, E.; Ganslandt, O.; Henkes, H.; Hoffmann, K.T.; Scherlach, C.; Schob, S. Diffusion weighted imaging in high-grade gliomas: A histogram-based analysis of apparent diffusion coefficient profile. PLoS ONE 2021, 16, e0249878. [Google Scholar] [CrossRef] [PubMed]
- Meyer, H.J.; Schob, S.; Münch, B.; Frydrychowicz, C.; Garnov, N.; Quäschling, U.; Hoffmann, K.T.; Surov, A. Histogram Analysis of T1-Weighted, T2-Weighted, and Postcontrast T1-Weighted Images in Primary CNS Lymphoma: Correlations with Histopathological Findings-a Preliminary Study. Mol. Imaging Biol. 2018, 20, 318–323. [Google Scholar] [CrossRef] [PubMed]
- Meyer, H.J.; Leifels, L.; Hamerla, G.; Höhn, A.K.; Surov, A. Histogram Analysis Parameters Derived from Conventional T1- and T2-Weighted Images Can Predict Different Histopathological Features Including Expression of Ki67, EGFR, VEGF, HIF-1α, and p53 and Cell Count in Head and Neck Squamous Cell Carcinoma. Mol. Imaging Biol. 2019, 21, 740–746. [Google Scholar] [CrossRef]
- Meyer, H.J.; Hamerla, G.; Höhn, A.K.; Surov, A. Whole Lesion Histogram Analysis Derived From Morphological MRI Sequences Might be Able to Predict EGFR- and Her2-Expression in Cervical Cancer. Acad. Radiol. 2019, 26, e208–e215. [Google Scholar] [CrossRef]
- Gihr, G.A.; Horvath-Rizea, D.; Kohlhof-Meinecke, P.; Ganslandt, O.; Henkes, H.; Richter, C.; Hoffmann, K.T.; Surov, A.; Schob, S. Histogram Profiling of Postcontrast T1-Weighted MRI Gives Valuable Insights into Tumor Biology and Enables Prediction of Growth Kinetics and Prognosis in Meningiomas. Transl. Oncol. 2018, 11, 957–961. [Google Scholar] [CrossRef] [PubMed]
- Lemée, J.M.; Clavreul, A.; Menei, P. Intratumoral heterogeneity in glioblastoma: Don’t forget the peritumoral brain zone. Neuro Oncol. 2015, 17, 1322–1332. [Google Scholar] [CrossRef] [PubMed]
- Surov, A.; Meyer, H.J.; Wienke, A. Correlation between apparent diffusion coefficient (ADC) and cellularity is different in several tumors: A meta-analysis. Oncotarget 2017, 8, 59492–59499. [Google Scholar] [CrossRef] [Green Version]
- Chen, L.; Liu, M.; Bao, J.; Xia, Y.; Zhang, J.; Zhang, L.; Huang, X.; Wang, J. The correlation between apparent diffusion coefficient and tumor cellularity in patients: A meta-analysis. PLoS ONE 2013, 8, e79008. [Google Scholar] [CrossRef] [Green Version]
- Surov, A.; Caysa, H.; Wienke, A.; Spielmann, R.P.; Fiedler, E. Correlation Between Different ADC Fractions, Cell Count, Ki-67, Total Nucleic Areas and Average Nucleic Areas in Meningothelial Meningiomas. Anticancer. Res. 2015, 35, 6841–6846. [Google Scholar]
- Surov, A.; Meyer, H.J.; Wienke, A. Correlation between Minimum Apparent Diffusion Coefficient (ADCmin) and Tumor Cellularity: A Meta-analysis. Anticancer Res. 2017, 37, 3807–3810. [Google Scholar] [CrossRef] [Green Version]
- Rosenkrantz, A.B. Histogram-based apparent diffusion coefficient analysis: An emerging tool for cervical cancer characterization? AJR Am. J. Roentgenol. 2013, 200, 311–313. [Google Scholar] [CrossRef]
- Suo, S.; Zhang, K.; Cao, M.; Suo, X.; Hua, J.; Geng, X.; Chen, J.; Zhuang, Z.; Ji, X.; Lu, Q.; et al. Characterization of breast masses as benign or malignant at 3.0T MRI with whole-lesion histogram analysis of the apparent diffusion coefficient. J. Magn. Reson Imaging 2016, 43, 894–902. [Google Scholar] [CrossRef] [PubMed]
- Foroutan, P.; Kreahling, J.M.; Morse, D.L.; Grove, O.; Lloyd, M.C.; Reed, D.; Raghavan, M.; Altiok, S.; Martinez, G.V.; Gillies, R.J. Diffusion MRI and novel texture analysis in osteosarcoma xenotransplants predicts response to anti-checkpoint therapy. PLoS ONE 2013, 8, e82875. [Google Scholar] [CrossRef] [PubMed] [Green Version]
- Fedele, M.; Cerchia, L.; Pegoraro, S.; Sgarra, R.; Manfioletti, G. Proneural-Mesenchymal Transition: Phenotypic Plasticity to Acquire Multitherapy Resistance in Glioblastoma. Int. J. Mol. Sci. 2019, 20, 2746. [Google Scholar] [CrossRef] [PubMed] [Green Version]
- Cohen, A.L.; Holmen, S.L.; Colman, H. IDH1 and IDH2 mutations in gliomas. Curr. Neurol. Neurosci. Rep. 2013, 13, 345. [Google Scholar] [CrossRef] [Green Version]
- Houillier, C.; Wang, X.; Kaloshi, G.; Mokhtari, K.; Guillevin, R.; Laffaire, J.; Paris, S.; Boisselier, B.; Idbaih, A.; Laigle-Donadey, F.; et al. IDH1 or IDH2 mutations predict longer survival and response to temozolomide in low-grade gliomas. Neurology 2010, 75, 1560–1566. [Google Scholar] [CrossRef] [PubMed]
- Xia, L.; Wu, B.; Fu, Z.; Feng, F.; Qiao, E.; Li, Q.; Sun, C.; Ge, M. Prognostic role of IDH mutations in gliomas: A meta-analysis of 55 observational studies. Oncotarget 2015, 6, 17354–17365. [Google Scholar] [CrossRef] [Green Version]
- Olar, A.; Wani, K.M.; Alfaro-Munoz, K.D.; Heathcock, L.E.; van Thuijl, H.F.; Gilbert, M.R.; Armstrong, T.S.; Sulman, E.P.; Cahill, D.P.; Vera-Bolanos, E.; et al. IDH mutation status and role of WHO grade and mitotic index in overall survival in grade II-III diffuse gliomas. Acta Neuropathol. 2015, 129, 585–596. [Google Scholar] [CrossRef] [Green Version]
- Karpel-Massler, G.; Nguyen, T.T.T.; Shang, E.; Siegelin, M.D. Novel IDH1-Targeted Glioma Therapies. CNS Drugs. 2019, 33, 1155–1166. [Google Scholar] [CrossRef]
- Zhao, H.; Wang, S.; Song, C.; Zha, Y.; Li, L. The prognostic value of MGMT promoter status by pyrosequencing assay for glioblastoma patients’ survival: A meta-analysis. World J. Surg. Oncol. 2016, 14, 261. [Google Scholar] [CrossRef] [Green Version]
- Pope, W.B.; Lai, A.; Mehta, R.; Kim, H.J.; Qiao, J.; Young, J.R.; Xue, X.; Goldin, J.; Brown, M.S.; Nghiemphu, P.L.; et al. Apparent diffusion coefficient histogram analysis stratifies progression-free survival in newly diagnosed bevacizumab-treated glioblastoma. AJNR Am. J. Neuroradiol. 2011, 32, 882–889. [Google Scholar] [CrossRef] [PubMed] [Green Version]
- Romano, A.; Calabria, L.F.; Tavanti, F.; Minniti, G.; Rossi-Espagnet, M.C.; Coppola, V.; Pugliese, S.; Guida, D.; Francione, G.; Colonnese, C.; et al. Apparent diffusion coefficient obtained by magnetic resonance imaging as a prognostic marker in glioblastomas: Correlation with MGMT promoter methylation status. Eur. Radiol. 2013, 23, 513–520. [Google Scholar] [CrossRef] [PubMed]
- Gupta, A.; Prager, A.; Young, R.J.; Shi, W.; Omuro, A.M.; Graber, J.J. Diffusion-weighted MR imaging and MGMT methylation status in glioblastoma: A reappraisal of the role of preoperative quantitative ADC measurements. AJNR Am. J. Neuroradiol. 2013, 34, E10–E11. [Google Scholar] [CrossRef] [PubMed] [Green Version]
- Choi, Y.S.; Ahn, S.S.; Kim, D.W.; Chang, J.H.; Kang, S.G.; Kim, E.H.; Kim, S.H.; Rim, T.H.; Lee, S.K. Incremental Prognostic Value of ADC Histogram Analysis over MGMT Promoter Methylation Status in Patients with Glioblastoma. Radiology 2016, 281, 175–184. [Google Scholar] [CrossRef] [PubMed]
- Han, Y.; Yan, L.F.; Wang, X.B.; Sun, Y.Z.; Zhang, X.; Liu, Z.C.; Nan, H.Y.; Hu, Y.C.; Yang, Y.; Zhang, J.; et al. Structural and advanced imaging in predicting MGMT promoter methylation of primary glioblastoma: A region of interest based analysis. BMC Cancer 2018, 18, 215. [Google Scholar] [CrossRef] [PubMed] [Green Version]


| ADC Histogram Features | Mean ± Standard Deviation | Minimum | Maximum |
|---|---|---|---|
| ADCmean, ×10−5 mm2s−1 | 141.11 ± 31.97 | 66.56 | 230.91 |
| ADCmin, ×10−5 mm2s−1 | 44.00 ± 28.36 | 0.1 | 101.30 |
| ADCmax, ×10−5 mm2s−1 | 278.35 ± 60.11 | 107.30 | 397.80 |
| ADCp10, ×10−5 mm2s−1 | 100.16 ± 20.25 | 44.50 | 160.70 |
| ADCp25, ×10−5 mm2s−1 | 115.86 ± 26.49 | 49.80 | 203.60 |
| ADCp75, ×10−5 mm2s−1 | 163.91 ± 44.76 | 75.30 | 274.00 |
| ADCp90, ×10−5 mm2s−1 | 186.27 ± 48.66 | 82.79 | 283.70 |
| ADCmedian, ×10−5 mm2s−1 | 137.65 ± 35.92 | 59.85 | 263.30 |
| ADCmodus, ×10−5 mm2s−1 | 137.66 ± 52.57 | 46.30 | 277.00 |
| ADC SD, 10−5 mm2s−1 | 34.87 ± 15.64 | 8.77 | 77.46 |
| Kurtosis | 4.72 ± 3.65 | 1.35 | 23.34 |
| Skewness | 0.60 ± 0.95 | −2.07 | 3.80 |
| Entropy | 4.87 ± 0.61 | 3.25 | 6.19 |
| ADC Histogram Features | Low-Grade Glioma Mean ± SD | High-Grade Glioma Mean ± SD | t-Test p-Values | ||
|---|---|---|---|---|---|
| ADCmean, ×10−5 mm2s−1 | 148.70 | 32.04 | 137.60 | 31.88 | 0.1446 |
| ADCmin, ×10−5 mm2s−1 | 53.75 | 25.47 | 39.48 | 28.96 | 0.0433 |
| ADCmax, ×10−5 mm2s−1 | 260.50 | 59.07 | 286.60 | 59.85 | 0.0604 |
| ADCp10, ×10−5 mm2s−1 | 110.00 | 15.45 | 95.59 | 20.88 | 0.0024 |
| ADCp25, ×10−5 mm2s−1 | 129.30 | 26.59 | 109.60 | 24.47 | 0.0014 |
| ADCp75, ×10−5 mm2s−1 | 167.80 | 42.13 | 162.10 | 46.58 | 0.4528 |
| ADCp90, ×10−5 mm2s−1 | 185.30 | 47.07 | 186.70 | 50.22 | 0.8996 |
| ADCmedian, ×10−5 mm2s−1 | 148.90 | 36.22 | 132.40 | 35.21 | 0.0450 |
| ADCmodus, ×10−5 mm2s−1 | 153.20 | 46.25 | 130.40 | 54.60 | 0.0083 |
| ADC SD, 10−5 mm2s−1 | 30.11 | 13.84 | 37.07 | 16.19 | 0.0600 |
| Kurtosis | 4.23 | 2.76 | 4.94 | 4.03 | 0.6381 |
| Skewness | 0.32 | 0.89 | 0.72 | 0.96 | 0.0740 |
| Entropy | 5.19 | 0.70 | 4.73 | 0.51 | 0.0011 |
| Ki-67 | 4.71 | 2.58 | 25.74 | 17.82 | <0.0001 |
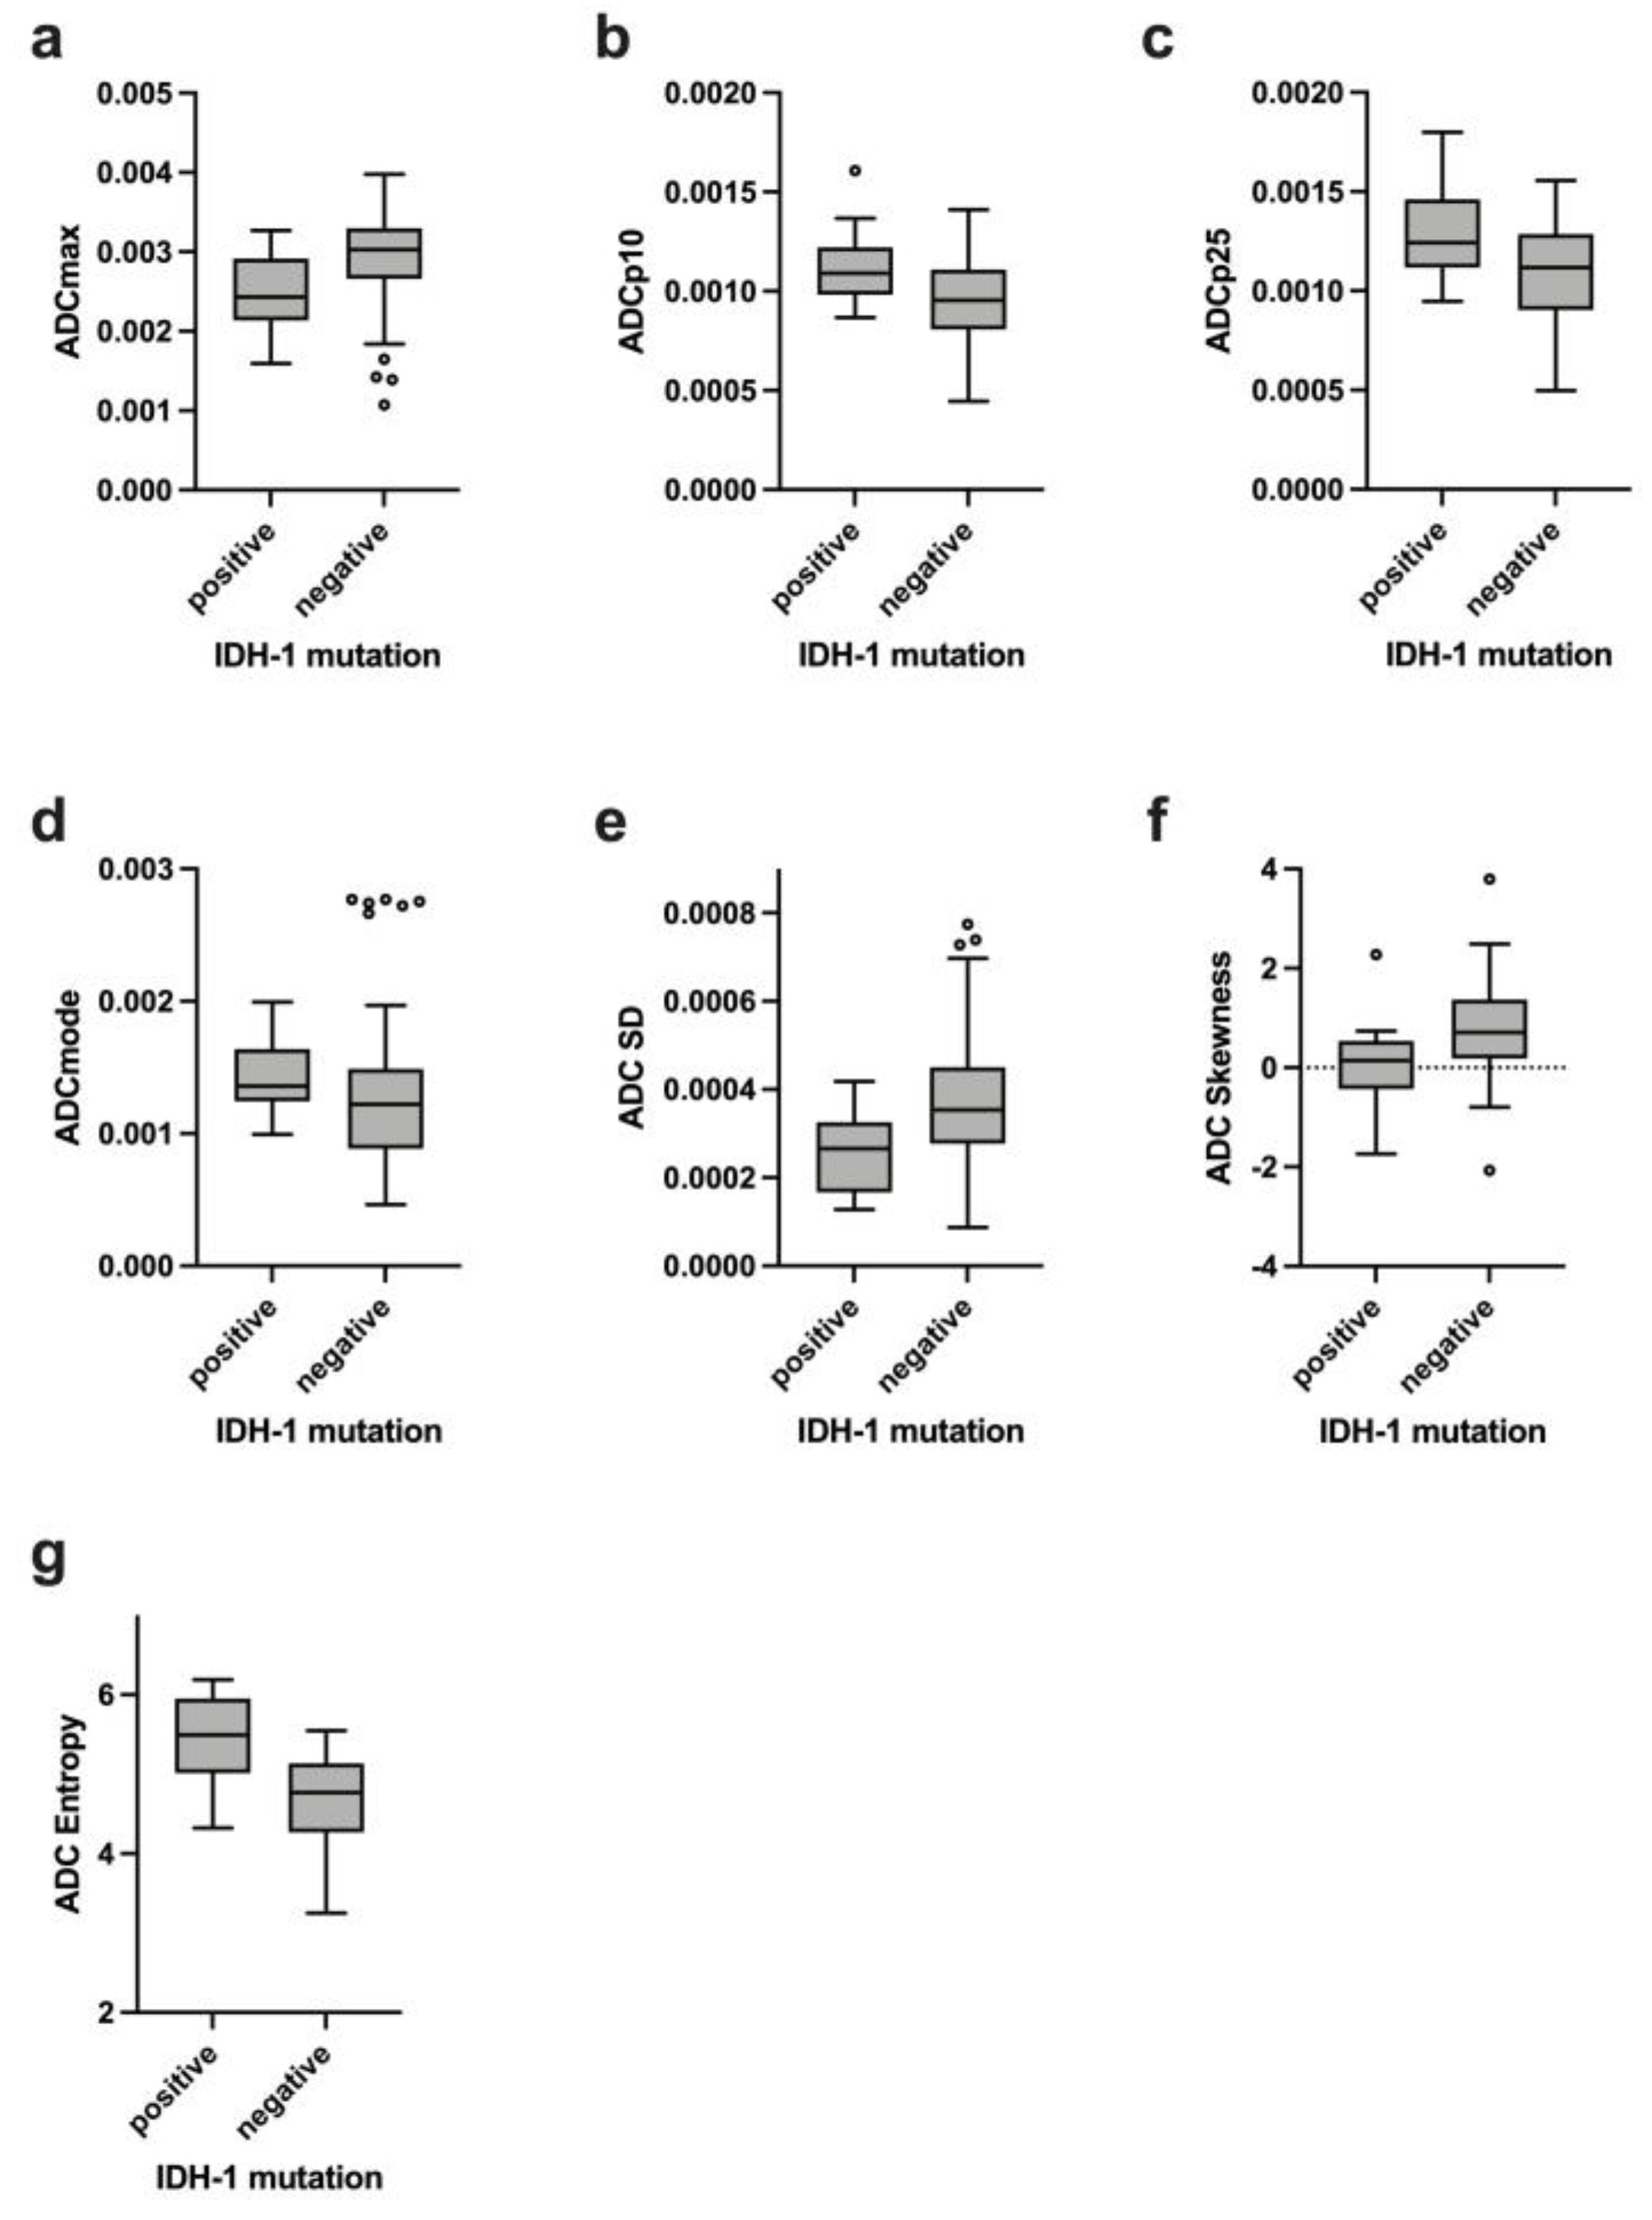
| ADC Histogram Features | IDH-1 Mutation Mean ± SD | IDH-1 Wildtype Mean ± SD | p-Values | ||
|---|---|---|---|---|---|
| ADCmean, ×10−5 mm2s−1 | 144.60 | 22.65 | 138.50 | 33.03 | 0.4523 |
| ADCmin, ×10−5 mm2s−1 | 54.88 | 23.27 | 40.41 | 29.25 | 0.0571 |
| ADCmax, ×10−5 mm2s−1 | 244.10 | 51.79 | 288.40 | 60.15 | 0.0022 |
| ADCp10, ×10−5 mm2s−1 | 112.50 | 18.52 | 95.64 | 19.89 | 0.0017 |
| ADCp25, ×10−5 mm2s−1 | 127.80 | 22.62 | 110.00 | 24.00 | 0.0058 |
| ADCp75, ×10−5 mm2s−1 | 160.80 | 26.43 | 163.40 | 48.61 | 0.7899 |
| ADCp90, ×10−5 mm2s−1 | 175.60 | 28.29 | 188.50 | 52.87 | 0.5170 |
| ADCmedian, ×10−5 mm2s−1 | 144.60 | 25.65 | 133.20 | 35.53 | 0.1245 |
| ADCmodus, ×10−5 mm2s−1 | 146.60 | 31.42 | 132.80 | 56.84 | 0.0320 |
| ADC SD, ×10−5 mm2s−1 | 25.78 | 9.16 | 37.70 | 16.19 | 0.0030 |
| Kurtosis | 3.82 | 1.61 | 5.02 | 4.14 | 0.7296 |
| Skewness | 0.07 | 0.82 | 0.80 | 0.93 | 0.0028 |
| Entropy | 5.42 | 0.58 | 4.70 | 0.54 | <0.0001 |
| ADC Histogram Features | MGMT Promoter Methylation Positive Mean ± SD | MGMT Promoter Methylation Negative Mean ± SD | p-Values | ||
|---|---|---|---|---|---|
| ADCmean, ×10−5 mm2s−1 | 138.30 | 31.98 | 139.60 | 30.61 | 0.8605 |
| ADCmin, ×10−5 mm2s−1 | 41.96 | 27.30 | 40.21 | 29.64 | 0.8835 |
| ADCmax, ×10−5 mm2s−1 | 271.80 | 59.61 | 280.70 | 66.78 | 0.4633 |
| ADCp10, ×10−5 mm2s−1 | 99.01 | 21.24 | 97.10 | 20.17 | 0.3837 |
| ADCp25, ×10−5 mm2s−1 | 112.60 | 25.37 | 112.50 | 24.19 | 0.9848 |
| ADCp75, ×10−5 mm2s−1 | 161.70 | 45.81 | 163.00 | 44.18 | 0.6467 |
| ADCp90, ×10−5 mm2s−1 | 184.00 | 49.19 | 187.10 | 48.99 | 0.7434 |
| ADCmedian, ×10−5 mm2s−1 | 133.70 | 34.32 | 135.90 | 34.58 | 0.7767 |
| ADCmodus, ×10−5 mm2s−1 | 131.00 | 50.25 | 135.50 | 53.61 | 0.9329 |
| ADC SD, ×10−5 mm2s−1 | 34.25 | 15.51 | 36.38 | 16.85 | 0.5618 |
| Kurtosis | 3.92 | 2.09 | 4.75 | 3.60 | 0.8176 |
| Skewness | 0.59 | 0.71 | 0.55 | 0.70 | 0.8430 |
| Entropy | 4.92 | 0.71 | 4.87 | 0.51 | 0.7397 |
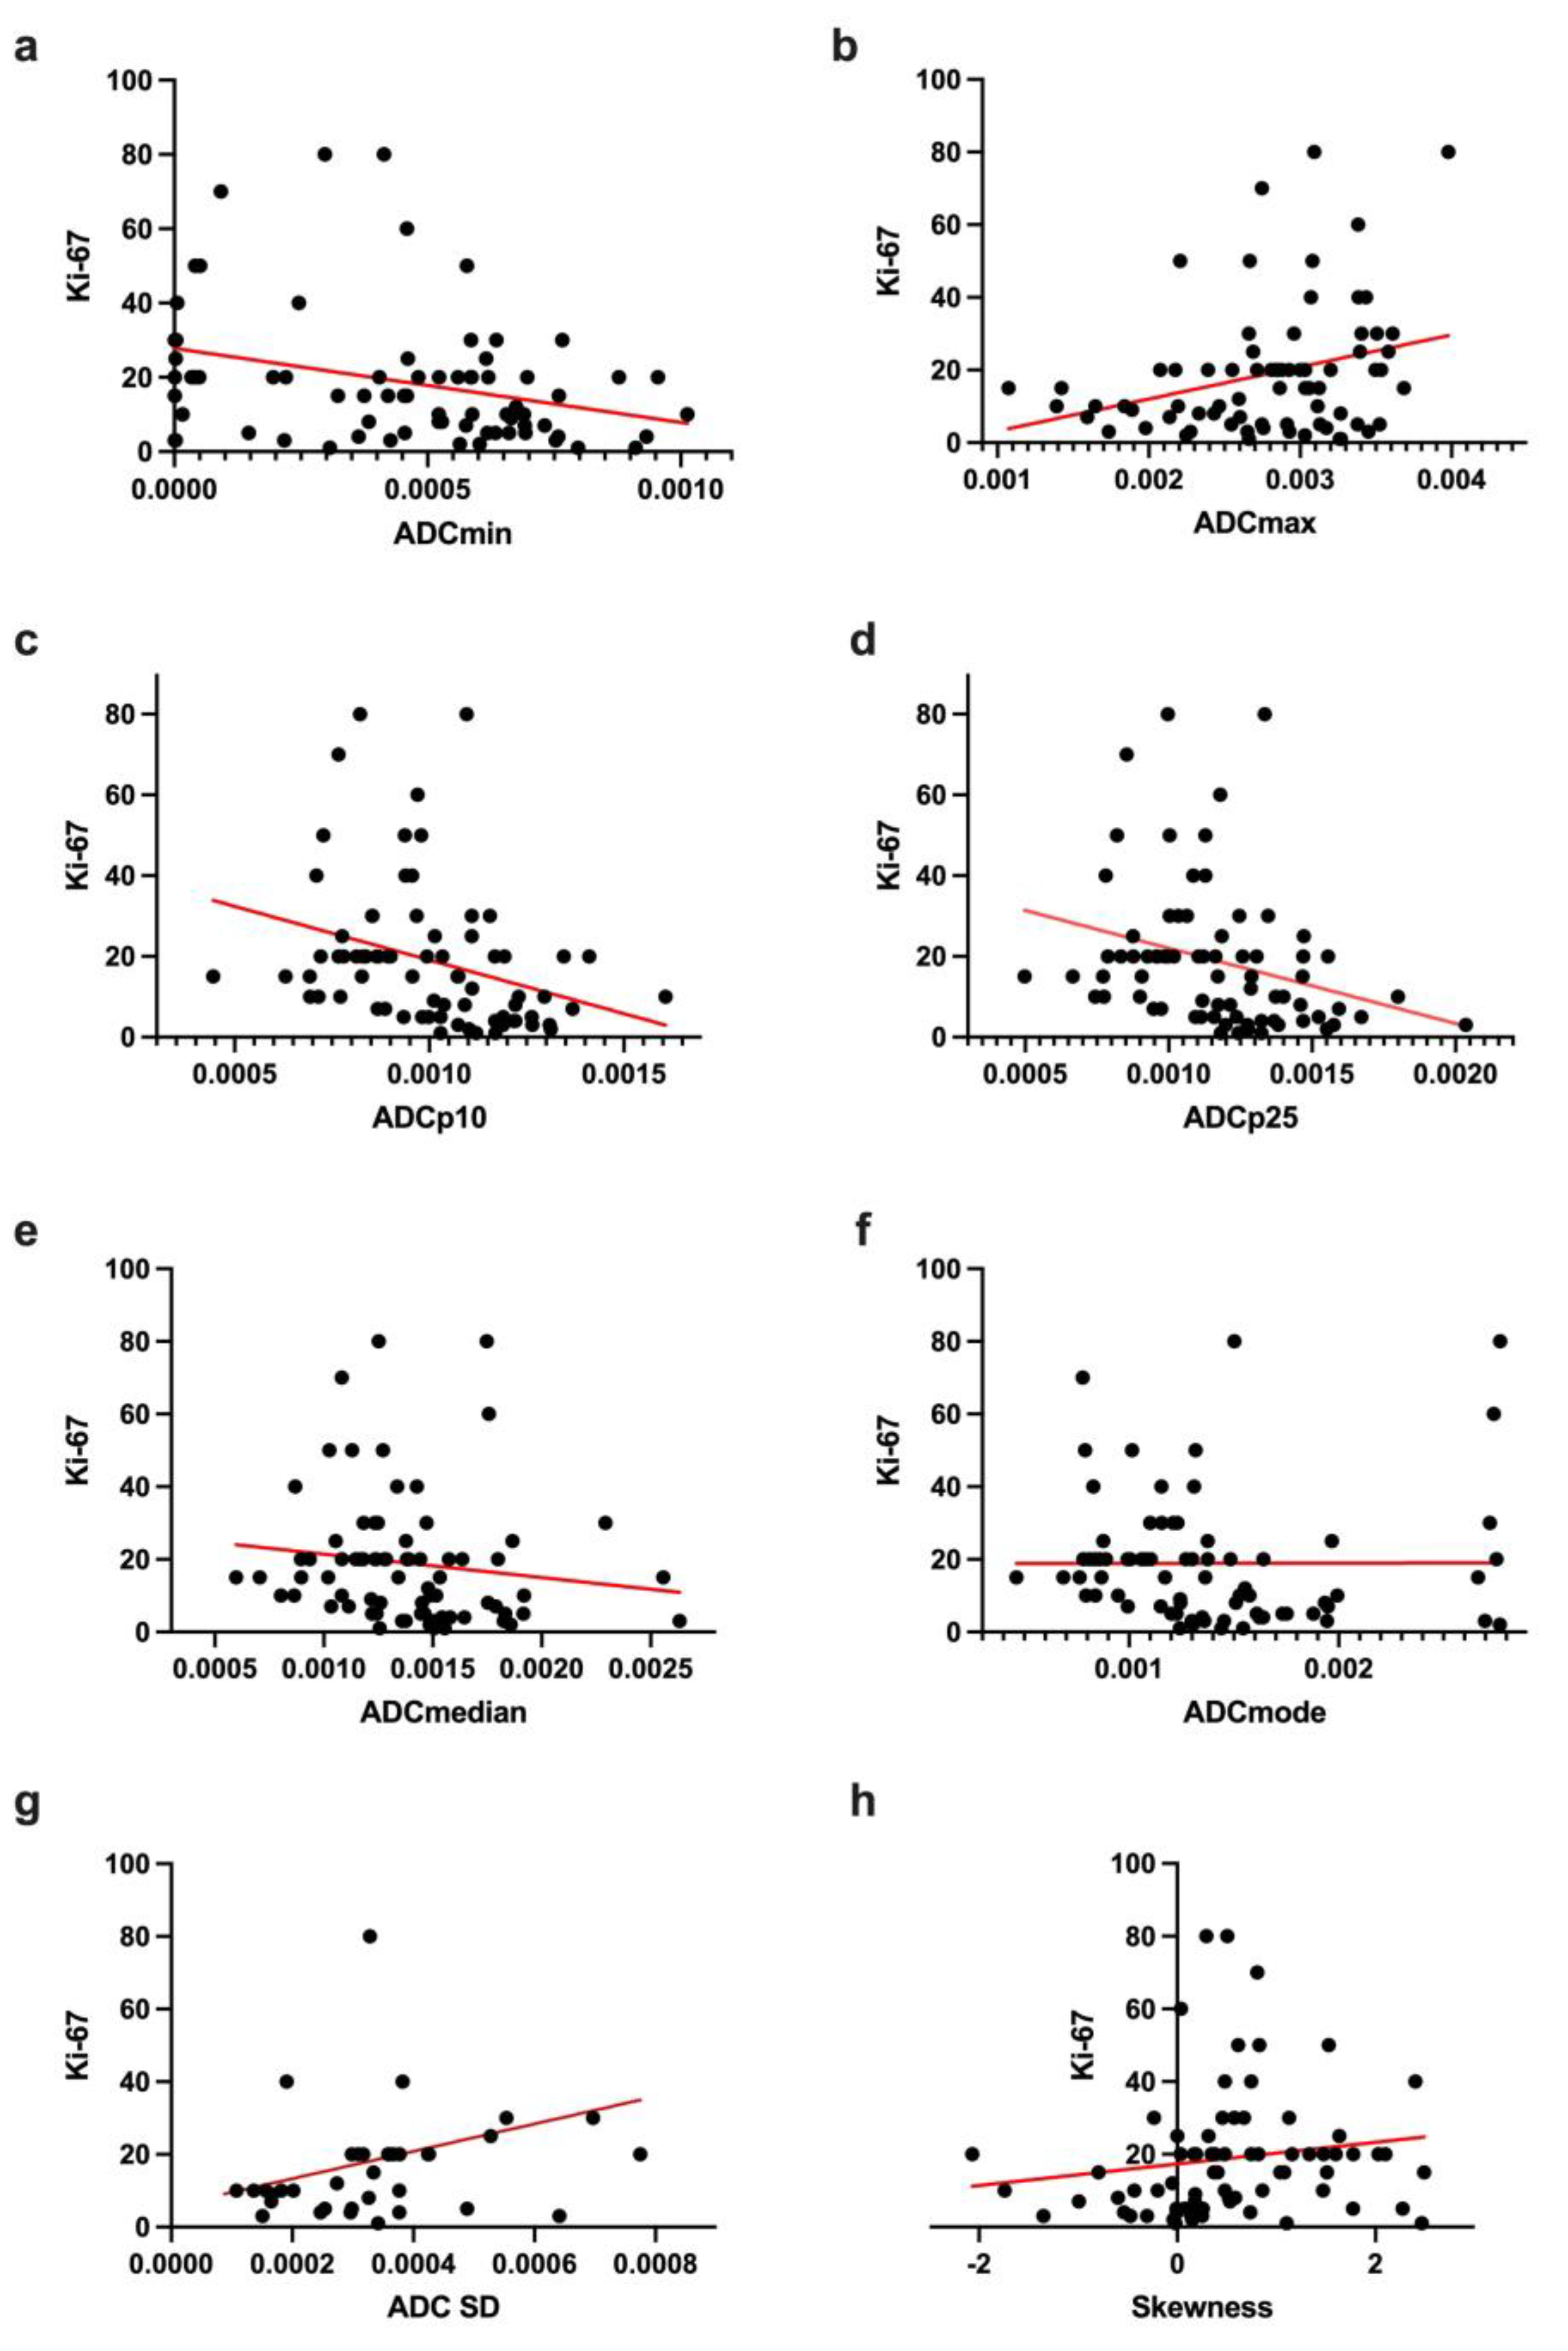
| ADC Histogram Features | Correlation |
|---|---|
| ADCmean, ×10−5 mm2s−1 | r = −0.2044 p = 0.0807 |
| ADCmin, ×10−5 mm2s−1 | r = −0.3107 p = 0.0071 |
| ADCmax, ×10−5 mm2s−1 | r = −0.2772 p = 0.0168 |
| ADCp10, ×10−5 mm2s−1 | r = −0.4506 p < 0.0001 |
| ADCp25, ×10−5 mm2s−1 | r = −0.4026 p = 0.0004 |
| ADCp75, ×10−5 mm2s−1 | r = −0.1103 p = 0.3493 |
| ADCp90, ×10−5 mm2s−1 | r = −0.0207 p = 0.8613 |
| ADCmedian, ×10−5 mm2s−1 | r = −0.2835 p = 0.0144 |
| ADCmodus, ×10−5 mm2s−1 | r = −0.2782 p = 0.0164 |
| ADC SD, ×10−5 mm2s−1 | r = 0.2957 p = 0.0105 |
| Kurtosis | r = −0.0953 p = 0.4192 |
| Skewness | r = 0.3118 p = 0.0068 |
| Entropy | r = −0.0974 p = 0.4090 |
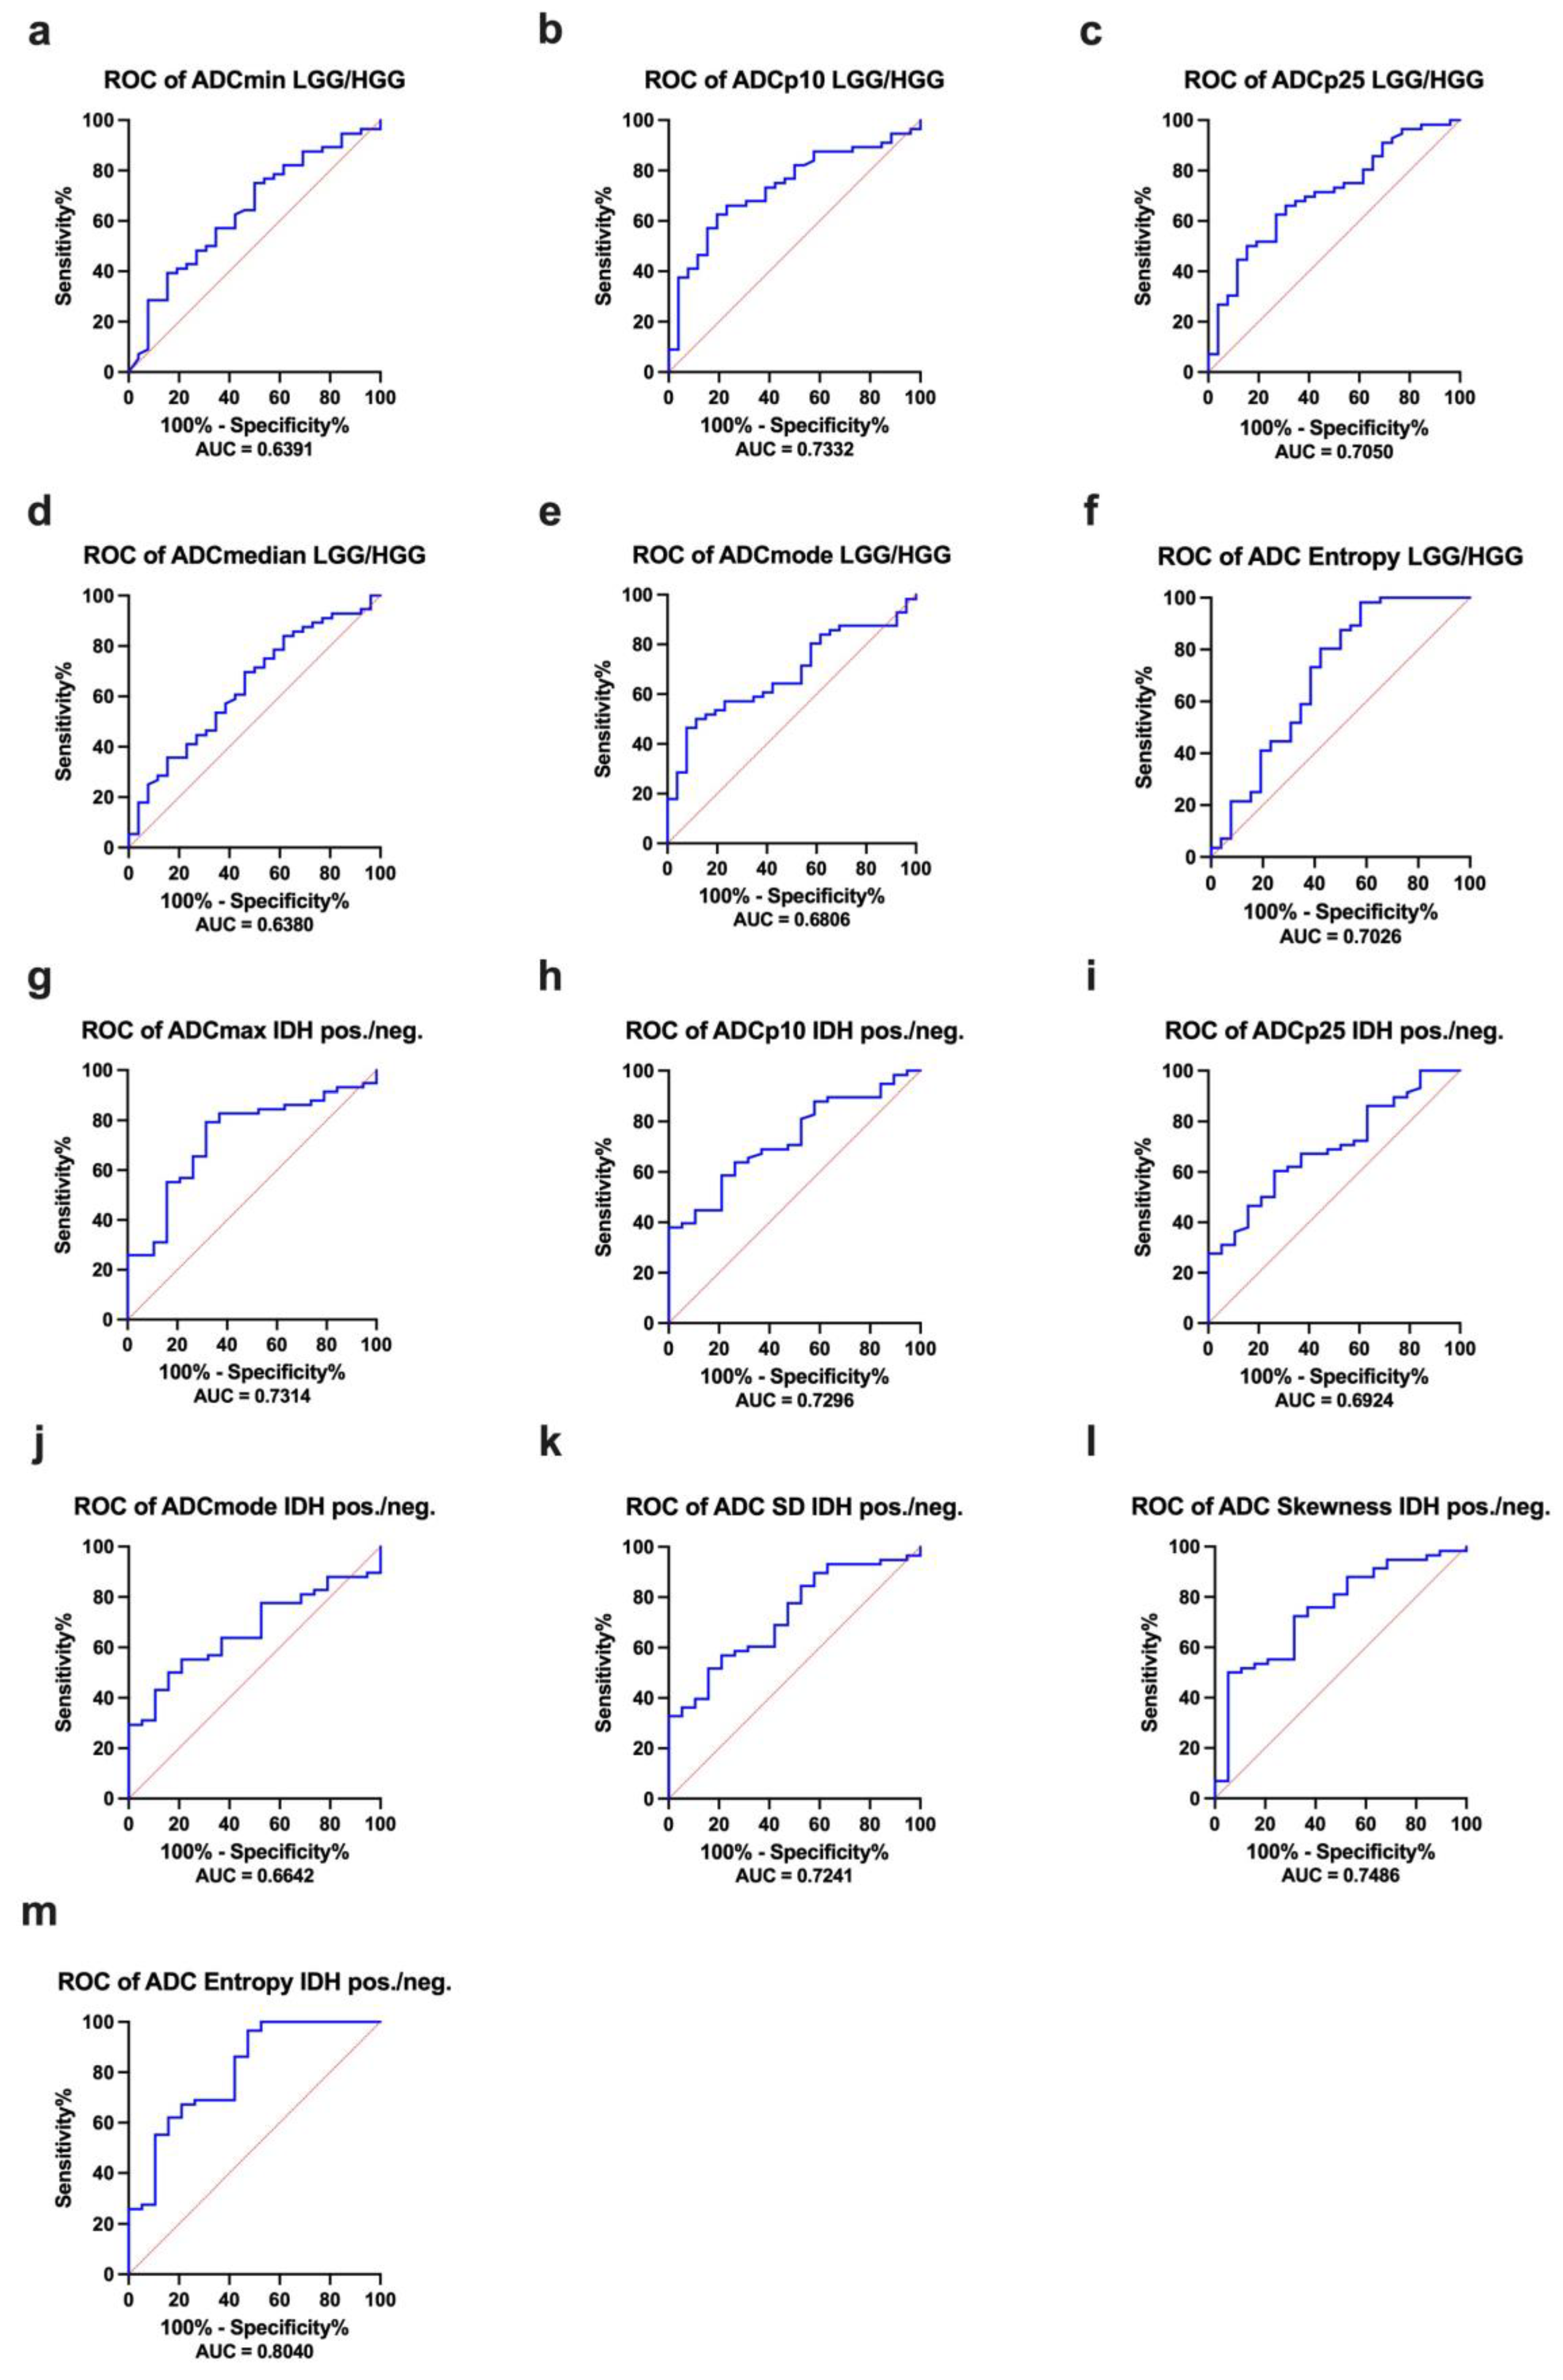
| ROC Analysis LGG versus HGG | |||
|---|---|---|---|
| ADC Histogram Features | AUC | Confidence Interval | p-Value |
| ADCmin, ×10−5 mm2s−1 | 0.6391 | 0.5107–0.7674 | 0.0436 |
| ADCp10, ×10−5 mm2s−1 | 0.7332 | 0.6214–0.8450 | 0.0007 |
| ADCp25, ×10−5 mm2s−1 | 0.7050 | 0.5868–0.8233 | 0.0029 |
| ADCmedian, ×10−5 mm2s−1 | 0.6380 | 0.5099–0.7662 | 0.0452 |
| ADCmodus, ×10−5 mm2s−1 | 0.6806 | 0.5647–0.7966 | 0.0088 |
| Entropy | 0.7026 | 0.5671–0.8381 | 0.0033 |
| ROC Analysis IDH1-mutated versus IDH1-wildtype gliomas | |||
| ADCmax, ×10−5 mm2s−1 | 0.7314 | 0.6054–0.8573 | 0.0026 |
| ADCp10, ×10−5 mm2s−1 | 0.7296 | 0.6116–0.8476 | 0.0028 |
| ADCp25, ×10−5 mm2s−1 | 0.6924 | 0.5653–0.8195 | 0.0122 |
| ADCmodus, ×10−5 mm2s−1 | 0.6642 | 0.5413–0.7872 | 0.0325 |
| ADC SD, ×10−5 mm2s−1 | 0.7241 | 0.6017–0.8466 | 0.0035 |
| Skewness | 0.7486 | 0.6235–0.8737 | 0.0012 |
| Entropy | 0.8040 | 0.6849–0.9231 | p < 0.0001 |
Publisher’s Note: MDPI stays neutral with regard to jurisdictional claims in published maps and institutional affiliations. |
© 2022 by the authors. Licensee MDPI, Basel, Switzerland. This article is an open access article distributed under the terms and conditions of the Creative Commons Attribution (CC BY) license (https://creativecommons.org/licenses/by/4.0/).
Share and Cite
Gihr, G.; Horvath-Rizea, D.; Kohlhof-Meinecke, P.; Ganslandt, O.; Henkes, H.; Härtig, W.; Donitza, A.; Skalej, M.; Schob, S. Diffusion Weighted Imaging in Gliomas: A Histogram-Based Approach for Tumor Characterization. Cancers 2022, 14, 3393. https://doi.org/10.3390/cancers14143393
Gihr G, Horvath-Rizea D, Kohlhof-Meinecke P, Ganslandt O, Henkes H, Härtig W, Donitza A, Skalej M, Schob S. Diffusion Weighted Imaging in Gliomas: A Histogram-Based Approach for Tumor Characterization. Cancers. 2022; 14(14):3393. https://doi.org/10.3390/cancers14143393
Chicago/Turabian StyleGihr, Georg, Diana Horvath-Rizea, Patricia Kohlhof-Meinecke, Oliver Ganslandt, Hans Henkes, Wolfgang Härtig, Aneta Donitza, Martin Skalej, and Stefan Schob. 2022. "Diffusion Weighted Imaging in Gliomas: A Histogram-Based Approach for Tumor Characterization" Cancers 14, no. 14: 3393. https://doi.org/10.3390/cancers14143393
APA StyleGihr, G., Horvath-Rizea, D., Kohlhof-Meinecke, P., Ganslandt, O., Henkes, H., Härtig, W., Donitza, A., Skalej, M., & Schob, S. (2022). Diffusion Weighted Imaging in Gliomas: A Histogram-Based Approach for Tumor Characterization. Cancers, 14(14), 3393. https://doi.org/10.3390/cancers14143393