
Pre-Surgery Demographic, Clinical, and Symptom Characteristics Associated with Different Self-Reported Cognitive Processes in Patients with Breast Cancer

 ,
,  , , and
Abstract
:Simple Summary
Abstract
1. Introduction
2. Materials and Methods
2.1. Study Procedures
2.2. Instruments
2.2.1. Demographic and Clinical Characteristics
2.2.2. Attentional Function
2.2.3. Psychological Symptoms
Anxiety
Depression
2.2.4. Physical Symptoms
Fatigue and Energy
Sleep Disturbance
Pain
2.3. Statistical Analyses
3. Results
3.1. Identification of Subgroups within Each AFI Subscale-LCGA Analyses
3.2. Effective Action Latent Classes
3.2.1. Differences in Demographic and Clinical Characteristics
3.2.2. Differences in Psychological and Physical Symptoms
3.3. Attentional Lapses Latent Classes
3.3.1. Differences in Demographic and Clinical Characteristics
3.3.2. Differences in Psychological and Physical Symptoms
3.4. Interpersonal Effectiveness Latent Classes
3.4.1. Differences in Demographic and Clinical Characteristics
3.4.2. Differences in Psychological and Physical Symptoms
4. Discussion
4.1. Demographic and Clinical Characteristics
4.2. Psychological and Physical Symptoms
4.3. Potential Mechanisms Associated with Differences in Cognitive Processes
4.4. Limitations
4.5. Implications for Research and Practice
Author Contributions
Funding
Institutional Review Board Statement
Informed Consent Statement
Data Availability Statement
Conflicts of Interest
References
- Olson, B.; Marks, D.L. Pretreatment Cancer-Related Cognitive Impairment—Mechanisms and Outlook. Cancers 2019, 11, 687. [Google Scholar] [CrossRef] [PubMed] [Green Version]
- Mayo, S.J.; Lustberg, M.; Dhillon, H.M.; Nakamura, Z.M.; Allen, D.H.; Von Ah, D.; Janelsins, M.C.; Chan, A.; Olson, K.; Tan, C.J.; et al. Cancer-related cognitive impairment in patients with non-central nervous system malignancies: An overview for oncology providers from the MASCC Neurological Complications Study Group. Support. Care Cancer 2021, 29, 2821–2840. [Google Scholar] [CrossRef] [PubMed]
- Dijkshoorn, A.B.C.; van Stralen, H.E.; Sloots, M.; Schagen, S.B.; Visser-Meily, J.M.A.; Schepers, V.P.M. Prevalence of cognitive impairment and change in patients with breast cancer: A systematic review of longitudinal studies. Psycho-Oncology 2021, 30, 635–648. [Google Scholar] [CrossRef] [PubMed]
- Diamond, A. Executive Functions. Annu. Rev. Psychol. 2013, 64, 135–168. [Google Scholar] [CrossRef] [Green Version]
- Cristofori, I.; Cohen-Zimerman, S.; Grafman, J. Executive functions. Handb. Clin. Neurol. 2019, 163, 197–219. [Google Scholar] [CrossRef] [PubMed]
- Harvey, P.D. Domains of cognition and their assessment. Dialog Clin. Neurosci. 2019, 21, 227–237. [Google Scholar] [CrossRef] [PubMed]
- Ku, Y. Selective attention on representations in working memory: Cognitive and neural mechanisms. PeerJ 2018, 6, e4585. [Google Scholar] [CrossRef] [PubMed] [Green Version]
- Lezak, M.D.; Howieson, D.B.; Bigler, E.D.; Tranel, D. Neuropsychological Assessment, 5th ed.; Oxford University Press: New York, NY, USA, 2012; p. 1161. [Google Scholar]
- Bai, L.; Yu, E. A narrative review of risk factors and interventions for cancer-related cognitive impairment. Ann. Transl. Med. 2021, 9, 72. [Google Scholar] [CrossRef]
- Kesler, S.R.; Adams, M.; Packer, M.; Rao, V.; Henneghan, A.M.; Blayney, D.W.; Palesh, O. Disrupted brain network functional dynamics and hyper-correlation of structural and functional connectome topology in patients with breast cancer prior to treatment. Brain Behav. 2017, 7, e00643. [Google Scholar] [CrossRef]
- Horowitz, T.S.; Treviño, M.; Gooch, I.M.; Duffy, K.A. Understanding the Profile of Cancer-Related Cognitive Impairments: A Critique of Meta-Analyses. J. Natl. Cancer Inst. 2019, 111, 1009–1015. [Google Scholar] [CrossRef]
- Chen, M.-L.; Miaskowski, C.; Liu, L.-N.; Chen, S.-C. Changes in perceived attentional function in women following breast cancer surgery. Breast Cancer Res. Treat. 2012, 131, 599–606. [Google Scholar] [CrossRef]
- Cimprich, B. Pretreatment symptom distress in women newly diagnosed with breast cancer. Cancer Nurs. 1999, 22, 185–194. [Google Scholar] [CrossRef]
- Cimprich, B.; So, H.; Ronis, D.L.; Trask, C. Pre-treatment factors related to cognitive functioning in women newly diagnosed with breast cancer. Psycho-Oncology 2005, 14, 70–78. [Google Scholar] [CrossRef] [Green Version]
- Cimprich, B.; Visovatti, M.; Ronis, D.L. The Attentional Function Index-a self-report cognitive measure. Psycho-Oncology 2011, 20, 194–202. [Google Scholar] [CrossRef] [PubMed] [Green Version]
- Jung, M.S.; Visovatti, M.A.; Sohn, E.H.; Yoo, H.-S.; Kim, M.; Kim, J.R.; Lee, J.S. Impact of changes in perceived attentional function on postsurgical health-related quality of life in breast cancer patients awaiting adjuvant treatment. Health Qual. Life Outcomes 2020, 18, 230. [Google Scholar] [CrossRef] [PubMed]
- Jung, M.S.; Zhang, M.; Askren, M.K.; Berman, M.G.; Peltier, S.; Hayes, D.F.; Therrien, B.; Reuter-Lorenz, P.A.; Cimprich, B. Cognitive dysfunction and symptom burden in women treated for breast cancer: A prospective behavioral and fMRI analysis. Brain Imaging Behav. 2017, 11, 86–97. [Google Scholar] [CrossRef]
- Kohler, C.; Chang, M.; Allemann-Su, Y.-Y.; Vetter, M.; Jung, M.; Jung, M.; Conley, Y.; Paul, S.; Kober, K.M.; Cooper, B.A.; et al. Changes in Attentional Function in Patients from Before Through 12 Months After Breast Cancer Surgery. J. Pain Symptom Manag. 2020, 59, 1172–1185. [Google Scholar] [CrossRef]
- Merriman, J.; Dodd, M.; Lee, K.; Paul, S.M.; Cooper, B.A.; Aouizerat, B.E.; Swift, P.S.; Wara, W.; Dunn, L.; Miaskowski, C. Differences in Self-reported Attentional Fatigue Between Patients with Breast and Prostate Cancer at the Initiation of Radiation Therapy. Cancer Nurs. 2011, 34, 345–353. [Google Scholar] [CrossRef]
- Utne, I.; Løyland, B.; Grov, E.K.; Rasmussen, H.L.; Torstveit, A.H.; Cooper, B.A.; Mastick, J.; Mazor, M.; Wong, M.; Paul, S.M.; et al. Distinct attentional function profiles in older adults receiving cancer chemotherapy. Eur. J. Oncol. Nurs. 2018, 36, 32–39. [Google Scholar] [CrossRef] [PubMed]
- Crouch, A.; Champion, V.L.; Unverzagt, F.W.; Pressler, S.J.; Huber, L.; Moser, L.R.; Cella, D.; Von Ah, D. Cognitive dysfunction prevalence and associated factors in older breast cancer survivors. J. Geriatr. Oncol. 2022, 13, 33–39. [Google Scholar] [CrossRef]
- Lee, E.H. Relationships of Mood Disturbance, Symptom Experience, and Attentional Function in Women with Breast Cancer Based upon the Theory of Unpleasant Symptoms. J. Korean Acad. Nurs. 2005, 35, 728–736. [Google Scholar] [CrossRef] [PubMed] [Green Version]
- Moon, S.; Kim, S.-H.; Kim, M.-J. Perceived Cognitive Function and Related Factors in Korean Women with Breast Cancer. Asian Nurs. Res. Korean Soc. Nurs. Sci. 2011, 5, 141–150. [Google Scholar] [CrossRef] [Green Version]
- Pradhan, K.R.; Stump, T.E.; Monahan, P.; Champion, V. Relationships among attention function, exercise, and body mass index: A comparison between young breast cancer survivors and acquaintance controls. Psycho-Oncology 2014, 24, 325–332. [Google Scholar] [CrossRef] [PubMed] [Green Version]
- Von Ah, D.; Russell, K.M.; Storniolo, A.M.; Carpenter, J.S. Cognitive Dysfunction and Its Relationship to Quality of Life in Breast Cancer Survivors. Oncol. Nurs. Forum 2009, 36, 326–336. [Google Scholar] [CrossRef]
- Merriman, J.D.; Aouizerat, B.E.; Cataldo, J.K.; Dunn, L.; Cooper, B.A.; West, C.; Paul, S.M.; Baggott, C.R.; Dhruva, A.; Kober, K.; et al. Association between an interleukin 1 receptor, type I promoter polymorphism and self-reported attentional function in women with breast cancer. Cytokine 2014, 65, 192–201. [Google Scholar] [CrossRef] [Green Version]
- Lehto, R.H.; Cimprich, B. Anxiety and directed attention in women awaiting breast cancer surgery. Oncol. Nurs. Forum 1999, 26, 767–772. [Google Scholar]
- Duijts, S.F.; Van Der Beek, A.J.; Boelhouwer, I.G.; Schagen, S.B. Cancer-related cognitive impairment and patients’ ability to work: A current perspective. Curr. Opin. Support. Palliat. Care 2017, 11, 19–23. [Google Scholar] [CrossRef]
- Lange, M.; Joly, F.; Vardy, J.; Ahles, T.; Dubois, M.; Tron, L.; Winocur, G.; De Ruiter, M.; Castel, H. Cancer-related cognitive impairment: An update on state of the art, detection, and management strategies in cancer survivors. Ann. Oncol. 2019, 30, 1925–1940. [Google Scholar] [CrossRef] [Green Version]
- Allemann-Su, Y.-Y.; Vetter, M.; Koechlin, H.; Conley, Y.; Paul, S.M.; Cooper, B.A.; Kober, K.M.; Levine, J.D.; Miaskowski, C.; Katapodi, M.C. Distinct Cognitive Function Profiles Are Associated with a Higher Presurgery Symptom Burden in Patients with Breast Cancer. Cancer Nurs. 2022, 10–1097. [Google Scholar] [CrossRef]
- Ahles, T.A.; Root, J.C. Cognitive Effects of Cancer and Cancer Treatments. Annu. Rev. Clin. Psychol. 2018, 14, 425–451. [Google Scholar] [CrossRef]
- McCann, B.; Miaskowski, C.; Koetters, T.; Baggott, C.; West, C.; Levine, J.D.; Elboim, C.; Abrams, G.; Hamolsky, D.; Dunn, L.; et al. Associations Between Pro- and Anti-Inflammatory Cytokine Genes and Breast Pain in Women Prior to Breast Cancer Surgery. J. Pain 2012, 13, 425–437. [Google Scholar] [CrossRef] [PubMed] [Green Version]
- Schag, C.C.; Heinrich, R.L.; Ganz, P.A. Karnofsky performance status revisited: Reliability, validity, and guidelines. J. Clin. Oncol. 1984, 2, 187–193. [Google Scholar] [CrossRef] [PubMed]
- Sangha, O.; Stucki, G.; Liang, M.H.; Fossel, A.H.; Katz, J.N. The self-administered comorbidity questionnaire: A new method to assess comorbidity for clinical and health services research. Arthritis Care Res. 2003, 49, 156–163. [Google Scholar] [CrossRef]
- Baumann, E.; Kuba, K.; Götze, H.; Mehnert-Theuerkauf, A.; Esser, P. Initial validation of the German version of the Attentional Function Index in a sample of haematological cancer survivors. Eur. J. Cancer Care 2020, 29, e13226. [Google Scholar] [CrossRef] [PubMed] [Green Version]
- Bieling, P.J.; Antony, M.M.; Swinson, R.P. The State–Trait Anxiety Inventory, Trait version: Structure and content re-examined. Behav. Res. Ther. 1998, 36, 777–788. [Google Scholar] [CrossRef]
- Fletcher, B.S.; Paul, S.M.; Dodd, M.J.; Schumacher, K.; West, C.; Cooper, B.; Lee, K.; Aouizerat, B.; Swift, P.; Wara, W.; et al. Prevalence, Severity, and Impact of Symptoms on Female Family Caregivers of Patients at the Initiation of Radiation Therapy for Prostate Cancer. J. Clin. Oncol. 2008, 26, 599–605. [Google Scholar] [CrossRef]
- Spielberger, C.; Gorsuch, R.; Lushene, P.; Vaggs, P.; Jacobs, G. Manual for the State-Trait Anxiety Index (Form Y); Palo Alto: Santa Clara, CA, USA, 1983. [Google Scholar]
- Radloff, L.S. The CES-D scale: A self-report depression scale for research in the general population. Appl. Psychol. Meas. 1977, 1, 385–401. [Google Scholar] [CrossRef]
- Lee, K.A.; Hicks, G.; Nino-Murcia, G. Validity and reliability of a scale to assess fatigue. Psychiatry Res. 1991, 36, 291–298. [Google Scholar] [CrossRef]
- Dhruva, A.; Dodd, M.; Paul, S.M.; Cooper, B.A.; Lee, K.; West, C.; Aouizerat, B.E.; Swift, P.S.; Wara, W.; Miaskowski, C. Trajectories of Fatigue in Patients with Breast Cancer Before, During, and After Radiation Therapy. Cancer Nurs. 2010, 33, 201–212. [Google Scholar] [CrossRef] [Green Version]
- Lee, K.A.; DeJoseph, J.F. Sleep Disturbances, Vitality, and Fatigue Among a Select Group of Employed Childbearing Women. Birth 1992, 19, 208–213. [Google Scholar] [CrossRef]
- Tasmuth, T.; Smitten, K.; Hietanen, P.; Kataja, M.; Kalso, E. Pain and other symptoms after different treatment modalities of breast cancer. Ann. Oncol. 1995, 6, 453–459. [Google Scholar] [CrossRef] [PubMed]
- Tasmuth, T.; Von Smitten, K.; Kalso, E. Pain and other symptoms during the first year after radical and conservative surgery for breast cancer. Br. J. Cancer 1996, 74, 2024–2031. [Google Scholar] [CrossRef] [PubMed] [Green Version]
- Cleeland, C.S.; Ryan, K.M. Pain assessment: Global use of the Brief Pain Inventory. Ann. Acad. Med. Singap. 1994, 23, 129–138. [Google Scholar] [PubMed]
- Dunn, L.B.; Aouizerat, B.E.; Cooper, B.A.; Dodd, M.; Lee, K.; West, C.; Paul, S.M.; Wara, W.; Swift, P.; Miaskowski, C. Trajectories of anxiety in oncology patients and family caregivers during and after radiation therapy. Eur. J. Oncol. Nurs. 2012, 16, 1–9. [Google Scholar] [CrossRef] [Green Version]
- Cosentino, S.; Devanand, D.; Gurland, B. A Link between Subjective Perceptions of Memory and Physical Function: Implications for Subjective Cognitive Decline. J. Alzheimer’s Dis. 2018, 61, 1387–1398. [Google Scholar] [CrossRef]
- Crouch, A.; Champion, V.L.; Von Ah, D. Comorbidity, cognitive dysfunction, physical functioning, and quality of life in older breast cancer survivors. Support. Care Cancer 2022, 30, 359–366. [Google Scholar] [CrossRef]
- Nakamura, Z.M.; Deal, A.M.; Nyrop, K.A.; Choi, S.K.; Wood, W.A.; Muss, H.B. Associations of functional, psychosocial, medical, and socio-demographic factors with cognitive screening in chemotherapy naïve patients with breast cancer. Psycho-Oncology 2019, 28, 167–173. [Google Scholar] [CrossRef]
- Sloan, J.A.; Frost, M.H.; Berzon, R.; Dueck, A.; Guyatt, G.; Moinpour, C.; Sprangers, M.; Ferrans, C.; Cella, D.; Clinical Significance Consensus Meeting Group. The clinical significance of quality of life assessments in oncology: A summary for clinicians. Support. Care Cancer 2006, 14, 988–998. [Google Scholar] [CrossRef]
- Knight, M.M. Cognitive ability and functional status. J. Adv. Nurs. 2000, 31, 1459–1468. [Google Scholar] [CrossRef]
- Arneil, M.; Anderson, D.; Alexander, K.; McCarthy, A. Physical activity and cognitive changes in younger women after breast cancer treatment. BMJ Support. Palliat. Care 2020, 10, 122–125. [Google Scholar] [CrossRef]
- Bender, C.M.; Sereika, S.M.; Gentry, A.L.; Duquette, J.E.; Casillo, F.E.; Marsland, A.; Brufsky, A.M.; Evans, S.; Gorantla, V.C.; Grahovac, T.L.; et al. Physical activity, cardiorespiratory fitness, and cognitive function in postmenopausal women with breast cancer. Support. Care Cancer 2021, 29, 3743–3752. [Google Scholar] [CrossRef] [PubMed]
- Hartman, S.J.; Marinac, C.R.; Natarajan, L.; Patterson, R.E. Lifestyle factors associated with cognitive functioning in breast cancer survivors. Psycho-Oncology 2015, 24, 669–675. [Google Scholar] [CrossRef] [PubMed]
- Sánchez-SanSegundo, M.; Zaragoza-Martí, A.; Martin-Llaguno, I.; Berbegal, M.; Ferrer-Cascales, R.; Hurtado-Sánchez, J. The Role of BMI, Body Fat Mass and Visceral Fat in Executive Function in Individuals with Overweight and Obesity. Nutrients 2021, 13, 2259. [Google Scholar] [CrossRef] [PubMed]
- Russell, J.K.; Jones, C.K.; Newhouse, P.A. The Role of Estrogen in Brain and Cognitive Aging. Neurotherapeutics 2019, 16, 649–665. [Google Scholar] [CrossRef]
- Shanmugan, S.; Epperson, C.N. Estrogen and the prefrontal cortex: Towards a new understanding of estrogen’s effects on executive functions in the menopause transition. Hum. Brain Mapp. 2014, 35, 847–865. [Google Scholar] [CrossRef] [Green Version]
- Pfeiler, G. Estrogens—The Saviors of Cognitive Function? Breast Care 2016, 11, 238–239. [Google Scholar] [CrossRef] [Green Version]
- Hardy-Leger, I.; Charles, C.; Lange, M.; Joly, F.; Roux, P.; Capel, A.; Petrucci, J.; Rigal, O.; Le Fel, J.; Vanlemmens, L.; et al. Differentiation of groups of patients with cognitive complaints at breast cancer diagnosis: Results from a sub-study of the French CANTO cohort. Psycho-Oncology 2021, 30, 463–470. [Google Scholar] [CrossRef]
- Lange, M.; Hardy-Léger, I.; Licaj, I.; Pistilli, B.; Rigal, O.; Le Fel, J.; Lévy, C.; Capel, A.; Coutant, C.; Meyer, J.; et al. Cognitive Impairment in Patients with Breast Cancer before Surgery: Results from a CANTO Cohort Subgroup. Cancer Epidemiol. Biomarkers Prev. 2020, 29, 1759–1766. [Google Scholar] [CrossRef]
- Duivon, M.; Giffard, B.; Desgranges, B.; Perrier, J. Are Sleep Complaints Related to Cognitive Functioning in Non-Central Nervous System Cancer? A Systematic Review. Neuropsychol. Rev. 2021, 1–23. [Google Scholar] [CrossRef]
- Moriarty, O.; McGuire, B.E.; Finn, D.P. The effect of pain on cognitive function: A review of clinical and preclinical research. Prog. Neurobiol. 2011, 93, 385–404. [Google Scholar] [CrossRef] [Green Version]
- Langford, D.J.; Schmidt, B.; Levine, J.D.; Abrams, G.; Elboim, C.; Esserman, L.; Hamolsky, D.; Mastick, J.; Paul, S.M.; Cooper, B.; et al. Preoperative Breast Pain Predicts Persistent Breast Pain and Disability After Breast Cancer Surgery. J. Pain Symptom Manag. 2015, 49, 981–994. [Google Scholar] [CrossRef] [PubMed]
- Hurtz, H.-J.; Tesch, H.; Göhler, T.; Hutzschenreuter, U.; Harde, J.; Kruggel, L.; Jänicke, M.; Marschner, N. Persistent impairments 3 years after (neo)adjuvant chemotherapy for breast cancer: Results from the MaTox project. Breast Cancer Res. Treat. 2017, 165, 721–731. [Google Scholar] [CrossRef] [PubMed] [Green Version]
- Saibil, S.; Fitzgerald, B.; Freedman, O.C.; Amir, E.; Napolskikh, J.; Salvo, N.; Dranitsaris, G.; Clemons, M. Incidence of Taxane-Induced Pain and Distress in Patients Receiving Chemotherapy for Early-Stage Breast Cancer: A Retrospective, Outcomes-Based Survey. Curr. Oncol. 2010, 17, 42–47. [Google Scholar] [CrossRef] [PubMed] [Green Version]
- Deprez, S.; Kesler, S.R.; Saykin, A.J.; Silverman, D.H.S.; De Ruiter, M.B.; McDonald, B.C. International Cognition and Cancer Task Force Recommendations for Neuroimaging Methods in the Study of Cognitive Impairment in Non-CNS Cancer Patients. J. Natl. Cancer Inst. 2018, 110, 223–231. [Google Scholar] [CrossRef] [PubMed]
- McDonald, B.C. Structural Neuroimaging Findings Related to Adult Non-CNS Cancer and Treatment: Review, Integration, and Implications for Treatment of Cognitive Dysfunction. Neurotherapeutics 2021, 18, 792–810. [Google Scholar] [CrossRef]
- Sousa, H.; Almeida, S.; Bessa, J.; Pereira, M.G. The Developmental Trajectory of Cancer-Related Cognitive Impairment in Breast Cancer Patients: A Systematic Review of Longitudinal Neuroimaging Studies. Neuropsychol. Rev. 2020, 30, 287–309. [Google Scholar] [CrossRef]
- Friedman, N.P.; Robbins, T.W. The role of prefrontal cortex in cognitive control and executive function. Neuropsychopharmacology 2022, 47, 72–89. [Google Scholar] [CrossRef]
- Menon, V.; D’Esposito, M. The role of PFC networks in cognitive control and executive function. Neuropsychopharmacology 2022, 47, 90–103. [Google Scholar] [CrossRef]
- Menon, B. Towards a new model of understanding—The triple network, psychopathology and the structure of the mind. Med. Hypotheses 2019, 133, 109385. [Google Scholar] [CrossRef]
- Menon, V. Large-scale brain networks and psychopathology: A unifying triple network model. Trends Cogn. Sci. 2011, 15, 483–506. [Google Scholar] [CrossRef]
- Meehan, T.P.; Bressler, S.L. Neurocognitive networks: Findings, models, and theory. Neurosci. Biobehav. Rev. 2012, 36, 2232–2247. [Google Scholar] [CrossRef] [PubMed]
- Krönke, K.-M.; Wolff, M.; Shi, Y.; Kräplin, A.; Smolka, M.N.; Bühringer, G.; Goschke, T. Functional connectivity in a triple-network saliency model is associated with real-life self-control. Neuropsychologia 2020, 149, 107667. [Google Scholar] [CrossRef] [PubMed]
- Kesler, S.R. Default mode network as a potential biomarker of chemotherapy-related brain injury. Neurobiol. Aging 2014, 35 (Suppl. S2), S11–S19. [Google Scholar] [CrossRef] [PubMed] [Green Version]
- Buckner, R.L. The brain’s default network: Origins and implications for the study of psychosis. Dialog Clin. Neurosci. 2013, 15, 351–358. [Google Scholar] [CrossRef]
- Smallwood, J.; Bernhardt, B.C.; Leech, R.; Bzdok, D.; Jefferies, E.; Margulies, D.S. The default mode network in cognition: A topographical perspective. Nat. Rev. Neurosci. 2021, 22, 503–513. [Google Scholar] [CrossRef]
- Hare, B.D.; Duman, R.S. Prefrontal cortex circuits in depression and anxiety: Contribution of discrete neuronal populations and target regions. Mol. Psychiatry 2020, 25, 2742–2758. [Google Scholar] [CrossRef]
- Overeem, S.; van Litsenburg, R.R.; Reading, P.J. Sleep disorders and the hypothalamus. Handb. Clin. Neurol. 2021, 182, 369–385. [Google Scholar] [CrossRef]
- Krause, A.J.; Ben Simon, E.; Mander, B.A.; Greer, S.M.; Saletin, J.M.; Goldstein-Piekarski, A.N.; Walker, M.P. The sleep-deprived human brain. Nat. Rev. Neurosci. 2017, 18, 404–418. [Google Scholar] [CrossRef]
- André, N.; Gastinger, S.; Rébillard, A. Chronic Fatigue in Cancer, Brain Connectivity and Reluctance to Engage in Physical Activity: A Mini-Review. Front. Oncol. 2021, 11, 774347. [Google Scholar] [CrossRef]
- Feng, Y.; Wang, Y.F.; Zheng, L.J.; Shi, Z.; Huang, W.; Zhang, L.J. Network-level functional connectivity alterations in chemotherapy treated breast cancer patients: A longitudinal resting state functional MRI study. Cancer Imaging 2020, 20, 73. [Google Scholar] [CrossRef]
- Hampson, J.P.; Zick, S.M.; Khabir, T.; Wright, B.D.; Harris, R.E. Altered resting brain connectivity in persistent cancer related fatigue. NeuroImage Clin. 2015, 8, 305–313. [Google Scholar] [CrossRef] [PubMed] [Green Version]
- Arya, N.; Vaish, A.; Zhao, K.; Rao, H. Neural Mechanisms Underlying Breast Cancer Related Fatigue: A Systematic Review of Neuroimaging Studies. Front. Neurosci. 2021, 15, 735945. [Google Scholar] [CrossRef] [PubMed]
- Mampay, M.; Flint, M.S.; Sheridan, G.K. Tumour brain: Pretreatment cognitive and affective disorders caused by peripheral cancers. J. Cereb. Blood Flow Metab. 2021, 178, 3977–3996. [Google Scholar] [CrossRef] [PubMed]
- Santos, J.C.; Pyter, L.M. Neuroimmunology of Behavioral Comorbidities Associated with Cancer and Cancer Treatments. Front. Immunol. 2018, 9, 1195. [Google Scholar] [CrossRef] [Green Version]
- Logue, S.F.; Gould, T.J. The neural and genetic basis of executive function: Attention, cognitive flexibility, and response inhibition. Pharmacol. Biochem. Behav. 2014, 123, 45–54. [Google Scholar] [CrossRef] [Green Version]
- Ott, T.; Nieder, A. Dopamine and Cognitive Control in Prefrontal Cortex. Trends Cogn. Sci. 2019, 23, 213–234. [Google Scholar] [CrossRef]
- Pizzi, M.; Borella, E.; Piras, F. Performance-Based Everyday Problem-Solving in Patients with TBI. Arch. Clin. Neuropsychol. 2021, 36, 1393–1403. [Google Scholar] [CrossRef]
- Cheng, A.S.K.; Wang, X.; Niu, N.; Liang, M.; Zeng, Y. Neuropsychological Interventions for Cancer-Related Cognitive Impairment: A Network Meta-Analysis of Randomized Controlled Trials. Neuropsychol. Rev. 2022, 1–13. [Google Scholar] [CrossRef]
- Stamenova, V.; Levine, B. Effectiveness of goal management training® in improving executive functions: A meta-analysis. Neuropsychol. Rehabil. 2019, 29, 1569–1599. [Google Scholar] [CrossRef]


| AFI Subscales/Items | Cognitive Processes | |||
|---|---|---|---|---|
| Working Memory | Selective Attention | Self-Control | Cognitive Flexibility | |
| Effective action subscale (purposeful actions: reasoning, planning, executing, problem-solving) | ||||
| Getting started on activities (tasks, jobs) you intend to do | ♦ | ♦ | ||
| Following through on your plans | ♦ | ♦ | ♦ | ♦ |
| Doing things that take time and effort | ♦ | ♦ | ♦ | ♦ |
| Making mind up about things | ♦ | ♦ | ||
| Keeping your mind on what you are doing | ♦ | ♦ | ♦ | |
| Remembering to do all the things you started out to do | ♦ | ♦ | ♦ | |
| Keeping your mind on what others are saying | ♦ | ♦ | ♦ | |
| Attentional lapses subscale (difficulties in inhibiting distraction, i.e., selective attention) | ||||
| How hard do you find it to concentrate on details | ♦ | |||
| How often do you make mistakes on what you are doing | ♦ | ♦ | ♦ | |
| How often do you forget to do important things | ♦ | ♦ | ||
| Interpersonal effectiveness (maintaining interpersonal relationships & responding to lack of inhibitory control) | ||||
| Keeping yourself from saying or doing things you did not want to say or do | ♦ | |||
| Being patient with others | ♦ | ♦ | ||
| How often do you get easily annoyed or irritated | ♦ | ♦ | ||
| LCGM | LL | AIC | BIC | Entropy | VLMR |
|---|---|---|---|---|---|
| Effective Action | |||||
| 1-class a | −5574.88 | 11,169.77 | 11,209.61 | n/a | n/a |
| 2-class | −5043.39 | 10,114.78 | 10,170.55 | 0.85 | 1062.99 ‡ |
| 3-class b | −4867.38 | 9770.76 | 9842.47 | 0.86 | 352.02 ‡ |
| 4-class | −4836.81 | 9717.61 | 9805.26 | 0.79 | ns |
| Attentional Lapses | |||||
| 1-class a | −5377.95 | 10,773.89 | 10,809.75 | n/a | n/a |
| 2-class | −5001.77 | 10,027.53 | 10,075.34 | 0.83 | 752.36 ‡ |
| 3-class | −4901.48 | 9832.95 | 9892.71 | 0.85 | 200.58 ‡ |
| 4-class c | −4857.80 | 9751.19 | 9822.91 | 0.80 | 87.76 *** |
| 5-class | −4846.08 | 9734.17 | 9817.83 | 0.82 | n/a |
| Interpersonal Effectiveness | |||||
| 1-class a | −5348.14 | 10,714.28 | 10,750.13 | n/a | n/a |
| 2-class d | −4854.08 | 9732.15 | 9779.96 | 0.88 | 988.13 ‡ |
| 3-class | −4740.19 | 9510.39 | 9570.15 | 0.82 | ns |
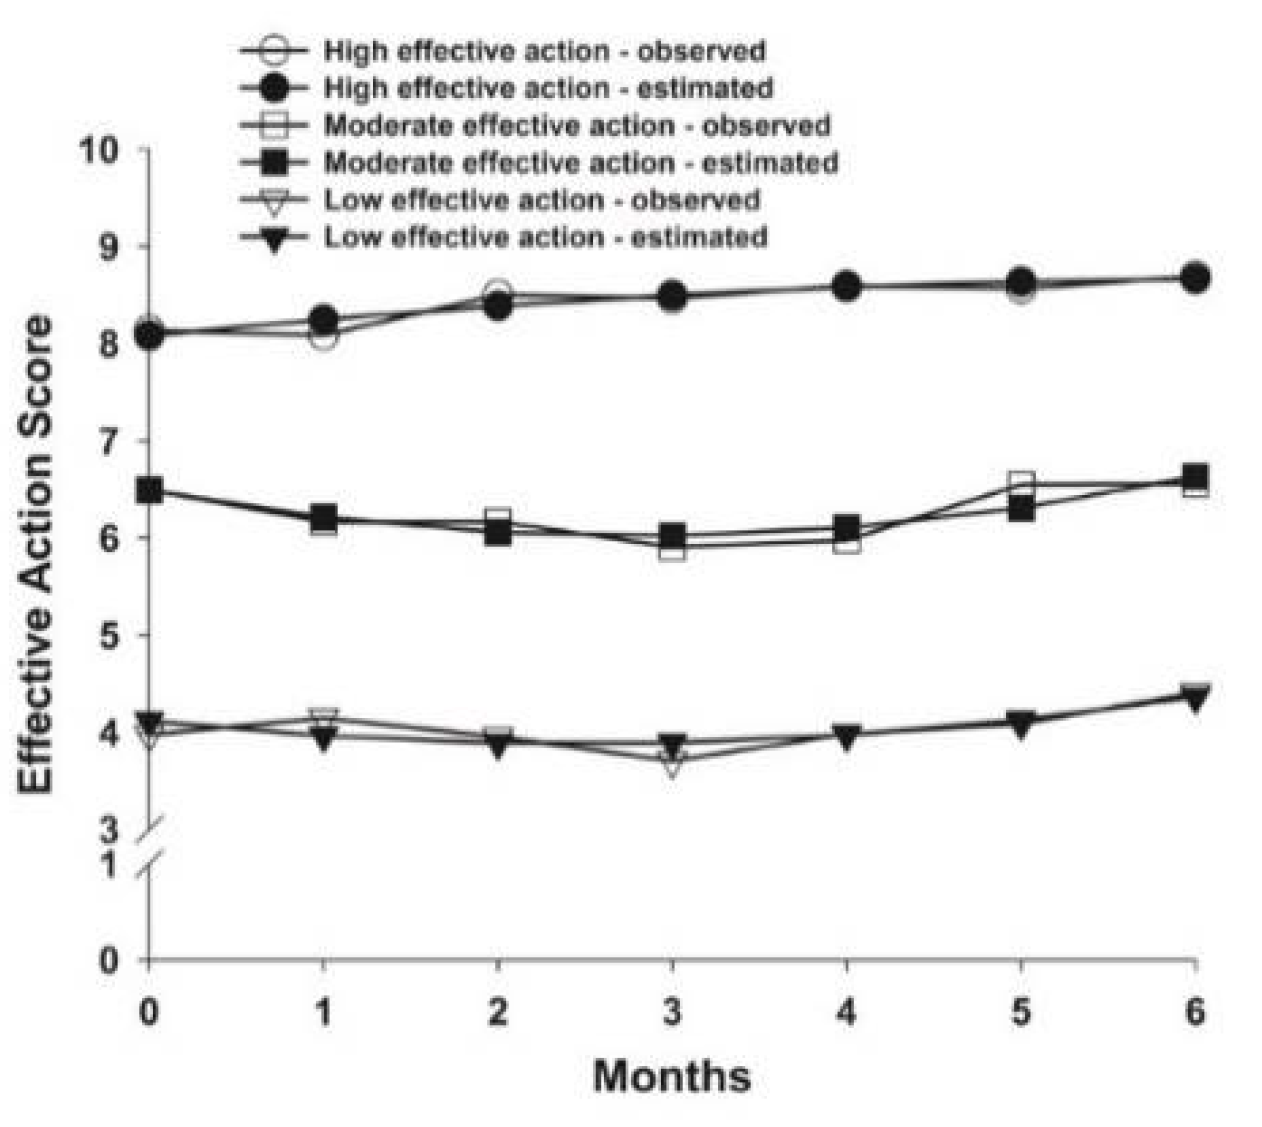
| Effective Action a | ||||
| Parameter Estimates b | High n = 142 (35.8%) | Moderate n = 160 (40.3%) | Low n = 95 (23.9%) | |
| Mean (SE) | Mean (SE) | (Mean SE) | ||
| Intercept | 8.08 (0.14) ‡ | 6.50 (0.16) ‡ | 4.12 (0.26) ‡ | |
| Linear slope | 0.02 (0.08) * | −0.34 (0.12) ** | −0.19 (0.15) | |
| Quadratic slope | −0.01 (0.01) | 0.06 (0.02) *** | 0.04 (0.03) | |
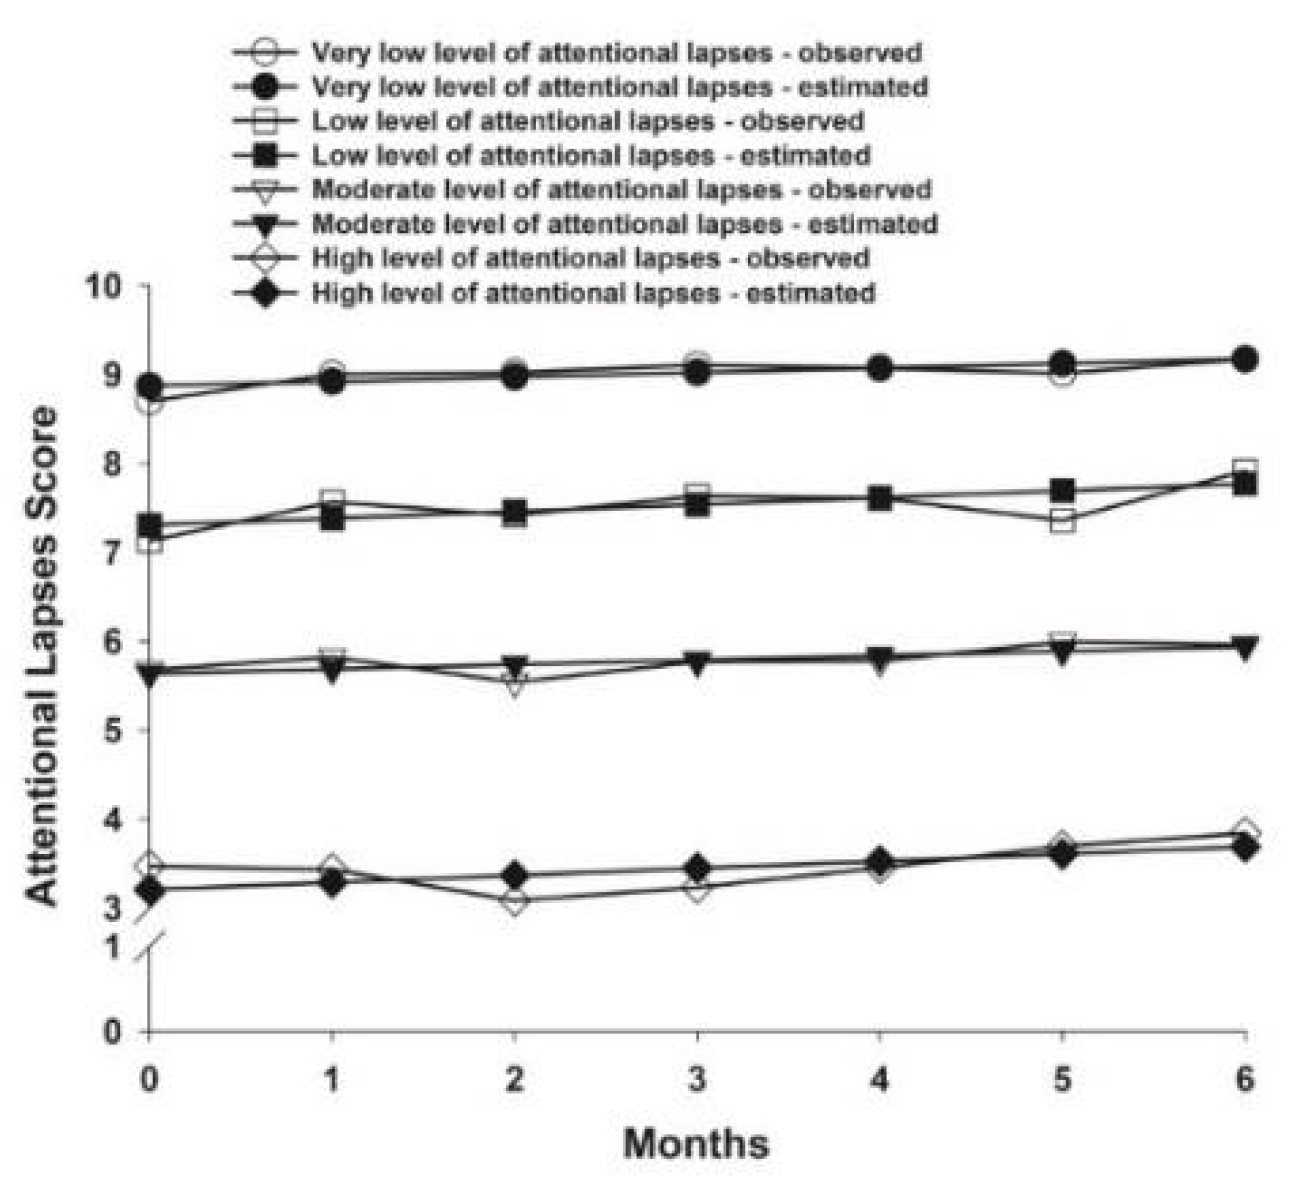
| Attentional Lapses a | ||||
| Parameter Estimates b | Very Low Level n = 70 (17.6%) | Low Level n = 155 (39.0%) | Moderate Level n = 150 (37.8%) | High Level n = 22 (5.5%) |
| Mean (SE) | Mean (SE) | Mean (SE) | Mean (SE) | |
| Intercept | 8.87 (0.14) *** | 7.31 (0.12) *** | 5.64 (0.14) *** | 3.21 (0.45) *** |
| Linear slope | 0.05 (0.02) * | 0.08 (0.03) * | 0.05 (0.04) | 0.08 (0.09) |
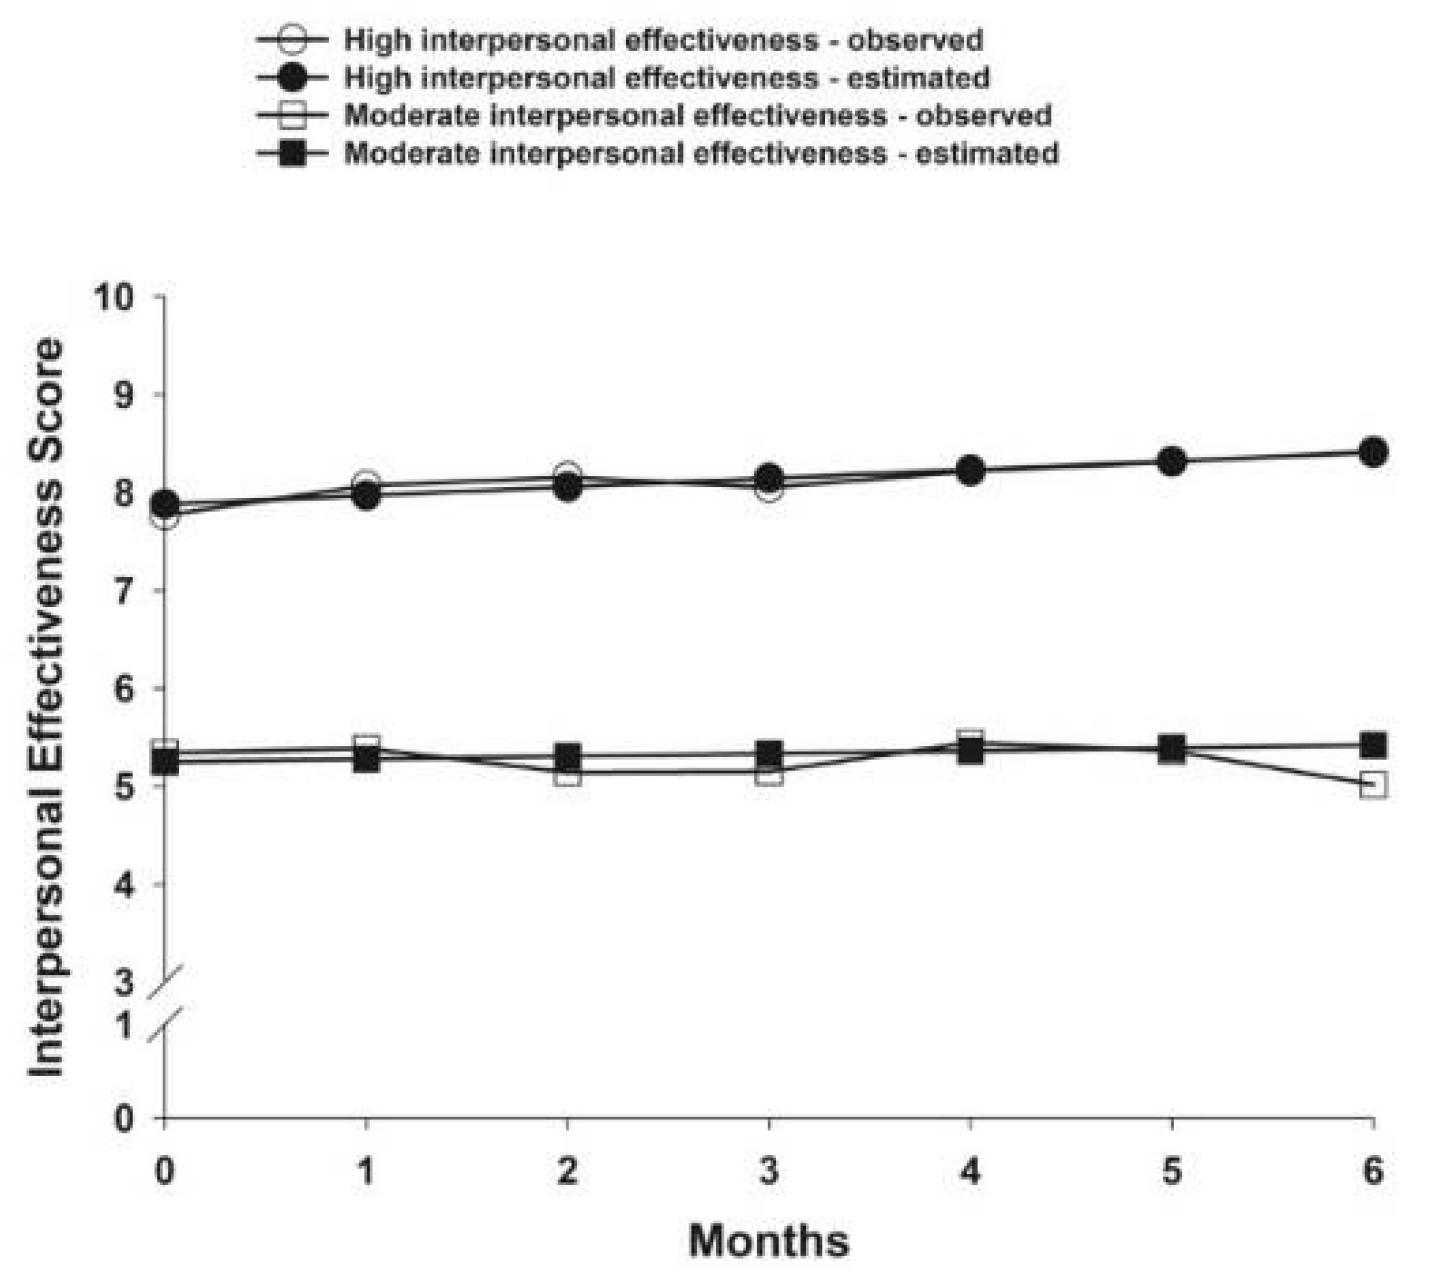
| Interpersonal Effectiveness a | ||||
| Parameter Estimates b | High n = 238 (59.9%) | Moderate n = 159 (40.1%) | ||
| Mean (SE) | Mean (SE) | |||
| Intercept | 7.88 (0.10) ‡ | 5.25 (0.17) ‡ | ||
| Linear slope | 0.09 (0.02) ‡ | 0.03 (0.03) | ||
| Characteristic | High Effective Action (0) n = 142 (35.8%) | Moderate Effective Action (1) n = 160 (40.3%) | Low Effective Action (2) n = 95 (23.9%) | Statistics |
|---|---|---|---|---|
| Mean (SD) | Mean (SD) | Mean (SD) | ||
| Demographic and Clinical Characteristics | ||||
| Age (years) | 57.2 (11.3) | 53.3 (11.2) | 54.5 (12.1) | F = 4.44, p = 0.012 0 > 1 |
| Education (years) | 15.7 (2.7) | 15.9 (2.8) | 15.5 (2.3) | F = 0.57, p = 0.566 |
| Self-Administered Comorbidity Questionnaire score | 3.8 (2.5) | 4.1 (2.4) | 5.4 (3.6) | F = 10.20, p < 0.001 0 and 1 < 2 |
| Body mass index (kilograms/meter squared) | 26.1 (5.8) | 27.1 (6.4) | 27.4 (6.4) | F = 1.74, p = 0.178 |
| Karnofsky Performance Status score | 96.2 (7.9) | 93.4 (9.6) | 88.6 (12.7) | F = 16.43, p < 0.001 0 and 1 > 2 |
| n (%) | n (%) | n (%) | ||
| Race/ethnicity | χ2 = 10.81, p = 0.094 | |||
| White | 97 (68.8) | 109 (68.6) | 49 (51.6) | |
| Black | 13 (9.2) | 12 (7.5) | 15 (15.8) | |
| Asian/Pacific Islander | 17 (12.1) | 19 (11.9) | 14 (14.7) | |
| Hispanic/mixed/other | 14 (9.9) | 19 (11.9) | 17 (17.9) | |
| Live alone (% yes) | 25 (18.0) | 41 (25.6) | 28 (30.1) | χ2 = 4.89, p = 0.087 |
| Married or partnered (% yes) | 52 (36.9) | 69 (43.1) | 44 (47.3) | χ2 = 2.68, p = 0.262 |
| Currently employed (% yes) | 72 (51.4) | 83 (51.9) | 34 (36.2) | χ2 = 6.89, p = 0.032 1 > 2 |
| Household income level | KW = 7.64, p = 0.022 0 > 2 | |||
| <$30,000 | 17 (14.9) | 25 (18.1) | 28 (36.4) | |
| $30,000–$99,999 | 51 (44.7) | 58 (42.0) | 25 (32.5) | |
| ≥$100,000 | 46 (40.4) | 55 (39.9) | 24 (31.2) | |
| Regular exercise (% yes) | 100 (70.4) | 114 (72.2) | 60 (63.8) | χ2 = 2.01, p = 0.366 |
| Occurrence of comorbid conditions | ||||
| Heart disease | 8 (5.6) | 2 (1.3) | 5 (5.3) | χ2 = 4.73, p = 0.094 |
| High blood pressure | 51 (35.9) | 40 (25.0) | 32 (33.7) | χ2 = 4.62, p = 0.099 |
| Lung disease | 4 (2.8) | 5 (3.1) | 3 (3.2) | χ2 = 0.03, p = 0.984 |
| Diabetes | 9 (6.3) | 9 (5.6) | 13 (13.7) | χ2 = 6.04, p = 0.049 No significant pairwise contrasts |
| Ulcer | 3 (2.1) | 6 (3.8) | 6 (6.3) | χ2 = 2.77, p = 0.251 |
| Kidney disease | 2 (1.4) | 0 (0.0) | 1 (1.1) | χ2 = 2.14, p = 0.344 |
| Liver disease | 4 (2.8) | 4 (2.5) | 2 (2.1) | χ2 = 0.12, p = 0.943 |
| Anemia | 10 (7.0) | 13 (8.1) | 8 (8.4) | χ2 = 0.19, p = 0.910 |
| Depression | 21 (14.8) | 35 (21.9) | 30 (31.6) | χ2 = 9.46, p = 0.009 0 < 2 |
| Osteoarthritis | 22 (15.5) | 24 (15.0) | 23 (24.2) | χ2 = 4.07, p = 0.131 |
| Back pain | 33 (23.2) | 43 (26.9) | 35 (36.8) | χ2 = 5.39, p = 0.068 |
| Rheumatoid arthritis | 2 (1.4) | 5 (3.1) | 7 (7.4) | χ2 = 6.07, p = 0.048 No significant pairwise contrasts |
| Postmenopausal (% yes) | 91 (65.5) | 98 (63.2) | 59 (64.1) | χ2 = 0.16, p = 0.923 |
| Stage of disease | KW = 11.07, p = 0.004 0 < 1 | |||
| Stage 0 | 34 (23.9) | 22 (13.8) | 17 (17.9) | |
| Stage I | 61 (43.0) | 57 (35.6) | 33 (34.7) | |
| Stage II | 39 (27.5) | 65 (40.6) | 37 (38.9) | |
| Stage III and IV | 8 (5.6) | 16 (10.0) | 8 (8.4) | |
| Receipt of neoadjuvant therapy (% yes) | 22 (15.6) | 34 (21.3) | 23 (24.2) | χ2 = 2.92, p = 0.233 |
| HRT prior to surgery (% yes) | 18 (12.7) | 35 (22.0) | 14 (14.9) | χ2 = 5.02, p = 0.081 |
| Type of surgery | χ2 = 0.11, p = 0.947 | |||
| Breast conservation | 114 (80.3) | 127 (79.4) | 77 (81.1) | |
| Mastectomy | 28 (19.7) | 33 (20.6) | 18 (18.9) | |
| Sentinel node biopsy (% yes) | 118 (83.1) | 136 (85.0) | 74 (77.9) | χ2 = 2.13, p = 0.345 |
| Axillary lymph node dissection (% yes) | 43 (30.5) | 65 (40.6) | 40 (42.1) | χ2 = 4.48, p = 0.106 |
| Receipt of adjuvant chemotherapy (% yes) a | 34 (23.9) | 67 (41.9) | 32 (33.7) | χ2 = 10.86, p = 0.004 0 < 1 |
| Receipt of radiation therapy (% yes) a | 81 (57.0) | 90 (56.3) | 53 (55.8) | χ2 = 0.04, p = 0.980 |
| Receipt of hormonal therapy (% yes) | 65 (45.8) | 72 (45.0) | 31 (32.6) | χ2 = 4.82, p = 0.090 |
| Estrogen receptor positive (% positive) | 116 (82.3) | 128 (80.0) | 63 (66.3) | χ2 = 9.24, p = 0.010 0 and 1 > 2 |
| Progesterone receptor positive (% positive) | 108 (76.6) | 115 (71.9) | 56 (58.9) | χ2 = 8.75, p = 0.013 0 > 2 |
| HER2/neu (% positive) | 16 (12.9) | 29 (20.1) | 14 (15.6) | χ2 = 2.61, p = 0.271 |
| Psychological Symptoms * | ||||
| Mean (SD) | Mean (SD) | Mean (SD) | ||
| Trait anxiety (≥31.8) | 31.4 (7.1) | 35.1 (8.0) | 41.7 (9.8) | F = 42.96, p < 0.001 0 < 1 < 2 |
| State anxiety (≥32.2) | 36.9 (12.8) | 41.4 (12.7) | 49.5 (12.0) | F = 27.60, p < 0.001 0 < 1 < 2 |
| Center for Epidemiological Studies- Depression (≥16.0) | 9.4 (7.5) | 13.1 (8.5) | 21.1 (9.9) | F = 51.95, p < 0.001 0 < 1 < 2 |
| Physical Symptoms * | ||||
| Mean (SD) | Mean (SD) | Mean (SD) | ||
| Lee Fatigue Scale-Fatigue (≥4.4) | 1.9 (1.9) | 3.3 (2.1) | 4.6 (2.4) | F = 46.70, p < 0.001 0 < 1 < 2 |
| Lee Energy Scale-Energy (≤4.8) | 6.1 (2.6) | 4.7 (2.0) | 3.5 (2.1) | F = 36.13, p < 0.001 0 > 1 > 2 |
| General Sleep Disturbance Scale (≥43.0) | 36.3 (18.4) | 50.3 (18.8) | 62.6 (19.5) | F = 55.51, p < 0.001 0 < 1 < 2 |
| Pain | n (%) | n (%) | n (%) | |
| Occurrence of pain in the affected breast prior to surgery (% yes) | 25 (18.1) | 57 (35.8) | 27 (29.3) | χ2 = 11.62, p = 0.003 0 < 1 |
| For patients with breast pain | Mean (SD) | Mean (SD) | Mean (SD) | |
| Pain right now | 1.2 (1.6) | 1.4 (1.5) | 2.5 (2.8) | F = 3.89, p = 0.024 1 < 2 |
| Current average daily pain | 1.8 (1.5) | 1.7 (1.5) | 3.5 (2.7) | F = 8.34, p < 0.001 0 and 1 < 2 |
| Worst pain | 3.1 (1.9) | 2.9 (1.9) | 5.1 (2.7) | F = 9.07, p < 0.001 0 and 1 < 2 |
| Number of days per week in pain | 2.1 (2.4) | 2.4 (2.7) | 4.3 (2.5) | F = 6.03, p = 0.003 0 and 1 < 2 |
| Breast Pain Interference | 0.9 (2.0) | 1.2 (1.7) | 3.1 (2.4) | F = 10.20, p < 0.001 0 and 1 < 2 |
| Characteristic | Very Low Level of Attentional Lapses (0) n = 70 (17.6%) | Low Level of Attentional Lapses (1) n = 155 (39.0%) | Moderate Level of Attentional Lapses (2) n = 150 (37.8%) | High Level of Attentional Lapses (3) n = 22 (5.5%) | Statistics |
|---|---|---|---|---|---|
| Demographic and Clinical Characteristics | |||||
| Mean (SD) | Mean (SD) | Mean (SD) | Mean (SD) | ||
| Age (years) | 60.5 (10.9) | 54.6 (10.7) | 53.8 (12.1) | 48.0 (10.0) | F = 9.14, p < 0.001 0 > 2 and 3 |
| Education (years) | 15.5 (2.6) | 15.9 (2.7) | 15.5 (2.7) | 16.5 (2.1) | F = 1.26, p = 0.288 |
| Self-Administered Comorbidity Questionnaire score | 3.8 (2.6) | 4.0 (2.5) | 4.6 (2.9) | 5.6 (4.0) | F = 3.78, p = 0.011 0 < 3 |
| Body mass index (kilograms/meter squared) | 26.0 (4.8) | 26.7 (6.7) | 27.2 (6.1) | 27.2 (6.9) | F = 0.70, p = 0.552 |
| Karnofsky Performance Status score | 97.7 (5.5) | 94.9 (8.8) | 91.0 (10.7) | 83.6 (17.1) | F = 16.04, p < 0.001 0 and 1 > 2 > 3 |
| n (%) | n (%) | n (%) | n (%) | ||
| Race/ethnicity | χ2 = 14.30, p = 0.112 | ||||
| White | 53 (75.7) | 101 (66.0) | 84 (56.0) | 17 (77.3) | |
| Black | 7 (10.0) | 11 (7.2) | 21 (14.0) | 1 (4.5) | |
| Asian/Pacific Islander | 4 (5.7) | 22 (14.4) | 23 (15.3) | 1 (4.5) | |
| Hispanic/mixed/other | 6 (8.6) | 19 (12.4) | 22 (14.7) | 3 (13.6) | |
| Live alone (% yes) | 19 (28.4) | 32 (20.8) | 34 (22.8) | 9 (40.9) | χ2 = 5.14, p = 0.162 |
| Married or partnered (% yes) | 28 (40.6) | 61 (39.6) | 64 (43.0) | 12 (54.5) | χ2 = 1.89, p = 0.595 |
| Currently employed (% yes) | 35 (50.0) | 78 (51.0) | 67 (45.0) | 9 (40.9) | χ2 = 1.65, p = 0.648 |
| Household income level | KW = 4.57, p = 0.206 | ||||
| <$30,000 | 6 (10.9) | 24 (18.2) | 33 (26.4) | 7 (41.2) | |
| $30,000–$99,999 | 26 (47.3) | 56 (42.4) | 48 (38.4) | 4 (23.5) | |
| ≥$100,000 | 23 (41.8) | 52 (39.4) | 44 (35.2) | 6 (35.3) | |
| Regular exercise (% yes) | 49 (70.0) | 110 (71.4) | 103 (69.6) | 12 (54.5) | χ2 = 2.60, p = 0.457 |
| Occurrence of comorbid conditions | |||||
| Heart disease | 4 (5.7) | 6 (3.9) | 4 (2.7) | 1 (4.5) | χ2 = 1.27, p = 0.736 |
| High blood pressure | 30 (42.9) | 44 (28.4) | 46 (30.7) | 3 (13.6) | χ2 = 8.21, p = 0.042 No significant pairwise contrasts |
| Lung disease | 2 (2.9) | 4 (2.6) | 4 (2.7) | 2 (9.1) | χ2 = 2.94, p = 0.401 |
| Diabetes | 1 (1.4) | 14 (9.0) | 15 (10.0) | 1 (4.5) | χ2 = 5.61, p = 0.132 |
| Ulcer | 2 (2.9) | 4 (2.6) | 7 (4.7) | 2 (9.1) | χ2 = 2.81, p = 0.422 |
| Kidney disease | 2 (2.9) | 1 (0.6) | 0 (0.0) | 0 (0.0) | χ2 = 5.46, p = 0.141 |
| Liver disease | 0 (0.0) | 4 (2.6) | 4 (2.7) | 2 (9.1) | χ2 = 5.69, p = 0.127 |
| Anemia | 4 (5.7) | 10 (6.5) | 13 (8.7) | 4 (18.2) | χ2 = 4.27, p = 0.234 |
| Depression | 9 (12.9) | 33 (21.3) | 37 (24.7) | 7 (31.8) | χ2 = 5.35, p = 0.148 |
| Osteoarthritis | 13 (18.6) | 23 (14.8) | 28 (18.7) | 5 (22.7) | χ2 = 1.38, p = 0.711 |
| Back pain | 15 (21.4) | 43 (27.7) | 43 (28.7) | 10 (45.5) | χ2 = 4.87, p = 0.182 |
| Rheumatoid arthritis | 1 (1.4) | 5 (3.2) | 5 (3.3) | 3 (13.6) | χ2 = 7.57, p = 0.056 |
| Postmenopausal (% yes) | 50 (73.5) | 91 (60.7) | 93 (63.7) | 14 (63.6) | χ2 = 3.41, p = 0.333 |
| Stage of disease | KW = 12.95, p = 0.005 0 < 2 | ||||
| Stage 0 | 18 (25.7) | 29 (18.7) | 22 (14.7) | 4 (18.2) | |
| Stage I | 34 (48.6) | 59 (38.1) | 51 (34.0) | 7 (31.8) | |
| Stage II | 15 (21.4) | 57 (36.8) | 60 (40.0) | 9 (40.9) | |
| Stage III and IV | 3 (4.3) | 10 (6.5) | 17 (11.3) | 2 (9.1) | |
| Receipt of neoadjuvant therapy (% yes) | 7 (10.0) | 27 (17.5) | 40 (26.7) | 5 (22.7) | χ2 = 9.25, p = 0.026 0 < 2 |
| HRT prior to surgery (% yes) | 10 (14.3) | 26 (16.9) | 24 (16.0) | 7 (33.3) | χ2 = 4.45, p = 0.217 |
| Type of surgery | χ2 = 2.53, p = 0.470 | ||||
| Breast conservation | 60 (85.7) | 122 (78.7) | 117 (78.0) | 19 (86.4) | |
| Mastectomy | 10 (14.3) | 33 (21.3) | 33 (22.0) | 3 (13.6) | |
| Sentinel node biopsy (% yes) | 61 (87.1) | 130 (83.9) | 121 (80.7) | 16 (72.7) | χ2 = 3.06, p = 0.382 |
| Axillary lymph node dissection (% yes) | 18 (25.7) | 58 (37.7) | 61 (40.7) | 11 (50.0) | χ2 = 6.27, p = 0.099 |
| Receipt of adjuvant chemotherapy (% yes) a | 13 (18.6) | 56 (36.1) | 52 (34.7) | 12 (54.5) | χ2 = 11.95, p = 0.008 0 < 1 and 3 |
| Receipt of radiation therapy (% yes) a | 44 (62.9) | 80 (51.6) | 86 (57.3) | 14 (63.6) | χ2 = 3.15, p = 0.369 |
| Receipt of hormonal therapy (% yes) | 34 (48.6) | 68 (43.9) | 59 (39.3) | 7 (31.8) | χ2 = 2.82, p = 0.421 |
| Estrogen receptor positive (% positive) | 59 (84.3) | 130 (84.4) | 107 (71.3) | 11 (50.0) | χ2 = 18.90, p < 0.001 0 > 3; 1 > 2 and 3 |
| Progesterone receptor positive (% positive) | 55 (78.6) | 115 (74.7) | 98 (65.3) | 11 (50.0) | χ2 = 9.85, p = 0.020 No significant pairwise contrasts |
| HER2/neu (% positive) | 5 (8.6) | 28 (20.0) | 20 (14.3) | 6 (30.0) | χ2 = 7.01, p = 0.072 |
| Psychological Symptoms * | |||||
| Mean (SD) | Mean (SD) | Mean (SD) | Mean (SD) | ||
| Trait anxiety (≥31.8) | 30.8 (8.0) | 33.7 (7.7) | 38.3 (9.0) | 40.9 (11.4) | F = 16.91, p < 0.001 0 and 1 < 2 and 3 |
| State anxiety (≥32.2) | 35.9 (13.9) | 39.8 (12.5) | 45.3 (12.7) | 49.3 (12.9) | F = 11.94, p < 0.001 0 and 1 < 2 and 3 |
| Center for Epidemiological Studies- Depression (≥16.0) | 8.4 (8.0) | 11.4 (7.7) | 17.0 (9.6) | 23.1 (11.5) | F = 26.85, p < 0.001 0 and 1 < 2 < 3 |
| Physical Symptoms * | |||||
| Mean (SD) | Mean (SD) | Mean (SD) | Mean (SD) | ||
| Lee Fatigue Scale-Fatigue (≥4.4) | 1.6 (1.8) | 2.5 (2.0) | 4.0 (2.1) | 6.3 (2.3) | F = 44.17, p < 0.001 0 < 1 < 2 < 3 |
| Lee Energy Scale-Energy (≤4.8) | 6.1 (3.0) | 5.2 (2.3) | 4.4 (2.0) | 2.8 (2.1) | F = 14.46, p < 0.001 0 and 1 > 2 > 3 |
| General Sleep Disturbance Scale (≥43.0) | 34.5 (18.5) | 44.3 (19.1) | 55.3 (19.9) | 68.9 (20.5) | F = 28.34, p < 0.001 0 < 1 < 2 < 3 |
| Pain | n (%) | n (%) | n (%) | n (%) | |
| Occurrence of pain in the affected breast prior to surgery (% yes) | 12 (17.9) | 44 (28.9) | 50 (33.8) | 3 (13.6) | χ2 = 8.15, p = 0.043 No significant pairwise contrasts |
| For patients with breast pain | Mean (SD) | Mean (SD) | Mean (SD) | Mean (SD) | |
| Pain right now | 1.8 (3.0) | 1.1 (1.3) | 2.0 (2.1) | 0.7 (1.2) | F = 1.92, p = 0.132 |
| Current average daily pain | 2.8 (2.7) | 1.4 (1.3) | 2.7 (2.2) | 1.7 (1.2) | F = 3.79, p = 0.013 1 < 2 |
| Worst pain | 3.5 (2.5) | 2.6 (1.5) | 4.3 (2.6) | 3.7 (1.5) | F = 4.53, p = 0.005 1 < 2 |
| Number of days per week in pain | 1.6 (2.8) | 2.3 (2.7) | 3.6 (2.6) | 2.0 (1.0) | F = 2.78, p = 0.045 No significant pairwise contrasts |
| Breast Pain Interference | 0.5 (1.0) | 0.9 (1.5) | 1.9 (2.1) | 2.4 (1.4) | F = 3.94, p = 0.010 1 < 2 |
| Characteristic | High Interpersonal Effectiveness (0) n = 238 (59.9%) | Low Interpersonal Effectiveness (1) n = 159 (40.1%) | Statistics |
|---|---|---|---|
| Demographic and Clinical Characteristics | |||
| Mean (SD) | Mean (SD) | ||
| Age (years) | 56.5 (10.9) | 52.7 (12.2) | t = 3.27, p = 0.001 0 > 1 |
| Education (years) | 15.8 (2.6) | 15.6 (2.7) | t = 0.53, p = 0.596 |
| Self-Administered Comorbidity Questionnaire score | 4.1 (2.7) | 4.6 (3.0) | t=−1.73, p = 0.085 |
| Body mass index (kilograms/meter squared) | 26.1 (5.3) | 27.9 (7.1) | t = −2.72, p = 0.007 0 < 1 |
| Karnofsky Performance Status score | 94.3 (9.6) | 91.7 (11.2) | t = 2.48, p = 0.014 0 > 1 |
| n (%) | n (%) | ||
| Race/ethnicity | (2 = 18.20, p < 0.001 | ||
| White | 172 (72.9) | 83 (52.2) | 0 > 1 |
| Black | 19 (8.1) | 21 (13.2) | NS |
| Asian/Pacific Islander | 21 (8.9) | 29 (18.2) | 0 < 1 |
| Hispanic/mixed/other | 24 (10.2) | 26 (16.4) | NS |
| Live alone (% yes) | 57 (24.4) | 37 (23.4) | FE, p = 0.904 |
| Married or partnered (% yes) | 95 (40.3) | 70 (44.3) | FE, p = 0.466 |
| Currently employed (% yes) | 119 (50.4) | 70 (44.3) | FE, p = 0.258 |
| Household income level | U, p = 0.003 | ||
| <$30,000 | 33 (16.6) | 37 (28.5) | |
| $30,000–$99,999 | 80 (40.2) | 54 (41.5) | |
| ≥$100,000 | 86 (43.2) | 39 (30.0) | |
| Regular exercise (% yes) | 174 (73.4) | 100 (63.7) | FE, p = 0.045 0 > 1 |
| Occurrence of comorbid conditions | |||
| Heart disease | 10 (4.2) | 5 (3.1) | FE, p = 0.789 |
| High blood pressure | 75 (31.5) | 48 (30.2) | FE, p = 0.825 |
| Lung disease | 7 (2.9) | 5 (3.1) | FE, p = 1.000 |
| Diabetes | 18 (7.6) | 13 (8.2) | FE, p = 0.850 |
| Ulcer | 7 (2.9) | 8 (5.0) | FE, p = 0.296 |
| Kidney disease | 2 (0.8) | 1 (0.6) | FE, p = 1.000 |
| Liver disease | 7 (2.9) | 3 (1.9) | FE, p = 0.746 |
| Anemia | 18 (7.6) | 13 (8.2) | FE, p = 0.850 |
| Depression | 44 (18.5) | 42 (26.4) | FE, p = 0.063 |
| Osteoarthritis | 41 (17.2) | 28 (17.6) | FE, p =1.000 |
| Back pain | 62 (26.1) | 49 (30.8) | FE, p = 0.307 |
| Rheumatoid arthritis | 6 (2.5) | 8 (5.0) | FE, p = 0.266 |
| Postmenopausal (% yes) | 164 (70.4) | 84 (54.9) | FE, p = 0.002 0 > 1 |
| Stage of disease | U, p = 0.227 | ||
| Stage 0 | 45 (18.9) | 28 (17.6) | |
| Stage I | 97 (40.8) | 54 (34.0) | |
| Stage II | 77 (32.4) | 64 (40.3) | |
| Stage III and IV | 19 (8.0) | 13 (8.2) | |
| Receipt of neoadjuvant therapy (% yes) | 42 (17.7) | 37 (23.3) | FE, p = 0.200 |
| HRT prior to surgery (% yes) | 41 (17.3) | 26 (16.5) | FE, p = 0.892 |
| Type of surgery | FE, p = 0.608 | ||
| Breast conservation | 193 (81.1) | 125 (78.6) | |
| Mastectomy | 45 (18.9) | 34 (21.4) | |
| Sentinel node biopsy (% yes) | 206 (86.6) | 122 (76.7) | FE, p = 0.015 0 > 1 |
| Axillary lymph node dissection (% yes) | 79 (33.3) | 69 (43.4) | FE, p = 0.045 0 < 1 |
| Receipt of adjuvant chemotherapy (% yes) a | 72 (30.3) | 61 (38.4) | FE, p = 0.104 |
| Receipt of radiation therapy (% yes) a | 137 (57.6) | 87 (54.7) | FE, p = 0.606 |
| Receipt of hormonal therapy (% yes) | 107 (45.0) | 61 (38.4) | FE, p = 0.214 |
| Estrogen receptor positive (% positive) | 188 (79.3) | 119 (74.8) | FE, p = 0.326 |
| Progesterone receptor positive (% positive) | 172 (72.6) | 107 (67.3) | FE, p = 0.264 |
| HER2/neu (% positive) | 35 (16.5) | 24 (16.4) | FE, p = 1.000 |
| Psychological Symptoms * | |||
| Mean (SD) | Mean (SD) | ||
| Trait anxiety (≥31.8) | 32.8 (8.1) | 39.1 (9.0) | t = 7.01, p < 0.001 0 < 1 |
| State anxiety (≥32.2) | 38.9 (13.0) | 45.8 (13.1) | t = −5.05, p < 0.001 0 < 1 |
| Center for Epidemiological Studies—Depression (≥16.0) | 11.1 (8.7) | 17.4 (9.6) | t = −6.59, p < 0.001 0 < 1 |
| Physical Symptoms * | |||
| Mean (SD) | Mean (SD) | ||
| Lee Fatigue Scale-Fatigue (≥4.4) | 2.6 (2.2) | 3.9 (2.4) | t = −5.68, p < 0.001 0 < 1 |
| Lee Energy Scale-Energy (≤4.8) | 5.3 (2.6) | 4.4 (2.1) | t = 3.84, p < 0.001 0 > 1 |
| General Sleep Disturbance Scale (≥43.0) | 42.6 (20.3) | 56.4 (20.4) | t = −6.48, p < 0.001 0 < 1 |
| Pain | n (%) | n (%) | |
| Occurrence of pain in the affected breast prior to surgery (% yes) | 62 (26.6) | 47 (30.1) | FE, p = 0.490 |
| For patients with breast pain | Mean (SD) | Mean (SD) | |
| Pain right now | 1.3 (1.9) | 1.9 (2.0) | t = −1.52, p = 0.131 |
| Current average daily pain | 1.9 (1.9) | 2.5 (2.1) | t = −1.62, p = 0.109 |
| Worst pain | 3.1 (1.9) | 4.1 (2.6) | t = −2.17, p = 0.033 0 < 1 |
| Number of days per week in pain | 2.4 (2.7) | 3.4 (2.7) | t = −1.83, p = 0.070 |
| Breast Pain Interference | 1.2 (1.8) | 2.2 (2.4) | t = −2.44, p = 0.017 0 < 1 |
| Characteristic a | Effective Action | Attentional Lapses | Interpersonal Effectiveness | |||
|---|---|---|---|---|---|---|
| Moderate Effective Action | Low Effective Action | Low Level of Attentional Lapses | Moderate Level of Attentional Lapses | High level of Attentional Lapses | Low Interpersonal Effectiveness | |
| Demographic characteristics | ||||||
| Younger age | ♦ | ♦ | ♦ | ♦ | ||
| Less likely to be white | ♦ | |||||
| More likely to be Asian/Pacific Islander | ♦ | |||||
| More likely to have a lower annual income | ♦ | ♦ | ||||
| Less likely to exercise on a regular basis | ♦ | |||||
| Clinical characteristics | ||||||
| Higher body mass index | ♦ | |||||
| Higher comorbidity burden | ♦ | ♦ | ||||
| Lower functional status | ♦ | ♦ | ♦ | ♦ | ||
| More likely to self-report depression | ♦ | |||||
| More likely to be diagnosed with higher stage disease | ♦ | ♦ | ||||
| Less likely to undergone menopause | ♦ | |||||
| Less likely to have had sentinel node biopsy | ♦ | |||||
| More likely to have had axillary lymph node dissection | ♦ | |||||
| More likely to have received neoadjuvant therapy | ♦ | |||||
| More likely to have received adjuvant chemotherapy in the 6 months after surgery | ♦ | ♦ | ♦ | |||
| Less likely to be positive in estrogen receptor | ♦ | ♦ | ||||
| Less likely to be positive in progesterone receptor | ♦ | |||||
| Psychological symptoms | ||||||
| Higher trait anxiety | ♦ | ♦ | ♦ | ♦ | ♦ | |
| Higher state anxiety | ♦ | ♦ | ♦ | ♦ | ♦ | |
| Higher depression symptoms | ♦ | ♦ | ♦ | ♦ | ♦ | |
| Physical symptoms | ||||||
| Higher fatigue | ♦ | ♦ | ♦ | ♦ | ♦ | ♦ |
| Lower energy | ♦ | ♦ | ♦ | ♦ | ♦ | |
| Higher sleep disturbance | ♦ | ♦ | ♦ | ♦ | ♦ | ♦ |
| More likely to have pain in the affected breast prior to surgery | ♦ | |||||
| Higher average daily pain | ♦ | |||||
| Higher worst pain intensity | ♦ | ♦ | ||||
| Higher number of days per week in pain | ♦ | |||||
| Higher pain interference | ♦ | ♦ | ||||
Publisher’s Note: MDPI stays neutral with regard to jurisdictional claims in published maps and institutional affiliations. |
© 2022 by the authors. Licensee MDPI, Basel, Switzerland. This article is an open access article distributed under the terms and conditions of the Creative Commons Attribution (CC BY) license (https://creativecommons.org/licenses/by/4.0/).
Share and Cite
Allemann-Su, Y.-Y.; Vetter, M.; Koechlin, H.; Paul, S.M.; Cooper, B.A.; Oppegaard, K.; Melisko, M.; Levine, J.D.; Conley, Y.; Miaskowski, C.; et al. Pre-Surgery Demographic, Clinical, and Symptom Characteristics Associated with Different Self-Reported Cognitive Processes in Patients with Breast Cancer. Cancers 2022, 14, 3281. https://doi.org/10.3390/cancers14133281
Allemann-Su Y-Y, Vetter M, Koechlin H, Paul SM, Cooper BA, Oppegaard K, Melisko M, Levine JD, Conley Y, Miaskowski C, et al. Pre-Surgery Demographic, Clinical, and Symptom Characteristics Associated with Different Self-Reported Cognitive Processes in Patients with Breast Cancer. Cancers. 2022; 14(13):3281. https://doi.org/10.3390/cancers14133281
Chicago/Turabian StyleAllemann-Su, Yu-Yin, Marcus Vetter, Helen Koechlin, Steven M. Paul, Bruce A. Cooper, Kate Oppegaard, Michelle Melisko, Jon D. Levine, Yvette Conley, Christine Miaskowski, and et al. 2022. "Pre-Surgery Demographic, Clinical, and Symptom Characteristics Associated with Different Self-Reported Cognitive Processes in Patients with Breast Cancer" Cancers 14, no. 13: 3281. https://doi.org/10.3390/cancers14133281
APA StyleAllemann-Su, Y.-Y., Vetter, M., Koechlin, H., Paul, S. M., Cooper, B. A., Oppegaard, K., Melisko, M., Levine, J. D., Conley, Y., Miaskowski, C., & Katapodi, M. C. (2022). Pre-Surgery Demographic, Clinical, and Symptom Characteristics Associated with Different Self-Reported Cognitive Processes in Patients with Breast Cancer. Cancers, 14(13), 3281. https://doi.org/10.3390/cancers14133281