
Direct Costs of Care for Adults with Soft Tissue Sarcomas: A Population-Based Study

 , , , ,
  ,
,  ,
, 
Abstract
:Simple Summary
Abstract
1. Introduction
2. Materials and Methods
2.1. Context
2.2. Patients’ Data
2.3. Cost Analysis
- The Outpatient database, which contains information on all medical procedures (specialist visits, laboratory and radiological tests, radiotherapy and chemotherapy sessions, etc.) delivered at outpatient facilities under NHS funding, valued at the rate stated in the Tariff Nomenclature for outpatient services (TNOS), a detailed formulary of medical procedures for outpatients [15];
- The Hospital Admissions database, which includes the diagnosis-related group (DRG) for each admission, valued at the rate indicated in the Tariff Nomenclature for inpatient services (TNIP), a formulary covering all hospital activities, including day hospital admissions [16];
- The regional databases of outpatient drug prescriptions and in-hospital drug consumption, which records the costs of all medical therapies (including their dosage);
- The Emergency Department Admissions database, which records the cost of each admission, as the sum of all medical procedures undertaken;
- The Medical Devices database, which lists the costs of all medical devices reimbursed by NHS: tailored devices, disposable devices and medical aids for rare diseases [17];
- The Hospice database, which recorded the admission length of stay.
2.4. Ethics
3. Results
4. Discussion
4.1. Costs of Care by Primary Site of STS
4.2. Costs of Care by STS Lineage
4.3. Costs of Care by Stage of Disease
5. Conclusions
Author Contributions
Funding
Institutional Review Board Statement
Informed Consent Statement
Data Availability Statement
Conflicts of Interest
References
- Fletcher, C.D.M.; Bridge, J.A.; Hogendoorn, P.C.W.; Mertens, F. World Health Organization Classification of Tumours of Soft Tissue and Bone, 4th ed.; IARC Press: Lyon, France, 2013. [Google Scholar]
- WHO Classification of Tumours Editorial Board. Soft Tissue and Bone Tumours, 5th ed.; WHO Classification of Tumours Series; International Agency for Research on Cancer: Lyon, France, 2020. [Google Scholar]
- Gamboa, A.C.; Gronchi, A.; Cardona, K. Soft-tissue sarcoma in adults: An update on the current state of histiotype-specific management in an era of personalized medicine. CA Cancer J. Clin. 2020, 70, 200–229. [Google Scholar] [CrossRef] [PubMed] [Green Version]
- Siegel, R.L.; Miller, K.D.; Jemal, A. Cancer statistics, 2020. CA Cancer J. Clin. 2020, 70, 7–30. [Google Scholar] [CrossRef] [PubMed]
- American Cancer Society. Survival Rates for Soft Tissue Sarcoma. Available online: https://www.cancer.org/cancer/soft-tissue-sarcoma/detection-diagnosis-staging/survival-rates.html (accessed on 23 March 2022).
- Fang, C.Y.; Frosch, Z.A. Understanding and Addressing Cancer Care Costs in the United States. JAMA Netw. Open 2021, 4, e2127964. [Google Scholar] [CrossRef] [PubMed]
- Gronchi, A.; Miah, A.B.; Dei Tos, A.; Abecassis, N.; Bajpai, J.; Bauer, S.; Biagini, R.; Bielack, S.; Blay, J.Y.; Bolle, S.; et al. Soft tissue and visceral sarcomas: ESMO–EURACAN–GENTURIS Clinical Practice Guidelines for diagnosis, treatment and follow-up. Ann. Oncol. 2021, 32, 1348–1365. [Google Scholar] [CrossRef] [PubMed]
- Sbaraglia, M.; Bellan, E.; Tos, A.P.D. The 2020 WHO Classification of Soft Tissue Tumours: News and perspectives. Pathologica 2021, 113, 70–84. [Google Scholar] [CrossRef] [PubMed]
- Von Mehren, M.; Kane, J.M.; Bui, M.M.; Choy, E.; Connelly, M.; Dry, S.; Ganjoo, K.N.; George, S.; Gonzalez, R.J.; Heslin, M.J.; et al. NCCN Guidelines Insights: Soft Tissue Sarcoma, Version 1.2021. J. Natl. Compr. Cancer Netw. 2020, 18, 1604–1612. [Google Scholar] [CrossRef] [PubMed]
- Mytelka, D.S.; Nagar, S.P.; D’Yachkova, Y.; La, E.; Kaye, J.A.; Candrilli, S.D.; Kasper, B.; Lopez-Martin, J.A.; Lorenzo, M. Health Care Resource Utilization and Costs among Adult Patients with Advanced Soft Tissue Sarcoma: A Retrospective Medical Record Review in the United Kingdom, Spain, Germany, and France. Sarcoma 2018, 2018, 1–13. [Google Scholar] [CrossRef] [PubMed] [Green Version]
- Perrier, L.; Buja, A.; Mastrangelo, G.; Vecchiato, A.; Sandonà, P.; Ducimetière, F.; Blay, J.Y.; Gilly, F.N.; Siani, C.; Biron, P.; et al. Clinicians’ adherence versus non adherence to practice guidelines in the management of patients with sarcoma: A cost-effectiveness assessment in two European regions. BMC Health Serv. Res. 2012, 12, 82. [Google Scholar] [CrossRef] [PubMed]
- Alanie, O.M.; Mahendra, A.; Mackinnon, M.; McCleery, M.; Nicholas, C.; Gupta, S. A virtual multi-disciplinary meeting is a cost-effective method of triaging referrals to a regional musculoskeletal oncology service. Scott. Med. J. 2021, 66, 142–147. [Google Scholar] [CrossRef] [PubMed]
- Portale Sanità Regione del Veneto—PDTA Sarcoma. Available online: https://salute.regione.veneto.it/web/rov/pdta-sarcoma (accessed on 23 March 2022).
- Amin, M.B.; Edge, S.B.; Greene, F.L.; Byrd, D.R.; Brookland, R.K.; Washington, M.K. AJCC Cancer Staging Manual; Springer: Berlin, Germany, 2017. [Google Scholar]
- Regione del Veneto. Nomenclatore Tariffario Delle Prestazioni di Assistenza Specialistica Ambulatoriale. Available online: https://www.regione.veneto.it/web/sanita/assistenza-ambulatoriale (accessed on 23 March 2022).
- Regione del Veneto. Tariffario DRG Regione del Veneto. Available online: https://salute.regione.veneto.it/c/document_library/get_file?p_l_id=1026082&folderId=1026048&name=DLFE-32750.pdf (accessed on 23 March 2022).
- Prime Ministerial Decree of 2017 January 12; Attachments 2, 3 and 5. Available online: https://www.salute.gov.it/portale/lea/dettaglioContenutiLea.jsp?lingua=italiano&id=4773&area=Lea&menu=vuoto (accessed on 21 April 2022).
- Hofmarcher, T.; Lindgren, P.; Wilking, N.; Jönsson, B. The cost of cancer in Europe 2018. Eur. J. Cancer 2020, 129, 41–49. [Google Scholar] [CrossRef] [PubMed] [Green Version]
- Willburger, J.C.F.; von Strauss, M.; Peterson, C.J.; Glass, T.R.; Kettelhack, C. Incidence, Treatment and Outcome of Patients with Retroperitoneal Soft-Tissue Sarcoma in Switzerland 2005–2015: A Population-Based Analysis. World J. Surg. 2022, 46, 461–468. [Google Scholar] [CrossRef] [PubMed]
- Mastrangelo, G.; Coindre, J.-M.; Ducimetière, F.; Dei Tos, A.P.; Fadda, E.; Blay, J.-Y.; Buja, A.; Fedeli, U.; Cegolon, L.; Frasson, A.; et al. Incidence of soft tissue sarcoma and beyond. Cancer 2012, 118, 5339–5348. [Google Scholar] [CrossRef] [PubMed]
- Wibmer, C.; Leithner, A.; Zielonke, N.; Sperl, M.; Windhager, R. Increasing incidence rates of soft tissue sarcomas? A population-based epidemiologic study and literature review. Ann. Oncol. 2009, 21, 1106–1111. [Google Scholar] [CrossRef] [PubMed]
- Jönsson, L.; Justo, N.; Musayev, A.; Krishna, A.; Burke, T.; Pellissier, J.; Judson, I.; Staddon, A.; Blay, J. Cost of treatment in patients with metastatic soft tissue sarcoma who respond favourably to chemotherpy. The SArcoma treatment and Burden of Illness in North America and Europe (SABINE) study. Eur. J. Cancer Care 2015, 25, 466–477. [Google Scholar] [CrossRef] [PubMed]
- Righi, A.; Pacheco, M.; Pipola, V.; Gambarotti, M.; Benini, S.; Sbaraglia, M.; Frisoni, T.; Boriani, S.; Tos, A.P.D.; Gasbarrini, A. Primary sclerosing epithelioid fibrosarcoma of the spine: A single-institution experience. Histopathology 2021, 78, 976–986. [Google Scholar] [CrossRef] [PubMed]
- Wilke, B.K.; Buckner, J.; Huayllani, M.T.; Spaulding, A.C.; Murray, P.M.; Forte, A.J. Cost Variance in Patients with Soft Tissue Sarcoma Who Develop Postoperative Wound Complications. JAAOS Glob. Res. Rev. 2021, 5, e21.00147. [Google Scholar] [CrossRef] [PubMed]
- Kraus, D.; Oettinger, F.; Kiefer, J.; Bannasch, H.; Stark, G.B.; Simunovic, F. Efficacy and Cost-Benefit Analysis of Magnetic Resonance Imaging in the Follow-Up of Soft Tissue Sarcomas of the Extremities and Trunk. J. Oncol. 2021, 2021, 1–10. [Google Scholar] [CrossRef] [PubMed]
- Barrientos-Ruiz, I.; Serrano-Montilla, J.; Cruz, E.J.O. Análisis de los costes de diagnóstico y tratamiento de los sarcomas de partes blandas en centros de referencia [Cost analysis of the diagnosis and treatment of soft tissue sarcomas in reference centres]. Rev. Esp. Cir. Ortop. Traumatol. 2012, 56, 374–377. (In Spanish) [Google Scholar] [CrossRef] [PubMed]

| Clinical Variable | Overall Number: 190 (%) | |
|---|---|---|
| Sex | Male | 106 (55.8) |
| Female | 84 (44.2) | |
| Age | 20–29 (M:F = 3:5) | 8 (4.2) |
| 30–39 (M:F = 2:0) | 2 (1.1) | |
| Mean 63.6 | 40–49 (M:F = 9:17) | 26 (13.7) |
| (SD: 16.0) | 50–59 (M:F = 18:23) | 41 (21.6) |
| Median 64.5 | 60–69 (M:F = 25:11) | 36 (18.9) |
| 70–79 (M:F = 27:17) | 44 (23.2) | |
| 80–89 (M:F = 19:9) | 28 (14.7) | |
| ≥90 (M:F = 3:2) | 5 (2.6) | |
| Primary STS site | Limbs | 88 (46.3) |
| Retroperitoneum | 41 (21.6) | |
| Trunk | 35 (18.4) | |
| Head-neck | 19 (10.0) | |
| Unknown | 7 (3.7) | |
| Lineage of differentiation | Fibroblastic/myofibroblastic sarcoma | 51 (26.8) |
| Liposarcoma | 48 (25.3) | |
| Uncertain differentiation | 38(20.0) | |
| Leiomyosarcoma | 37 (19.5) | |
| Vascular sarcoma | 5 (2.6) | |
| Others | 11 (5.8) | |
| TNM stage at initial diagnosis (VII AJCC Edition) | I | 61 (32.1) |
| II | 42 (22.1) | |
| III | 51 (26.8) | |
| IV | 28 (14.7) | |
| Unknown | 8 (4.2) | |
| Clinical Variable | Overall Number = 190 | First Year Mean (Median) | Second Year Mean (Median) | Unweighted Total Costs into Two Years after Diagnosis | Ratio by Lowest | ||||
|---|---|---|---|---|---|---|---|---|---|
| Mean (Median) | SD | [Min; Max] | Mean | Median | |||||
| Primary STS site | Trunk | 35 | 8998 (5143) | 2433 (1615) | 10,945 (9418) | 8829 | [50; 32,134] | - | - |
| Head-neck | 19 | 9943 (9777) | 4316 (1457) | 14,031 (12,107) | 12,447 | [160; 55,710] | 1.28 | 1.29 | |
| Limbs | 88 | 11,965 (9874) | 5527 (1719) | 17,178 (12,647) | 20,431 | [0; 154,713] | 1.57 | 1.34 | |
| Retroperitoneum | 41 | 14,016 (8838) | 8561 (2017) | 20,280 (11,293) | 26,355 | [1487; 163,571] | 1.85 | 1.20 | |
| Lineage of differentiation | Vascular sarcoma | 5 | 8421 (7270) | 3962 (3572) | 11,591 (8392) | 6512 | [3783; 20,791] | - | 1.21 |
| Fibroblastic/myofibroblastic sarcoma | 51 | 9243 (5496) | 3300 (876) | 12,348 (6924) | 13,238 | [0; 62,865] | 1.07 | - | |
| Liposarcoma | 48 | 11,085 (7804) | 3365 (1767) | 14,099 (10,506) | 12,02 | [55; 45,463] | 1.22 | 1.52 | |
| Uncertain differentiation | 38 | 12,645 (12,907) | 4499 (1558) | 15,487 (13,063) | 12,327 | [160; 58,488] | 1.34 | 1.89 | |
| Leiomyosarcoma | 37 | 15,288 (9833) | 10,914 (2220) | 24,432 (12,412) | 34,502 | [0; 163,571] | 2.11 | 1.79 | |
| Others | 11 | 19,350 (14,109) | 12,086 (4329) | 30,338 (19,121) | 40,036 | [6238; 154,713] | 2.62 | 2.76 | |
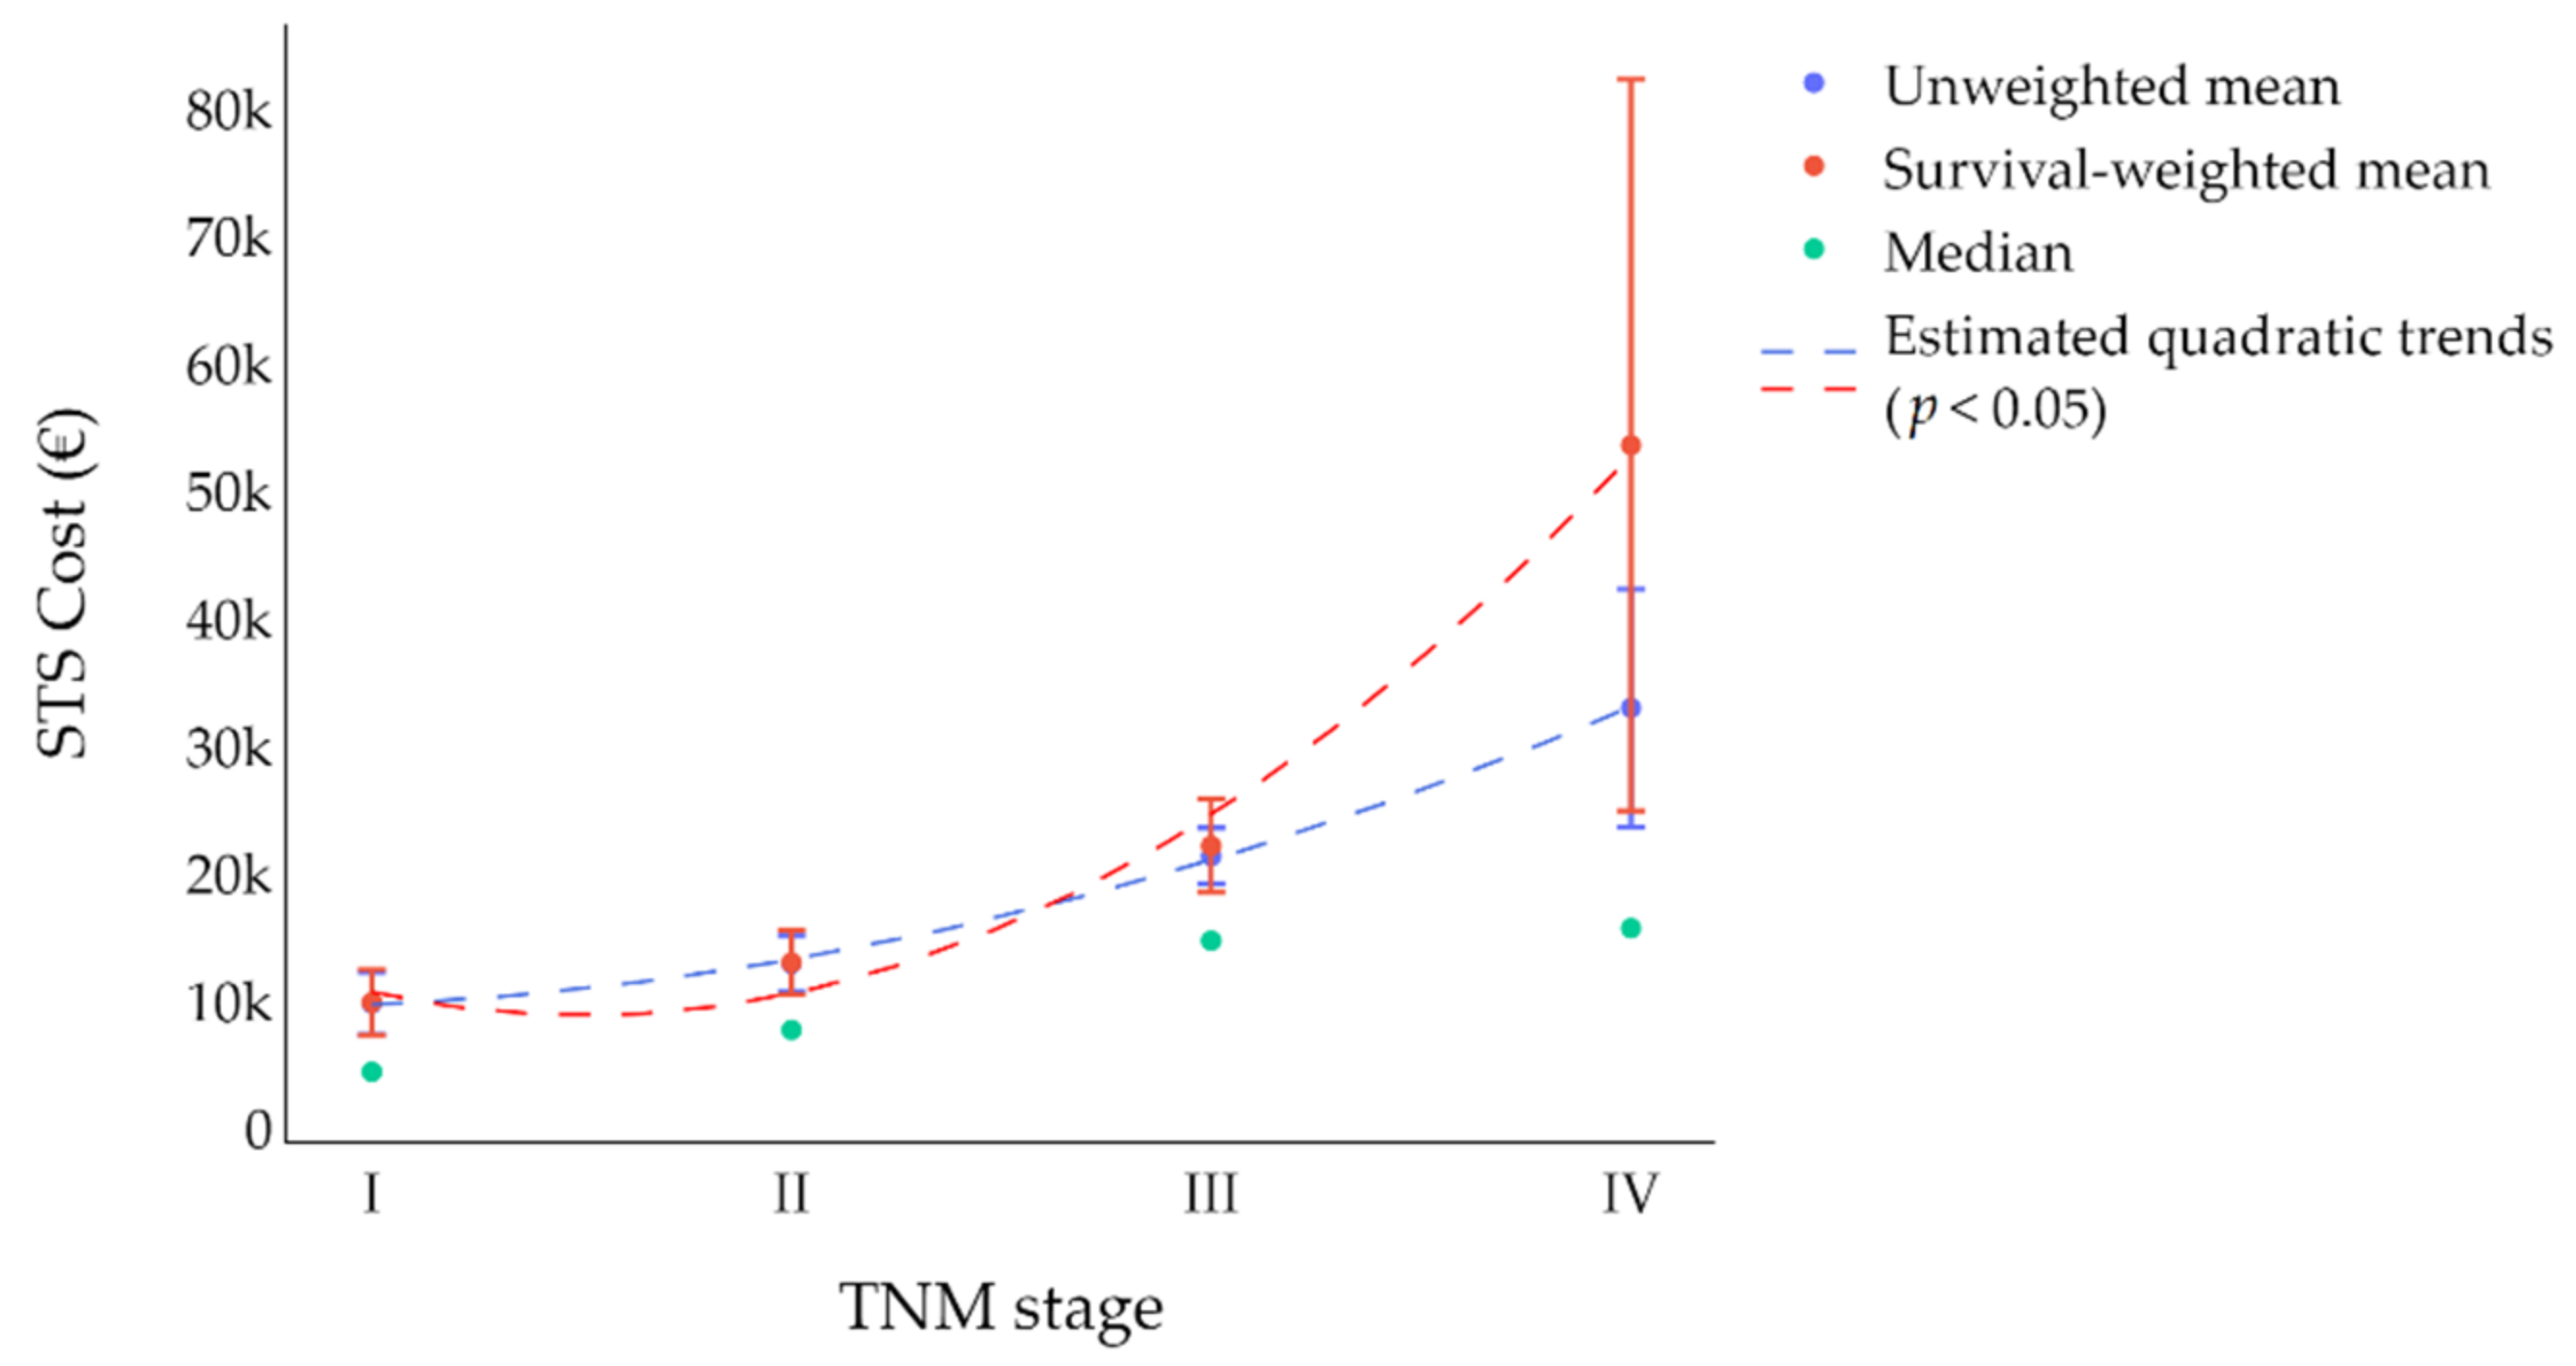
| TNM stage at initial diagnosis (VII AJCC Edition) | I | 61 | 8161 (4436) | 1727 (649) | 9803 (6238) | 11,169 | [0; 62,865] | - | - |
| II | 42 | 9454 (7733) | 3559 (1597) | 12,928 (11,927) | 9506 | [0; 39,917] | 1.32 | 1.91 | |
| III | 51 | 15,319 (14,729) | 6853 (2325) | 21,366 (19,121) | 13,248 | [1189; 67,713] | 2.18 | 3.43 | |
| IV | 28 | 21,529 (15,709) | 32,072 (11,217) | 32,983 (16,880) | 44,559 | [2047; 163,571] | 3.36 | 2.71 | |
| Total | 190 | 12,130 (9017) | 5538 (1736) | 16,793 (12,126) | 21,676 | [0; 163,570] | |||
| Outpatient Drugs | Inpatient Drugs | Medical Devices | ||||||||
|---|---|---|---|---|---|---|---|---|---|---|
| Clinical Variable | Mean (Median) | SD | [Min; Max] | Mean (Median) | SD | [Min; Max] | Mean (Median) | SD | [Min; Max] | |
| Primary STS site | Trunk | 586 (240) | 723 | [0; 3493] | 447 (24) | 1056 | [0; 5539] | 188 (0) | 990 | [0; 5943] |
| Head-neck | 516 (341) | 541 | [0; 2147] | 1252 (5) | 4593 | [0; 20,659] | 1280 (0) | 3879 | [0; 15,877] | |
| Limbs | 651 (295) | 968 | [0; 5543] | 2543 (51) | 14,525 | [0; 132,613] | 1450 (0) | 6708 | [0; 51,700] | |
| Retroperitoneum | 712 (503) | 813 | [0; 4273] | 5144 (83) | 21,709 | [0; 139,870] | 528 (0) | 1865 | [0; 8762] | |
| Lineage of differentiation | Vascular sarcoma | 589 (254) | 680 | [0; 1892] | 12 (0) | 14 | [0; 33] | 112 (0) | 163 | [0; 420] |
| Fibroblastic/myofibroblastic sarcoma | 424 (241) | 601 | [0; 3195] | 923 (15) | 4781 | [0; 34,367] | 932 (0) | 3861 | [0; 22,915] | |
| Liposarcoma | 523 (237) | 603 | [0; 2295] | 1337 (65) | 3519 | [0; 18,240] | 632 (0) | 3691 | [0; 25,777] | |
| Uncertain differentiation | 624 (283) | 989 | [0; 5543] | 563 (63) | 1086 | [0; 5539] | 831 (0) | 2932 | [0; 15,877] | |
| Leiomyosarcoma | 899 (664) | 1028 | [0; 4273] | 7839 (111) | 27,735 | [0; 139,870] | 1859 (0) | 8527 | [0; 51,700] | |
| Others | 1127 (675) | 1144 | [9; 3900] | 14,035 (478) | 37,806 | [0; 132,613] | 143 (0) | 399 | [0; 1403] | |
| TNM stage at initial diagnosis (VII AJCC Edition) | I | 517 (175) | 795 | [0; 3493] | 1106 (24) | 4844 | [0; 34,368] | 44 (0) | 207 | [0; 1403] |
| II | 583 (430) | 597 | [0; 2290] | 236 (23) | 528 | [0; 2072] | 580 (0) | 2685 | [0; 15,877] | |
| III | 845 (607) | 1052 | [0; 5543] | 1022 (163) | 2371 | [0; 15,924] | 2595 (0) | 8671 | [0; 51,700] | |
| IV | 625 (267) | 891 | [0; 4273] | 15,908 (261) | 38,555 | [0; 139,870] | 750 (0) | 2217 | [0; 8762] | |
| Total | 627 (313) | 849 | [0; 5543] | 3037 (36) | 16,029 | [0; 139,870] | 949 (0) | 4856 | [0; 51,700] | |
| Emergency Department Visits | Specialist Visits | |||||||||
| Clinical Variable | Mean (Median) | SD | [Min; Max] | Mean (Median) | SD | [Min; Max] | ||||
| Primary STS site | Trunk | 1645 (23) | 330 | [0; 1652] | 3739 (1497) | 4406 | [0; 15,815] | |||
| Head-neck | 217 (143) | 258 | [0; 823] | 3641 (560) | 4984 | [0; 15,976] | ||||
| Limbs | 170 (23) | 293 | [0; 1200] | 4469 (2677) | 4489 | [0; 20,316] | ||||
| Retroperitoneum | 249 (86) | 410 | [0; 2109] | 3226 (2046) | 4166 | [0; 18,637] | ||||
| Lineage of differentiation | Vascular sarcoma | 144 (71) | 157 | [0; 397] | 4437 (560) | 5397 | [0; 13,542] | |||
| Fibroblastic/myofibroblastic sarcoma | 165 (0) | 333 | [0; 1652] | 2926 (1504) | 4127 | [0; 20,316] | ||||
| Liposarcoma | 170 (0) | 305 | [0; 1415] | 3486 (1620) | 4030 | [0; 13,303] | ||||
| Uncertain differentiation | 254 (100) | 293 | [0; 970] | 4206 (2853) | 4137 | [0; 12,367] | ||||
| Leiomyosarcoma | 230 (94) | 396 | [0; 2109] | 4478 (2677) | 5428 | [0; 23,419] | ||||
| Others | 79 (23) | 115 | [0; 349] | 7788 (8923) | 5852 | [29; 18,337] | ||||
| TNM stage at initial diagnosis (VII AJCC Edition) | I | 137 (0) | 332 | [0; 2109] | 1982 (962) | 3387 | [0; 20,316] | |||
| II | 167 (12) | 263 | [0; 1034] | 4072 (2633) | 3821 | [0; 15,815] | ||||
| III | 283 (99) | 400 | [0; 1652] | 6101 (4795) | 4433 | [134; 18,337] | ||||
| IV | 206 (135) | 216 | [0; 686] | 5034 (862) | 6645 | [0; 23,419] | ||||
| Total | 191 (45) | 323 | [0; 2109] | 3947 (2152) | 4674 | [0; 23,419] | ||||
| Hospitalization | Hospice | |||||||||
| Clinical Variable | Mean (Median) | SD | [Min; Max] | Mean (Median) | SD | [Min; Max] | ||||
| Primary STS site | Trunk | 5724 (3702) | 5203 | [0; 18,400] | 96 (0) | 418 | [0; 2310] | |||
| Head-neck | 7002 (6013) | 5095 | [0; 17,879] | 122 (0) | 369 | [0; 1470] | ||||
| Limbs | 7835 (5398) | 7995 | [0; 41,310] | 60 (0) | 369 | [0; 3272] | ||||
| Retroperitoneum | 10,417 (5948) | 10,722 | [0; 47,113] | 4 (0) | 28 | [0; 182] | ||||
| Lineage of differentiation | Vascular sarcoma | 6003 (6468) | 1733 | [2715; 7547] | 294 (0) | 588 | [0; 1470] | |||
| Fibroblastic/myofibroblastic sarcoma | 6958 (4088) | 7086 | [0; 33,122] | 22 (0) | 146 | [0; 1050] | ||||
| Liposarcoma | 7952 (4467) | 7996 | [0; 33,715] | 0 (0) | 0 | [0; 0] | ||||
| Uncertain differentiation | 8831 (6239) | 9659 | [0; 45,859] | 178 (0) | 617 | [0; 3272] | ||||
| Leiomyosarcoma | 8919 (7373) | 8423 | [0; 47,113] | 209 (0) | 804 | [0; 4410] | ||||
| Others | 7127 (6266) | 6609 | [0; 21,408] | 38 (0) | 121 | [0; 420] | ||||
| TNM stage at initial diagnosis (VII AJCC Edition) | I | 6017 (3702) | 7454 | [0; 45,859] | 0 (0) | 0 | [0; 0] | |||
| II | 7290 (5347) | 6664 | [0; 28,540] | 0 (0) | 0 | [0; 0] | ||||
| III | 10,419 (8535) | 8308 | [0; 41,310] | 101 (0) | 495 | [0; 3272] | ||||
| IV | 10,059 (7885) | 9802 | [0; 47,113] | 401 (0) | 964 | [0; 4410] | ||||
| Total | 7950 (5398) | 8,09 | [0; 47,113] | 92 (0) | 476 | [0; 4410] | ||||
Publisher’s Note: MDPI stays neutral with regard to jurisdictional claims in published maps and institutional affiliations. |
© 2022 by the authors. Licensee MDPI, Basel, Switzerland. This article is an open access article distributed under the terms and conditions of the Creative Commons Attribution (CC BY) license (https://creativecommons.org/licenses/by/4.0/).
Share and Cite
Rugge, M.; Buja, A.; Tropea, S.; Girardi, G.; Franzese, L.C.; Cozzolino, C.; Zorzi, M.; Vecchiato, A.; Del Fiore, P.; Brunello, A.; et al. Direct Costs of Care for Adults with Soft Tissue Sarcomas: A Population-Based Study. Cancers 2022, 14, 3109. https://doi.org/10.3390/cancers14133109
Rugge M, Buja A, Tropea S, Girardi G, Franzese LC, Cozzolino C, Zorzi M, Vecchiato A, Del Fiore P, Brunello A, et al. Direct Costs of Care for Adults with Soft Tissue Sarcomas: A Population-Based Study. Cancers. 2022; 14(13):3109. https://doi.org/10.3390/cancers14133109
Chicago/Turabian StyleRugge, Massimo, Alessandra Buja, Saveria Tropea, Giovanni Girardi, Luigi Cosenza Franzese, Claudia Cozzolino, Manuel Zorzi, Antonella Vecchiato, Paolo Del Fiore, Antonella Brunello, and et al. 2022. "Direct Costs of Care for Adults with Soft Tissue Sarcomas: A Population-Based Study" Cancers 14, no. 13: 3109. https://doi.org/10.3390/cancers14133109
APA StyleRugge, M., Buja, A., Tropea, S., Girardi, G., Franzese, L. C., Cozzolino, C., Zorzi, M., Vecchiato, A., Del Fiore, P., Brunello, A., Brazzale, A. R., Baldo, V., dei Tos, A. P., Rossi, C. R., & Mocellin, S. (2022). Direct Costs of Care for Adults with Soft Tissue Sarcomas: A Population-Based Study. Cancers, 14(13), 3109. https://doi.org/10.3390/cancers14133109