
Development of Training Materials for Pathologists to Provide Machine Learning Validation Data of Tumor-Infiltrating Lymphocytes in Breast Cancer

 , , , ,
Abstract
:Simple Summary
Abstract
1. Introduction
2. Materials and Methods
2.1. Pilot Study
2.2. Collected Annotations
2.3. Selecting Regions of Interest for the Expert Panel Sessions
2.4. Expert Panel Sessions
3. Results
- Not all mesenchymal tissue should be considered tumor-associated stroma. For the purposes of sTILs assessments, tumor-associated stroma is defined as the reactive stroma composed of fibroblasts, newly formed vessels, collagen fibers, and extracellular matrix surrounding invasive carcinoma cells and cell nests. Pre-existing normal structures, such as adipose tissue, blood vessels, or nerves, are excluded from the area segmented as tumor-associated stroma. Areas of necrosis and fibrin are also excluded.
- The percent of tumor-associated stroma is calculated with respect to the area of the entire ROI, as previously described. Vessel lumens, adipose tissue, and negative (empty) space should be included in the total ROI area, the denominator of the percent tumor-associated stroma equation. The numerator is only tumor-associated stroma.
- Variations in tumor cell morphology can make it difficult to distinguish stroma from tumor. Tumor cell cytoplasmic eosinophilia can be similar to that of adjacent stroma and cause difficulty in distinguishing these two tissue types. Additional stains may be useful in these scenarios.
- Carcinoma in situ and benign glandular elements entrapped within the tumor area, including intact terminal duct lobular units, should be excluded from the numerator when calculating the percent of tumor-associated stroma.
- The sTILs density score assessment had four identified pitfalls:
- Cells with small/pyknotic nuclei and/or perinuclear clearing can be difficult to categorize as macrophages, tumor cells, plasma cells, or lymphocytes. This may occur with invasive lobular carcinoma or in cases of suboptimal tissue fixation. Additional stains may be helpful.
- Non-lymphoid cells that may be confused for lymphocytes include cross-sectionally cut fibroblasts and tumor cells, particularly if low grade and/or degenerated. Sometimes, cancer cell nuclei are hyperchromatic, due to crush artifacts, overstaining, and/or poor fixation, and can be confused for lymphocytes.
- Error in the percent tumor-associated stroma can lead to inflated or deflated sTILs scores. Stroma may be obscured by dense populations of cells and may be incorrectly excluded from the sTILs evaluation. A lower estimated percent tumor-associated stroma could substantively affect the sTILs score.
- When tumor cells are sparsely distributed throughout the ROI, it may be more challenging to accurately quantitate the sTILs density and percent tumor-associated stroma.
4. Discussion
5. Conclusions
Author Contributions
Funding
Institutional Review Board Statement
Informed Consent Statement
Data Availability Statement
Conflicts of Interest
Disclaimer
References
- Mao, Y.; Qu, Q.; Chen, X.; Huang, O.; Wu, J.; Shen, K. The Prognostic Value of Tumor-Infiltrating Lymphocytes in Breast Cancer: A Systematic Review and Meta-Analysis. PLoS ONE 2016, 11, e0152500. [Google Scholar] [CrossRef] [PubMed]
- Loi, S.; Drubay, D.; Adams, S.; Pruneri, G.; Francis, P.A.; Lacroix-Triki, M.; Joensuu, H.; Dieci, M.V.; Badve, S.; Demaria, S.; et al. Tumor-Infiltrating Lymphocytes and Prognosis: A Pooled Individual Patient Analysis of Early-Stage Triple-Negative Breast Cancers. J. Clin. Oncol. 2019, 37, 559–569. [Google Scholar] [CrossRef] [PubMed]
- Savas, P.; Salgado, R.; Denkert, C.; Sotiriou, C.; Darcy, P.K.; Smyth, M.J.; Loi, S. Clinical Relevance of Host Immunity in Breast Cancer: From TILs to the Clinic. Nat. Rev. Clin. Oncol. 2016, 13, 228–241. [Google Scholar] [CrossRef] [PubMed]
- Hendry, S.; Salgado, R.; Gevaert, T.; Russell, P.A.; John, T.; Thapa, B.; Christie, M.; Estrada, M.; Gonzalez-Ericsson, P.; Sanders, M.; et al. Assessing Tumor-Infiltrating Lymphocytes in Solid Tumors: A Practical Review for Pathologists and Proposal for a Standardized Method from the International Immunooncology Biomarkers Working Group: Part 1: Assessing the Host Immune Response, TILs in Invasive Breast Carcinoma and Ductal Carcinoma in Situ, Metastatic Tumor Deposits and Areas for Further Research. Adv. Anat. Pathol. 2017, 24, 235–251. [Google Scholar] [CrossRef] [Green Version]
- Stanton, S.E.; Disis, M.L. Clinical Significance of Tumor-Infiltrating Lymphocytes in Breast Cancer. J. Immunother. Cancer 2016, 4, 59. [Google Scholar] [CrossRef] [Green Version]
- Lotfinejad, P.; Asghari Jafarabadi, M.; Abdoli Shadbad, M.; Kazemi, T.; Pashazadeh, F.; Sandoghchian Shotorbani, S.; Jadidi Niaragh, F.; Baghbanzadeh, A.; Vahed, N.; Silvestris, N.; et al. Prognostic Role and Clinical Significance of Tumor-Infiltrating Lymphocyte (TIL) and Programmed Death Ligand 1 (PD-L1) Expression in Triple-Negative Breast Cancer (TNBC): A Systematic Review and Meta-Analysis Study. Diagnostics 2020, 10, 704. [Google Scholar] [CrossRef]
- Denkert, C.; von Minckwitz, G.; Darb-Esfahani, S.; Lederer, B.; Heppner, B.I.; Weber, K.E.; Budczies, J.; Huober, J.; Klauschen, F.; Furlanetto, J.; et al. Tumour-Infiltrating Lymphocytes and Prognosis in Different Subtypes of Breast Cancer: A Pooled Analysis of 3771 Patients Treated with Neoadjuvant Therapy. Lancet Oncol. 2018, 19, 40–50. [Google Scholar] [CrossRef]
- Wein, L.; Savas, P.; Luen, S.J.; Virassamy, B.; Salgado, R.; Loi, S. Clinical Validity and Utility of Tumor-Infiltrating Lymphocytes in Routine Clinical Practice for Breast Cancer Patients: Current and Future Directions. Front. Oncol. 2017, 7, 156. [Google Scholar] [CrossRef] [Green Version]
- Park, J.H.; Jonas, S.F.; Bataillon, G.; Criscitiello, C.; Salgado, R.; Loi, S.; Viale, G.; Lee, H.J.; Dieci, M.V.; Kim, S.-B.; et al. Prognostic Value of Tumor-Infiltrating Lymphocytes in Patients with Early-Stage Triple-Negative Breast Cancers (TNBC) Who Did Not Receive Adjuvant Chemotherapy. Ann. Oncol. 2019, 30, 1941–1949. [Google Scholar] [CrossRef]
- Luen, S.J.; Salgado, R.; Dieci, M.V.; Vingiani, A.; Curigliano, G.; Gould, R.E.; Castaneda, C.; D’Alfonso, T.; Sanchez, J.; Cheng, E.; et al. Prognostic Implications of Residual Disease Tumor-Infiltrating Lymphocytes and Residual Cancer Burden in Triple-Negative Breast Cancer Patients after Neoadjuvant Chemotherapy. Ann. Oncol. 2019, 30, 236–242. [Google Scholar] [CrossRef] [Green Version]
- Denkert, C.; von Minckwitz, G.; Brase, J.C.; Sinn, B.V.; Gade, S.; Kronenwett, R.; Pfitzner, B.M.; Salat, C.; Loi, S.; Schmitt, W.D.; et al. Tumor-Infiltrating Lymphocytes and Response to Neoadjuvant Chemotherapy With or Without Carboplatin in Human Epidermal Growth Factor Receptor 2–Positive and Triple-Negative Primary Breast Cancers. JCO 2015, 33, 983–991. [Google Scholar] [CrossRef]
- Balic, M.; Thomssen, C.; Würstlein, R.; Gnant, M.; Harbeck, N. St. Gallen/Vienna 2019: A Brief Summary of the Consensus Discussion on the Optimal Primary Breast Cancer Treatment. Breast Care 2019, 14, 103–110. [Google Scholar] [CrossRef]
- Cardoso, F.; Kyriakides, S.; Ohno, S.; Penault-Llorca, F.; Poortmans, P.; Rubio, I.T.; Zackrisson, S.; Senkus, E. Early Breast Cancer: ESMO Clinical Practice Guidelines for Diagnosis, Treatment and Follow-Up. Ann. Oncol. 2019, 30, 1194–1220. [Google Scholar] [CrossRef] [Green Version]
- Morigi, C. Highlights of the 16th St Gallen International Breast Cancer Conference, Vienna, Austria, 20–23 March 2019: Personalised Treatments for Patients with Early Breast Cancer. Ecancermedicalscience 2019, 13, 924. [Google Scholar] [CrossRef]
- Salgado, R.; Denkert, C.; Demaria, S.; Sirtaine, N.; Klauschen, F.; Pruneri, G.; Wienert, S.; Van den Eynden, G.; Baehner, F.L.; Penault-Llorca, F.; et al. The Evaluation of Tumor-Infiltrating Lymphocytes (TILs) in Breast Cancer: Recommendations by an International TILs Working Group 2014. Ann. Oncol. 2015, 26, 259–271. [Google Scholar] [CrossRef]
- Home-International TILS Working Group. Available online: https://www.tilsinbreastcancer.org/ (accessed on 5 November 2021).
- Amgad, M.; Stovgaard, E.S.; Balslev, E.; Thagaard, J.; Chen, W.; Dudgeon, S.; Sharma, A.; Kerner, J.K.; Denkert, C.; Yuan, Y.; et al. Report on Computational Assessment of Tumor Infiltrating Lymphocytes from the International Immuno-Oncology Biomarker Working Group. NPJ Breast Cancer 2020, 6, 16. [Google Scholar] [CrossRef]
- Sun, P.; He, J.; Chao, X.; Chen, K.; Xu, Y.; Huang, Q.; Yun, J.; Li, M.; Luo, R.; Kuang, J.; et al. A Computational Tumor-Infiltrating Lymphocyte Assessment Method Comparable with Visual Reporting Guidelines for Triple-Negative Breast Cancer. EBioMedicine 2021, 70, 103492. [Google Scholar] [CrossRef]
- Schirris, Y.; Engelaer, M.; Panteli, A.; Horlings, H.M.; Gavves, E.; Teuwen, J. WeakSTIL: Weak Whole-Slide Image Level Stromal Tumor Infiltrating Lymphocyte Scores Are All You Need. In Proceedings of the Medical Imaging 2022: Digital and Computational Pathology, San Diego, CA, USA, 4 April 2022; SPIE: WA, USA, Bellingham; Volume 12039, pp. 55–59. [Google Scholar]
- Thagaard, J.; Stovgaard, E.S.; Vognsen, L.G.; Hauberg, S.; Dahl, A.; Ebstrup, T.; Doré, J.; Vincentz, R.E.; Jepsen, R.K.; Roslind, A.; et al. Automated Quantification of STIL Density with H&E-Based Digital Image Analysis Has Prognostic Potential in Triple-Negative Breast Cancers. Cancers 2021, 13, 3050. [Google Scholar] [CrossRef]
- Lin, Z.; Xiong, Z.; Wei, C.; Wang, W.; Peng, Z. Assessment of Breast Cancer Mesenchymal Tumor Infiltrating Lymphocytes Based on Regional Segmentation and Nuclear Segmentation Classification. In Proceedings of the 2021 International Conference on Information Technology and Biomedical Engineering (ICITBE), Nanchang, China, 24–26 December 2021; pp. 277–282. [Google Scholar]
- Fassler, D.J.; Torre-Healy, L.A.; Gupta, R.; Hamilton, A.M.; Kobayashi, S.; Van Alsten, S.C.; Zhang, Y.; Kurc, T.; Moffitt, R.A.; Troester, M.A.; et al. Spatial Characterization of Tumor-Infiltrating Lymphocytes and Breast Cancer Progression. Cancers 2022, 14, 2148. [Google Scholar] [CrossRef]
- Dudgeon, S.N.; Wen, S.; Hanna, M.G.; Gupta, R.; Amgad, M.; Sheth, M.; Marble, H.; Huang, R.; Herrmann, M.D.; Szu, C.H.; et al. A Pathologist-Annotated Dataset for Validating Artificial Intelligence: A Project Description and Pilot Study. J. Pathol. Inform. 2021, 12, 45. [Google Scholar] [CrossRef]
- FDA/CDRH Qualification of Medical Device Development Tools 2017. Available online: https://www.fda.gov/media/87134/download (accessed on 15 November 2021).
- Van Bockstal, M.R.; Cooks, M.; Nederlof, I.; Brinkhuis, M.; Dutman, A.; Koopmans, M.; Kooreman, L.; van der Vegt, B.; Verhoog, L.; Vreuls, C.; et al. Interobserver Agreement of PD-L1/SP142 Immunohistochemistry and Tumor-Infiltrating Lymphocytes (TILs) in Distant Metastases of Triple-Negative Breast Cancer: A Proof-of-Concept Study. A Report on Behalf of the International Immuno-Oncology Biomarker Working Group. Cancers 2021, 13, 4910. [Google Scholar] [CrossRef]
- Ogiya, R.; Niikura, N.; Kumaki, N.; Bianchini, G.; Kitano, S.; Iwamoto, T.; Hayashi, N.; Yokoyama, K.; Oshitanai, R.; Terao, M.; et al. Comparison of Tumor-Infiltrating Lymphocytes between Primary and Metastatic Tumors in Breast Cancer Patients. Cancer Sci. 2016, 107, 1730–1735. [Google Scholar] [CrossRef]
- NCI Hub—Group: EeDAP Studies~Wiki: HTT Data Collection Training. Available online: https://ncihub.org/groups/eedapstudies/wiki/HTTdataCollectionTraining (accessed on 29 April 2022).
- International Immuno-Oncology Biomarker WG on BC TILs Education: What They Are and What They Do 2021. Available online: https://www.youtube.com/watch?v=aPa-pXIBBlU (accessed on 1 March 2022).
- NCI Hub—Group: EeDAP Studies~Wiki: HTTtraining Video Clinical. Available online: https://ncihub.org/groups/eedapstudies/wiki/HTTtrainingVideoClinical/ (accessed on 8 November 2021).
- International Immuno-Oncology Biomarker WG TILs Education: What They Are and What They Do. Available online: https://www.tilsinbreastcancer.org/wp-content/uploads/2020/12/TILs_Master_8.mp4 (accessed on 2 May 2022).
- Gallas, B.D. HTT: R Data Package, DIDSR: Version 2.0.0. 2021. Available online: https://github.com/DIDSR/HTT (accessed on 5 November 2021).
- NCI Hub—Group: EeDAP Studies~Overview. Available online: https://ncihub.org/groups/eedapstudies/overview (accessed on 30 April 2022).
- eeDAP User 20200219 HTTdataCollectionWebinar TILsEvaluation 2021. Available online: https://www.youtube.com/watch?v=iJpJbfj0o20 (accessed on 27 April 2022).
- Gallas, B.D.; Gavrielides, M.A.; Conway, C.; Ivansky, A.; Keay, T.; Cheng, W.-C.; Hipp, J.; Hewitt, S.M. Evaluation Environment for Digital and Analog Pathology (EeDAP): A Platform for Validation Studies. J. Med. Img. 2014, 1, 037501. [Google Scholar] [CrossRef] [Green Version]
- Gallas, B.D. eeDAP, DIDSR: Version 5.1. 2021. Available online: https://github.com/DIDSR/eeDAP (accessed on 10 November 2021).
- Saltz, J.; Sharma, A.; Iyer, G.; Bremer, E.; Wang, F.; Jasniewski, A.; DiPrima, T.; Almeida, J.S.; Gao, Y.; Zhao, T.; et al. A Containerized Software System for Generation, Management, and Exploration of Features from Whole Slide Tissue Images. Cancer Res. 2017, 77, e79–e82. [Google Scholar] [CrossRef] [Green Version]
- PathPresenter. Available online: https://pathpresenter.net/login (accessed on 5 November 2021).
- Shannon, C.E. A Mathematical Theory of Communication. Bell Syst. Tech. J. 1948, 27, 379–423. [Google Scholar] [CrossRef] [Green Version]
- Spellerberg, I.F.; Fedor, P.J. A Tribute to Claude Shannon (1916–2001) and a Plea for More Rigorous Use of Species Richness, Species Diversity and the ‘Shannon-Wiener’ Index. Glob. Ecol. Biogeogr. 2003, 12, 177–179. [Google Scholar] [CrossRef] [Green Version]
- International Immuno-Oncology Biomarker Working Group Stanardized Approach for TIL Evaluation in Breast Cancer. Available online: https://www.tilsinbreastcancer.org/wp-content/uploads/2017/10/Figure2.pdf (accessed on 28 December 2021).
- Swisher, S.K.; Wu, Y.; Castaneda, C.A.; Lyons, G.R.; Yang, F.; Tapia, C.; Wang, X.; Casavilca, S.A.A.; Bassett, R.; Castillo, M.; et al. Interobserver Agreement Between Pathologists Assessing Tumor-Infiltrating Lymphocytes (TILs) in Breast Cancer Using Methodology Proposed by the International TILs Working Group. Ann. Surg. Oncol. 2016, 23, 2242–2248. [Google Scholar] [CrossRef]
- Chen, X.; Breslow, L.; DeBoer, J. Analyzing Productive Learning Behaviors for Students Using Immediate Corrective Feedback in a Blended Learning Environment. Comput. Educ. 2018, 117, 59–74. [Google Scholar] [CrossRef]
- The International Immuno-Oncology Biomarker Working Group; Kos, Z.; Roblin, E.; Kim, R.S.; Michiels, S.; Gallas, B.D.; Chen, W.; van de Vijver, K.K.; Goel, S.; Adams, S.; et al. Pitfalls in Assessing Stromal Tumor Infiltrating Lymphocytes (STILs) in Breast Cancer. NPJ Breast Cancer 2020, 6, 17. [Google Scholar] [CrossRef]
- Pitfalls. International TILS Working Group. Available online: https://www.tilsinbreastcancer.org/pitfalls/ (accessed on 28 December 2021).
- Fink, A.; Kosecoff, J.; Chassin, M.; Brook, R.H. Consensus Methods: Characteristics and Guidelines for Use. Am. J. Public Health 1984, 74, 979–983. [Google Scholar] [CrossRef] [Green Version]


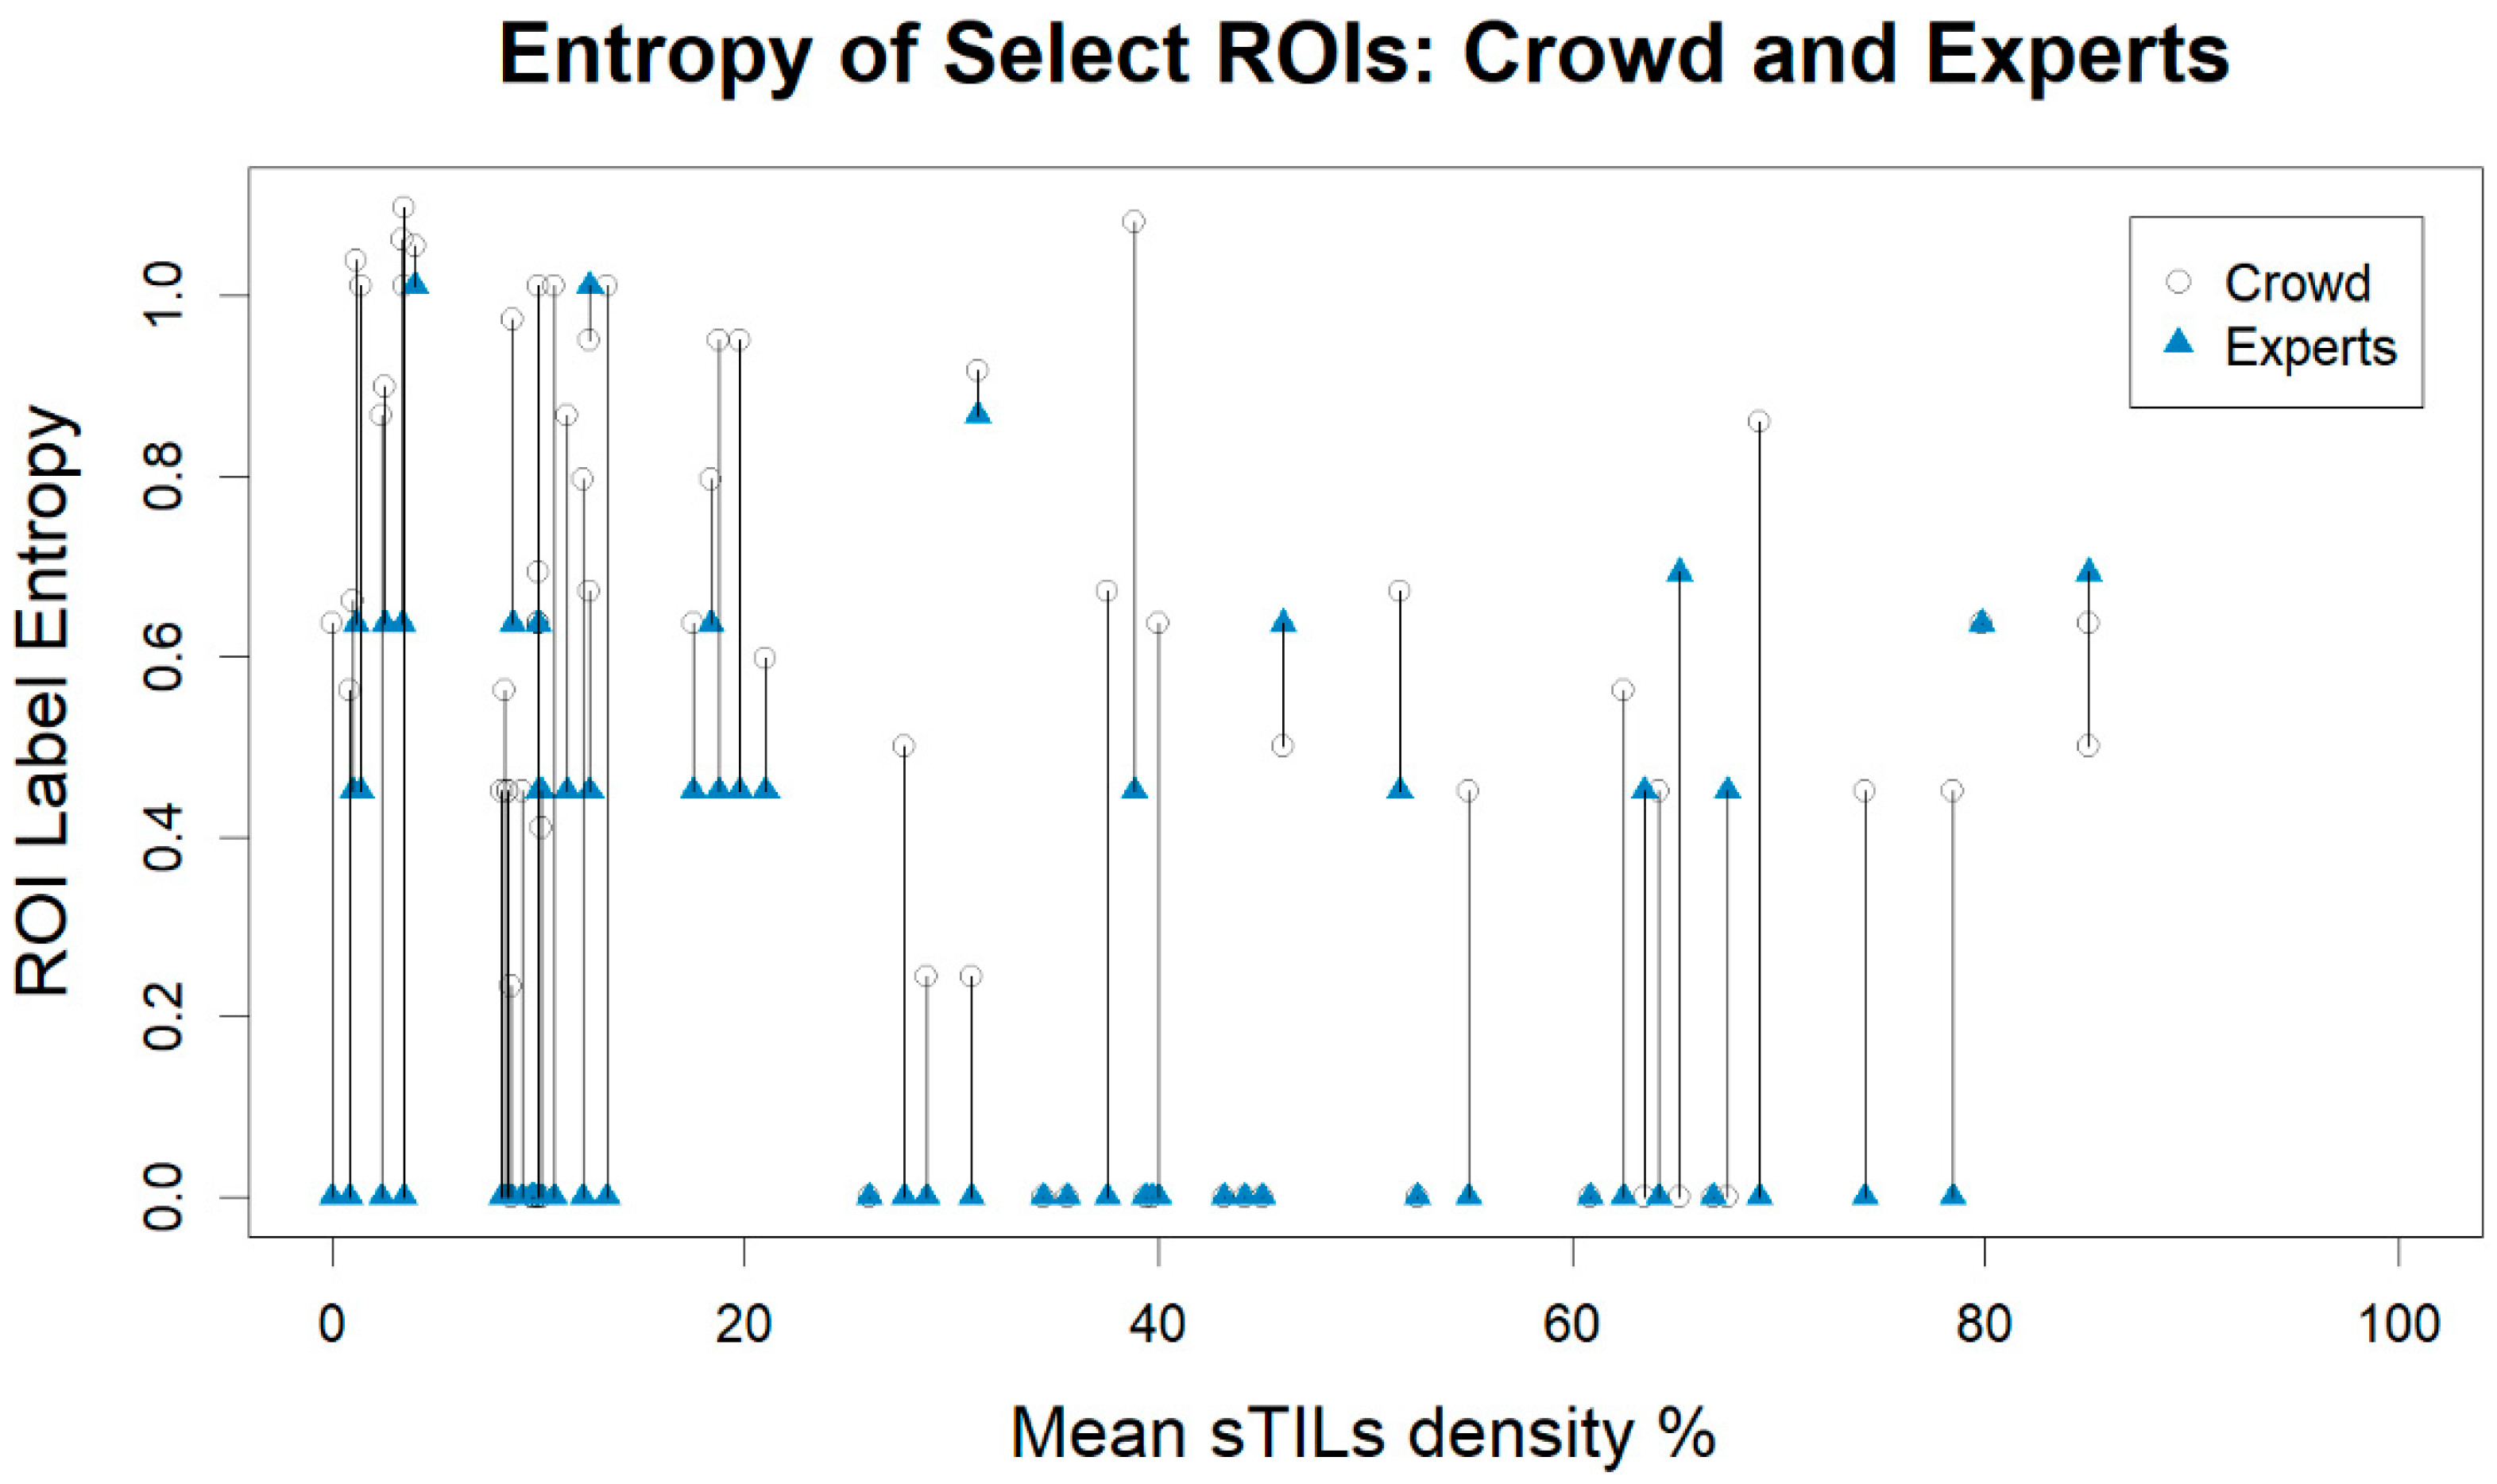
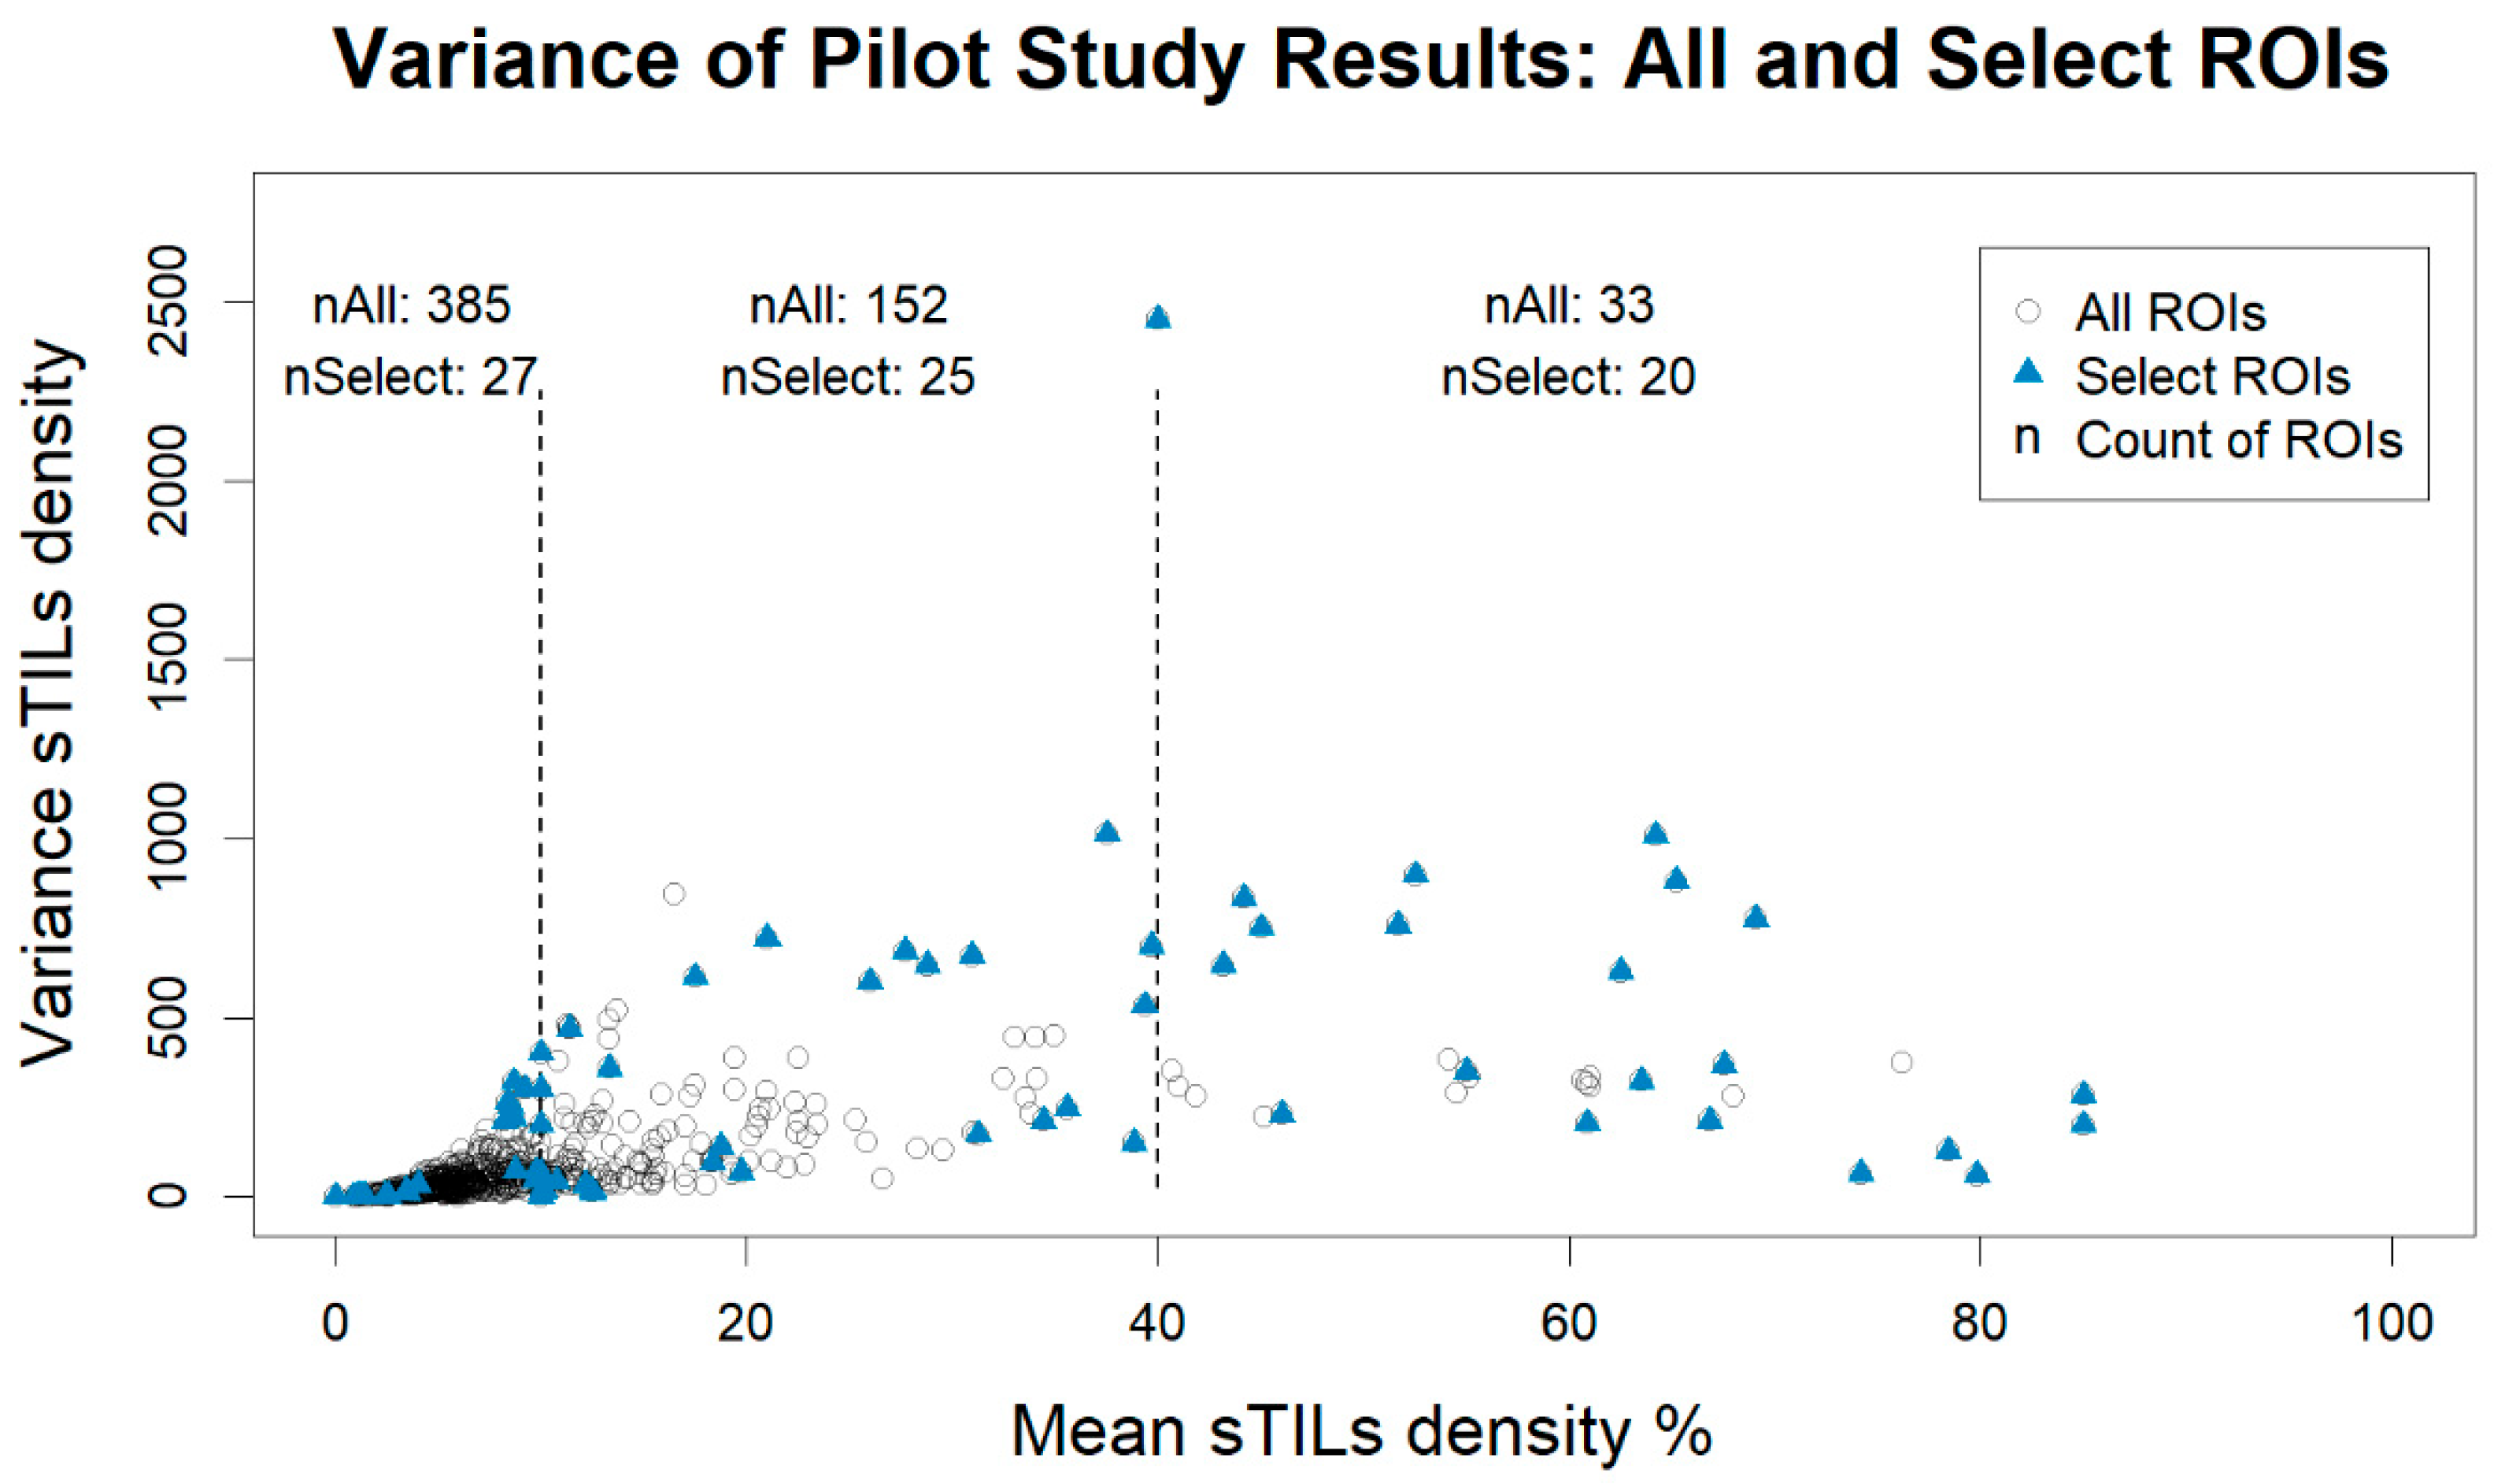
| Figure | Figure Description | Mean sTILs Density | Variance | Majority Label | Entropy |
|---|---|---|---|---|---|
| 2A | High Variance LE10 | 10 | 400 | Intra-Tumoral Stroma | 1.01 |
| 2B | Low Variance LE10 | 0 | 0 | Other Regions | 0.64 |
| 2C | High Variance GT40 | 64.2 | 1008.2 | Intra-Tumoral Stroma | 0.45 |
| 2D | Low Variance GT40 | 79.83 | 58.97 | Intra-Tumoral Stroma | 0.64 |
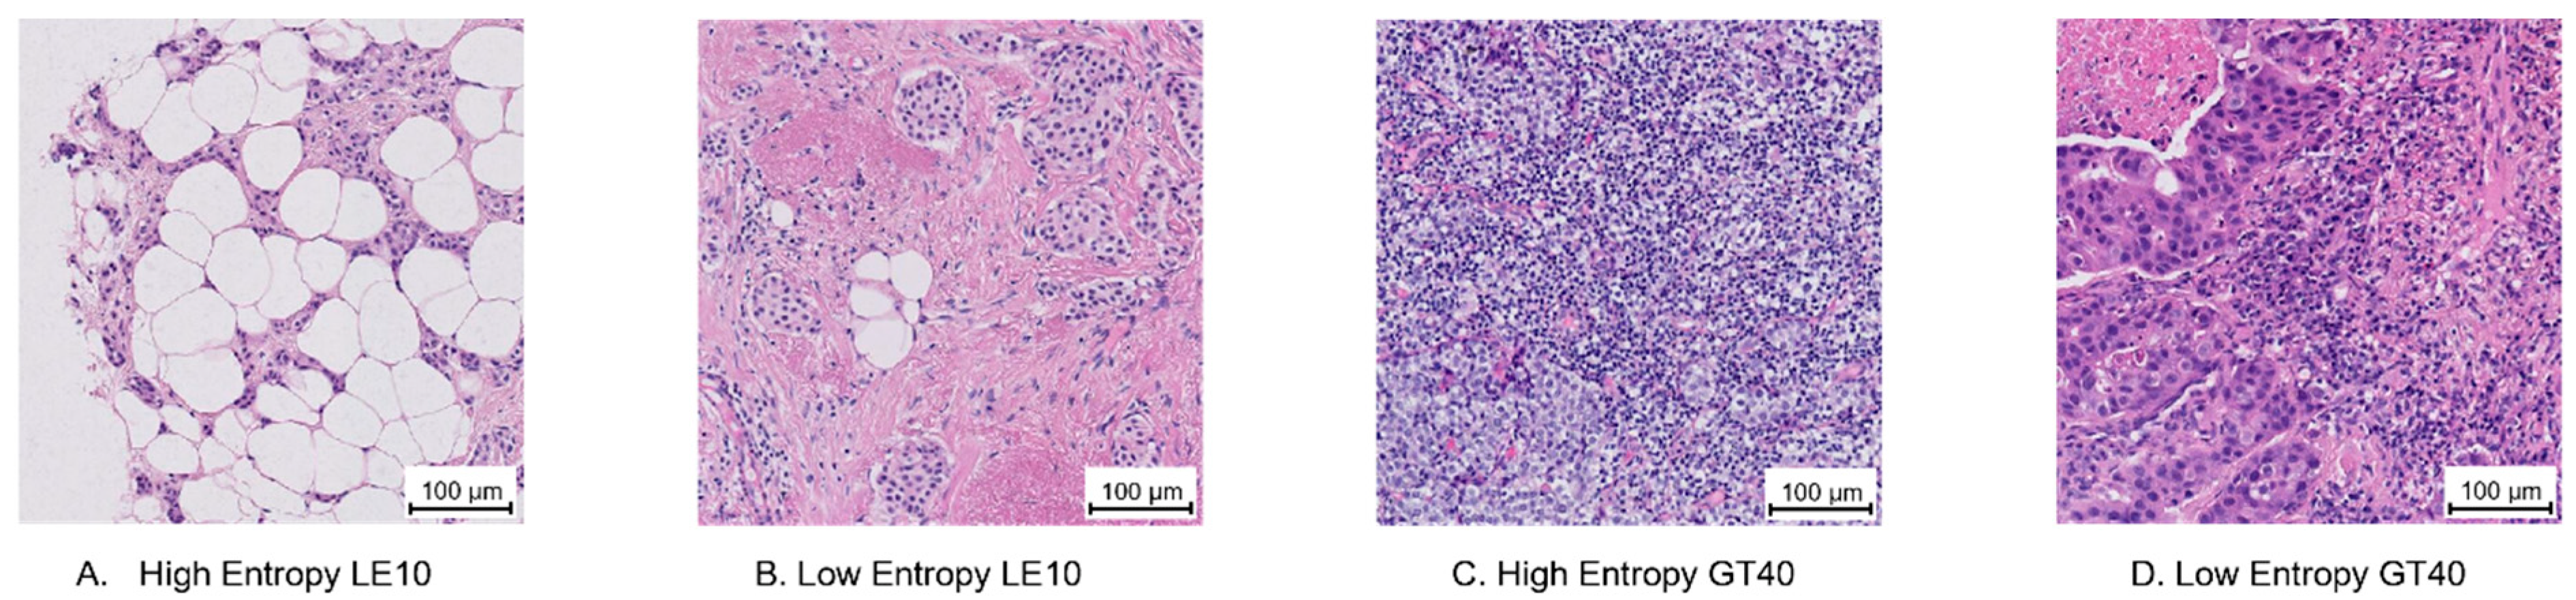
| 3A | High Entropy LE10 | 3.5 | 9.67 | Intra-Tumoral Stroma *AND* Invasive Margin *AND* Tumor with No Intervening Stroma | 1.1 |
| 3B | Low Entropy LE10 | 9.75 | 70.79 | Intra-Tumoral Stroma | 0 |
| 3C | High Entropy GT40 | 69.08 | 775.9 | Intra-Tumoral Stroma | 0.86 |
| 3D | Low Entropy GT40 | 66.83 | 212.17 | Intra-Tumoral Stroma | 0 |
| Figure | Figure Description | Invasive Margin | Intra-Tumoral Stroma | Tumor with No Intervening Stroma | Other Regions |
|---|---|---|---|---|---|
| 2A | High Variance LE10 | 1 | 3 | 2 | 0 |
| 2B | Low Variance LE10 | 0 | 2 | 0 | 4 |
| 2C | High Variance GT40 | 0 | 5 | 1 | 0 |
| 2D | Low Variance GT40 | 2 | 4 | 0 | 0 |
| 3A | High Entropy LE10 | 2 | 2 | 2 | 0 |
| 3B | Low Entropy LE10 | 0 | 8 | 0 | 0 |
| 3C | High Entropy GT40 | 2 | 10 | 3 | 0 |
| 3D | Low Entropy GT40 | 0 | 6 | 0 | 0 |
| All Densities | ≤10% | 10% < % ≤ 40% | >40% | |
|---|---|---|---|---|
| Crowd-All | 48.10 (20.58–110.31) | 30.70 (15.07–59.50) | 111.50 (56.30–245.13) | 324.55 (278.17–627.50) |
| Crowd-Select | 212.24 (39.33–549.50) | 44.67 (4.05–225.28) | 246.80 (67.58–646.18) | 358.75 (210.17–762.73) |
| Experts | 14.17 (4.23–178.67) | 3.07 (0.98–4.32) | 70.00 (14.17–224.17) | 96.67 (39.42–275.03) |
| All Densities | ≤10% | 10% < % ≤ 40% | >40% | |
|---|---|---|---|---|
| Crowd-All | 0.23 (0.00–0.45) | 0.23 (0.00–0.41) | 0.24 (0.00- 0.50) | 0.00 (0.00–0.45) |
| Crowd-Select | 0.56 (0.00–0.86) | 0.64 (0.45–0.99) | 0.64 (0.24–0.92) | 0.45 (0.00–0.52) |
| Experts | 0.00 (0.00–0.45) | 0.00 (0.00–0.45) | 0.00 (0.00–0.45) | 0.00 (0.00–0.50) |
| Majority Label | Crowd-All | Crowd-Select | Experts |
|---|---|---|---|
| Intra-Tumoral Stroma | 525 (82.03%) | 54 (75%) | 56 (77.78%) |
| Intra-Tumoral Stroma *AND* Invasive Margin | 10 (1.56%) | 1 (1.39%) | 1 (1.39%) |
| Intra-Tumoral Stroma *AND* Invasive Margin *AND* Tumor with No Intervening Stroma | 1 (0.16%) | 1 (1.39%) | 0 (0%) |
| Intra-Tumoral Stroma *AND* Other Regions | 2 (0.31%) | 0 (0%) | 2 (2.78%) |
| Intra-Tumoral Stroma *AND* Tumor with No Intervening Stroma | 4 (0.62%) | 1 (1.39%) | 0 (0%) |
| Invasive Margin | 8 (1.25%) | 2 (2.78%) | 1 (1.39%) |
| Invasive Margin *AND* Other Regions | 1 (0.16%) | 1 (1.39%) | 0 (0%) |
| Other Regions | 80 (12.5%) | 7 (9.72%) | 12 (16.67%) |
| Tumor with No Intervening Stroma | 9 (1.41%) | 5 (6.94%) | 0 (0%) |
| Pitfall Type | Pitfall Summary |
|---|---|
| Percent of Tumor-Associated Stroma | Exclude thick-walled vessels, benign glandular elements, adipocytes, carcinoma in situ, and necrosis from the area of tumor-associated stroma |
| Calculate with respect to the entire ROI area | |
| Variations in tumor cell morphology can make it difficult to distinguish stroma from tumor | |
| sTILs Density Score | Cells with small/pyknotic nuclei and/or perinuclear clearing can be difficult to categorize |
| Non-lymphoid cells may be confused for lymphocytes | |
| Error in the percent tumor-associated stroma can affect the sTILs density | |
| Sparsely distributed tumor cells may be more challenging to quantitate |
Publisher’s Note: MDPI stays neutral with regard to jurisdictional claims in published maps and institutional affiliations. |
© 2022 by the authors. Licensee MDPI, Basel, Switzerland. This article is an open access article distributed under the terms and conditions of the Creative Commons Attribution (CC BY) license (https://creativecommons.org/licenses/by/4.0/).
Share and Cite
Garcia, V.; Elfer, K.; Peeters, D.J.E.; Ehinger, A.; Werness, B.; Ly, A.; Li, X.; Hanna, M.G.; Blenman, K.R.M.; Salgado, R.; et al. Development of Training Materials for Pathologists to Provide Machine Learning Validation Data of Tumor-Infiltrating Lymphocytes in Breast Cancer. Cancers 2022, 14, 2467. https://doi.org/10.3390/cancers14102467
Garcia V, Elfer K, Peeters DJE, Ehinger A, Werness B, Ly A, Li X, Hanna MG, Blenman KRM, Salgado R, et al. Development of Training Materials for Pathologists to Provide Machine Learning Validation Data of Tumor-Infiltrating Lymphocytes in Breast Cancer. Cancers. 2022; 14(10):2467. https://doi.org/10.3390/cancers14102467
Chicago/Turabian StyleGarcia, Victor, Katherine Elfer, Dieter J. E. Peeters, Anna Ehinger, Bruce Werness, Amy Ly, Xiaoxian Li, Matthew G. Hanna, Kim R. M. Blenman, Roberto Salgado, and et al. 2022. "Development of Training Materials for Pathologists to Provide Machine Learning Validation Data of Tumor-Infiltrating Lymphocytes in Breast Cancer" Cancers 14, no. 10: 2467. https://doi.org/10.3390/cancers14102467
APA StyleGarcia, V., Elfer, K., Peeters, D. J. E., Ehinger, A., Werness, B., Ly, A., Li, X., Hanna, M. G., Blenman, K. R. M., Salgado, R., & Gallas, B. D. (2022). Development of Training Materials for Pathologists to Provide Machine Learning Validation Data of Tumor-Infiltrating Lymphocytes in Breast Cancer. Cancers, 14(10), 2467. https://doi.org/10.3390/cancers14102467