
SIPA1 Is a Modulator of HGF/MET Induced Tumour Metastasis via the Regulation of Tight Junction-Based Cell to Cell Barrier Function


Abstract
Simple Summary
Abstract
1. Introduction
2. Materials and Methods
2.1. Lung Cancer Tissue Samples
2.2. Cell Culture
2.3. Establishment of the Stable SIPA1 Knockdown Cell Lines
2.4. RNA Extraction and PCR
2.5. Protein Extraction and Western Blotting
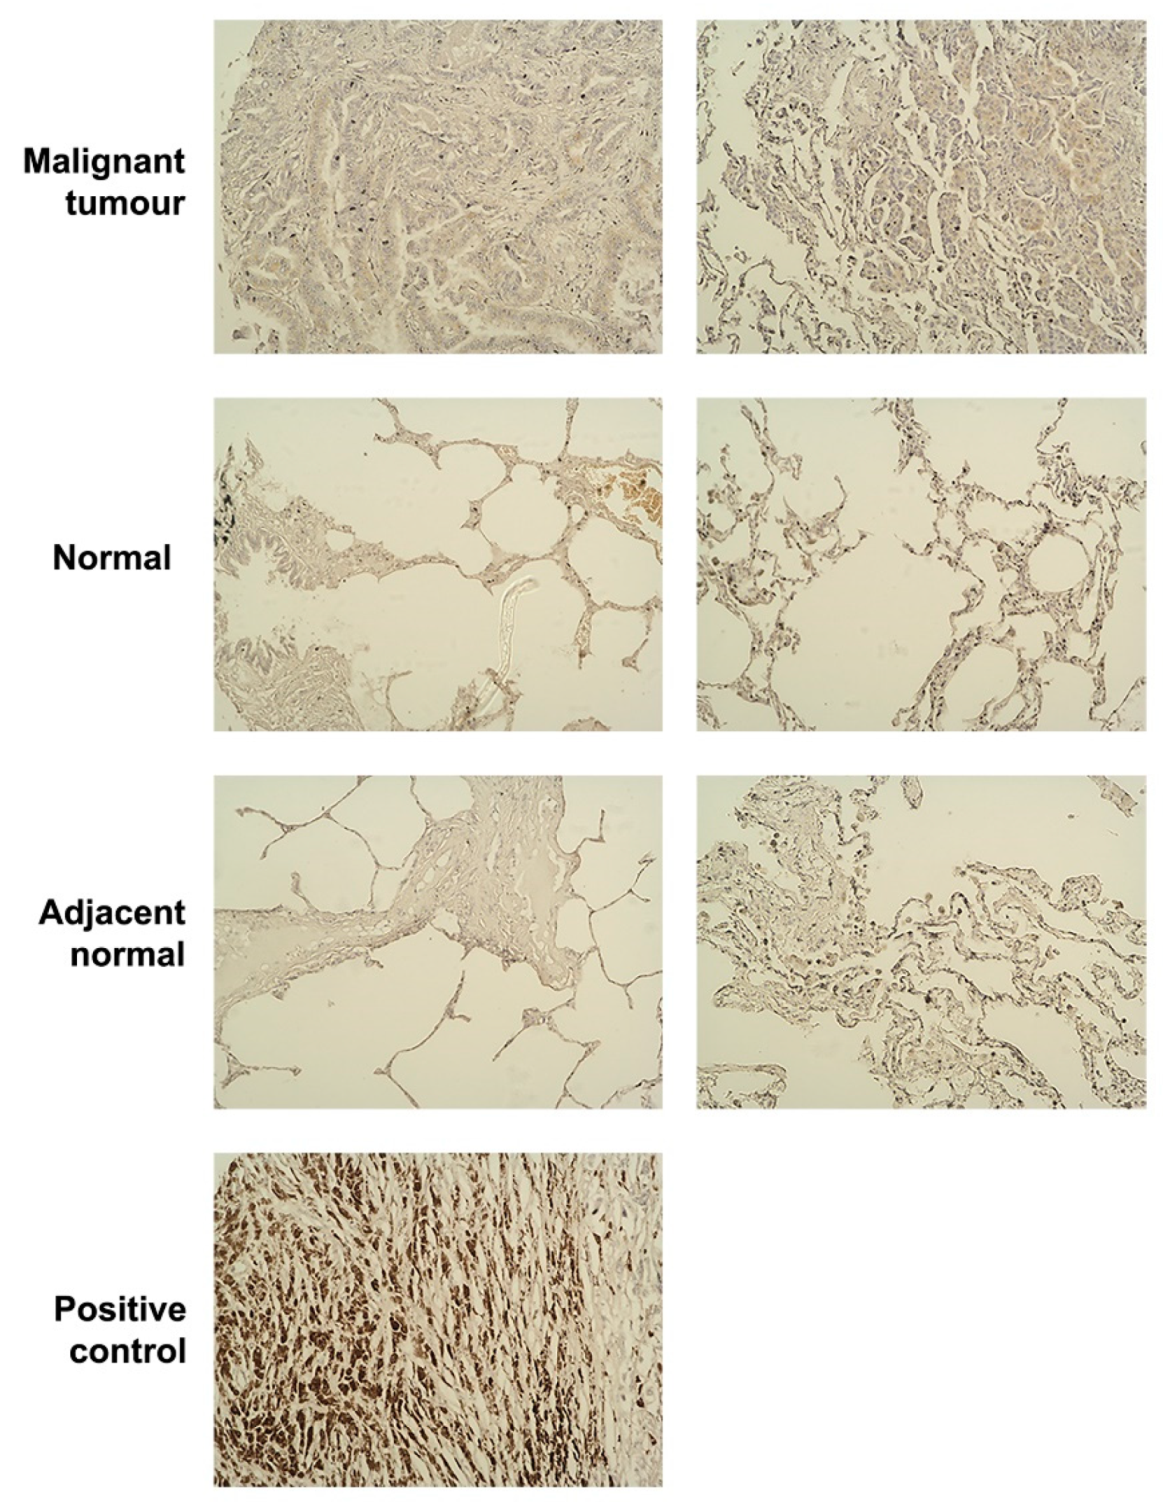
2.6. Tissue Microarray (TMA) and Immunohistochemistry (IHC)
2.7. Immunofluorescence (IFC)
2.8. Protein Array
2.9. Transendothelial Resistance (TER) Assay
2.10. Electric Cell-Substrate Impedance Sensing (ECIS) Assay
2.11. In-Vitro Cell Proliferation Assay
2.12. In-Vitro Transwell Matrigel Invasion Assays
2.13. Statistical Analysis
3. Results
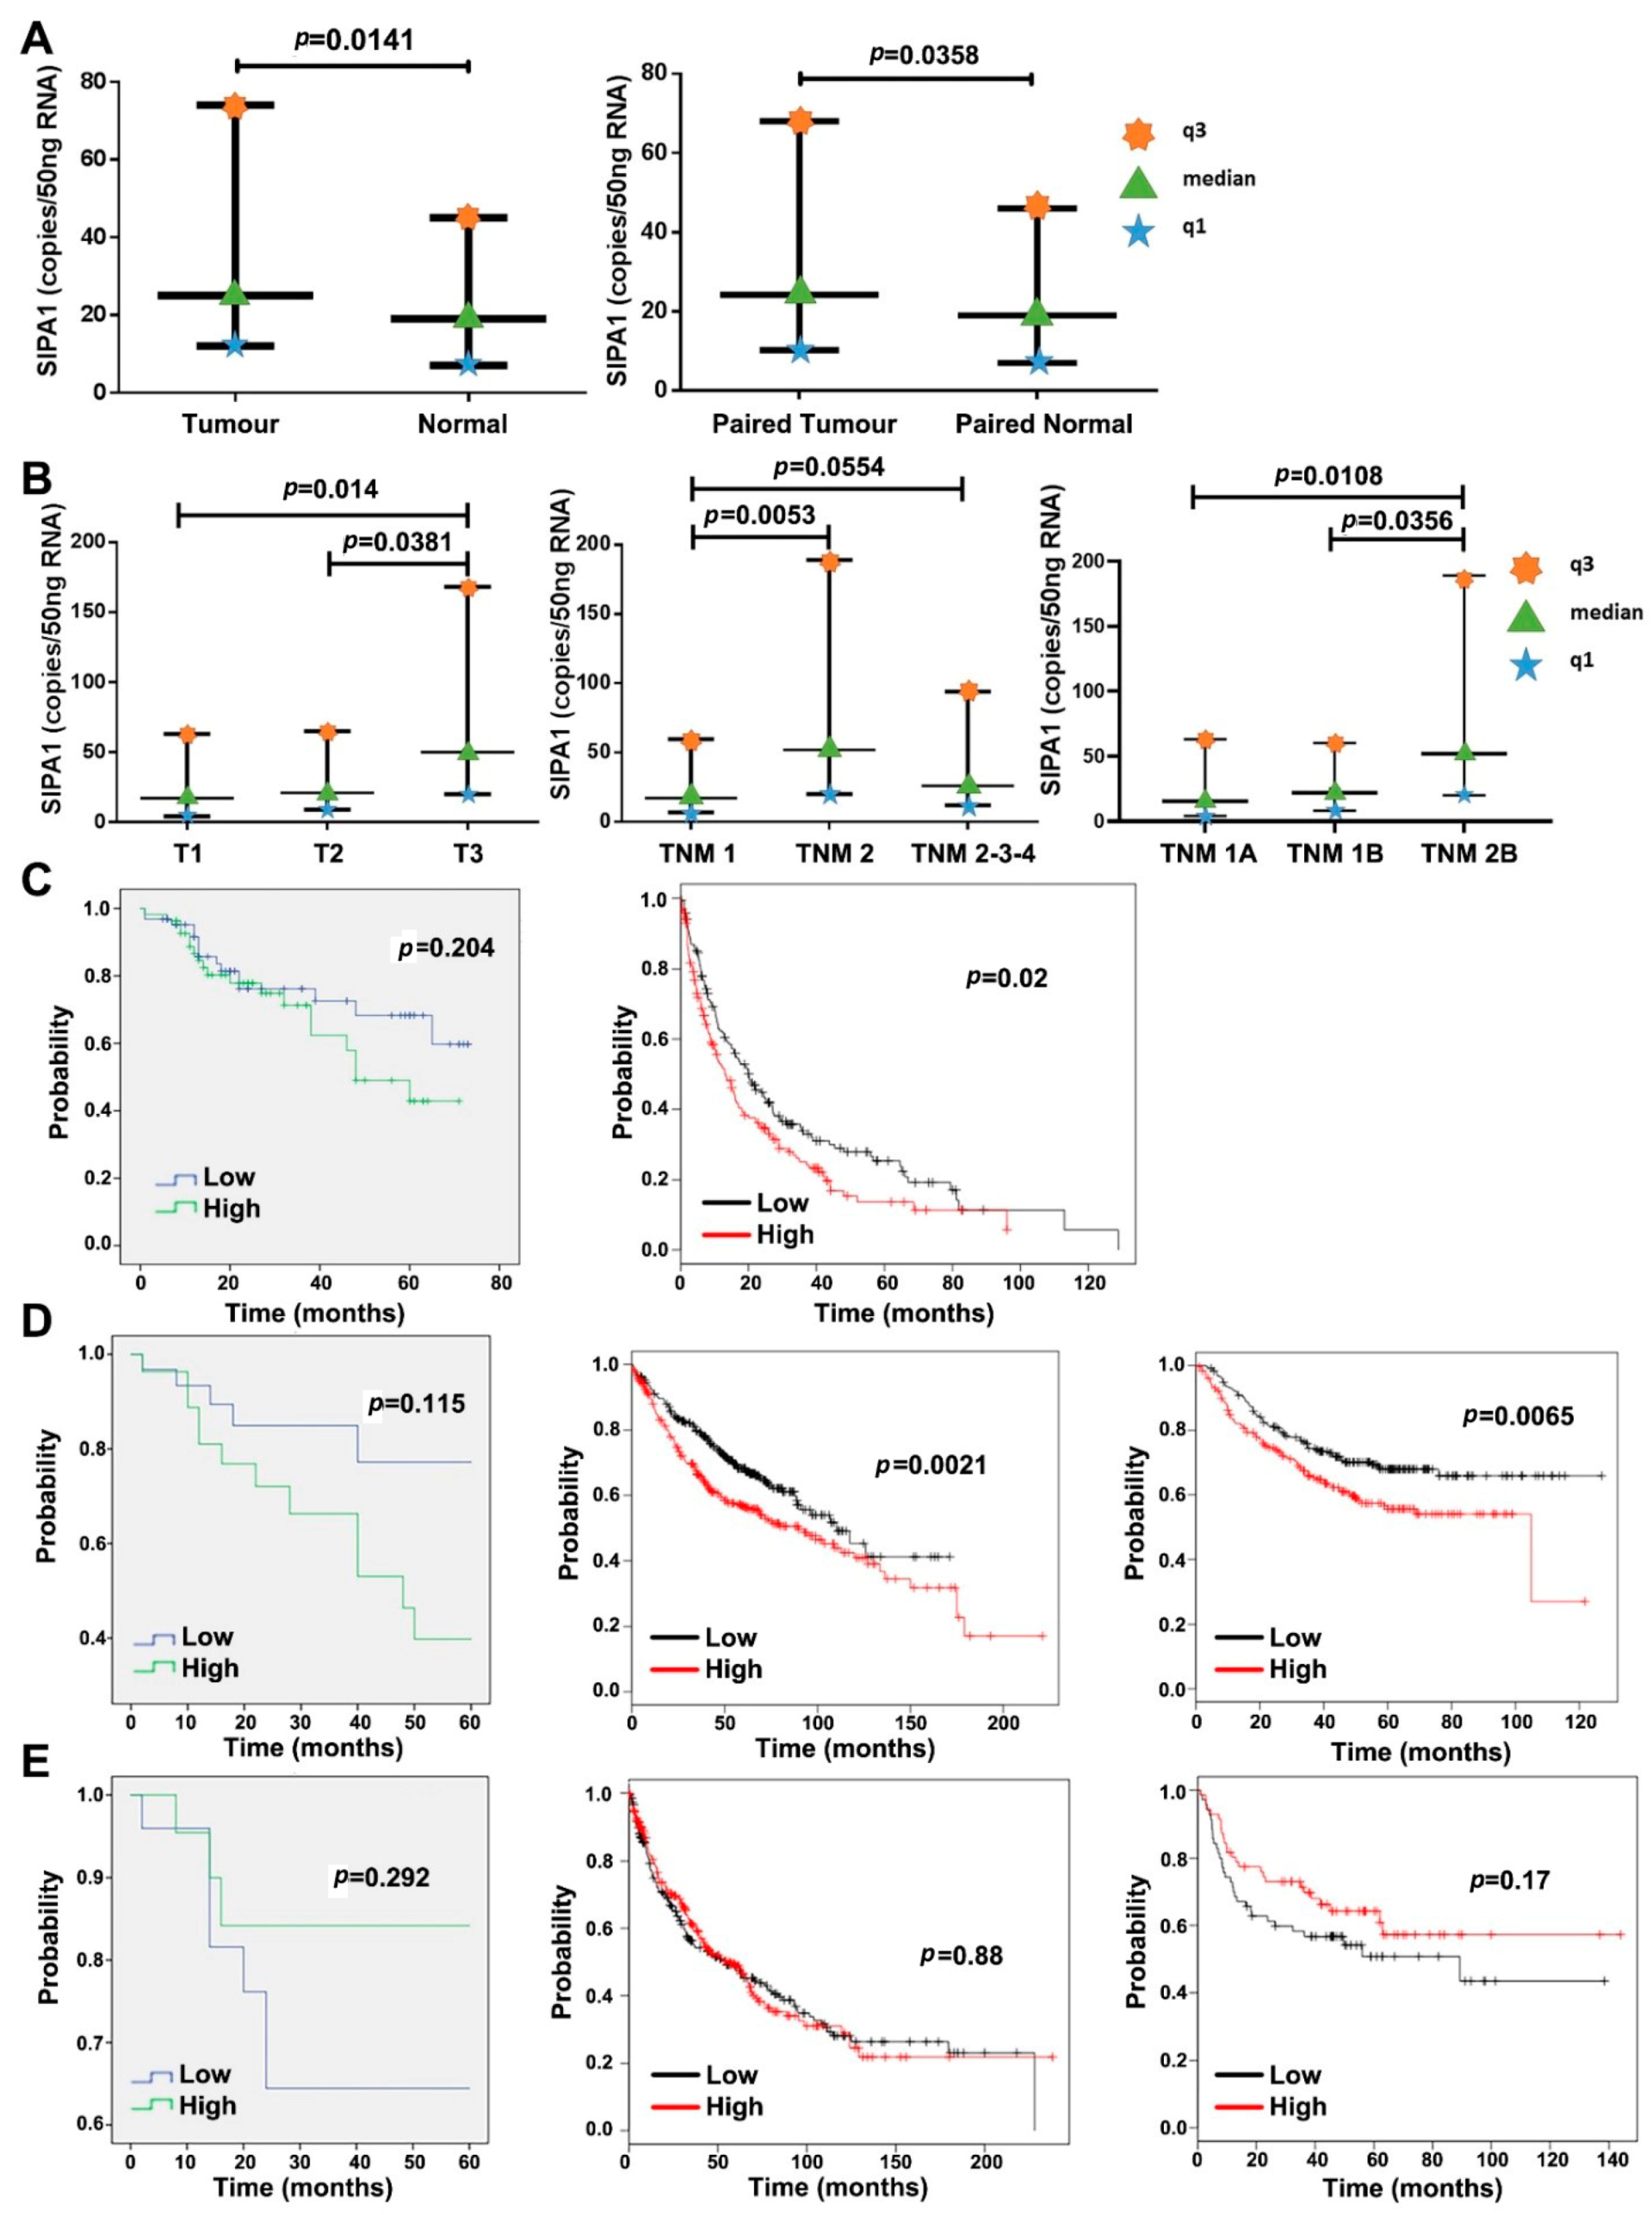
3.1. The Expression Level of SIPA1 in Lung Cancer and Its Clinical Relevance
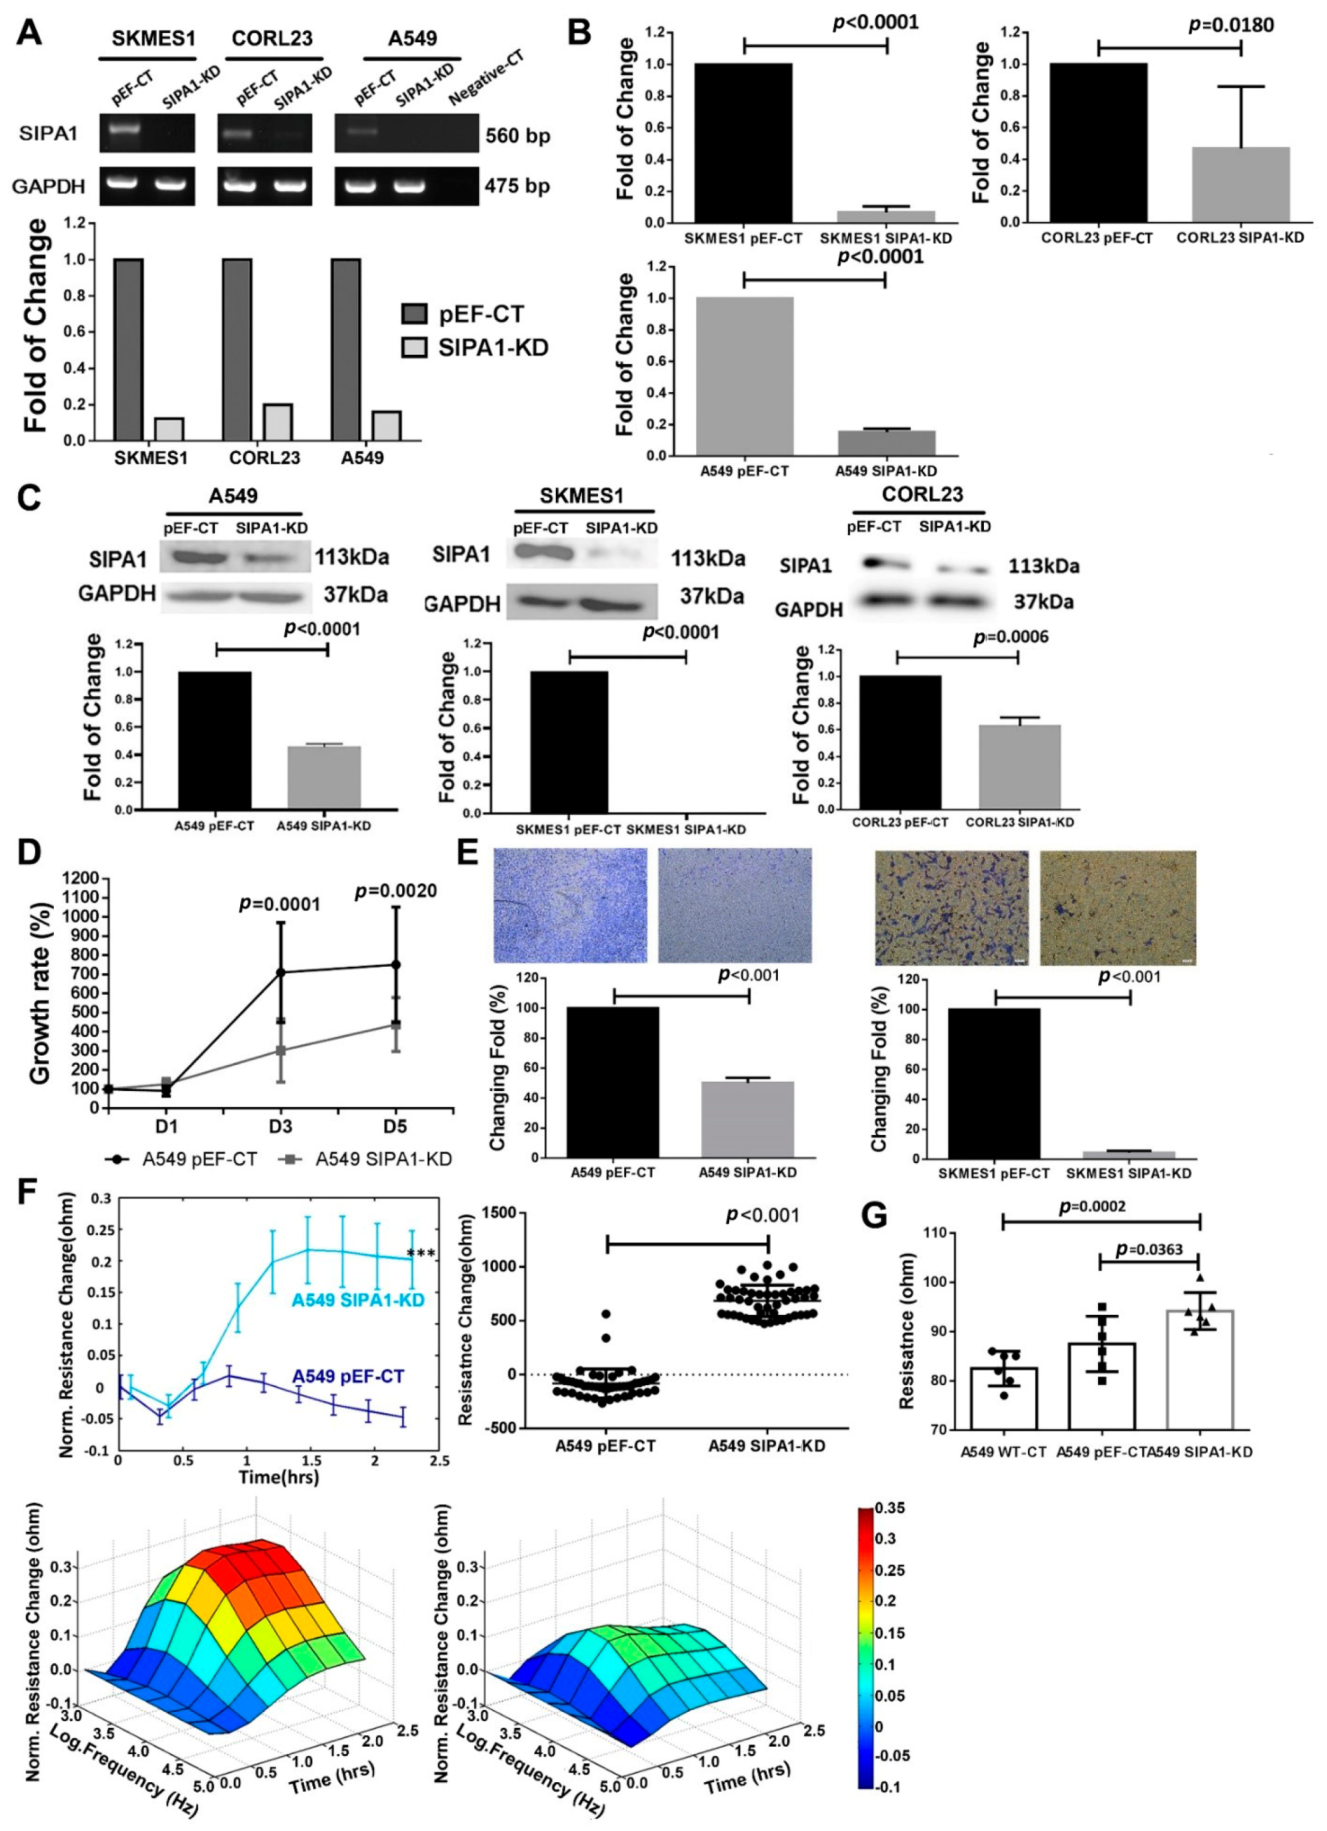
3.2. Knockdown of SIPA1 Decreased the Proliferation and Invasion Potential of Lung Cancer Cells
3.3. Knockdown of SIPA1 Enhanced the Tight Junction Based Barrier Function of Lung Cancer Cells
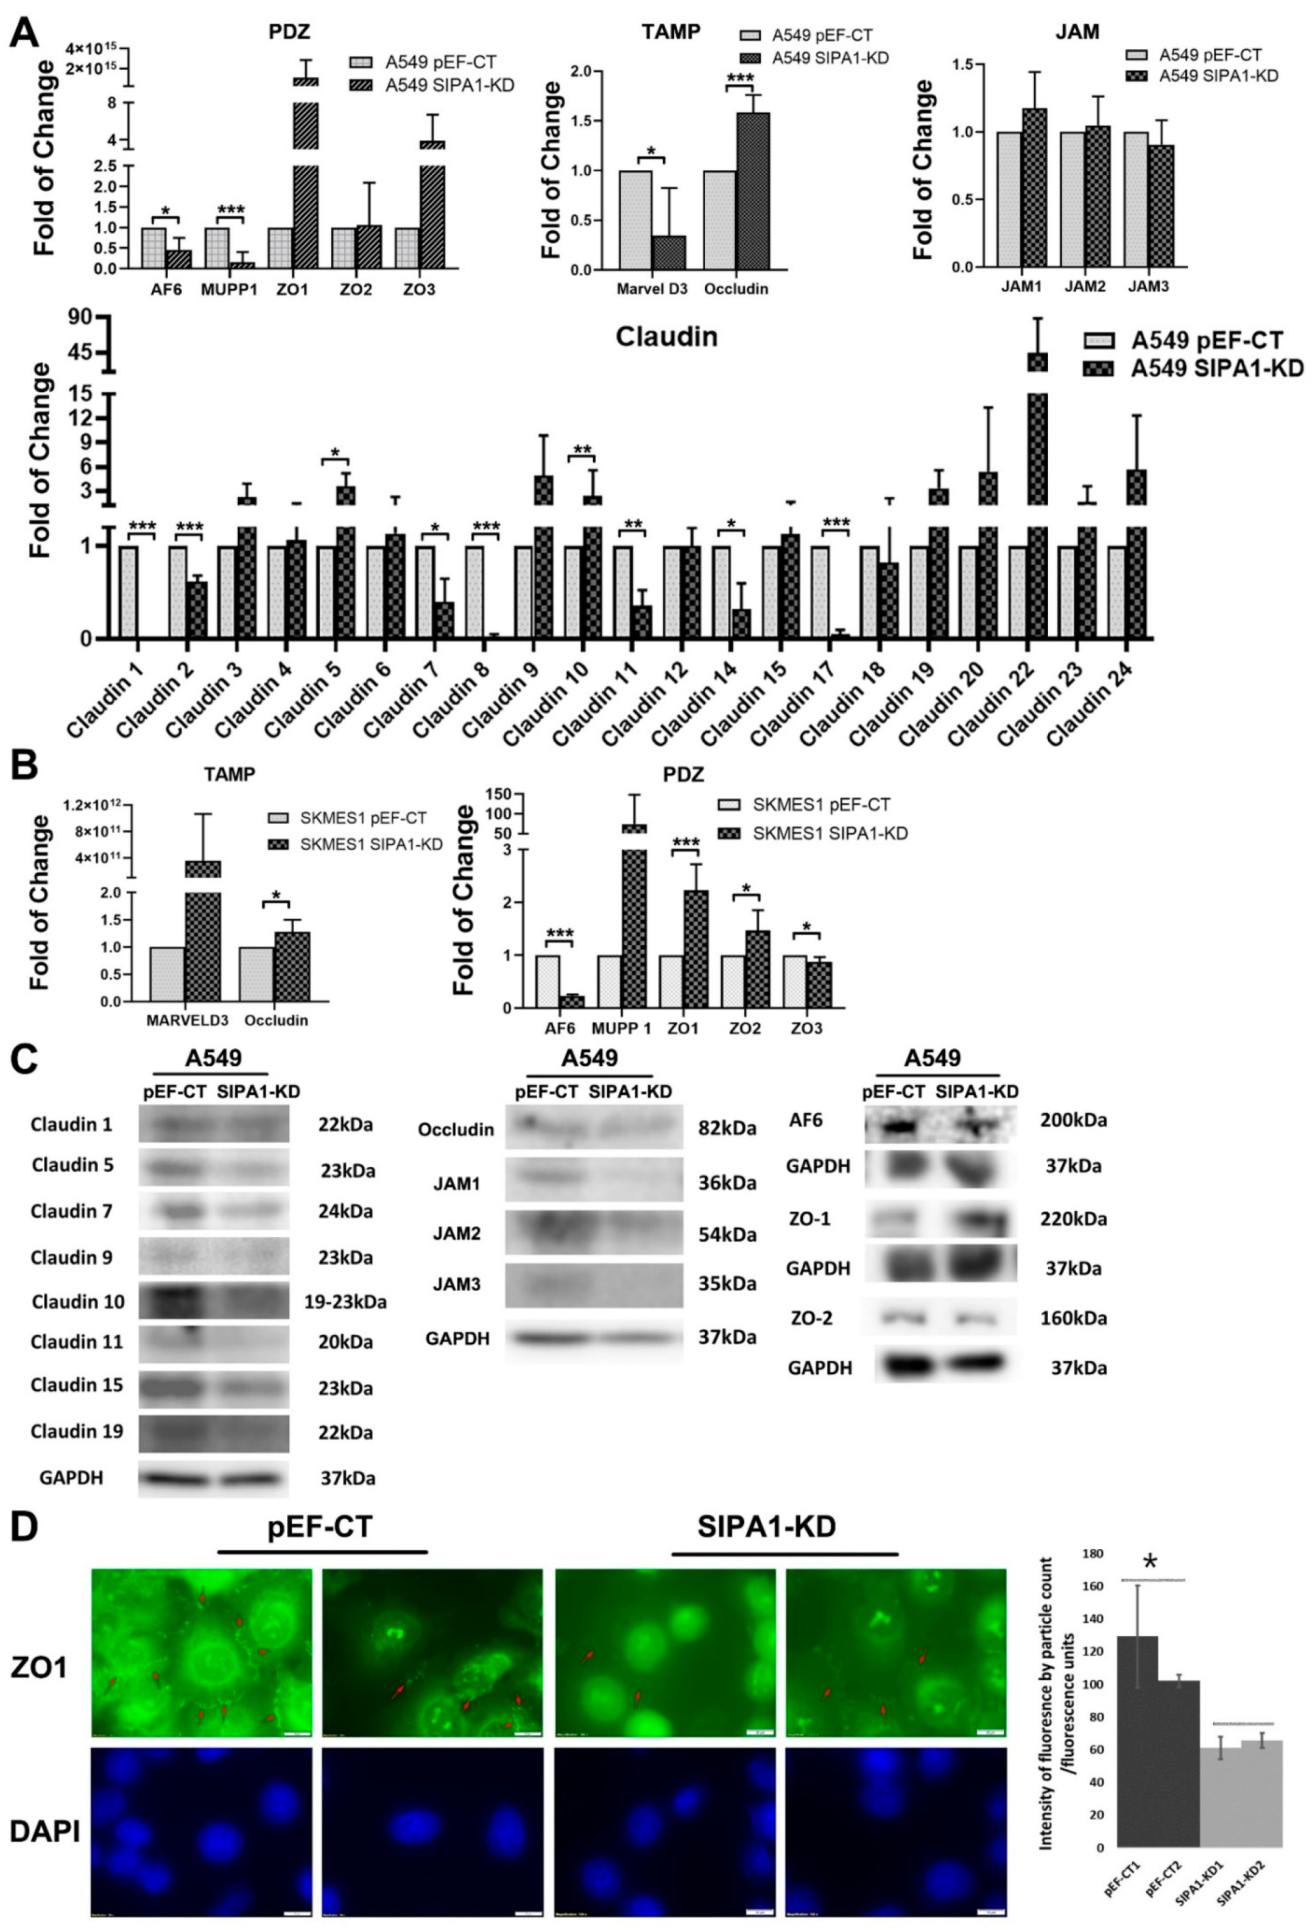
3.4. TJ Markers Were Influenced by SIPA1 in Lung Cancer Cells
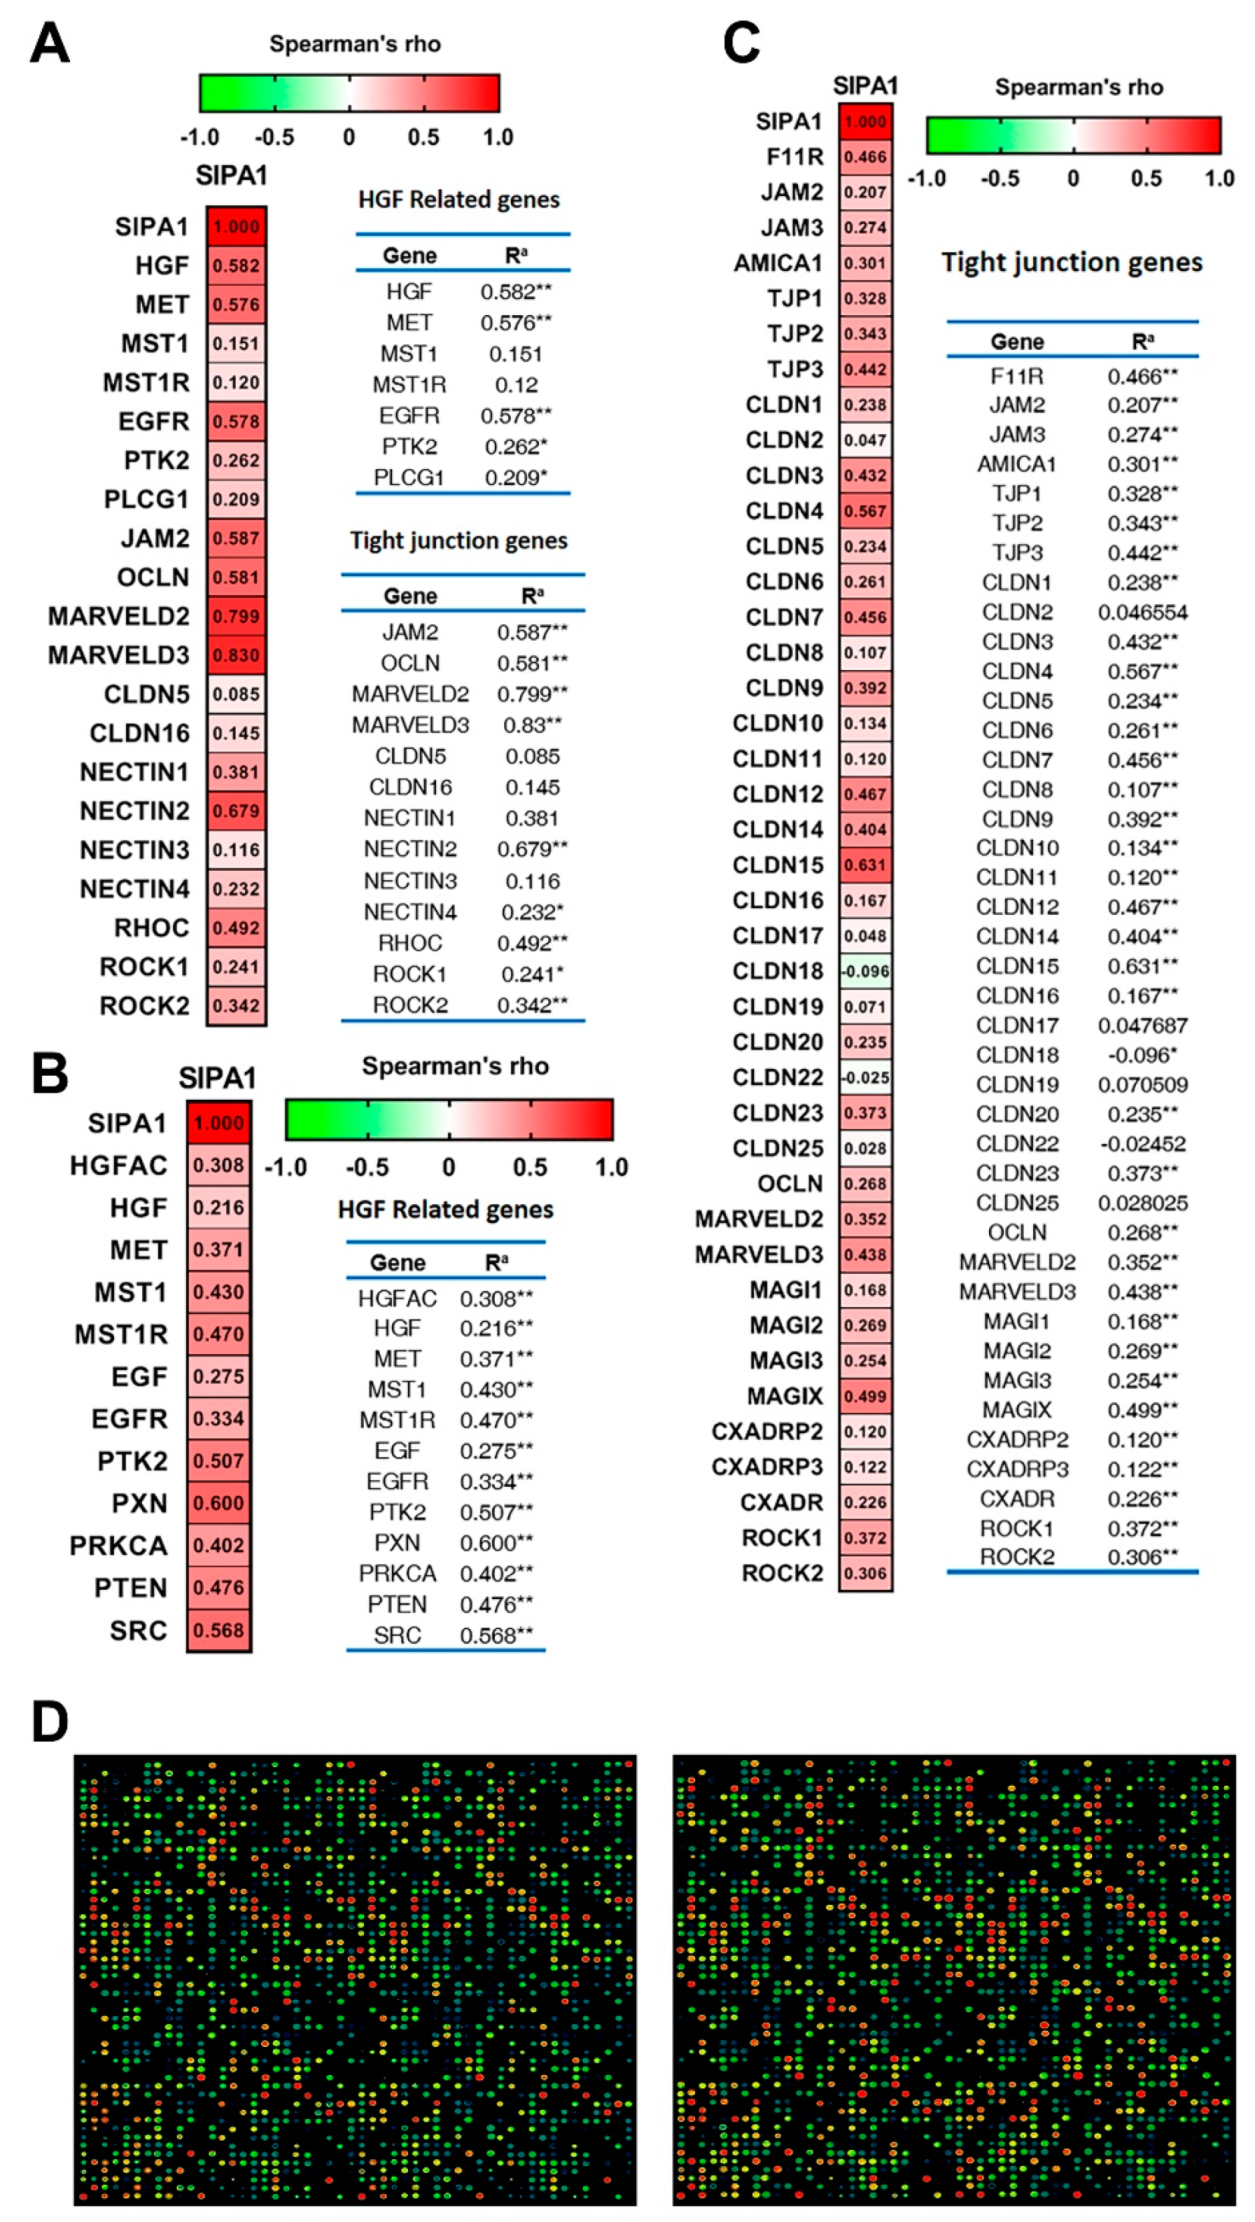
3.5. SIPA1 Was Correlated with HGF/MET Signalling Pathway and Tight Junctions
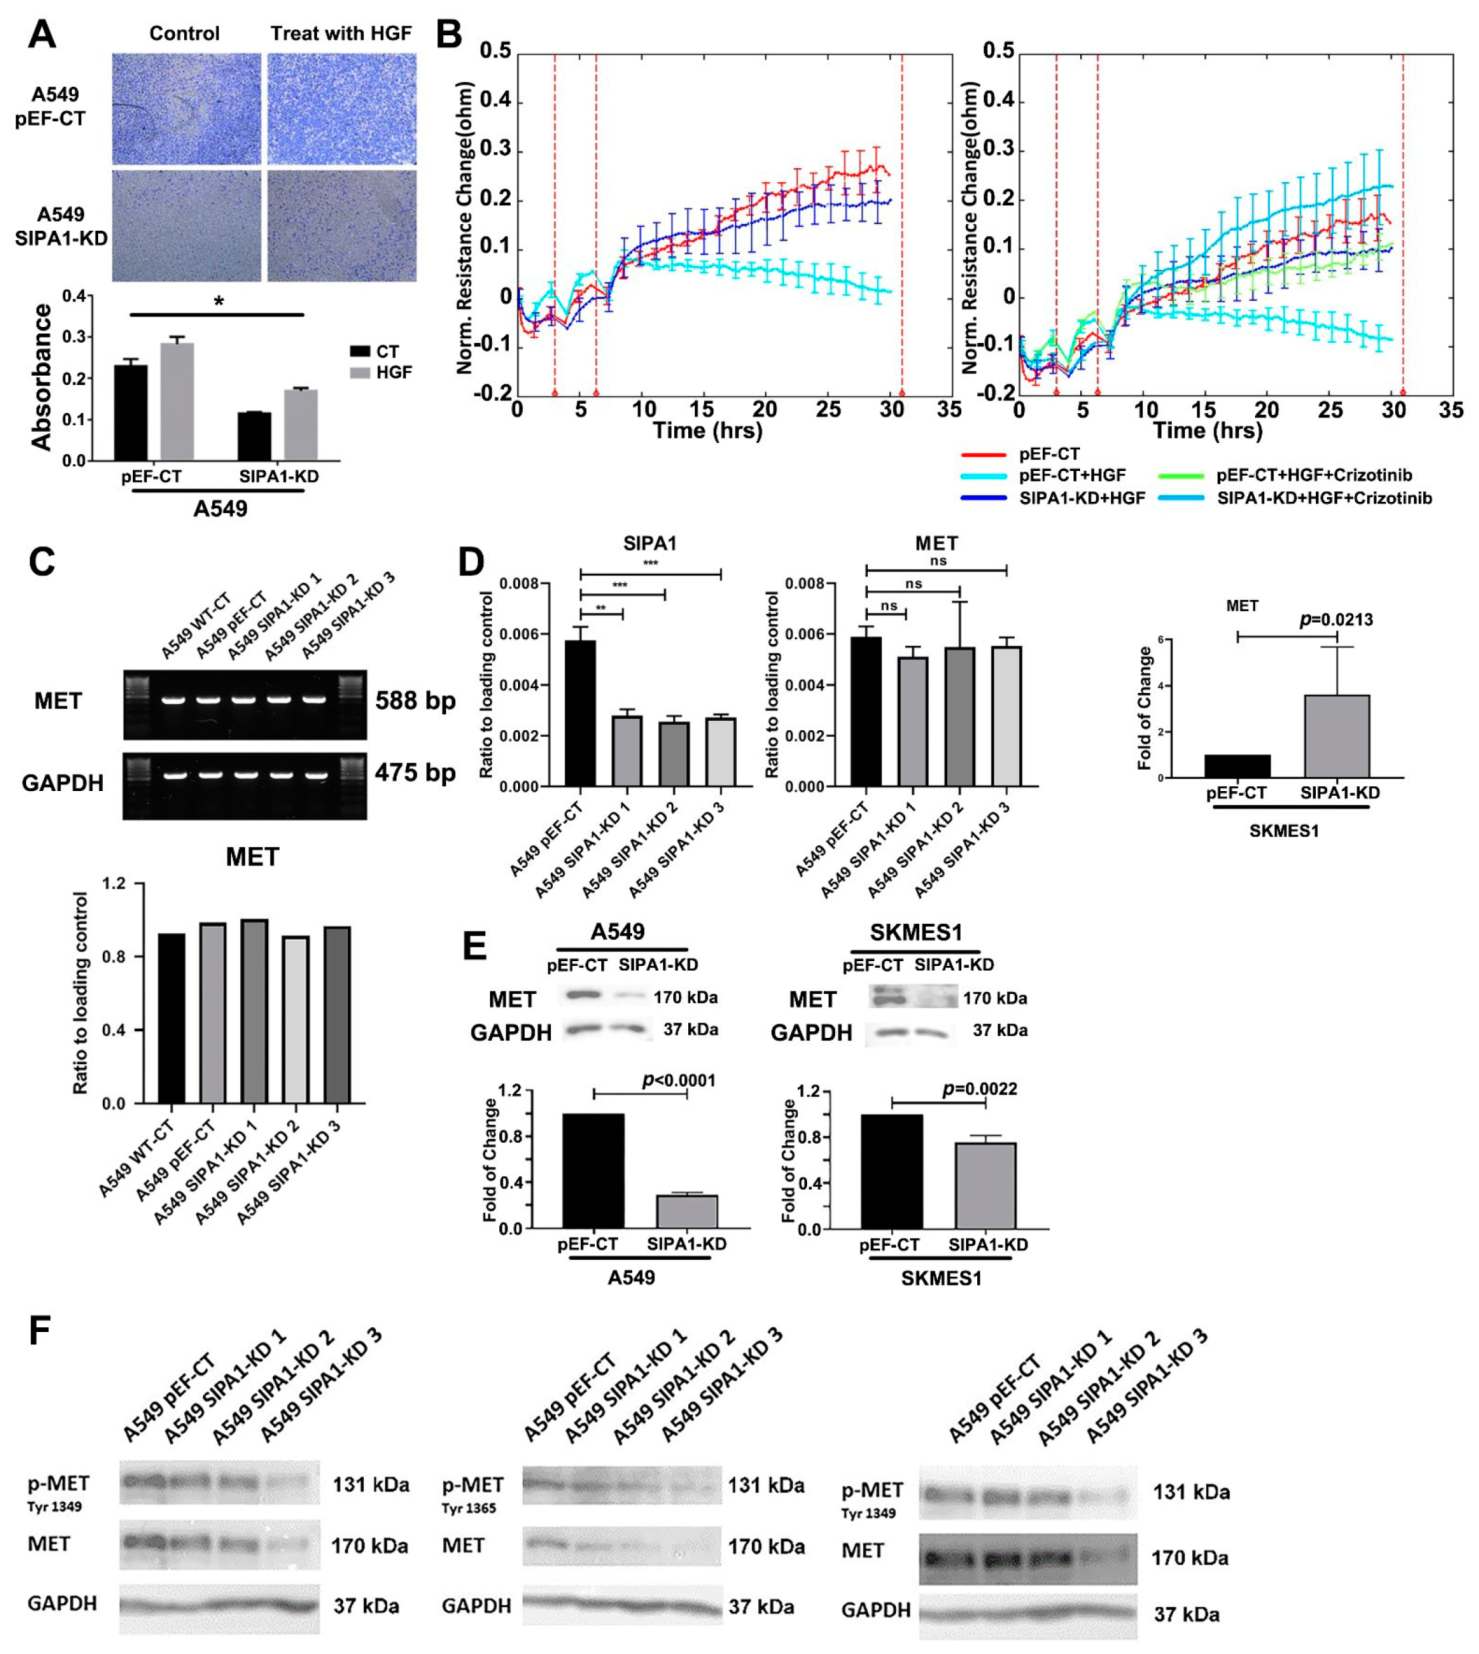
3.6. SIPA1 Was Involved in the Regulation of HGF/MET on TJs in Lung Cancer Cells
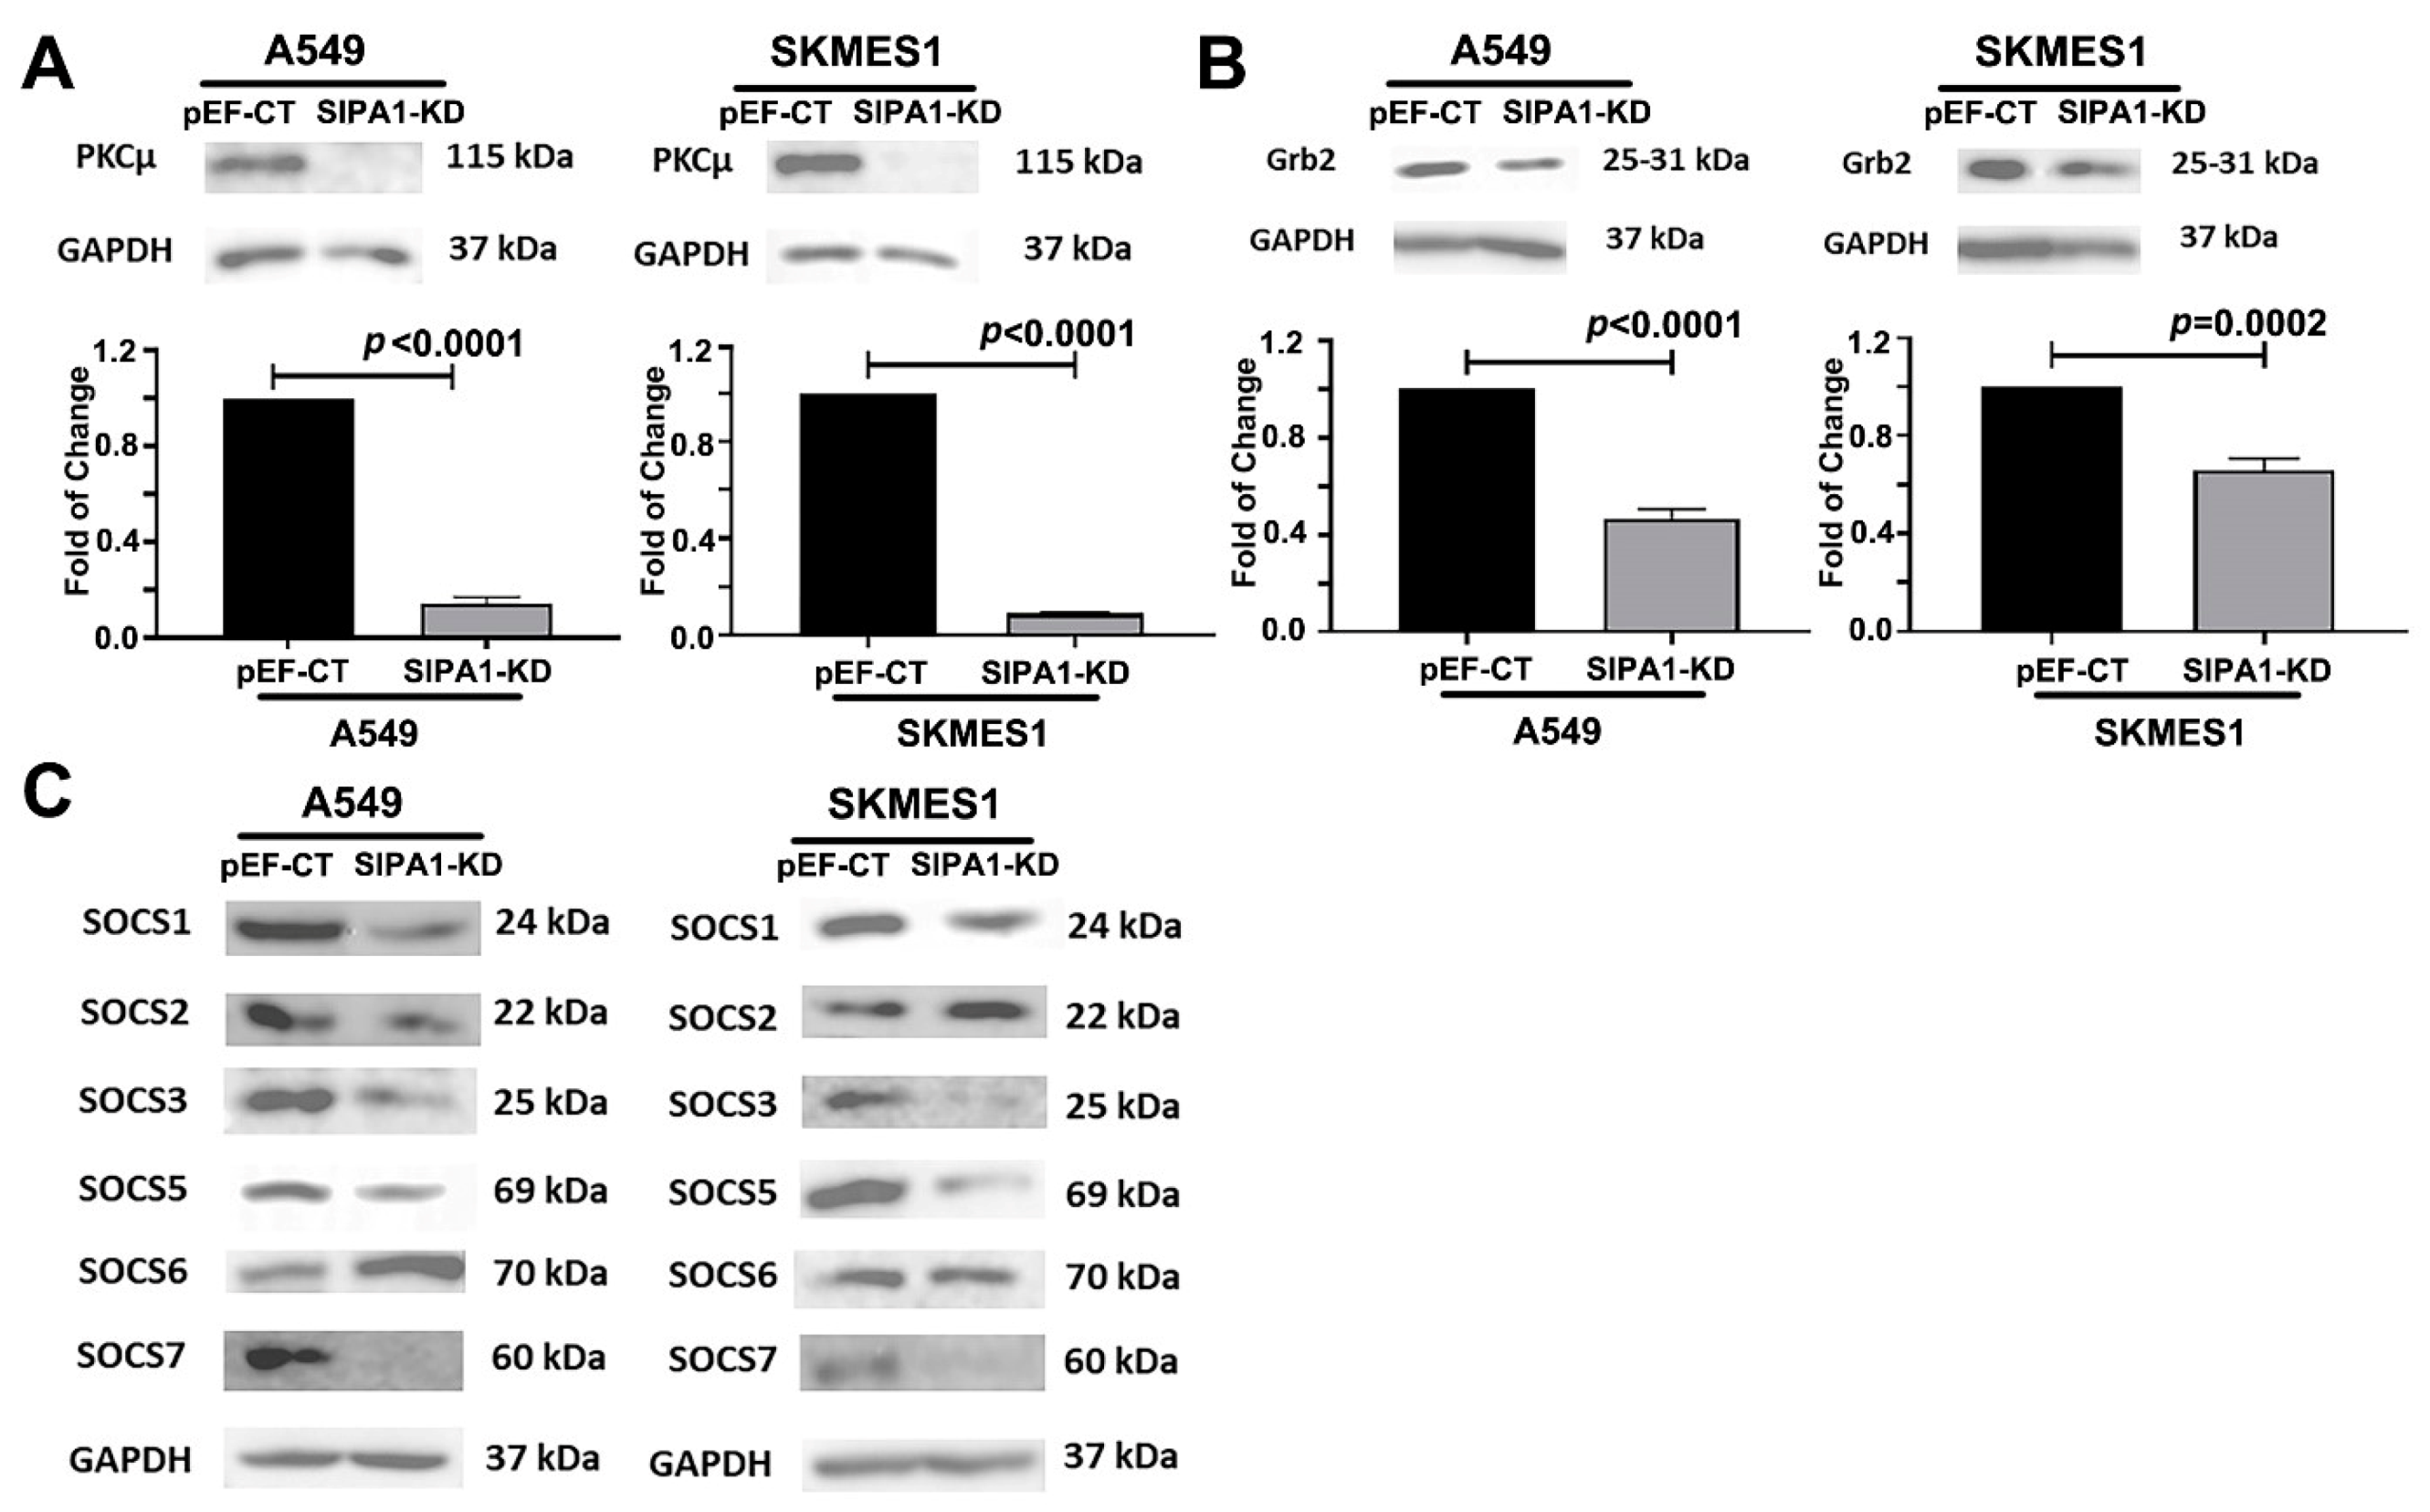
3.7. SIPA1 Regulates MET at the Protein Level, by Regulating the Internalization and Reuse of MET
4. Discussion
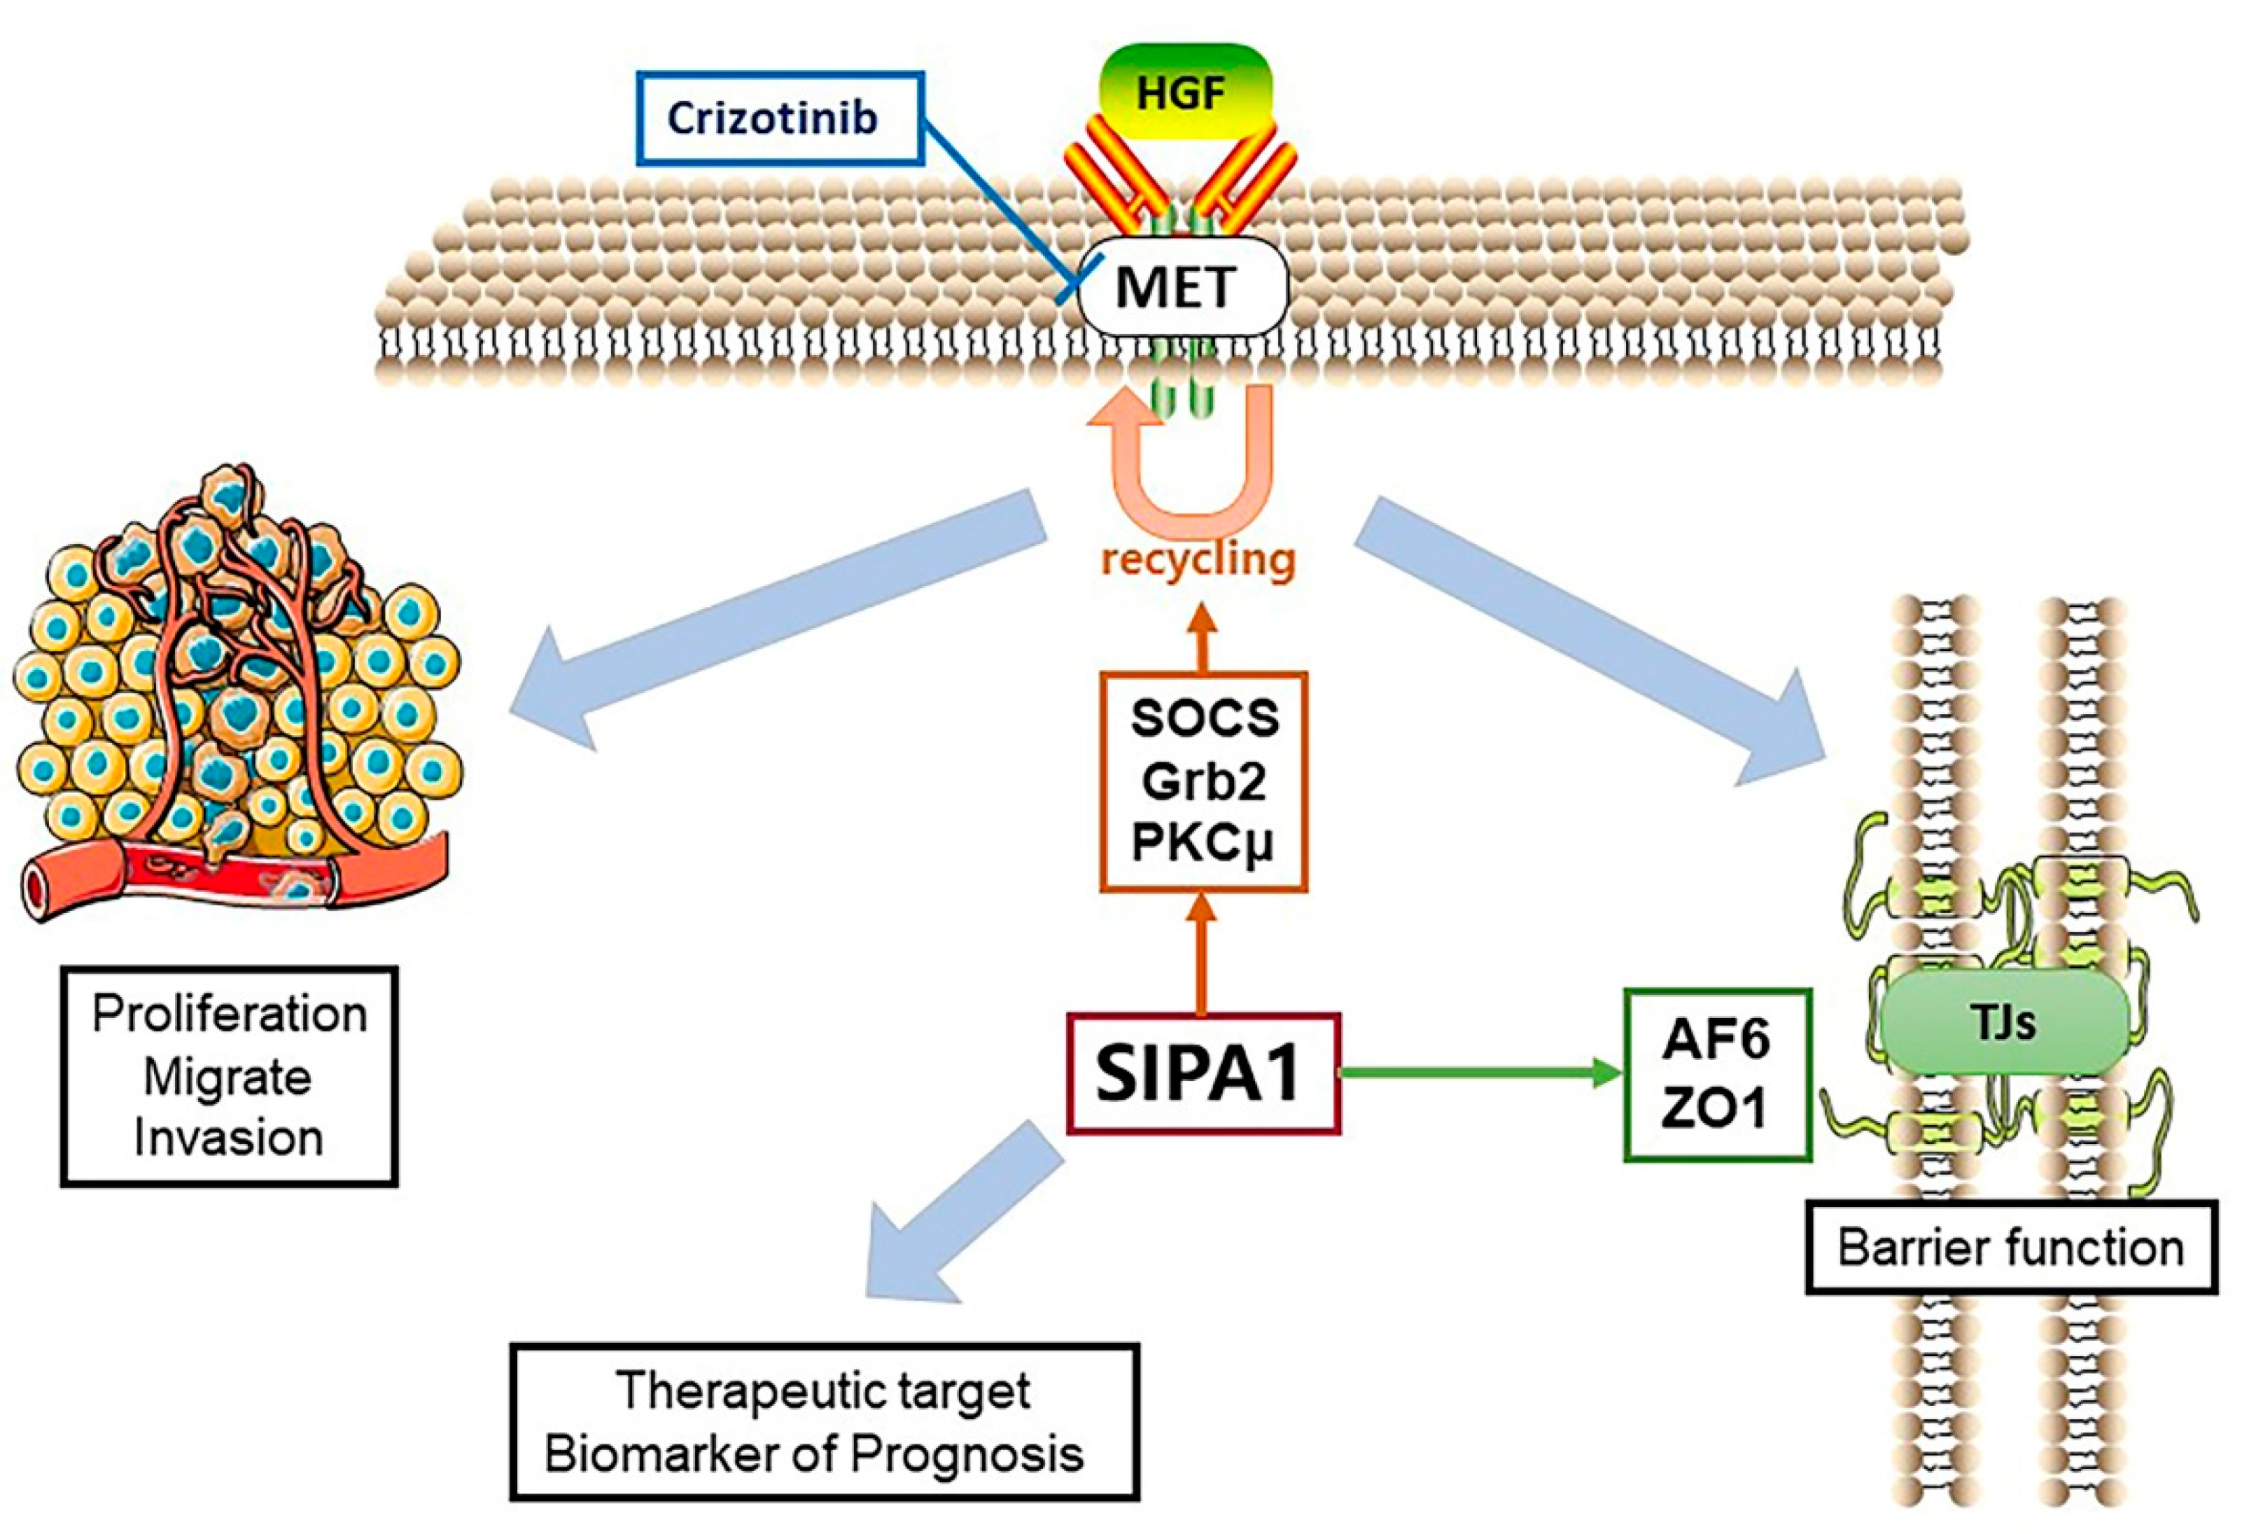
5. Conclusions
Supplementary Materials
Author Contributions
Funding
Institutional Review Board Statement
Informed Consent Statement
Data Availability Statement
Acknowledgments
Conflicts of Interest
References
- Siegel, R.L.; Miller, K.D.; Jemal, A. Cancer statistics, 2018. CA Cancer J. Clin. 2018, 68, 7–30. [Google Scholar] [CrossRef]
- Jamal-Hanjani, M.; Wilson, G.A.; McGranahan, N.; Birkbak, N.J.; Watkins, T.B.K.; Veeriah, S.; Shafi, S.; Johnson, D.H.; Mitter, R.; Rosenthal, R.; et al. Tracking the Evolution of Non-Small-Cell Lung Cancer. N. Engl. J. Med. 2017, 376, 2109–2121. [Google Scholar] [CrossRef]
- Chen, Z.; Fillmore, C.M.; Hammerman, P.S.; Kim, C.F.; Wong, K.K. Non-small-cell lung cancers: A heterogeneous set of diseases. Nat. Rev. Can. 2014, 14, 535–546. [Google Scholar] [CrossRef]
- Herbst, R.S.; Morgensztern, D.; Boshoff, C. The biology and management of non-small cell lung cancer. Nature 2018, 553, 446–454. [Google Scholar] [CrossRef] [PubMed]
- Collisson, E.A.; Campbell, J.D.; Brooks, A.N.; Berger, A.H.; Lee, W.; Chmielecki, J.; Beer, D.G.; Cope, L.; Creighton, C.J.; Danilova, L.; et al. Comprehensive molecular profiling of lung adenocarcinoma. Nature 2014, 511, 543–550. [Google Scholar] [CrossRef]
- Hammerman, P.S.; Lawrence, M.S.; Voet, D.; Jing, R.; Cibulskis, K.; Sivachenko, A.; Stojanov, P.; McKenna, A.; Lander, E.S.; Gabriel, S.; et al. Comprehensive genomic characterization of squamous cell lung cancers. Nature 2012, 489, 519–525. [Google Scholar] [CrossRef]
- Ma, P.C.; Jagadeeswaran, R.; Jagadeesh, S.; Tretiakova, M.S.; Nallasura, V.; Fox, E.A.; Hansen, M.; Schaefer, E.; Naoki, K.; Lader, A.; et al. Functional Expression and Mutations of c-Met and Its Therapeutic Inhibition with SU11274 and Small Interfering RNA in Non–Small Cell Lung Cancer. Cancer Res. 2005, 65, 1479–1488. [Google Scholar] [CrossRef] [PubMed]
- Wu, Y.L.; Soo, R.A.; Locatelli, G.; Stammberger, U.; Scagliotti, G.; Park, K. Does c-Met remain a rational target for therapy in patients with EGFR TKI-resistant non-small cell lung cancer? Cancer Treat. Rev. 2017, 61, 70–81. [Google Scholar] [CrossRef] [PubMed]
- Birchmeier, C.; Birchmeier, W.; Gherardi, E.; Woude, G.F.V. Met, metastasis, motility and more. Nat. Rev. Mol. Cell. Biol. 2003, 4, 915–925. [Google Scholar] [CrossRef] [PubMed]
- Lemmon, M.A.; Schlessinger, J. Cell signaling by receptor tyrosine kinases. Cell 2010, 141, 1117–1134. [Google Scholar] [CrossRef]
- Martin, T.A. The role of tight junctions in cancer metastasis. Semin. Cell Dev. Biol. 2014, 36, 224–231. [Google Scholar] [CrossRef]
- Trusolino, L.; Bertotti, A.; Comoglio, P.M. MET signalling: Principles and functions in development, organ regeneration and cancer. Nat. Rev. Mol. Cell Biol. 2010, 11, 834–848. [Google Scholar] [CrossRef] [PubMed]
- Martin, T.A.; Jiang, W.G. Expression of the Nectin complex in Human Breast Cancer and the role of Nectin-3 in the control of tight junctions during metastasis. PLoS ONE 2013, 8, e82696. [Google Scholar] [CrossRef] [PubMed]
- Martin, T.A.; Jiang, W.G. Loss of tight junction barrier function and its role in cancer metastasis. Biochim. Biophys. Acta 2009, 1788, 872–891. [Google Scholar] [CrossRef] [PubMed]
- Martin, T.A.; Mansel, R.E.; Jiang, W.G. Antagonistic effect of NK4 on HGF/SF induced changes in the transendothelial resistance (TER) and paracellular permeability of human vascular endothelial cells. J. Cell. Physiol. 2002, 192, 268–275. [Google Scholar] [CrossRef] [PubMed]
- Jiang, W.G.; Martin, T.A.; Matsumoto, K.; Nakamura, T.; Mansel, R.E. Hepatocyte growth factor/scatter factor decreases the expression of occludin and transendothelial resistance (TER) and increases paracellular permeability in human vascular endothelial cells. J. Cell. Physiol. 1999, 181, 319–329. [Google Scholar] [CrossRef]
- Jiang, W.G.; Hiscox, S.E.; Parr, C.; Martin, T.A.; Matsumoto, K.; Nakamura, T.; Mansel, R.E. Antagonistic effect of NK4, a novel hepatocyte growth factor variant, on in vitro angiogenesis of human vascular endothelial cells. Clin. Cancer Res. 1999, 5, 3695–3703. [Google Scholar]
- Martin, T.A.; Watkins, G.; Mansel, R.E.; Jiang, W.G. Hepatocyte growth factor disrupts tight junctions in human breast cancer cells. Cell Biol. Int. 2004, 28, 361–371. [Google Scholar] [CrossRef]
- Martin, T.A.; Mason, M.D.; Jiang, W.G. HGF and the regulation of tight junctions in human prostate cancer cells. Oncol. Rep. 2014, 32, 213–224. [Google Scholar] [CrossRef]
- Hattori, M.; Tsukamoto, N.; Nur-e-Kamal, M.S.; Rubinfeld, B.; Iwai, K.; Kubota, H.; Maruta, H.; Minato, N. Molecular cloning of a novel mitogen-inducible nuclear protein with a Ran GTPase-activating domain that affects cell cycle progression. Mol. Cell Biol. 1995, 15, 552–560. [Google Scholar] [CrossRef]
- Kurachi, H.; Wada, Y.; Tsukamoto, N.; Maeda, M.; Kubota, H.; Hattori, M.; Iwai, K.; Minato, N. Human SPA-1 gene product selectively expressed in lymphoid tissues is a specific GTPase-activating protein for Rap1 and Rap2. Segregate expression profiles from a rap1GAP gene product. J. Biol. Chem. 1997, 272, 28081–28088. [Google Scholar] [CrossRef]
- Liu, C.; Jiang, W.G.; Hargest, R.; Martin, T.A. The role of SIPA1 in the development of cancer and metastases (Review). Mol. Clin. Oncol. 2020, 13, 32. [Google Scholar] [CrossRef]
- Zhang, Y.; Gong, Y.; Hu, D.; Zhu, P.; Wang, N.; Zhang, Q.; Wang, M.; Aldeewan, A.; Xia, H.; Qu, X.; et al. Nuclear SIPA1 activates integrin beta1 promoter and promotes invasion of breast cancer cells. Oncogene 2015, 34, 1451–1462. [Google Scholar] [CrossRef] [PubMed]
- Shimizu, Y.; Hamazaki, Y.; Hattori, M.; Doi, K.; Terada, N.; Kobayashi, T.; Toda, Y.; Yamasaki, T.; Inoue, T.; Kajita, Y.; et al. SPA-1 controls the invasion and metastasis of human prostate cancer. Cancer Sci. 2011, 102, 828–836. [Google Scholar] [CrossRef] [PubMed]
- Takahara, T.; Kasamatsu, A.; Yamatoji, M.; Iyoda, M.; Kasama, H.; Saito, T.; Takeuchi, S.; Endo-Sakamoto, Y.; Shiiba, M.; Tanzawa, H.; et al. SIPA1 promotes invasion and migration in human oral squamous cell carcinoma by ITGB1 and MMP7. Exp. Cell Res. 2017, 352, 357–363. [Google Scholar] [CrossRef] [PubMed]
- Ji, K.; Ye, L.; Toms, A.M.; Hargest, R.; Martin, T.A.; Ruge, F.; Ji, J.; Jiang, W.G. Expression of signal-induced proliferation-associated gene 1 (SIPA1), a RapGTPase-activating protein, is increased in colorectal cancer and has diverse effects on functions of colorectal cancer cells. Cancer Genom. Proteom. 2012, 9, 321–327. [Google Scholar]
- Brooks, R.; Kizer, N.; Nguyen, L.; Jaishuen, A.; Wanat, K.; Nugent, E.; Grigsby, P.; Allsworth, J.E.; Rader, J.S. Polymorphisms in MMP9 and SIPA1 are associated with increased risk of nodal metastases in early-stage cervical cancer. Gynecol. Oncol. 2010, 116, 539–543. [Google Scholar] [CrossRef]
- Li, J.Y.; Wang, J.B.; Liu, C.B.; Ma, D.L.; Ma, J.H. Dynamic relationship between SIPA1 gene and protein expression and the development of gastric cancer. Genet. Mol. Res. 2017, 16. [Google Scholar] [CrossRef]
- Gdowicz-Klosok, A.; Giglok, M.; Drosik, A.; Suwinski, R.; Butkiewicz, D. The SIPA1-313A>G polymorphism is associated with prognosis in inoperable non-small cell lung cancer. Tumour Biol. 2015, 36, 1273–1278. [Google Scholar] [CrossRef] [PubMed]
- Xie, C.; Yang, L.; Yang, X.; Yang, R.; Li, Y.; Qiu, F.; Chen, M.; Fang, W.; Bin, X.; Deng, J.; et al. Sipa1 promoter polymorphism predicts risk and metastasis of lung cancer in Chinese. Mol. Carcinog. 2013, 52 (Suppl. 1), E110–E117. [Google Scholar] [CrossRef]
- Mathieu, V.; Pirker, C.; Schmidt, W.M.; Spiegl-Kreinecker, S.; Lotsch, D.; Heffeter, P.; Hegedus, B.; Grusch, M.; Kiss, R.; Berger, W. Aggressiveness of human melanoma xenograft models is promoted by aneuploidy-driven gene expression deregulation. Oncotarget 2012, 3, 399–413. [Google Scholar] [CrossRef] [PubMed]
- Martin, T.A.; Jiang, W.G. Regulation of barrier function in human breast cancer can be controlled by the ROCK signalling pathway via interaction with SIPA-1. Eur. J. Cancer 2013, 49, S132. [Google Scholar]
- Martin, T.A.; Jiang, W.G. Human breast cancer cell tight junction function is regulated by SIPA1. Breast Cancer Res. Treat 2006, 100 (Suppl. 1), s297. [Google Scholar]
- Siegel, R.L.; Miller, K.D.; Jemal, A. Cancer statistics, 2019. CA Cancer J. Clin. 2019, 69, 7–34. [Google Scholar] [CrossRef] [PubMed]
- Gherardi, E.; Birchmeier, W.; Birchmeier, C.; Vande Woude, G. Targeting MET in cancer: Rationale and progress. Nat. Rev. Cacner 2012, 12, 89–103. [Google Scholar] [CrossRef] [PubMed]
- Duplaquet, L.; Kherrouche, Z.; Baldacci, S.; Jamme, P.; Cortot, A.B.; Copin, M.-C.; Tulasne, D. The multiple paths towards MET receptor addiction in cancer. Oncogene 2018, 37, 3200–3215. [Google Scholar] [CrossRef]
- Viticchiè, G.; Muller, P.A.J. c-Met and Other Cell Surface Molecules: Interaction, Activation and Functional Consequences. Biomedicines 2015, 3, 46–70. [Google Scholar] [CrossRef]
- Hattori, M. SIPA1 (signal-induced proliferation-associated 1). Atlas Genet. Cytogenet. Oncol. Haematol. 2011. [Google Scholar] [CrossRef]


| Parameters | Number of Samples | Median SIPA1 Expression (Copies/50 ng RNA) | Interquartile Range | ||
|---|---|---|---|---|---|
| Q1 | Q3 | ||||
| Entire cohort | Tumour | 148 | 25 | 12 | 74 |
| Normal | 148 | 19 | 7 | 45 | |
| Entire cohort | Tumour | 139 | 24.2 | 12 | 74 |
| Paired Normal | 139 | 19 | 7 | 45 | |
| Histology type | Squamous Cell Carcinoma | 50 | 25 | 14 | 62 |
| Adenocarcinoma | 67 | 19.8 | 9.1 | 73.8 | |
| Other | 18 | 24 | 6 | 121 | |
| Degree of differentiation | High | 7 | 14.88 | 3.05 | 21.88 |
| High to moderate | 16 | 24.2 | 15.9 | 63.5 | |
| Moderate | 50 | 25 | 9 | 67 | |
| Moderate to Low | 23 | 26.9 | 12.2 | 96.7 | |
| Low | 14 | 17.9 | 7.5 | 42.5 | |
| T Staging | T-1 | 21 | 17.3 | 4.2 | 63 |
| T-2 | 57 | 21 | 9 | 65 | |
| T-3 | 29 | 50 | 20 | 168 | |
| T-4 | 16 | 18.3 | 6.1 | 65.3 | |
| Nodal staging | N-0 | 70 | 24.1 | 9 | 63.7 |
| N-1 | 22 | 31 | 11 | 82 | |
| N-2 | 38 | 19 | 10 | 78 | |
| TNM staging | TNM1 | 39 | 17.3 | 6.9 | 59.7 |
| TNM2 | 31 | 52 | 20 | 189 | |
| TNM3 | 51 | 19 | 12 | 63 | |
| TNM4 | 1 | 0.1134 | * | * | |
| TNM sub-staging | TNM1A | 17 | 15.5 | 4.1 | 63 |
| TNM1B | 22 | 21.9 | 8.2 | 60.3 | |
| TNM2A | 2 | 135 | * | ||
| TNM2B | 29 | 52 | 20 | 189 | |
| TNM3A | 37 | 20 | 14 | 63 | |
| TNM3B | 14 | 18.3 | 6.4 | 77.1 | |
| Smoking history | Non smoker | 59 | 28.5 | 9.7 | 63.8 |
| Smoker | 77 | 20 | 11 | 71 | |
Publisher’s Note: MDPI stays neutral with regard to jurisdictional claims in published maps and institutional affiliations. |
© 2021 by the authors. Licensee MDPI, Basel, Switzerland. This article is an open access article distributed under the terms and conditions of the Creative Commons Attribution (CC BY) license (https://creativecommons.org/licenses/by/4.0/).
Share and Cite
Liu, C.; Jiang, W.; Zhang, L.; Hargest, R.; Martin, T.A. SIPA1 Is a Modulator of HGF/MET Induced Tumour Metastasis via the Regulation of Tight Junction-Based Cell to Cell Barrier Function. Cancers 2021, 13, 1747. https://doi.org/10.3390/cancers13071747
Liu C, Jiang W, Zhang L, Hargest R, Martin TA. SIPA1 Is a Modulator of HGF/MET Induced Tumour Metastasis via the Regulation of Tight Junction-Based Cell to Cell Barrier Function. Cancers. 2021; 13(7):1747. https://doi.org/10.3390/cancers13071747
Chicago/Turabian StyleLiu, Chang, Wenguo Jiang, Lijian Zhang, Rachel Hargest, and Tracey A. Martin. 2021. "SIPA1 Is a Modulator of HGF/MET Induced Tumour Metastasis via the Regulation of Tight Junction-Based Cell to Cell Barrier Function" Cancers 13, no. 7: 1747. https://doi.org/10.3390/cancers13071747
APA StyleLiu, C., Jiang, W., Zhang, L., Hargest, R., & Martin, T. A. (2021). SIPA1 Is a Modulator of HGF/MET Induced Tumour Metastasis via the Regulation of Tight Junction-Based Cell to Cell Barrier Function. Cancers, 13(7), 1747. https://doi.org/10.3390/cancers13071747