Simple Summary
The major prognosis factor of adrenocortical carcinoma is the completeness of surgery. Focal adrenocortical carcinoma bulge on computed tomography and adrenocortical carcinoma contour disruption on magnetic resonance imaging are highly reproducible signs. These signs are strongly associated with direct liver involvement by right-sided adrenocortical carcinoma on preoperative imaging. These findings may help surgeons plan surgical approach before resection and decrease the complication rate.
Abstract
The major prognosis factor of adrenocortical carcinoma (ACC) is the completeness of surgery. The aim of our study was to identify preoperative imaging features associated with direct liver involvement (DLI) by right-sided ACC. Two radiologists, blinded to the outcome, independently reviewed preoperative CT and MRI examinations for eight signs of DLI, in patients operated for right-sided ACC and retrospectively included from November 2007 to January 2020. DLI was confirmed using surgical and histopathological findings. Kappa values were calculated. Univariable and multivariable analyses were performed by using a logistic regression model. Receiver operating characteristic (ROC) curves were built for CT and MRI. Twenty-nine patients were included. Seven patients had DLI requiring en bloc resection. At multivariable analysis, focal ACC bulge was the single independent sign associated with DLI on CT (OR: 60.00; 95% CI: 4.60–782.40; p < 0.001), and ACC contour disruption was the single independent sign associated with DLI on MRI (OR: 126.00; 95% CI: 6.82–2328.21; p < 0.001). Both signs were highly reproducible, with respective kappa values of 0.85 and 0.91. The areas under ROC curves of MRI and CT models were not different (p = 0.838). Focal ACC bulge on CT and ACC contour disruption on MRI are independent and highly reproducible signs, strongly associated with DLI by right-sided ACC on preoperative imaging. MRI does not improve the preoperative assessment of DLI by comparison with CT.
1. Introduction
Adrenocortical carcinoma (ACC) is a rare entity with an estimated incidence of 0.5–2 cases per million per year, and accounts for 0.04–0.2% of all cancer deaths in the USA [1,2]. ACCs are associated with a poor prognosis with a 5-year survival rate of approximately 40% [3].
Some clinical, pathological, and molecular features have been identified as prognostic factors in patients with ACC [4]. The European Network for the Study of Adrenal Tumors (ENSAT) staging system, taking into account tumor size, infiltration of surrounding adipose tissue, invasion of adjacent organs, positive lymph nodes, and distant metastases, provides an accurate stratification strongly associated with cancer-specific mortality [5]. Five-year survival of affected patients ranges from 60–80% for ACC confined to the adrenal space (stages I and II) to 35–50% for locally advanced ACC (stage III) and is much lower for metastatic ACC (stage IV), the latter being found in 20–40% of patients at the time of diagnosis.
When feasible, en bloc surgical resection is the only curative treatment of ACC [6]. Open surgery is the standard surgical approach, even though laparoscopic adrenalectomy can be a reasonable option, depending on surgeon experience, for tumors <6 cm without any evidence of local invasion. En bloc resection includes peritumoral/periadrenal retroperitoneal fat resection and, if invaded, resection of adjacent organs [7]. Vascular or adjacent organ invasion are not contraindications for surgery, since the only curative option remains a free-margin (i.e., R0) resection. However, it conveys high peri-operative morbidity and mortality [8]. Notably, hepatic resections including atypical resection, segmentectomy or formal right hepatectomy are sometimes necessary during right-sided ACC surgery. This is associated with specific perioperative management and induces higher perioperative morbidity that needs to be assessed in the benefit-risk balance of the procedure [9].
Preoperative cross-sectional imaging, including computed tomography (CT) and magnetic resonance imaging (MRI), provides features suggestive for malignancy such as ACC size >4 cm, tumor heterogeneity, irregular shape, and/or growing tumor. Imaging also has a main role in tumor staging and preoperative planning of surgical approach [7]. To our knowledge, very few studies have been performed to identify preoperative imaging signs of direct liver involvement (DLI) in right-sided ACC [10,11].
The aim of our study was to identify imaging signs on preoperative CT and MRI that are associated with DLI in patients with right-sided ACC.
2. Materials and Methods
2.1. Patients
Our institutional review board approved this study and informed consent was obtained from all patients. The database of our institution was queried from November 2007 to January 2020 inclusively to identify all consecutive patients who had surgery for ACC. Inclusion criteria were as follows: age > 18 years, history of operated and histologically proven right-sided ACC, and available preoperative imaging (both CT and MRI) within 3 months before surgery. Among 83 patients with operated ACC, 54 were excluded due to incomplete preoperative imaging (14 patients), left-sided ACC (38 patients), or unresected right-sided ACC (2 patients). Figure 1 shows the flow chart of the study. For the 29 patients included, the following data were recorded: age, sex, initial diagnosis date, European Network for the Study of Adrenal Tumors (ENSAT) stage (Supplemental Table S1), surgical and histopathologic findings (Weiss score, Ki67 rate), and overall survival defined as the duration of patient’s survival after surgery [12]. Initial characteristics of the 29 included patients are reported in Table 1. There were 8 men and 21 women with a median age of 46 years (q1 = 35; q3 = 59; range: 19–76 years). All patients had en bloc resection for right-sided ACC, according to international recommendations [13], including seven patients who had liver resection (five right hepatectomies and two segmentectomies).
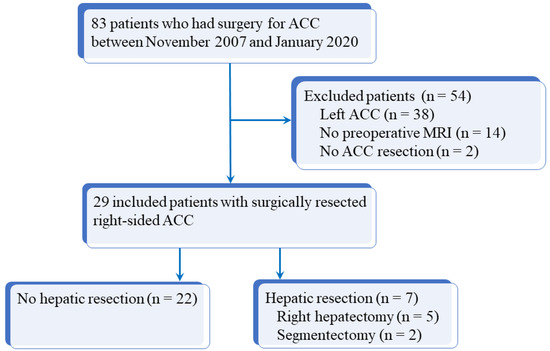
Figure 1.
Flow chart of the study. ACC: adrenocortical carcinoma; MRI: magnetic resonance imaging.

Table 1.
Initial characteristics of 29 patients with right-sided adrenocortical carcinoma.
All patients were followed-up at regular intervals with clinical, biological, and imaging examinations, with a minimal follow-up of 6 months.
2.2. Procedure and Imaging Protocol
All included patients had both preoperative abdominal CT and MRI performed less than 3 months before surgery. CT examinations were performed before and after intravenous administration of iodinated contrast material, with arterial (30 s) and portal venous (70 s) phases. MRI included at least the following sequences: diffusion-weighted imaging (DWI), T2-weighted half Fourier acquisition single-shot turbo spin-echo (HASTE), fat saturated (FS) T2-weighted BLADE, T1-weighted images (in- and out-of-phase), and dynamic multiphase contrast-enhanced sequences (Supplemental Table S2). Acquisition volume covered the right atrium to exclude right atrial thrombus [14].
2.3. Imaging Analysis
Two radiologists blinded to clinical outcomes (A.K. and M.B. with, respectively, 3 and 7 years of experience in abdominal imaging) independently reviewed all imaging examinations after anonymization on a picture-archiving and communication system (PACS) viewing station (DirectView®, 11.4.0.1253 sp1 version, Carestream Health, Rochester, NY, USA). For each examination, adrenal mass characteristics including dimensions on CT, and eight candidates imaging criteria of DLI were noted: (i) disappearance of fat border between ACC and liver; (ii) periadrenal fat infiltration; (iii) ACC contour disruption; (iv) macroscopic mass effect on inferior vena cava; (v) macroscopic mass effect on right hepatic vein; (vi) focal ACC bulge; (vii) periadrenal hepatic parenchyma enhancement; and (viii) ACC inclusion by hepatic parenchyma >180° (Figure 2, Figure 3 and Figure 4). Some of these signs have already been studied for locoregional invasion of ACC. Contrariwise, other signs have not been specifically analyzed for the assessment of DLI by ACC, but they have already been studied in other malignancies. Since the aim of our work was to identify new imaging signs associated with DLI by right-sided ACC, we tried to transpose these signs and their definitions for the study of locoregional extension of ACC. The fat border between ACC and liver was considered to be non-measurable and absent when <1 mm [10]. Periadrenal fat densification was defined on CT by a difference in attenuation values >10 Hounsfield units (HU) between normal retroperitoneal fat and peritumoral fat [15]. On MRI, it was characterized by hyperintense areas in the periadrenal fat on T2-weighted BLADE sequences. ACC contour disruption was defined on both CT and MRI by an adrenal capsular defect, which did not show any enhancement, contrary to a thin marginal enhancement of the lesion suggesting an intact adrenal capsule [11]. Macroscopic mass effect on inferior vena cava or right hepatic vein was defined by an anterior displacement of the vessel in association with direct contact with the tumor, with or without changes in caliber [16]. Focal ACC bulge was defined as focal protrusion of tumor into hepatic parenchyma [17]. Periadrenal hepatic parenchyma was considered enhanced by comparison with distant parenchyma if there was a measurable attenuation difference on portal phase images, with a threshold of 20 HU [18]. Inclusion by hepatic parenchyma was considered on axial images when the liver parenchyma surrounded the tumor over its half-circumference (Table 2).
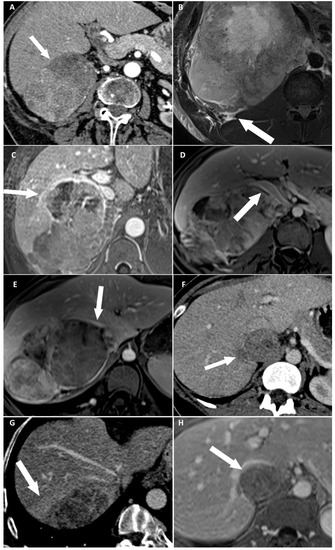
Figure 2.
Categorical reading criteria. (A) A 76-year-old woman with a right-sided cortisol-secreting adrenocortical carcinoma (ACC) (Weiss score = 7, Ki67 = 13%), with direct liver involvement (DLI). CT image in the transverse plane obtained during the arterial phase following intravenous administration of iodinated contrast material shows disappearance of fat border between ACC and liver (arrow). (B) A 34-year-old man with a right-sided cortisol-secreting ACC (Weiss score = 9, Ki67 = 70%), with DLI. T2-weighted BLADE fat saturated (FS) image in the transverse plane shows periadrenal fat infiltration (white arrow). (C) A 57-year-old woman with a right-sided cortisol-secreting ACC (Weiss score = 9, Ki67 = 60%), associated with DLI. T1-weighted 3D volumetric interpolated breath-hold gradient-echo (VIBE) image in the transverse plane obtained during the venous phase following intravenous administration of gadoterate meglumine shows ACC contour disruption (arrow). (D) A 23-year-old woman with a right-sided cortisol-secreting ACC (Weiss score = 8, Ki67 = 50%), without DLI. T1-weighted VIBE image in the transverse plane obtained during the venous phase after intravenous administration of gadoterate meglumine shows macroscopic mass effect on inferior vena cava (arrow). (E) A 45-year-old woman with a right-sided ACC (Weiss score = 9, Ki67 = 16%), with DLI. T1-weighted 3D VIBE image in the transverse plane obtained during the venous phase after intravenous injection of gadoterate meglumine shows macroscopic mass effect on right hepatic vein (white arrow). (F) A 36-year-old woman with a right-sided noncortisol-secreting ACC (Weiss score = 7, Ki67 = 9%) associated with DLI. CT image in the transverse plane obtained during the venous phase following intravenous administration of iodinated contrast material shows focal ACC bulge (arrow). (G) A 55-year-old woman with a right-sided cortisol-secreting ACC (Weiss score = 6, Ki67 = 7 %), with DLI. CT image in the transverse plane obtained during the venous phase after injection of iodine based intravenous contrast agent shows periadrenal hepatic parenchyma enhancement (arrow). (H) A 36-year-old woman with a right-sided noncortisol-secreting ACC (Weiss score = 7, Ki67 = 9%) associated with DLI. T1-weighted VIBE image in the transverse plane obtained during the venous phase after intravenous administration of gadoterate meglumine shows ACC inclusion by hepatic parenchyma >180° (arrow).
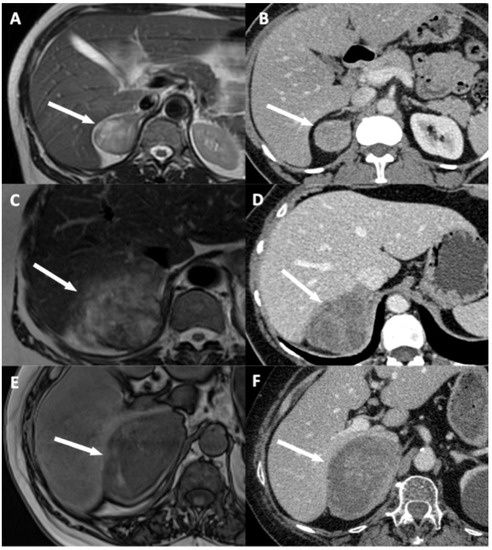
Figure 3.
Illustration of disappearance of fat border between adrenocortical carcinoma (ACC) and liver. (A,B) A 53-year-old woman with a right-sided cortisol-secreting ACC (Weiss score = 3, Ki67 = 2%), without direct liver involvement (DLI). (A) T2-weighted half Fourier acquisition single-shot turbo spin-echo (HASTE) image in the transverse plane shows a visible and measurable fat border between ACC and liver (arrow). (B) CT image in the transverse plane obtained during the venous phase following intravenous administration of iodinated contrast material shows a visible and measurable fat border between ACC and liver (arrow). (C,D) A 57-year-old woman with a right-sided ACC (Weiss score = 7, Ki67 = 15%), with DLI. (C) T2-weighted HASTE image in the transverse plane shows a non-measurable (<1 mm) absent fat border between ACC and liver (arrow). (D) CT image in the transverse plane obtained during the venous phase following intravenous administration of iodinated contrast material shows a non-measurable (<1 mm) absent fat border between ACC and liver (white arrow). (E,F) A 73-year-old man with a right-sided ACC (Weiss score = 8, Ki67 = 20%), with DLI. (E) Unenhanced T1-weighted out-phase image in the transverse plane shows disappearance of the black boundary artifact normally visible at fat-water interfaces suggesting disappearance of fat border between ACC and liver (white arrow). (F) CT image in the transverse plane obtained during the arterial phase following intravenous administration of iodinated contrast material shows a non-measurable (<1 mm) absent fat border between ACC and liver (arrow).
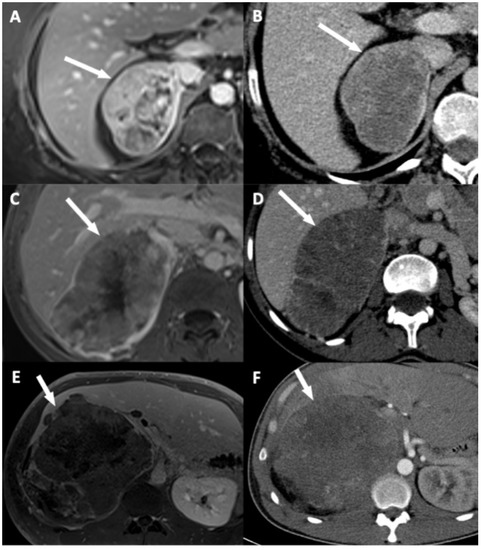
Figure 4.
Illustration of adrenocortical carcinoma (ACC) contour disruption. (A,B) A 53-year-old woman with a right-sided ACC (Weiss score = 9, Ki67 = 40%), without direct liver involvement (DLI). (A) T1-weighted 3D VIBE image in the transverse plane obtained during the venous phase following intravenous administration of gadoterate meglumine shows a thin marginal enhancement of the lesion suggesting an intact adrenal capsule (arrow). (B) CT image in the transverse plane obtained during the venous phase following intravenous administration of iodinated contrast material t shows a thin marginal enhancement of the lesion suggesting an intact adrenal capsule (arrow). (C,D) A 34-year-old woman with a right-sided ACC (Weiss score = 9, Ki67 = 30%), with DLI. (C) T1-weighted 3D VIBE image in the transverse plane obtained during the venous phase following intravenous administration of gadoterate meglumine shows an adrenal capsular defect without any enhancement (arrow). (D) CT image in the transverse plane obtained during the venous phase following intravenous administration of iodinated contrast material shows an adrenal capsular defect without any enhancement (arrow). (E,F) A 34-year-old man with a right-sided ACC (Weiss score = 9, Ki67 = 70%), with DLI. (E) T1-weighted 3D VIBE image in the transverse plane obtained during the late phase (5 min) following intravenous administration of gadoterate meglumine shows an adrenal capsular defect without any enhancement (arrow). (F) CT image in the transverse plane obtained during the venous phase following intravenous administration of iodinated contrast material shows an adrenal capsular defect without any enhancement (arrow).
Table 2.
Categorical reading criteria used on different imaging modalities (CT and MRI) in 29 patients with operated right-sided ACC.
2.4. Standard of Reference
At surgery, DLI by ACC was considered in the presence of macroscopic tumoral capsular rupture associated with invasion of the Glisson capsule, macroscopic invasion of the fat border between the tumor and the liver, or disappearance of the anatomical space between the tumor and the liver, making a free-margin resection impossible to obtain [7].
After resection, all ACCs were graded using Weiss histopathologic criteria of malignancy, based on the evaluation of nine features: nuclear grade, mitotic rate, atypical mitotic figures, cytoplasm, diffuse architecture, necrosis, venous invasion, sinusoid invasion, and invasion of tumor capsule [19,20]. Histopathologic diagnosis of ACC was made if there were at least three of the nine malignancy criteria.
The definite diagnosis of DLI was made using surgical and histopathological findings. Patients who had no liver resection were considered as having no DLI by ACC.
2.5. Statistical Analysis
Statistical analysis was performed by using SPSS 23.0 software (SPSS, Chicago, IL, USA) and MedCalc, version 11.3.0 (MedCalc Software Ltd., Ostend, Belgium). Continuous variables were expressed as medians, interquartile ranges, and ranges. Qualitative variables were expressed as raw numbers, proportions, and percentages along with their 95% confidence intervals (CIs). Normality of distributions was assessed by using histograms and Shapiro–Wilk test. Continuous and categorical variables were compared by using Mann–Whitney and Fisher exact tests, respectively. Overall survival (OS) was estimated by using the Kaplan–Meier method. The log-rank test was used to compare survival curves. Overall survival was calculated from the date of surgery until death. Interobserver agreement for categorical variables was assessed using the weighted kappa (K) test, and K values were reported with their 95% CI [21].
Univariable analyses were conducted by logistic regression model to identify candidate features associated with DLI and to estimate odds ratios (ORs) and their 95% CIs. To consider confounders of DLI, a multivariable analysis was performed by using a logistic regression model with backward stepwise selection of covariates and with entering and removing limits of p < 0.10 and p > 0.05. Correlations between all variables were examined. In case of a strong correlation between two variables, one or another variable was included in the multivariable model. A multivariable model was built for CT features and a second for MRI features. ROC curve analysis was performed for these two models, and the area under the ROC curves (AUROC) was compared using the De long test to evaluate the added value of MRI. Significance was set at p < 0.05.
3. Results
3.1. Correlation of Survival of the Overall Cohort with DLI
The median OS was significantly lower in patient with DLI (25 months; q1 = 4, q3 = 33; range: 7–44 months) compared to those without DLI (110 months; q1 = 43, q3 = 60; range: 86–134 months) (p = 0.002). ENSAT stage >2, Ki67rate >20%, and Weiss score >7 were all significantly associated with lower OS (p < 0.001, p = 0.001, and p < 0.001, respectively).
3.2. Quantitative Findings
The dimensions of all ACCs were measured on preoperative CT. For patients without DLI, median tumor length was 80 mm (q1 = 49; q3 = 103; range: 21–170 mm), the median tumor width was 56 mm (q1 = 37; q3 = 67; range: 12–151 mm), and median tumor height was 62 mm (q1 = 51; q3 = 109; range: 19–235 mm). For patients with DLI, median tumor length was 105 mm (q1 = 82; q3 = 132; range: 63–160 mm), median width was 66 mm (q1 = 58; q3 = 99; range: 39–119 mm), and the median height was 101 mm (q1 = 81; q3 = 131; range: 45–179 mm). No differences in dimensions were found between patients with DLI and those without DLI. (Table 1).
3.3. Qualitative Findings
Interobserver agreement was perfect or nearly perfect for the three following signs: disappearance of fat border between ACC and liver, ACC contour disruption, and focal ACC bulge, with respective kappa values of 0.94 (95% CI: 0.87–1.00; p < 0.001) on CT and 0.85 (95% CI: 0.75–0.95; p = 0.001) on MRI, 1.00 (95% CI: 0.95–1.00; p < 0.001) on CT and 0.91 (95% CI: 0.82–1.00; p < 0.001) on MRI, 0.85 (95% CI: 0.75–0.95; p < 0.001) on CT and 1.00 (95% CI: 0.92–1.00; p < 0.001) on MRI (Table 3).
Table 3.
Interobserver agreement for categorical data in 29 patients with operated right ACC.
On CT and MRI, disappearance of fat border between ACC and liver was present in 3/22 patients (14%) without DLI and in 7/7 patients (100%) with DLI (p < 0.001). ACC contour disruption was present on CT and MRI for 1/22 patients (5%) without DLI, whereas it was present on CT for 7/7 patients (100%) with DLI, and on MRI, it was present in 6/7 patients (86%) with DLI (p < 0.001). For patients without DLI, focal ACC bulge was present in 2/22 patients (9%) on CT, and 3/22 patients (14%) patients on MRI. For patients with DLI, focal ACC bulge was present in 6/7 patients (86%) on CT and in 7/7 patients (100%) on MRI (p < 0.001) (Table 4 and Table 5).
Table 4.
Comparison of CT findings for independent categorical criteria between 22 patients without DLI and 7 patients with DLI.
Table 5.
Comparison of MRI findings for independent categorical criteria between 22 patients without DLI and 7 patients with DLI.
3.4. Univariable and Multivariable Analysis
At univariate logistic regression analysis, three qualitative features and ENSAT stage were associated with DLI: disappearance of fat border between ACC and liver (Figure 2A and Figure 3), ACC contour disruption (Figure 2C and Figure 4), and focal ACC bulge (Figure 2F) (Table 1 and Table 6).
Table 6.
Evaluation of the association between independent imaging findings and the actual status of DLI using logistic regression analysis in 29 patients with operated right ACC.
At multivariable analysis, focal ACC bulge was the single imaging sign independently associated with DLI on CT (OR = 60.00; 95% CI: 4.60–782.40). This sign yielded 86% sensitivity (6/7; 95% CI: 49–97%), 91% specificity (20/22; 95% CI: 72–98%), and 90% accuracy (26/29; 95% CI: 53–99%) for the diagnosis of DLI. On MRI, ACC contour disruption was the single independent sign associated with DLI (OR = 126.00; 95% CI: 6.82–2328.21). This sign yielded 86% sensitivity (6/7; 95% CI: 49–97%), 96% specificity (21/22; 95% CI: 78–99%), and 93% accuracy (27/29; 95% CI: 56–99%) for the diagnosis of DLI (Table 7).
Table 7.
Sensitivity, specificity, and accuracy of categorical CT and MRI variables for the prediction of direct liver involvement in 29 patients with operated right-sided adrenocortical carcinoma.
The diagnostic capabilities of both CT and MRI were assessed using subgroup analysis restricted to patients presenting with at least focal ACC bulge and ACC contour disruption on CT or MRI. The same diagnostic capabilities were found for both focal ACC bulge and ACC contour disruption. Each sign, visible indifferently on CT or on MRI, had 100% sensitivity (7/7; 95% CI: 65–100%), 91% specificity (20/22; 95% CI: 72–97%), and 93% accuracy (27/29; 95% CI: 56–99%) for the diagnosis of DLI.
The diagnostic performances of different combinations of sign on CT and MRI was evaluated. ACC bulge or ACC contour disruption on CT yielded 100% sensitivity (7/7; 95% CI: 65–100%), 91% specificity (20/22, 95% CI: 72–97%), and 93% accuracy (27/29, 95% CI: 56–99%) for the diagnosis of DLI. Focal ACC bulge or ACC contour disruption on MRI yielded 100% sensitivity (7/7, 95% CI: 65–100%), 86% specificity (19/22, 95% CI: 67–95%), and 90% accuracy (26/29, 95% CI: 53–99%) for the diagnosis of DLI. The association of focal ACC bulge and ACC contour disruption on CT yielded 86% sensitivity (6/7, 95% CI: 49–97%), 95% specificity (21/22, 95% CI: 78–99%) and 93% accuracy (27/29, 95% CI: 56–99%) for the diagnosis of DLI. On MRI, the presence of both signs yielded 86% sensitivity (6/7, 95% CI: 49–97%), 95% specificity (21/22, 95% CI: 78–99%), and 93% accuracy (27/29, 95% CI: 56–99%) for the diagnosis of DLI (Table 7).
3.5. Added Value of MRI
No differences in AUROC were found between focal ACC bulge on CT (0.883; 95% CI: 0.709–0.972) and ACC contour disruption on MRI (0.906; 95% CI: 0.739–0.982) (p = 0.838) (Figure 5).
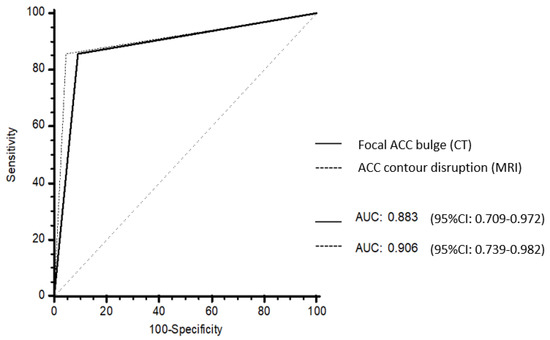
Figure 5.
Receiver operating characteristic (ROC) curves of the CT and MRI models. Focal ACC bulge on CT had an area under the ROC curves (AUROC) of 0.883 (95% CI: 0.709–0.972). ACC contour disruption on MRI had an AUROC of 0.906 (95% CI: 0.739–0.982). There was no difference between AUROC at CT and AUROC at MRI (p = 0.838).
4. Discussion
Preoperative prediction of DLI by right-sided ACC is mandatory in order to assess the benefit to risk balance of the procedure and tailor perioperative care. In the present study, we found that ACC contour disruption and focal ACC bulge on preoperative imaging were associated with DLI with high ORs and accuracies. Interestingly, we found that relatively small ACC may cause DLI, as the smallest lesion with DLI in our cohort measured 63 × 39 × 45 mm3, and there were no differences in terms of size between both groups.
Increased peritumoral hepatic parenchyma enhancement was identified as a sign of DLI in other studies. According to Tseng at al., hyperintensity of the liver parenchyma adjacent to gallbladder carcinoma is an indirect sign of DLI [18]. Perfusion hepatic disorders adjacent to tumor can be found in a variety of tumors, particularly when they affect a focal part of the hepatic parenchyma [22]. Some hypotheses have been suggested to explain this phenomenon. First, correlation with histopathological examination reveals that hepatic perfusion abnormalities indicate direct locoregional involvement of hepatic parenchyma by tumor or inflammatory reaction secondary to peritumoral sinusoidal dilatation and edema [23]. Finally, compressed or blocked portal blood vessels within the liver due to an extrinsic mass-effect can lead to a blood compensation via the hepatic artery, possibly producing a focal higher parenchyma enhancement [24]. However, in our study we did not find any significant association between hyperenhancement of peritumoral hepatic parenchyma and DLI.
In our study, patients who had liver resections had decreased OS compared to those who did not. This suggests that our study population is representative and similar to those of previous series. Indeed, ENSAT stage III ACCs whatever the organ invaded are known to have worst prognosis than lower stage ACCs and more specifically have poorer prognosis compared to those without hepatic involvement [5]. For selected patients, an aggressive surgical approach for ACC liver metastasis (ENSAT stage IV) is associated with long-term OS (5-year survival rate of 39% for operated metastatic patients) compared to conservative management (5-year survival of 15–20% for non-operated metastatic patients) [25].
In our study, we found that MRI does not improve the preoperative prediction of DLI by comparison with CT. The respective capabilities of these two imaging techniques for the diagnosis of adrenal tumors have already been studied. CT is usually considered as the most useful modality for identification and characterization of adrenal tumors. When lesions cannot be characterized adequately with CT or when CT is contraindicated, MRI remains an alternate option. However, MRI does not convey better spatial resolution, and this might explain why there is no difference for preoperative assessment of DLI between MRI and CT [16]. Nevertheless, there is no clear recommendation for the use of CT versus MRI for the diagnosis and preoperative staging of ACCs [13].
Our results demonstrate a high reproducibility of candidate signs, since the kappa values show nearly complete agreement between two radiologists with different levels of experience in abdominal radiology for the three most important signs. In addition, we used a strong standard of reference for the diagnosis of DLI because it was based on the association of surgical and histopathological criteria.
Our study has some limitations. First, its retrospective and monocentric design may limit generalizability. However, our center is a nationwide tertiary referral center for this rare disease, and the characteristics of our population are similar to those of other series reporting patients with ACCs [26,27]. Then, we included patients from 2007 to 2020, which may lead to interpretation bias toward imaging modalities. In fact, CT and MRI techniques evolved since 2007, especially concerning the quality of image and spatial resolution.
In conclusion, ACC contour disruption and focal ACC bulge are the two most accurate and reproducible signs associated with DLI on preoperative imaging. This may help surgeons plan a surgical approach before resections and decrease the complications rate. However, further prospective validation is needed to confirm these findings.
Supplementary Materials
The following are available online at ‘https://www.mdpi.com/article/10.3390/cancers13071603/s1, Table S1: ENSAT Staging System. Table S2: MRI parameters.
Author Contributions
Conceptualization, A.K., A.D., S.G., G.A., L.G.R., J.B., P.S., and M.B.; methodology, A.D., S.G., M.S., A.J., G.A., L.G.R., R.L., J.B., P.S., and M.B.; software: A.D., G.A., L.G.R., R.L., J.B., P.S., and M.B.; validation, A.K., A.D., S.G., M.S., A.J., G.A., L.G.R., R.L., J.B., P.S., and M.B.; formal analysis, A.K., A.D., S.G., M.S., A.J., G.A., L.G.R., R.L., J.B., P.S., and M.B.; investigation, A.K., A.D., S.G., M.S., A.J., G.A., L.G.R., R.L., J.B., P.S., and M.B.; data curation, A.K., A.D., S.G., M.S., A.J., G.A., L.G.R., R.L., J.B., P.S., and M.B.; writing—original draft preparation A.K., A.D., S.G., M.S., A.J., G.A., L.G.R., R.L., J.B., P.S., and M.B.; writing—review and editing, A.K., A.D., S.G., M.S., A.J., G.A., L.G.R., R.L., J.B., P.S., and M.B.; visualization, A.K., A.D., S.G., M.S., A.J., G.A., L.G.R., R.L., J.B., P.S., and M.B.; supervision, A.D., S.G., M.S., A.J., G.A., L.G.R., R.L., J.B., P.S., and M.B.; project administration, A.K., A.D., S.G., M.S., A.J., G.A., L.G.R., R.L., J.B., P.S., and M.B. All authors have read and agreed to the published version of the manuscript.
Funding
This research received no external funding.
Institutional Review Board Statement
The study was conducted according to the guidelines of the Declaration of Helsinki and approved by the Institutional Review Board of Hôpital Cochin.
Informed Consent Statement
Informed consent was obtained from all subjects involved in the study.
Data Availability Statement
Data may be available upon request.
Conflicts of Interest
The authors declare no conflict of interest related with this study.
References
- Souteiro, P.; Donato, S.; Costa, C.; Pereira, C.A.; Simões-Pereira, J.; Oliveira, J.; Belo, S.; Santos, A.P.; Cardoso, H.; Leite, V.; et al. Diagnosis, treatment, and survival analysis of adrenocortical carcinomas: A multicentric study. Hormones 2019, 19, 197–203. [Google Scholar] [CrossRef]
- Abiven, G.; Coste, J.; Groussin, L.; Anract, P.; Tissier, F.; Legmann, P.; Dousset, B.; Bertagna, X.; Bertherat, J. Clinical and biological features in the prognosis of adrenocortical cancer: Poor outcome of cortisol-secreting tumors in a series of 202 consecutive patients. J. Clin. Endocrinol. Metab. 2006, 91, 2650–2655. [Google Scholar] [CrossRef]
- Grubbs, E.; Lee, J.E. Limited prognostic value of the 2004 International Union Against Cancer staging classification for adrenocortical carcinoma: Proposal for a revised TNM classification. Cancer 2009, 115, 243–250. [Google Scholar] [CrossRef]
- Ragazzon, B.; Assié, G.; Bertherat, J. Transcriptome analysis of adrenocortical cancers: From molecular classification to the identification of new treatments. Endocr. Relat. Cancer 2011, 18, R15–R27. [Google Scholar] [CrossRef]
- Lughezzani, G.; Sun, M.; Perrotte, P.; Jeldres, C.; Alasker, A.; Isbarn, H.; Budaus, L.; Shariat, S.F.; Guazzoni, G.; Montorsi, F.; et al. The European Network for the Study of Adrenal Tumors staging system is prognostically superior to the International Union Against Cancer-staging system: A North American validation. Eur. J. Cancer 2010, 46, 713–719. [Google Scholar] [CrossRef] [PubMed]
- Gaujoux, S.; Brennan, M.F. Recommendation for standardized surgical management of primary adrenocortical carcinoma. Surgery 2012, 152, 123–132. [Google Scholar] [CrossRef]
- Gaujoux, S.; Mihai, R. European Society of Endocrine Surgeons (ESES) and European Network for the Study of Adrenal Tumours (ENSAT) recommendations for the surgical management of adrenocortical carcinoma. Br. J. Surg. 2017, 104, 358–376. [Google Scholar] [CrossRef]
- Margonis, G.A.; Amini, N.; Kim, Y.; Tran, T.B.; Postlewait, L.M.; Maithel, S.K.; Wang, T.S.; Evans, D.B.; Hatzaras, I.; Shenoy, R.; et al. Incidence of perioperative complications following resection of adrenocortical carcinoma and its association with long-term survival. World J. Surg. 2016, 40, 706–714. [Google Scholar] [CrossRef] [PubMed]
- Laurent, C.; Sa Cunha, A.; Couderc, P.; Rullier, E.; Saric, J. Influence of postoperative morbidity on long-term survival following liver resection for colorectal metastases. Br. J. Surg. 2003, 90, 1131–1136. [Google Scholar] [CrossRef] [PubMed]
- Ito, K.; Araki, H.; Uchida, T.; Manabe, Y.; Miyazaki, Y.; Itoh, H. Predictive factors and radiological findings of adrenohepatic adhesion during laparoscopic adrenalectomy. Investig. Clin. Urol. 2020, 61, 277–283. [Google Scholar] [CrossRef] [PubMed]
- Park, J.J.; Park, B.K.; Kim, C.K. Direct and indirect imaging features of adrenohepatic fusion. Abdom. Radiol. 2016, 41, 377–383. [Google Scholar] [CrossRef]
- Libé, R. Clinical and molecular prognostic factors in adrenocortical carcinoma. Minerva Endocrinol. 2019, 44, 58–69. [Google Scholar] [CrossRef]
- Fassnacht, M.; Dekkers, O.; Else, T.; Baudin, E.; Berruti, A.; de Krijger, R.; Haak, H.R.; Mihai, R.; Assie, G.; Terzolo, M. European Society of Endocrinology Clinical Practice Guidelines on the management of adrenocortical carcinoma in adults, in collaboration with the European Network for the Study of Adrenal Tumors. Eur. J. Endocrinol. 2018, 179, G1–G46. [Google Scholar] [CrossRef]
- Ahmed, A.A.; Thomas, A.J.; Ganeshan, D.M.; Blair, K.J.; Lall, C.; Lee, J.T.; Morshid, A.I.; Habra, M.A.; Elsayes, K.M. Adrenal cortical carcinoma: Pathology, genomics, prognosis, imaging features, and mimics with impact on management. Abdom. Radiol. 2020, 45, 945–963. [Google Scholar] [CrossRef] [PubMed]
- Kim, J.H.; Kim, T.K.; Eun, H.W.; Kim, B.S.; Lee, M.-G.; Kim, P.N.; Ha, H.K. Preoperative evaluation of gallbladder carcinoma: Efficacy of combined use of MR imaging, MR cholangiography, and contrast-enhanced dual-phase three-dimensional MR angiography. J. Magn. Reson. Imaging 2002, 16, 676–684. [Google Scholar] [CrossRef] [PubMed]
- Panda, A.; Das, C.J.; Dhamija, E.; Kumar, R.; Gupta, A.K. Adrenal imaging (Part 1): Imaging techniques and primary cortical lesions. Indian J. Endocrinol. Metab. 2015, 19, 8–15. [Google Scholar] [PubMed]
- Cornud, F.; Rouanne, M.; Beuvon, F.; Eiss, D.; Flam, T.; Liberatore, M.; Zerbib, M.; Delongchamps, N.B. Endorectal 3D T2-weighted 1mm-slice thickness MRI for prostate cancer staging at 1.5Tesla: Should we reconsider the indirects signs of extracapsular extension according to the D’Amico tumor risk criteria? Eur. J. Radiol. 2012, 81, e591–e597. [Google Scholar] [CrossRef] [PubMed]
- Tseng, J.-H.; Wan, Y.-L.; Hung, C.-F.; Ng, K.-K.; Pan, K.-T.; Chou, A.S.-B.; Liu, N.J. Diagnosis and staging of gallbladder carcinoma: Evaluation with dynamic MR imaging. Clin. Imaging 2002, 26, 177–182. [Google Scholar] [CrossRef]
- Fuhrman, S.A.; Lasky, L.C.; Limas, C. Prognostic significance of morphologic parameters in renal cell carcinoma. Am. J. Surg. Pathol. 1982, 6, 655–663. [Google Scholar] [CrossRef]
- Jain, M.; Kapoor, S.; Mishra, A.; Gupta, S.; Agarwal, A. Weiss criteria in large adrenocortical tumors: A validation study. Indian J. Pathol. Microbiol. 2010, 53, 222–226. [Google Scholar] [CrossRef] [PubMed]
- Benchoufi, M.; Matzner-Lober, E.; Molinari, N.; Jannot, A.-S.; Soyer, P. Interobserver agreement issues in radiology. Diagn. Interv. Imaging 2020, 101, 639–641. [Google Scholar] [CrossRef] [PubMed]
- Cao, Q.-Y.; Zou, Z.-M.; Wang, Q.; He, C.-N.; Zou, Q.; Wang, B. MRI manifestations of hepatic perfusion disorders. Exp. Ther. Med. 2018, 15, 5199–5204. [Google Scholar] [CrossRef]
- Lee, M.J.; Saini, S.; Compton, C.C.; Malt, R.A. MR demonstration of edema adjacent to a liver metastasis: Pathologic correlation. AJR Am. J. Roentgenol. 1991, 157, 499–501. [Google Scholar] [CrossRef] [PubMed][Green Version]
- Kim, H.J.; Kim, A.Y.; Kim, T.K.; Byun, J.H.; Won, H.J.; Kim, K.W.; Shin, Y.M.; Kim, P.N.; Ha, H.K.; Lee, M.-G. Transient hepatic attenuation differences in focal hepatic lesions: Dynamic CT features. AJR Am. J. Roentgenol. 2005, 184, 83–90. [Google Scholar] [CrossRef] [PubMed]
- Chiappini, A.; Frattolillo, G.; Paradiso, G.; De Gori, A.; Scarano Catanazaro, V.; Avantifiori, R.; Fiori, E.; De Toma, G. Current role of open surgery in adrenal tumors. G. Chir. 2020, 41, 79–83. [Google Scholar]
- Kwok, G.T.Y.; Zhao, J.-T.; Glover, A.R.; Ip, J.C.Y.; Sywak, M.; Clifton-Bligh, R.; Clarke, S.; Robinson, B.; Sidhu, S.B. Treatment and management of adrenal cancer in a specialized Australian endocrine surgical unit: Approaches, outcomes and lessons learnt. ANZ J. Surg. 2019, 89, 48–52. [Google Scholar] [CrossRef]
- Zheng, G.-Y.; Li, H.-Z.; Deng, J.-H.; Zhang, X.-B.; Wu, X.-C. Open adrenalectomy versus laparoscopic adrenalectomy for adrenocortical carcinoma: A retrospective comparative study on short-term oncologic prognosis. Onco Targets Ther. 2018, 11, 1625–1632. [Google Scholar] [CrossRef]


Publisher’s Note: MDPI stays neutral with regard to jurisdictional claims in published maps and institutional affiliations. |
© 2021 by the authors. Licensee MDPI, Basel, Switzerland. This article is an open access article distributed under the terms and conditions of the Creative Commons Attribution (CC BY) license (https://creativecommons.org/licenses/by/4.0/).