Simple Summary
Understanding how SOX2, a major driver of cancer stem cells, is regulated in cancer cells is relevant to tackle tumorigenesis. In this study, we deleted the SRR2 regulatory region in glioblastoma cells. Our data confirm that the SRR2 enhancer regulates SOX2 expression in cancer and reveal that SRR2 deletion halts malignant activity of SOX2.
Abstract
SOX2 is a transcription factor associated with stem cell activity in several tissues. In cancer, SOX2 expression is increased in samples from several malignancies, including glioblastoma, and high SOX2 levels are associated with the population of tumor-initiating cells and with poor patient outcome. Therefore, understanding how SOX2 is regulated in cancer cells is relevant to tackle tumorigenesis. The SOX2 regulatory region 2 (SRR2) is located downstream of the SOX2 coding region and mediates SOX2 expression in embryonic and adult stem cells. In this study, we deleted SRR2 using CRISPR/Cas9 in glioblastoma cells. Importantly, SRR2-deleted glioblastoma cells presented reduced SOX2 expression and decreased proliferative activity and self-renewal capacity in vitro. In line with these results, SRR2-deleted glioblastoma cells displayed decreased tumor initiation and growth in vivo. These effects correlated with an elevation of p21CIP1 cell cycle and p27KIP1 quiescence regulators. In conclusion, our data reveal that SRR2 deletion halts malignant activity of SOX2 and confirms that the SRR2 enhancer regulates SOX2 expression in cancer.
1. Introduction
SOX2 is a member of the SOX family of high mobility group (HMG) box transcription factors, and plays an important role in the maintenance of embryonic stem cell pluripotency and progenitor identity during embryogenesis and in adulthood [1]. In the embryonic central nervous system, SOX2 is expressed throughout the neural tube during early stages of neurogenesis and in progenitors as development progresses. It is also required for neural stem cell (NSC) activity in the adult. Several studies describe how SOX2 expression is elevated in a large proportion of cancers, including brain tumors such as glioblastoma (GBM) [2,3,4,5,6].
GBM is the most common malignant primary brain tumor in adults. The average survival of patients diagnosed with GBM is around 15 months [7]. GBMs are notorious for their resistance to therapy, which has been linked to genetic and cellular heterogeneity [8]. Among these, the glioma stem cell (GSC) subpopulation displays stem cell characteristics such as unlimited self-renewal capacity, quiescence and multilineage differentiation potential, being responsible for tumor initiation, progression, therapy resistance and tumor recurrence [9]. Several studies reported overexpression of SOX2 in GSC subpopulations and in patient samples, and the high levels are associated with tumor aggressiveness and worse prognosis. Furthermore, downregulation of SOX2 in GSCs impairs proliferation, self-renewal and their ability to form tumors in vivo, whereas SOX2 overexpression promotes cell proliferation, self-renewal capacity and tumorigenesis [3,10,11,12,13,14,15]. These results show SOX2 as a relevant driver in GBM progression.
Transcriptional regulation of SOX2 is complex and not fully understood. The expression of the SOX2 gene in embryonic stem cells (ESCs) and multipotent neural progenitor cells in the ventricular zone of embryonic brains is supported in major part by a set of regulatory regions: SRR1, SRR2, SRR18, SRR107 and SRR111 [16,17,18]. In particular, SRR2 is located ~4 kb downstream of the SOX2 coding region and has a regulatory core sequence comprising octamer and SOX2 binding sites. In ESCs and NSCs, SRR2 mediates SOX2 activation by recruiting OCT3-4-SOX2 or OCT6-SOX2, respectively, and, on their differentiation, SRR2 recruits p130-E2F4-SIN3A repressive complexes [17,19]. This is in part mediated by the association of p21CIP1 and p27KIP1 to SRR2. Indeed, when p27KIP1 binds to SRR2, together with the p130-E2F4-SIN3A complex, this contributes to the repression of SOX2 and leads to differentiation programs in ESCs, mouse embryonic fibroblasts (MEFs) and teratoma cells [20]. Similarly, p21CIP1 controls the proliferation of NSCs in the adult brain via SRR2 binding [21]. In breast cancer, high transcriptional activation of SOX2, monitored by an SRR2 reporter, has been associated with higher tumorigenic capacity in a small subset of cancer stem cell phenotypes (CD44+/CD24-) in triple-negative breast cancer cell lines and patient samples, showing the potential relevance of SRR2 in tumorigenesis [22,23].
Thus, in the present study, we used CRISPR/Cas9 technology to delete SRR2 in GBM cells. We observed a reduction of SOX2 expression, which is accompanied by impairment of proliferative activity and reduction of self-renewal capacity in vitro. Additionally, SRR2-deleted cells lose the capacity to form tumors in vivo. These effects correlated with an elevation of the p21CIP1 and p27KIP1 cell cycle and quiescence regulators. These results show that SRR2 is required for SOX2-driven oncogenic activity in GBM cells.
2. Materials and Methods
2.1. Single Guide RNA (sgRNA) Design for SRR2 Enhancer Deletion
Single guide RNAs (sgRNAs) were designed (www.crispr.mit.edu (accessed on 22 January 2021)) to flank and delete the human SRR2 enhancer (200 bp), sited ~4 kb downstream of the SOX2 gene (UCSC hg19 genome chr3: 181,429,712–181,435,223) by CRISPR/Cas9 genome editing. Two guides were designed for targeting the 5′ side of SRR2 (G7_5′ and G5_5′) and two guides for the 3′ side of SRR2 (G1_3′ + G3_3′) (Table S1), while putative off-targets were determined using the MIT CRISPR Design tool (http://crispr.mit.edu/ (accessed on 22 January 2021), which indicated top scoring off-target sites. sgRNAs and Cas9 mRNA were prepared as previously described [24]. U373MG cells were transfected with plasmid Cas9 (pSpCas9(BB)-2A-Puro (PX459) V2.0, PX459, #62988, Addgene) including four sgRNAs or only Cas9 empty vector (named control), following previously described protocols [24]. Forty-eight hours after transfection, cells were selected using 2 μg/mL puromycin. Single, puromycin-resistant cells were selected and expanded for genomic DNA extraction. In particular, 2 puromycin-resistant clones were isolated with cloning rings in the pSpCas9(BB)-2A-Puro (PX459) and four sgRNA plate (U373MG SRR2del clone2 and U373MG SRR2del clone5). Thus, we generated three different cell lines: control (only transfected with plasmid PX459), U373MG SRR2del clone2 (deletion of SRR2) and U373MG SRR2del clone5 (deletion of SRR2). Additionally, U373MG parental cells were also used in the experiments to check whether Cas9 empty vector (control) had any effect on U373MG cells.
2.2. Genotyping SRR2 Enhancer and Sequencing of Clones 2 and 5
Genomic DNA was extracted from U373MG cells and deleted SRR2 regulatory region and clones and control were identified by PCR genotyping (Table S2). The primer pair SRR2-F and SRR2-R amplified a 724 bp product in wild type cells and a product of around 200-400 bp cells carrying the SRR2 deletion when we used all guides. Sequencing revealed a difference of 1 nucleotide between both clones; clone2 deletion was 479 bp whilst clone5 deletion was 480 bp. Detailed information of sequencing of clones is presented in Figure S1. Sequencing was carried out in a 3130xl Genetic Analyzer (Applied Biosystems, Carlsbad, CA, USA)).
2.3. Chromatin Immunoprecipitation
Cells were crosslinked with 1% formaldehyde for 15 min at room temperature. Crosslinking was stopped by the addition of glycine to a final concentration of 0.125 M. Fixed cells were lysed in lysis buffer (1% SDS, 10 mM EDTA, 50 mM Tris-HCl, pH 8.0) and sonicated. An aliquot of 60 μg was reserved as input. For immunoprecipitation, 600 μg of protein were diluted in dilution buffer (1% Triton X-100, 2 mM EDTA, 150 mM NaCl and 20 mM Tris-HCl, pH 8.0, containing protease inhibitors), and pre-cleared with A/G plus-agarose (SantaCruz). The antibodies used for the immunoprecipitation were p27KIP1 (Santa Cruz, C-19) and IgG (Santa Cruz, SC-2020). Immune complexes were precipitated with A/G plus-agarose and washed sequentially with low-salt immune complex wash buffer (0.1% SDS, 1% Triton X-100, 2 mM EDTA, 20 mM Tris-HCl, pH 8.1, 150 mM NaCl), high-salt immune complex wash buffer (0.1% SDS, 1% Triton X-100, 2 mM EDTA, 20 mM Tris-HCl, pH 8.1, 500 mM NaCl), LiCl immune complex wash buffer (0.25 M LiCl, 1% NP-40, 1% deoxycholate-Na, 1 mM EDTA, 10 mM Tris-HCl, pH 8.1) and TE buffer, and finally eluted in elution buffer (1% SDS, 0.1 M NaHCO3). All samples, including inputs, were de-crosslinked, treated with proteinase K and DNA was extracted with phenol–chloroform and resuspended in TE buffer. All PCR reactions were carried out in triplicate. Primers used for PCR after Chromatin Immunoprecipitation (ChIP) are shown in Table S2.
2.4. Cell Lines and Cultures
A172, T98G, U87MG, U251MG and U373MG were purchased from the ATCC and cultured in Dulbecco’s Modified Eagle Medium (DMEM, Gibco, Waltham, MA, USA, supplemented with 10% Fetal Bovine Serum (FBS, Gibco, St. Louis, MO, USA), 100 U/mL penicillin and 100 µg/mL streptomycin, for monolayer cultures. For oncosphere studies, U373MG cells were cultured in Glioblastoma Stem Cell GSC medium consisting of DMEM/F12 (Sigma, Waltham, MA, USA) supplemented with N2, B27 (Fisher,Waltham, MA, USA) and growth factors: 20 ng/mL basic fibroblast growth factor (bFGF) and 20 ng/mL epidermal growth factor (EGF) (Sigma, Waltham, MA, USA). Patient-derived GNS166 and GNS179 stem cell lines, kindly provided by Dr. Steven Pollard, and GB1012 and GB1034, established by our group [15], were cultured in GSC medium. All cells were maintained at standard conditions of 37 °C and 5% CO2 in a humidified atmosphere.
Neurosphere isolation was performed as previously described [25] with some modifications. Briefly, animals were killed by raising the concentration of CO2, and the brain was put into Phosphate-Buffered Saline (PBS) 1X (Gibco, St. Louis, MO, USA). The subventricular zone (SVZ) was isolated and centrifuged at 230× g for 5 min. After removing the supernatant, the tissue was mechanically disrupted by pipetting up and down and enzymatically disaggregated using 5 mL DMEM/F12 with 10% papain (Roche), previously activated for 30 min at 37 °C and with 25 U of DNase (Promega, Madison, Wisconsin, USA). Cells were maintained at 37 °C for 30 min in rotation (180 rpm), before being centrifuged at 230× g for 5 min. After centrifugation, cells were washed with PBS and re-suspended in 2 mL of complete DMEM/F12 supplemented with 40 ng/mL Epidermal Growth Factor (EGF) and 40 ng/mL basic Fibroblast Growth Factor (bFGF). The culture was grown as spheres in suspension and the medium was renewed twice a week. For differentiation assays, 50 neurospheres were seeded in chamber slides (Lab-Tek II Chambers, 1023-4121, Thermo Scientific, Budapest, Hungary) pretreated with 10 µg/mL laminin (L2020, Sigma-Aldrich, St. Louis, MO, USA) at 37 °C for 3 h. Cells were maintained in culture for 7 days in complete DMEM/F12 without EGF and bFGF. Half of the medium was replaced every two days.
2.5. Lentiviral Infections
For stable SOX2 overexpression, lentiviral infections were performed as previously described [15]. We used a pLM-mCitrine-SOX2 construct (SOX2) and a pWPXL-GFP construct (GFP) as controls. Cells were infected at a multiplicity of infection of 10 for 6 h.
2.6. Immunofluorescence
Immunofluorescence was performed as described in previous studies [26]. Cells were incubated with SOX2 (AB5603 Millipore, Burlington, MA, USA) and phospho-histone3 (pH3) (ab14955 Abcam, Cambridge, UK) antibodies. Secondary antibodies of anti-mouse Alexa Fluor 555 IgG (Invitrogen, Carlsbad, CA, USA) and anti-rabbit Alexa Fluor 488 IgG (Invitrogen, Carlsbad, CA, USA) were used. Nuclear DNA was stained with Hoechst 33342 (Sigma, St. Louis, MO, USA). Pictures were taken with an Eclipse 80i microscope and processed with the NIS Elements Advances Research software (Nikon, Tokyo, Japan).
2.7. Western Blot Analysis
Immunoblots were performed following standard procedures [26]. Specific antibodies against SOX2 (AB5603 Millipore, Burlington, MA, USA), p21CIP1 (sc-397 Santa Cruz, Dallas, TX, USA), p27KIP1 (sc-1641 Santa Cruz, Dallas, TX, USA), BMI1 (05-637 Millipore, Burlington, MA, USA) and β-actin (A5441, Sigma, St. Louis, MO, USA) were used in the study. For secondary antibodies, horseradish peroxidase (HRP)-linked anti-rabbit (7074S Cell Signaling, Danvers, MA, USA), anti-mouse (7076S Cell Signaling, Danvers, MA, USA) or anti-goat (sc-2020 Santa Cruz, Dallas, TX, USA) were used. Detection was performed by chemiluminescence using NOVEX ECL Chemi Substrate (Thermo Fisher, Waltham, MA, USA).
2.8. RNA Analysis
Total RNA extraction was performed by Trizol (Life Technologies, Budapest, Hungary). Reverse transcription was performed using random priming and Maxima First Strand cDNA Synthesis Kit (Thermo Fisher, Waltham, MA, USA), according to the manufacturer’s guidelines. To analyze gene expression, quantitative real-time polymerase chain reaction (qRT-PCR) with 20 ng of cDNA was performed by Absolute SYBR Green mix (Thermo Scientific, Budapest, Hungary) in a LightCycler 96 thermo-cycler (BioRad, Hercules, CA, USA). Transcript levels were normalized to GAPDH and measured using the ΔΔCt relative quantification method.
2.9. Proliferation and Colony Formation Assays
For cell count experiments, a total of 2.5 × 10⁴ cells per well were seeded in duplicate in 6-well treated plates. The total number of cells for each condition was determined 1, 3 and 5 days after culture using a Neubauer counting chamber and a light microscope. For colony formation experiments, a total of 500 cells per well were seeded in duplicate in 6-well treated plates. After 10 days, cells were fixed with 4% paraformaldehyde for 30 min and stained with Giemsa (Sigma, St. Louis, MO, USA) 5% in PBS for another 30 min.
2.10. Oncosphere Formation Assay
For the oncosphere formation assay, 10,000 cells/well were seeded in non-treated 6-well flat-bottom plates. Primary oncospheres (1ry GSCs) were grown for 7–10 days in GSC medium, and after quantification, spheres were mechanically and enzymatically disaggregated with accutase (Gibco, Waltham, MA, USA). Then, they were seeded for secondary oncosphere (2ry GSCs) formation and maintained for another 7–10 days. Fresh medium was added every 2–3 days to the plate.
2.11. In Vivo Carcinogenesis Assay
All animal handling and protocols were approved by the animal care ethic committee of the Biodonostia Institute (PRO-AE-SS-100). For subcutaneous xenografts, U373MG SRR2del control, clone2 and clone5 cells were harvested with trypsin/EDTA and resuspended in PBS before injection. A tumor initiation assay was performed by injecting 5 × 10⁵ and 5 × 10⁴ cells into both flanks of 8-week-old Foxn1nu/Foxn1nu nude mice. In the assay, external calipers were used to measure tumor size twice a week. From these measurements, tumor volume was estimated by V = L × W2 × 0.5; where L is tumor length and W is the tumor width.
2.12. Immunohistochemistry (IHC)
Tumors generated in mice were dissected, fixed in 4% formalin for 48 h and embedded in paraffin. Four-micrometer thick sections were deparaffinized, rehydrated and heated for 10 min in citrate buffer for antigen retrieval. Endogenous peroxidase was blocked with 5% hydrogen peroxide in methanol for 15 min. After incubation with blocking solution, sections were incubated with the respective primary antibody, anti-SOX2 (ab97959 Abcam, Cambridge, UK), anti-Ki67 (ab15580, Abcam, Cambridge, UK), anti-p21CIP1 (sc-397 Santa Cruz, Dallas, TX, USA) and anti-p27KIP1 (sc-1641 Santa Cruz, Dallas, TX, USA), at 37 °C for 2 h. The sections were then washed and incubated with MACH 3 Rabbit Probe and MACH 3 Rabbit HRP-Polymer (M3R531, Biocare Medical, Pacheco, CA, USA). Color was developed with 3,3′-Diaminobenzidine (DAB) and nuclei were counterstained with hematoxylin.
2.13. Statistical Analysis
All measurements were represented as mean values ± standard error (SEM) and analyzed by Prism v.8.0c (GraphPad Software, San Diego, CA, USA). Data between two groups were compared by an unpaired t-test, while those among multiple groups were tested using one-way analysis of variance (ANOVA), followed by Tukey’s post hoc test. For Extreme Limiting Dilution analysis (ELDA), we used a chi-square test (χ2). Standard significance levels were used: * p ≤ 0.05; ** p ≤ 0.01; and *** p ≤ 0.001.
3. Results
3.1. Characterization of SOX2 Expression and Activation of SRR2 Enhancer in Glioma Cells
We analyzed the expression of SOX2 in the TCGA cohort of human GBM samples and compared them with healthy brain tissue. The expression of SOX2 was upregulated in GBM samples (Figure 1A). Similarly, Western blotting revealed very high expression of SOX2 in freshly derived glioma stem cell (GSC) cultures from human patients and in U251MG and U373MG cell lines, while A172, T98G and U87MG expressed low levels (Figure 1B,C). The levels in U251MG and U373MG cells are within the range of expression observed in tumor biopsies [15], suggesting that those levels are of biological relevance.
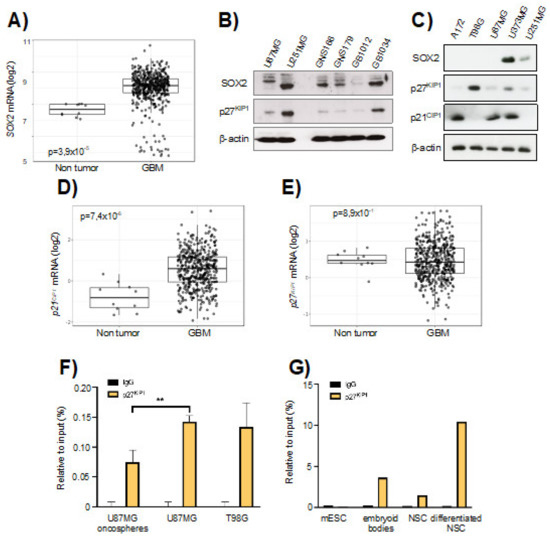
Figure 1.
SOX2-SRR2 in glioma cells. (A) SOX2 mRNA expression in control (n = 10) and GBM samples (n = 528) from The Cancer Genome Atlas (TCGA) cohort in GlioVis database (http://gliovis.bioinfo.cnio.es (accessed on 22 January 2021)). (B) Immunoblotting of SOX2 and p27KIP1 in U87MG and U251MG cell lines, in GNS166 and GNS179 patient-derived stem cell lines and in GB1012 and GB1034 GBM biopsies, β-actin was used as loading control. (C) Immunoblotting of SOX2, p27KIP1 and p21CIP1 in A172, T98G, U87MG, U373MG and U251MG cells, β-actin was used as loading control. (D) p21CIP1 and (E) p27KIP1 mRNA expression in control (n = 10) and glioblastoma (GBM) samples (n = 528) from The Cancer Genome Atlas (TCGA) cohort in GlioVis database. (F) Chromatin immunoprecipitation (ChIP) of p27KIP1 at SOX2-SRR2 of two different stages: U87MG oncospheres vs. U87MG parental cells and T98G parental cells (n = 3). The statistical significance was assessed by ANOVA test: * p < 0.05, ** p < 0.01 and *** p < 0.001. (G) ChIP of p27KIP1 in the SOX2-SRR2 of mouse embryonic stem cells (mESCs) and neurospheres (neural stem cells, NSCs) before and after differentiation (n = 2).
Since the association of p21CIP1 and p27KIP1 partly mediates the effect of SRR2 on SOX2 repression in several cell types [20], we studied the expression of p21CIP1 and p27KIP1 in glioma cell lines and biopsies. The levels of p21CIP1 were elevated in GBM from the TCGA cohort, whilst p27KIP1 ones were slightly reduced (Figure 1D,E). The levels of p27KIP1 were also generally low in GSCs and glioma cells lines (Figure 1B,C). Glioma cell lines cultured under stem cell media grow as oncospheres, which express a striking elevation of SOX2 levels [15]. To characterize the impact of SRR2 enhancer in SOX2 expression on glioma cells, we performed ChIP assays in U87MG and T98G parental and U87MG oncosphere populations, studying the presence or absence of p27KIP1 in this region. Interestingly, ChIP assays revealed that p27KIP1 is highly enriched in SRR2 in U87MG and T98G parental cells and significantly reduced in U87MG oncosphere subpopulations (Figure 1F). We also studied the presence or absence of p27KIP1 in SRR2, in both normal and differentiated NSCs. For this, neurospheres generated in vitro from freshly dissected brains were used. Differentiated neurospheres showed an enrichment of p27KIP1 on SRR2 compared to non-differentiated neurospheres (Figure 1G). p27KIP1 was recruited to SRR2 in differentiated mouse embryonic stem cells (mESCs) cultured as embryoid bodies (Figure 1G), corroborating previous studies [20]. Altogether, these results suggest that SRR2 is involved in SOX2 activation in stem cells in physiological and pathological conditions in the brain, at least in part through p27KIP1 binding.
3.2. SRR2 Regulates SOX2 Expression in GBM Cells
Next, we engineered a deletion of SRR2 using CRISPR/Cas9 technology in U373MG cells (Figure 2A), which express high SOX2 levels (Figure 1C). We confirmed the deletion of SRR2 in U373MG SRR2del clone2 and clone5 after transfection with guides and Cas9 (Figure 2B and Figure S1). We then measured the expression of SOX2 in the different cell types. Immunofluorescence showed that most U373MG cells and U373MG CRISPR control cells (control) were positive for SOX2, in contrast with U87MG cells, which were used as a negative control (Figure 2C). Notably, U373MG SRR2del clone2 and clone5 showed a reduction in the number of SOX2-positive cells (Figure 2C,D). In line with this, analysis with Western blots showed a reduction of SOX2 levels in SRR2del clone2 and clone5 cells (Figure 2E). These results indicate that SRR2 deletion leads to a reduction in SOX2 expression, and thus demonstrate that SRR2 enhancer activity is required for SOX2 expression in U373MG cells.
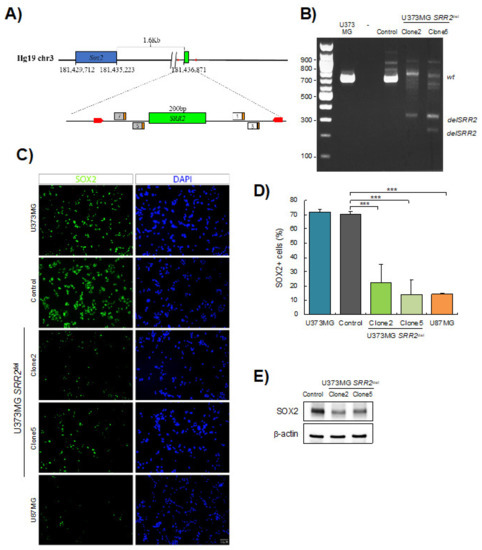
Figure 2.
SOX2 levels are reduced in SRR2-deleted cells. (A) Schematic representation of SOX2 and SRR2 downstream. At the bottom, magnification of the SRR2 surrounding region. SRR2 (200 bp) is marked by a green box. The location of the guides in 5′ (guide 7 and guide 5) and in 3′ (guide 1 and guide 3) single guide RNA (sgRNA) is labeled including their protospacer adjacent motif (PAM) sequence (orange box). Primers used for genotyping the deletion are marked with red arrows. (B) Gel electrophoresis showing loss of SRR2 in U373MG SRR2del clone2 and clone5 vs. control or parental cell line U373MG after transfection with guides and Cas9. (C) Representative images of SOX2 immunofluorescence (scale bar = 50 μm) and (D) quantification of SOX2-positive cells in U373MG (parental cells), control cells, U373MG SRR2del clone2 and clone5 and U87MG cells (n = 3). (E) Representative immunoblot of SOX2 in control, clone2 and clone5 cells. The statistical significance was obtained with the Student’s t-test (*** p < 0.001).
3.3. SRR2 Deletion Results in Impairment of Cell Proliferation and Stem Cell Activity in Glioma Cells
Next, we evaluated the effect of SRR2 deletion on the tumorigenic capacity of U373MG cells in vitro. By cell counting, we observed less cell growth in U373MG SRR2del clone2 and clone5 cells compared to CRISPR control cells (control) and U373MG parental cells (U373) (Figure 3A). Furthermore, SRR2-deleted cells presented a statistically significantly lower number of proliferative, phospho-Histone H3 (pH3)-positive cells (Figure 3B). Indeed, clone2 and clone5 displayed 1.35 and 1.06 positive cells, respectively, compared to 2.53 in control cells and 2.67 in U373 cells. To investigate the role of SRR2 in stem cell activity, U373, control, clone2 and clone5 cells were seeded in a selective medium for enrichment of the stem cell population. We observed a significant reduction in primary and secondary oncosphere formation efficiency in SRR2-deleted GBM cells compared to control and U373 cells, suggesting reduced stem cell activity (Figure 3C,D). In line with this, a reduced colony formation capacity was observed in cells deleted for SRR2 (Figure 3E). No significant differences were observed between U373 and control cells, which acted similarly in all tests. Moreover, the effect in clone5 was more intense than in clone2 in all experiments. These results confirm that SRR2 regulates SOX2-driven malignant properties in GBM cells.
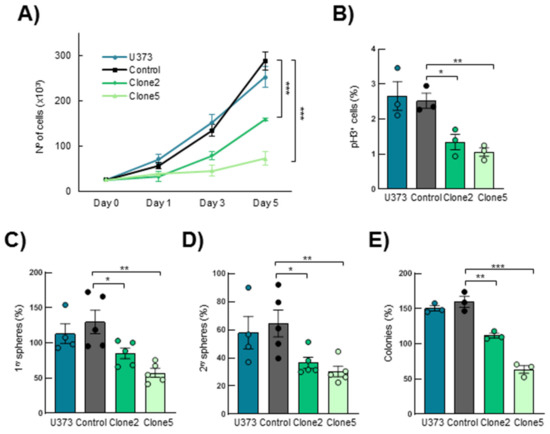
Figure 3.
SRR2 deletion reduces cell proliferation, self-renewal and colony formation capacity. (A) Cell growth curve performed in U373MG parental (U373), control, SRR2del clone2 and clone5 cells at indicated time points (n = 3). (B) Quantification of positive phospho-Histone H3 (pH3+) cells in parental, control, clone2 and clone5 cells (n = 3). (C) Quantification of primary oncospheres derived from parental, control, clone2 and clone5 cells when plating the same number of U373MG cells (n = 5). (D) Number of secondary oncospheres obtained after disaggregation of primary oncospheres and plating the same number of cells (n = 5). (E) Quantification of colony formation from parental, control, clone2 and clone5 cells after 10 days in culture (n = 3). The statistical significance was obtained with the Student’s t-test (* p < 0.05,** p < 0.01 and *** p < 0.001).
3.4. SOX2 Overexpression Rescues SRR2 Deletion Effects in U373MG Cells
To further determine whether deletion of SRR2 is necessary for SOX2 expression and oncogenic activity, we next tested whether SOX2 re-activation could restore the impaired phenotypes described in SRR2del cells. Immunofluorescence and Western blotting showed a significant increase in the number of SOX2-positive cells and expression levels in SOX2 control cells, as well as restoration of SOX2 in clone2 and clone5 cells infected with ectopic SOX2 (Figure 4A–C). As expected and previously described [15], forced expression of SOX2 significantly increased proliferation and stem cell properties in control U373MG cells (Figure 4D–H). Interestingly, clone2 and clone5 cells with ectopic expression of SOX2 also showed higher cell growth and a larger number of pH3+ cells compared to their respective controls (Figure 4D,E). Similarly, the ability to form primary and secondary oncospheres was increased in clone2 and clone5 cells with SOX2 restoration, reaching the numbers of control cells (Figure 4F,G) In agreement with this, clone2 and clone5 cells with SOX2 restoration displayed larger and bigger spheres (Figure S2), as well as increased capability to form colonies at low density compared to their respective controls (Figure 4H). These results show that ectopic expression of SOX2 rescues several phenotypes of SRR2del cells, indicating that the expression and the oncogenic activity of SOX2 is, at least in part, mediated by the SRR2 regulatory region.
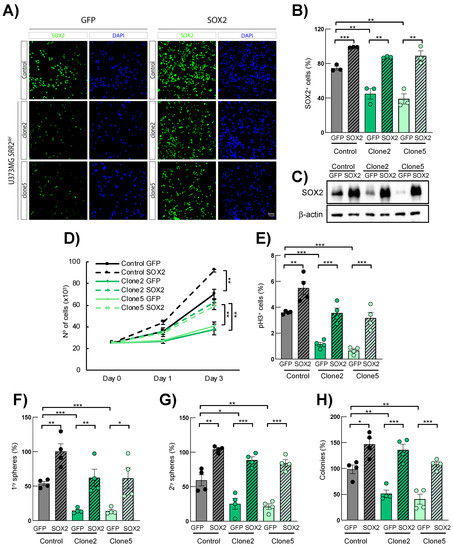
Figure 4.
SOX2 overexpression rescues SOX2 expression and malignant properties in SRR2-deleted cells. (A) Representative images of SOX2 immunofluorescence (scale bar = 50 μm) and (B) quantification of SOX2-positive cells in U373MG control, SRR2del clone2 and clone5 cells infected with control (GFP) and SOX2 (SOX2) constructs (n = 4). (C) Representative immunoblot of SOX2 in GFP control, clone2 and clone5 cells in GFP and SOX2 cells (n = 3). (D) Cell growth curve performed in GFP and SOX2 cells of indicated genotypes and time points (n = 4). (E) Quantification of positive pH3+ cells in GFP- and SOX2-overexpressing cells (n = 4). (F,G) Quantification of primary and secondary oncospheres in GFP- and SOX2-overexpressing cells (n = 4). (H) Quantification of colony in indicated genotypes after 10 days in culture (n = 4). The statistical significance was obtained with the Student’s t-test (* p < 0.05, ** p < 0.01 and *** p < 0.001).
3.5. Expression of p27KIP1 and p21CIP1 Is Altered in SRR2-Deleted Cells
p27KIP1 and p21CIP1, regulating quiescence and acting as cell cycle brakes, both repress SOX2 expression through SRR2, consequently leading to the reduction of proliferation and/or to differentiation programs in the adult brain [20]. At the same time, SOX2 controls the expression of both proteins in different cell types, forming a molecular loop [21,27,28,29]. To study the effect of the SRR2 deletion on those two proteins, we performed Western blots of p21CIP1 and p27KIP1 in U373MG control and SRR2del cells cultured in normal medium (Figure 5A) and as 2ry oncospheres (Figure 5B). We observed that SRR2del clone2 and clone5 cells presented higher levels of p27KIP1 and p21CIP1 than control cells in normal conditions (Figure 5A). Furthermore, the protein expression level of p27KIP1 and p21CIP1 in oncospheres was also higher than in controls (Figure 5B). Moreover, SRR2-deleted cells presented increased p21CIP1 and p27KIP1 mRNA expression compared to control cells (Figure 5C,D). Additionally, SRR2del clone5 cells also showed higher protein levels of p53, the upstream target of p21CIP1 (Figure S3). On the contrary, SRR2del cells presented decreased mRNA and protein levels of well-known stem cell markers such as BMI1, NANOG, NESTIN, OCT4, ID1 and OLIG2 (Figure 5E,F), supporting the idea that SRR2 is necessary for the SOX2 regulation of stemness pathways.
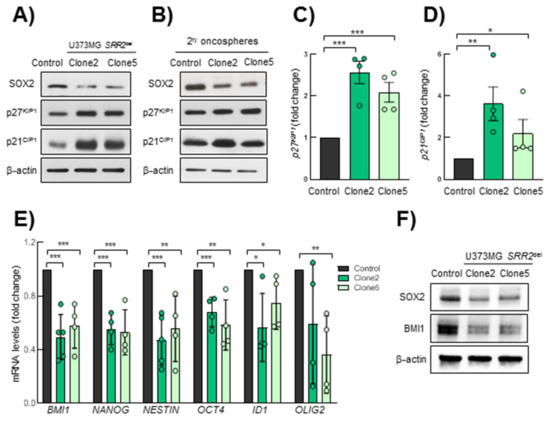
Figure 5.
SRR2-deleted cells show higher p21CIP1 and p27KIP1 levels. (A) Representative immunoblots of SOX2, p27KIP1 and p21CIP1 in U373MG control, SRR2del clone2 and clone5 cells. (B) Representative immunoblots of SOX2, p27KIP1 and p21CIP1 in secondary oncospheres derived from control, clone2 and clone5 cultured in stem cell conditions, References should be cited in numerical order. Please just confirm that all refs are correctly cited, then we will rearrange the order after proofreading. (C,D) mRNA expression levels of p27KIP and p21CIP1 by RT-qPCR in clone2 and clone5 referring to control (n = 4). (E) mRNA expression levels of BMI1, NANOG, NESTIN, OCT4, ID1 and OLIG2 by RT-qPCR in clone2 and clone5 referring to control (n = 4). (F) Representative immunoblots of SOX2 and BMI1 in control, clone2 and clone5 cells. The statistical significance was assessed with the Student’s t-test (* p < 0.05, ** p < 0.01 and *** p < 0.001).
3.6. SRR2 Deletion Reduces Tumor Initiation and Progression
Finally, in order to assess the effect of SRR2 deletion on the tumorigenic capacity of glioma cells in vivo, we performed a tumor initiation assay in immunodeficient mice by injecting different concentrations of U373MG control, SRR2del clone2 and clone5 cells. One hundred percent of animals injected with 100,000 control cells developed tumors versus 25% in those injected with the same numbers of clone2 cells, and 0% in those receiving clone5 cells (Figure 6A). Using the ELDA tool, we calculated the frequency of tumor-initiating cells. This revealed a significantly lower frequency in clone2 and clone5 cells, respectively, of 1/1.9.106 cells and no tumor-initiating cells (1/∞), compared to 1/4.105 in control cells (Figure 6B). Of note, clone5 cells were unable to form tumors, further showing a stronger effect than clone2. Moreover, tumors derived from SRR2-deleted clone2 cells were significantly smaller compared to controls (Figure 6C). Indeed, subcutaneous tumors derived from clone2 cells reached a volume of less than 25 mm3 after 140 days, compared to tumors from control cells that grew to an average of 170 mm3 during the same time (Figure 6C,D). In line with these results, the weight of clone2 cell-derived tumors were lower than tumors from control cells (Figure 6E). We then performed immunohistochemistry with SOX2, Ki67, BMI1, p27KIP1 and p21CIP1. Tumors generated from clone2 displayed lower expression of SOX2, Ki67 and BMI1 compared to the tumors formed by control cells (Figure 6F,G), validating the in vitro observations of impaired proliferation and stemness of SRR2del cells. In contrast, clone2-derived tumors exhibited higher levels of p27KIP1 and p21CIP1 (Figure 6F,G). In summary, these results reveal that SRR2 is required for SOX2 tumorigenic activity.
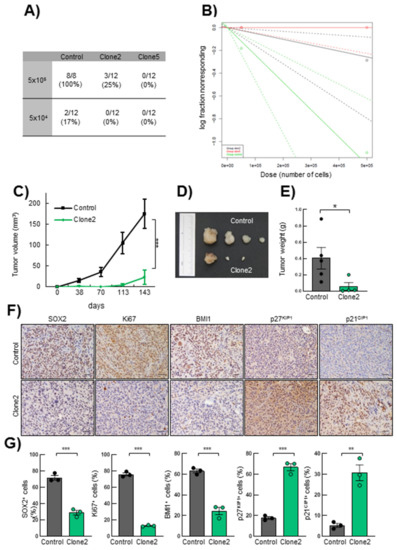
Figure 6.
SRR2 deletion affects tumor initiation and progression in vivo. (A) Table of incidence of the number of tumors formed by control, clone2 and clone5 cells after subcutaneous injection of 5 × 10⁵ and 5 × 10⁴ cited cells in 8-week-old immunosuppressed Foxn1nu/Foxn1nu nude mice (n = 12). (B) Logarithmic representation of the tumor initiation frequency after subcutaneous injection of different concentrations of control, clone2 and clone5 cells in nude mice. The incidence of tumor initiation was calculated using the ELDA platform and chi-square tests (χ2) (p = 5.92 × 10⁻⁵). (C) Graph representing tumor volume developed after subcutaneous injection of control, clone2 and clone5 cells in nude mice measured at the indicated time points (n = 12). (D) Representative image of tumors derived from control and clone2 cells. (E) Average weight of the tumors generated. (F–G) Representative images and quantification of SOX2, Ki67, BMI1, nuclear p27KIP1 and p21CIP1 immunohistochemical staining on sections from control and clone2 tumors, scale bar = 100 µm. The statistical significance was obtained with the Student’s t-test (* p < 0.05, ** p < 0.01 and *** p < 0.001).
4. Discussion
SOX2 expression involves a complex network of transcriptional, post-transcriptional and post-translational regulators. The downstream SOX2 regulatory region 2 (SRR2) exerts relevant control on SOX2 expression. In this regard, SRR2 is a region involved in the expression of SOX2 in pluripotent stem cells during development and in the maintenance of stem characteristics in various adult stem cell populations [16]. In this study, we dissected the influence of SRR2 on SOX2 expression in glioma cells and demonstrated that the deletion of this regulatory region significantly reduces SOX2 levels, and hence activity in these cancer cells.
Our results confirm that SRR2 mediates repression of SOX2 expression in differentiation conditions in GSCs and NSCs. This effect might be mediated via different mechanisms. We reveal that it happens through p27KIP binding. p21CIP1 has also been identified as a regulator of SOX2 expression in NSCs via binding on SRR2 [21]. Additionally, OCT3/4 and SOX2 complexes can bind to SRR2 and promote SOX2 expression [30]. Our results extend the understanding and the relevance of p27KIP1 repressive action for modulation of SOX2 levels because conclusions in previous studies were limited to physiological conditions. In this regard, we previously showed that p27KIP1 recruits a repressor complex on SRR2 to repress SOX2 expression during embryonic stem cell differentiation [20].
We prove that SRR2 deletion leads to a reduction in the expression of SOX2 in glioma cells. Previous studies showed that SOX2 expression depends on the epigenetic status of SRR2 in NSCs [31]. Indeed, increasing CpG methylation in SRR2 coincides with lower expression of SOX2 and differentiation into neurons [31]. SRR2 contains a functional SOX-binding site whose mutations result in complete loss of transcriptional stimulating activity, demonstrating the positive feedback of SOX2 on its own expression [19]. Our results highlight that SRR2 controls SOX2 expression in brain stem cells not only under physiological but also under pathological conditions. Indeed, our findings experimentally demonstrate the relevance of SRR2 as an enhancer of SOX2 expression in cancer cells because deletion of SRR2 in GBM cells leads to a reduction of SOX2 expression.
The de-repression of SOX2 has been associated with a wide range of cancer types, including GBM [3]. In the latter, high levels of SOX2 are associated with GSCs and lower patient survival and its activity is required for tumor maintenance and progression, because silencing of the gene in GBM cells reduces the capacity to proliferate, migrate and self-renew, whereas SOX2 overexpression promotes an increase in cell proliferation, migration and self-renewal capacity [3,10,11,12,13,14,15]. Here, we report that deletion of SRR2 in glioma cells leads to a reduction in proliferation and stem cell activity in vitro. Notably, in vivo, our xenograft models revealed that the lack of SRR2 results in an impairment of tumor initiation and growth. Furthermore, ectopic SOX2 overexpression in SRR2 enhancer-deleted cells restored SOX2 expression as well as proliferation and stemness capacities. These results reveal that the SRR2 regulatory region is required for SOX2 expression and hence tumorigenic activity in cancer cells.
To further characterize proteins involved in the regulation of SOX2 expression, we studied p27KIP1 and p21CIP1. We analyzed these proteins because (i) SOX2’s proliferative function in cancer cells is exerted, at least in part, through direct repression of p21CIP1 and p27KIP1 expression [27,28]; (ii) there is an interaction between SOX2 and p27KIP1 in mice, in which we have just demonstrated that Srr2 plays a role [20,29]. We observed an increased expression of both p21CIP1 and p27KIP1 in SRR2-deleted glioma cells. Together with the information presented above, these results indicate the existence of repressive, cross-regulatory interactions between SOX2, p21CIP1 and p27KIP1 that play important roles in cancer cells. In summary, our results highlight the central role of SRR2 to maintain high levels of SOX2 expression, and hence malignant properties of glioma cells establishing the requirement for this regulatory region for SOX2-driven tumorigenic activities.
5. Conclusions
SRR2 deletion by CRISPR/Cas9 technology leads to a reduction in SOX2 expression in glioma cells. Consequently, cell growth and proliferation are reduced in these cells, while self-renewal capacity is impaired in GSCs. This is associated with an increase in the expression of the negative regulators of the cell cycle, p21CIP1 and p27KIP1. Furthermore, deletion of SRR2 impairs tumor initiation and progression capacity of cancer cells in vivo. Our results indicate that prevention of SRR2 activity leads to a reduction of oncogenic properties promoted by SOX2, suggesting that SRR2 may represent a novel therapeutic target in the treatment of GBM, to tackle GSCs, and hence relapse of these lethal tumors.
Supplementary Materials
The following are available online at https://www.mdpi.com/article/10.3390/cancers13071574/s1, Figure S1. Clone2 and Clone5 sequenced and matching in genomic human sequence of SRR2. Figure S2. Ectopic expression of SOX2 rescues stem cell activity in SRR2 deleted cells. Figure S3. A) Expression of p53 in SRR2 deleted GBM cells. Figure S4. Uncropped Western Blots. Table S1. Primers for CRISPR genome editing. Table S2. Primers used for Genotyping and ChIP assay.
Author Contributions
A.S.-A. performed experiments and analyzed the results with J.A.-I. and A.E.-P., V.M.-A. performed CRISPR/Cas9 technique, the ChIP experiments and helped with SOX2 overexpression experiments. K.R. and R.L.-B. supervised experiments and results and all revised the manuscript. A.M. directed the project, contributed to data analysis and wrote the manuscript. All authors have read and agreed to the published version of the manuscript.
Funding
A.S.-A. and J.A.-I. are recipients of predoctoral fellowships from Instituto de Salud Carlos III (FI17/00250) and the Department of Education, University and Research of the Basque Government (PRE_2016_1_0375). A.M.’s lab is supported by grants from Instituto de Salud Carlos III and FEDER Funds (CP16/00039, DTS16/00184, PI16/01580, DTS18/00181, PI19/01355) and the Industry and Health Departments of the Basque Country. R.L.-B.’s lab is supported by the Medical Research Council, UK (U117512772, U117562207 and U117570590), the Francis Crick Institute which receives its core funding from Cancer Research UK (FC001107), the UK Medical Research Council (FC001107), the Wellcome Trust (FC001107) and the Worldwide Cancer Research charity (grant 13-1270).
Institutional Review Board Statement
The study was conducted according to the guidelines of the Declaration of Helsinki, and approved by the Institutional Review Board (or Ethics Committee) of Biodonostia Health Research Institute (protocol code PI2016151 and approved on 10-April-2017).
Informed Consent Statement
Informed consent was obtained from all subjects involved in the study.
Data Availability Statement
The data presented in this study are available on request from the corresponding author.
Acknowledgments
We thank the Histology Platform of the Biodonostia Health Research Institute for their help.
Conflicts of Interest
The authors declare no conflict of interest.
References
- Sarkar, A.; Hochedlinger, K. The Sox Family of Transcription Factors: Versatile Regulators of Stem and Progenitor Cell Fate. Cell Stem Cell 2013, 12, 15–30. [Google Scholar] [CrossRef]
- De La Rocha, A.M.A.; Sampron, N.; Alonso, M.M.; Matheu, A. Role of SOX family of transcription factors in central nervous system tumors. Am. J. Cancer Res. 2014, 4, 312–324. [Google Scholar] [PubMed]
- Garros-Regulez, L.; Garcia, I.; Carrasco-Garcia, E.; Lantero, A.; Aldaz, P.; Moreno-Cugnon, L.; Arrizabalaga, O.; Undabeitia, J.; Torres-Bayona, S.; Villanua, J.; et al. Targeting SOX2 as a Therapeutic Strategy in Glioblastoma. Front. Oncol. 2016, 6, 222. [Google Scholar] [CrossRef]
- Grimm, D.; Bauer, J.; Wise, P.; Krüger, M.; Simonsen, U.; Wehland, M.; Infanger, M.; Corydon, T.J. The role of SOX family members in solid tumours and metastasis. Semin. Cancer Biol. 2020, 67, 122–153. [Google Scholar] [CrossRef] [PubMed]
- Kumar, P.; Mistri, T.K. Transcription factors in SOX family: Potent regulators for cancer initiation and development in the human body. Semin. Cancer Biol. 2020, 67, 105–113. [Google Scholar] [CrossRef] [PubMed]
- Wuebben, E.L.; Rizzino, A. The dark side of SOX2: Cancer—A comprehensive overview. Oncotarget 2017, 8, 44917–44943. [Google Scholar] [CrossRef]
- Louis, D.N.; Perry, A.; Reifenberger, G.; Von Deimling, A.; Figarella-Branger, D.; Cavenee, W.K.; Ohgaki, H.; Wiestler, O.D.; Kleihues, P.; Ellison, D.W. The 2016 World Health Organization Classification of Tumors of the Central Nervous System: A summary. Acta Neuropathol. 2016, 131, 803–820. [Google Scholar] [CrossRef] [PubMed]
- Brennan, C.W.; Verhaak, R.G.; McKenna, A.; Campos, B.; Noushmehr, H.; Salama, S.R.; Zheng, S.; Chakravarty, D.; Sanborn, J.Z.; Berman, S.H.; et al. The somatic genomic landscape of glioblastoma. Cell 2013, 155, 462–477. [Google Scholar] [CrossRef]
- Carrasco-Garcia, E.; Sampron, N.; Aldaz, P.; Arrizabalaga, O.; Villanua, J.; Barrena, C.; Ruiz, I.; Arrazola, M.; Lawrie, C.; Matheu, A. Therapeutic strategies targeting glioblastoma stem cells. Recent Patents Anti-Cancer Drug Discov. 2013, 8, 216–227. [Google Scholar] [CrossRef] [PubMed]
- Bulstrode, H.; Johnstone, E.; Marques-Torrejon, M.A.; Ferguson, K.M.; Bressan, R.B.; Blin, C.; Grant, V.; Gogolok, S.; Gangoso, E.; Gagrica, S.; et al. Elevated FOXG1 and SOX2 in glioblastoma enforces neural stem cell identity through transcriptional control of cell cycle and epigenetic regulators. Genes Dev. 2017, 31, 757–773. [Google Scholar] [CrossRef]
- Hägerstrand, D.; He, X.; Lindh, M.B.; Hoefs, S.; Hesselager, G.; Östman, A.; Nistér, M. Identification of a SOX2-dependent subset of tumor- and sphere-forming glioblastoma cells with a distinct tyrosine kinase inhibitor sensitivity profile. Neuro Oncol. 2011, 13, 1178–1191. [Google Scholar] [CrossRef] [PubMed]
- Lopez-Bertoni, H.; Lal, B.; Michelson, N.; Guerrero-Cázares, H.; Quiñones-Hinojosa, A.; Li, Y.; Laterra, J. Epigenetic modulation of a miR-296-5p:HMGA1 axis regulates Sox2 expression and glioblastoma stem cells. Oncogene 2016, 35, 4903–4913. [Google Scholar] [CrossRef]
- Alonso, M.M.; Diez-Valle, R.; Manterola, L.; Rubio, A.; Liu, D.; Cortes-Santiago, N.; Urquiza, L.; Jauregi, P.; De Munain, A.L.; Sampron, N.; et al. Genetic and Epigenetic Modifications of Sox2 Contribute to the Invasive Phenotype of Malignant Gliomas. PLoS ONE 2011, 6, e26740. [Google Scholar] [CrossRef]
- Gangemi, R.M.R.; Griffero, F.; Marubbi, D.; Perera, M.; Capra, M.C.; Malatesta, P.; Ravetti, G.L.; Zona, G.L.; Daga, A.; Corte, G. SOX2 Silencing in Glioblastoma Tumor-Initiating Cells Causes Stop of Proliferation and Loss of Tumorigenicity. Stem Cells 2009, 27, 40–48. [Google Scholar] [CrossRef]
- Garros-Regulez, L.; Aldaz, P.; Arrizabalaga, O.; Moncho-Amor, V.; Carrasco-Garcia, E.; Manterola, L.; Moreno-Cugnon, L.; Barrena, C.; Villanua, J.; Ruiz, I.; et al. mTOR inhibition decreases SOX2-SOX9 mediated glioma stem cell activity and temozolomide resistance. Expert Opin. Ther. Targets 2016, 20, 393–405. [Google Scholar] [CrossRef]
- Miyagi, S.; Saito, T.; Mizutani, K.-I.; Masuyama, N.; Gotoh, Y.; Iwama, A.; Nakauchi, H.; Masui, S.; Niwa, H.; Nishimoto, M.; et al. The Sox-2 Regulatory Regions Display Their Activities in Two Distinct Types of Multipotent Stem Cells. Mol. Cell. Biol. 2004, 24, 4207–4220. [Google Scholar] [CrossRef]
- Tomioka, M.; Nishimoto, M.; Miyagi, S.; Katayanagi, T.; Fukui, N.; Niwa, H.; Muramatsu, M.; Okuda, A. Identification of Sox-2 regulatory region which is under the control of Oct-3/4-Sox-2 complex. Nucleic Acids Res. 2002, 30, 3202–3213. [Google Scholar] [CrossRef] [PubMed]
- Zhou, H.Y.; Katsman, Y.; Dhaliwal, N.K.; Davidson, S.; Macpherson, N.N.; Sakthidevi, M.; Collura, F.; Mitchell, J.A. A Sox2 distal enhancer cluster regulates embryonic stem cell differentiation potential. Genes Dev. 2014, 28, 2699–2711. [Google Scholar] [CrossRef]
- Miyagi, S.; Nishimoto, M.; Saito, T.; Ninomiya, M.; Sawamoto, K.; Okano, H.; Muramatsu, M.; Oguro, H.; Iwama, A.; Okuda, A. The Sox2 Regulatory Region 2 Functions as a Neural Stem Cell-specific Enhancer in the Telencephalon. J. Biol. Chem. 2006, 281, 13374–13381. [Google Scholar] [CrossRef]
- Li, H.; Collado, M.; Villasante, A.; Matheu, A.; Lynch, C.J.; Cañamero, M.; Rizzoti, K.; Carneiro, C.; Martínez, G.; Vidal, A.; et al. p27Kip1 Directly Represses Sox2 during Embryonic Stem Cell Differentiation. Cell Stem Cell 2012, 11, 845–852. [Google Scholar] [CrossRef] [PubMed]
- Marqués-Torrejón, M.Á.; Porlan, E.; Banito, A.; Gómez-Ibarlucea, E.; Lopez-Contreras, A.J.; Fernández-Capetillo, Ó.; Vidal, A.; Gil, J.; Torres, J.; Fariñas, I. Cyclin-Dependent Kinase Inhibitor p21 Controls Adult Neural Stem Cell Expansion by Regulating Sox2 Gene Expression. Cell Stem Cell 2013, 12, 88–100. [Google Scholar] [CrossRef] [PubMed]
- Jung, K.; Gupta, N.; Wang, P.; Lewis, J.T.; Gopal, K.; Wu, F.; Ye, X.; Alshareef, A.; Abdulkarim, B.S.; Douglas, D.N.; et al. Triple negative breast cancers comprise a highly tumorigenic cell subpopulation detectable by its high responsiveness to a Sox2 regulatory region 2 (SRR2) reporter. Oncotarget 2015, 6, 10366–10373. [Google Scholar] [CrossRef]
- Leis, O.; Eguiara, A.; Lopez-Arribillaga, E.; Alberdi, M.J.; Hernandez-García, S.; Elorriaga, K.; Pandiella, A.; Rezola, R.; Martín, Á.G. Sox2 expression in breast tumours and activation in breast cancer stem cells. Oncogene 2011, 31, 1354–1365. [Google Scholar] [CrossRef] [PubMed]
- Ran, F.A.; Hsu, P.D.; Wright, J.; Agarwala, V.; Scott, D.A.; Zhang, F. Genome engineering using the CRISPR-Cas9 system. Nat. Protoc. 2013, 8, 2281–2308. [Google Scholar] [CrossRef] [PubMed]
- Shi, B.; Deng, L.; Shi, X.; Dai, S.; Zhang, H.; Wang, Y.; Bi, J.; Guo, M. The enhancement of neural stem cell survival and growth by coculturing with expanded sertoli cells in vitro. Biotechnol. Prog. 2011, 28, 196–205. [Google Scholar] [CrossRef]
- Arrizabalaga, O.; Moreno-Cugnon, L.; Auzmendi-Iriarte, J.; Aldaz, P.; De Cáceres, I.I.; Garros-Regulez, L.; Moncho-Amor, V.; Torres-Bayona, S.; Pernía, O.; Pintado-Berninches, L.; et al. High expression of MKP1/DUSP1 counteracts glioma stem cell activity and mediates HDAC inhibitor response. Oncogenesis 2017, 6, 401. [Google Scholar] [CrossRef] [PubMed]
- Herrerosvillanueva, M.; Zhang, J.-S.; Koenig, A.; Abel, E.V.; Smyrk, T.C.; Bamlet, W.R.; De Narvajas, A.A.-M.; Gomez, T.S.; Simeone, D.M.; Bujanda, L.; et al. SOX2 promotes dedifferentiation and imparts stem cell-like features to pancreatic cancer cells. Oncogenesis 2013, 2, e61. [Google Scholar] [CrossRef]
- Yamawaki, K.; Ishiguro, T.; Mori, Y.; Yoshihara, K.; Suda, K.; Tamura, R.; Yamaguchi, M.; Sekine, M.; Kashima, K.; Higuchi, M.; et al. Sox2-dependent inhibition of p21 is associated with poor prognosis of endometrial cancer. Cancer Sci. 2017, 108, 632–640. [Google Scholar] [CrossRef] [PubMed]
- Moncho-Amor, V.; Chakravarty, P.; Galichet, C.; Matheu, A.; Lovell-Badge, R.; Rizzoti, K. SOX2 is required independently in both stem and differentiated cells for pituitary tumorigenesis in p27-null mice. Proc. Natl. Acad. Sci. USA 2021, 118, 2017115118. [Google Scholar] [CrossRef]
- Funabashi, H.; Takatsu, M.; Saito, M.; Matsuoka, H. Sox2 regulatory region 2 sequence works as a DNA nuclear targeting sequence enhancing the efficiency of an exogenous gene expression in ES cells. Biochem. Biophys. Res. Commun. 2010, 400, 554–558. [Google Scholar] [CrossRef]
- Sikorska, M.; Sandhu, J.K.; Deb-Rinker, P.; Jezierski, A.; Leblanc, J.; Charlebois, C.; Ribecco-Lutkiewicz, M.; Bani-Yaghoub, M.; Walker, P.R. Epigenetic modifications ofSOX2 enhancers, SRR1 and SRR2, correlate with in vitro neural differentiation. J. Neurosci. Res. 2008, 86, 1680–1693. [Google Scholar] [CrossRef] [PubMed]
Publisher’s Note: MDPI stays neutral with regard to jurisdictional claims in published maps and institutional affiliations. |
© 2021 by the authors. Licensee MDPI, Basel, Switzerland. This article is an open access article distributed under the terms and conditions of the Creative Commons Attribution (CC BY) license (http://creativecommons.org/licenses/by/4.0/).