
Association of Polygenetic Risk Scores Related to Cell Differentiation and Inflammation with Thyroid Cancer Risk and Genetic Interaction with Dietary Intake


Simple Summary
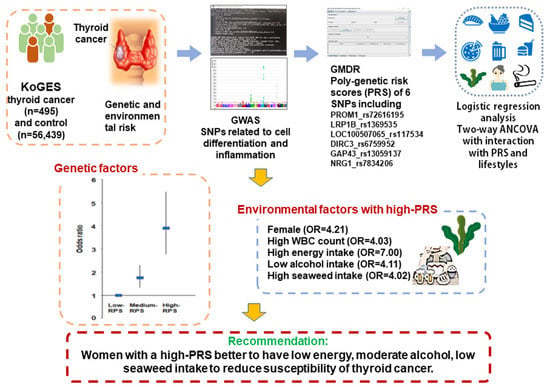
Abstract
1. Introduction
2. Materials and Methods
2.1. Participants
2.2. Criteria of Thyroid Cancer and Inclusion/Exclusion Criteria of the Participants
2.3. Anthropometric and Biochemical Measurements
2.4. Semiquantitative Food Frequency Questionnaire (SQFFQ) Responses and Dietary Pattern Analysis
2.5. Genotyping and Quality Control
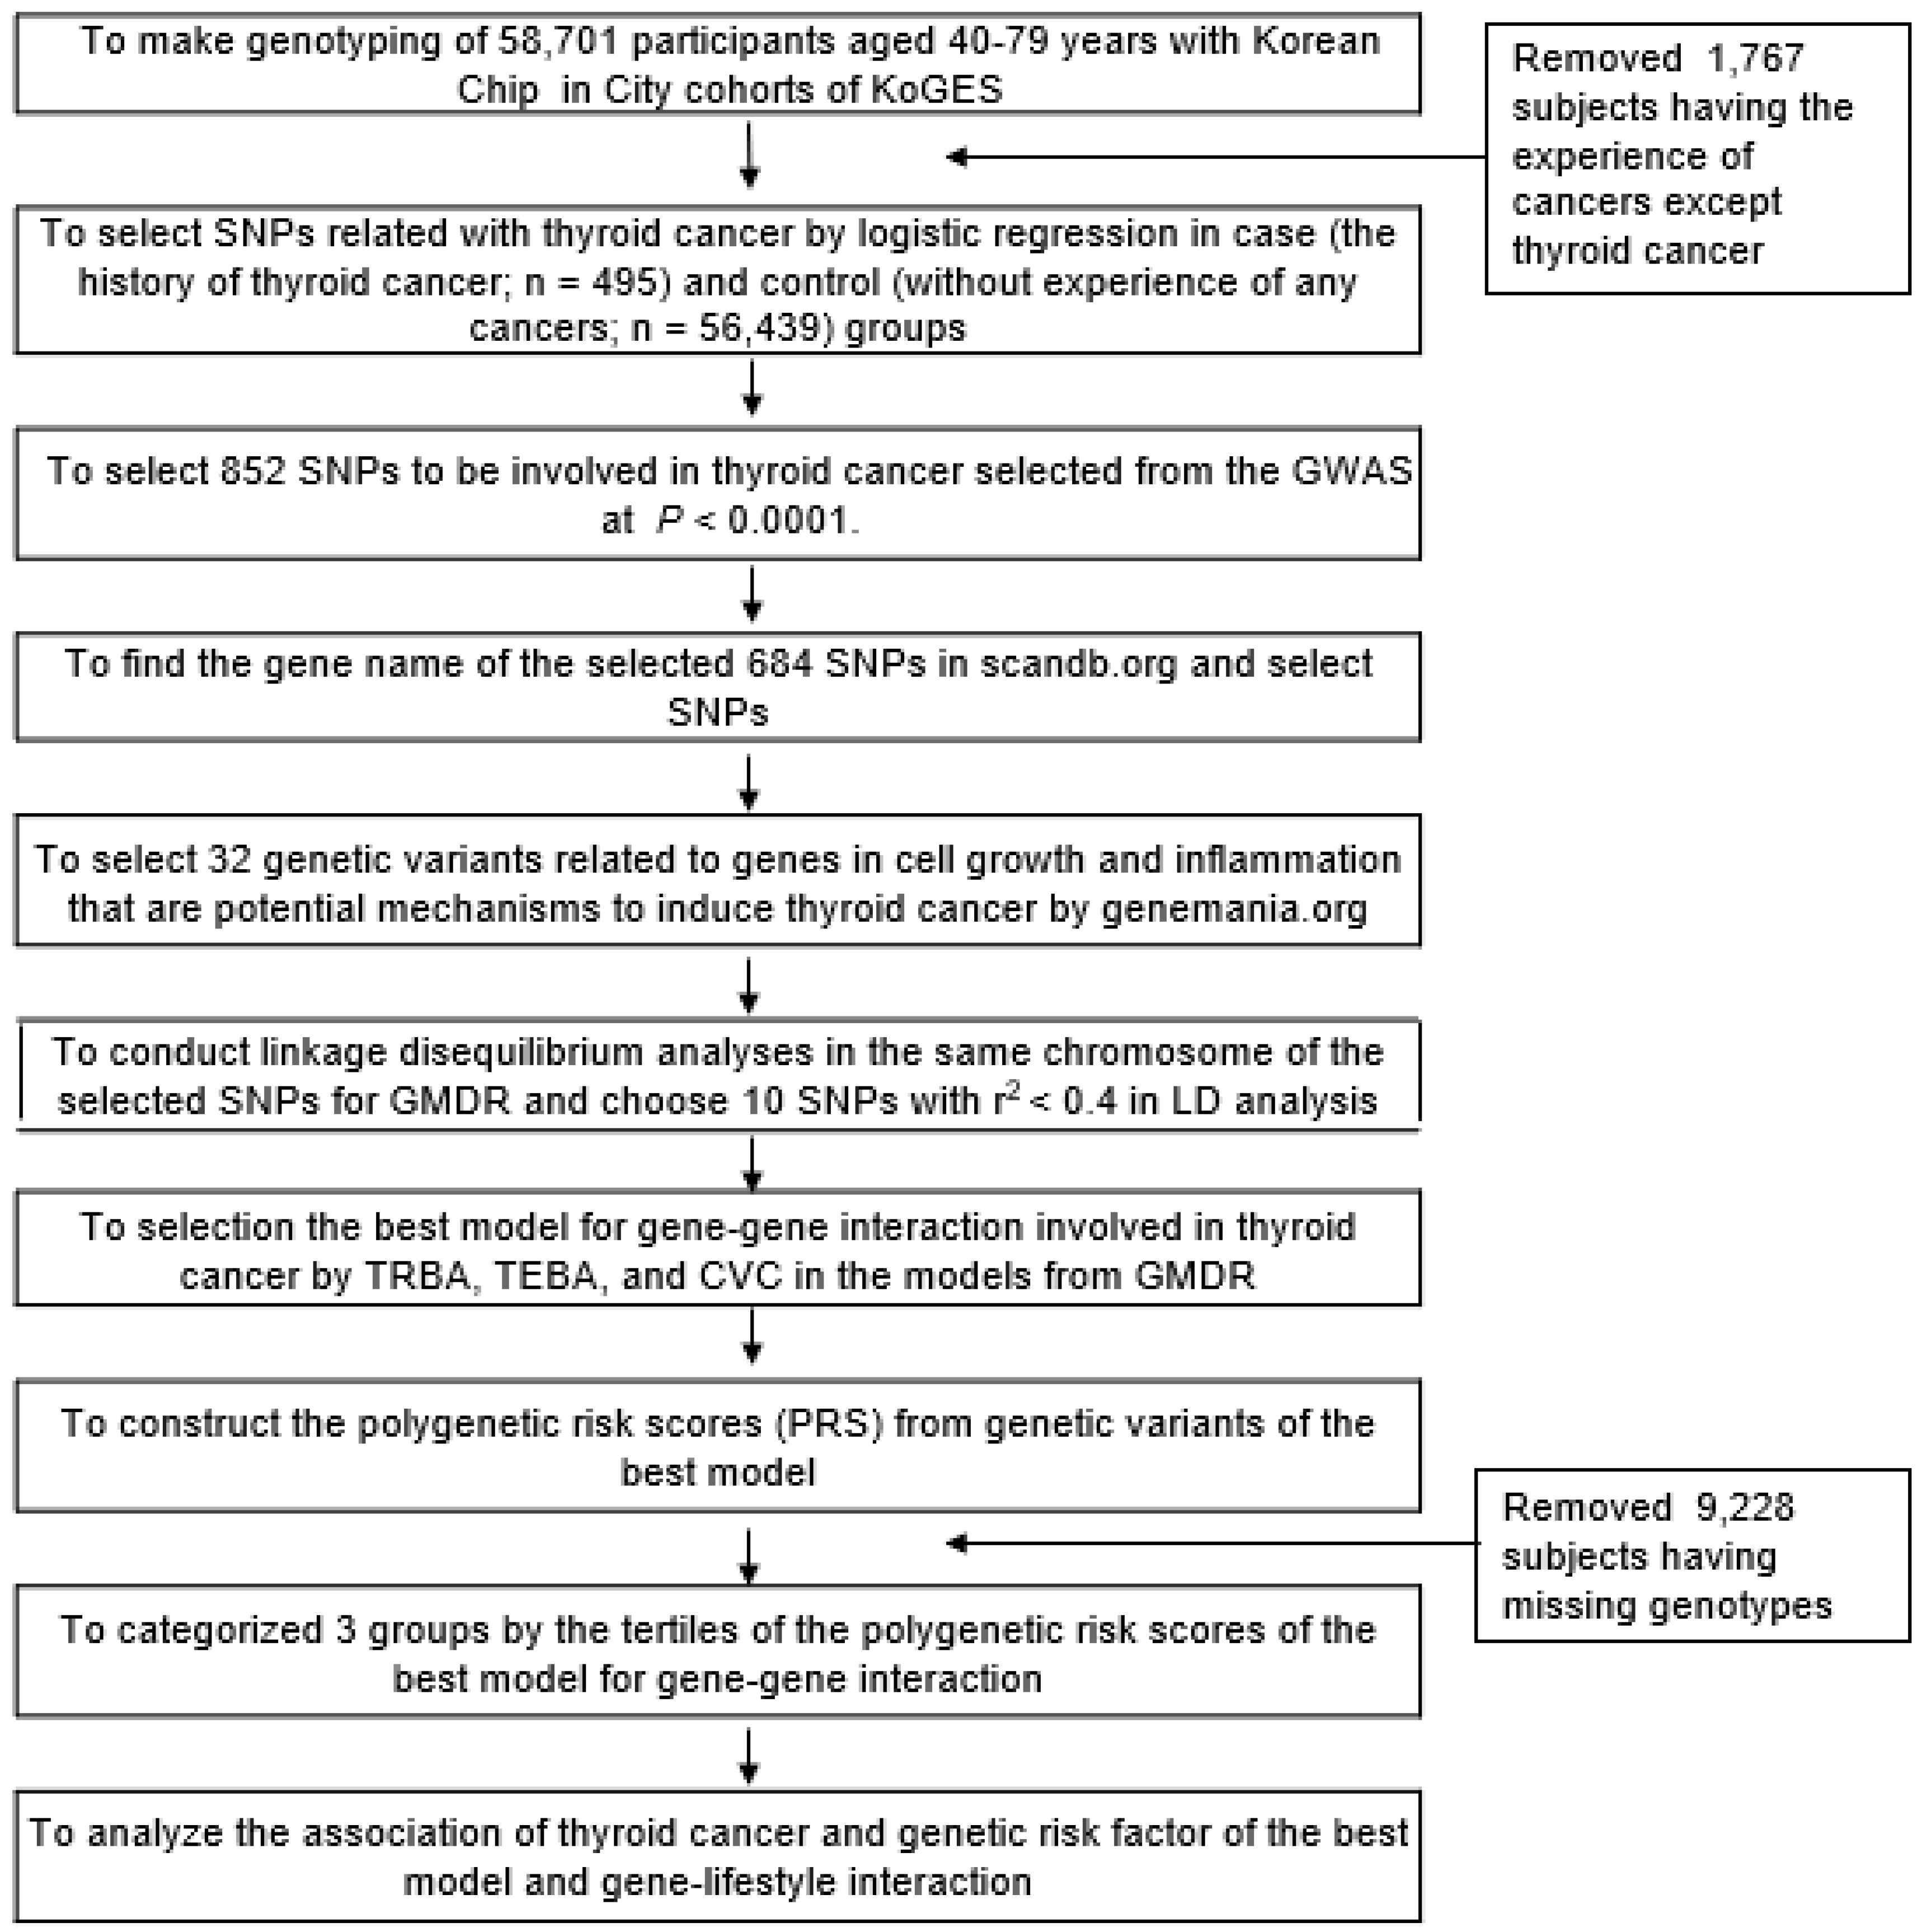
2.6. Identification of the Best Model for Gene–Gene Interactions by Generalized Multifactor Dimensionality Reduction (GMDR) from among the Genetic Variants Selected from the GWAS
2.7. Statistical Analyses
3. Results
3.1. General Characteristics of the Participants According to the Presence of Thyroid Cancer
3.2. Nutrient Intakes and Dietary Patterns According to the Presence of Thyroid Cancer
3.3. Association of Genetic Variants For Thyroid Cancer Risk and the Best Model for Gene–Gene Interactions Related to Cell Growth and Inflammation
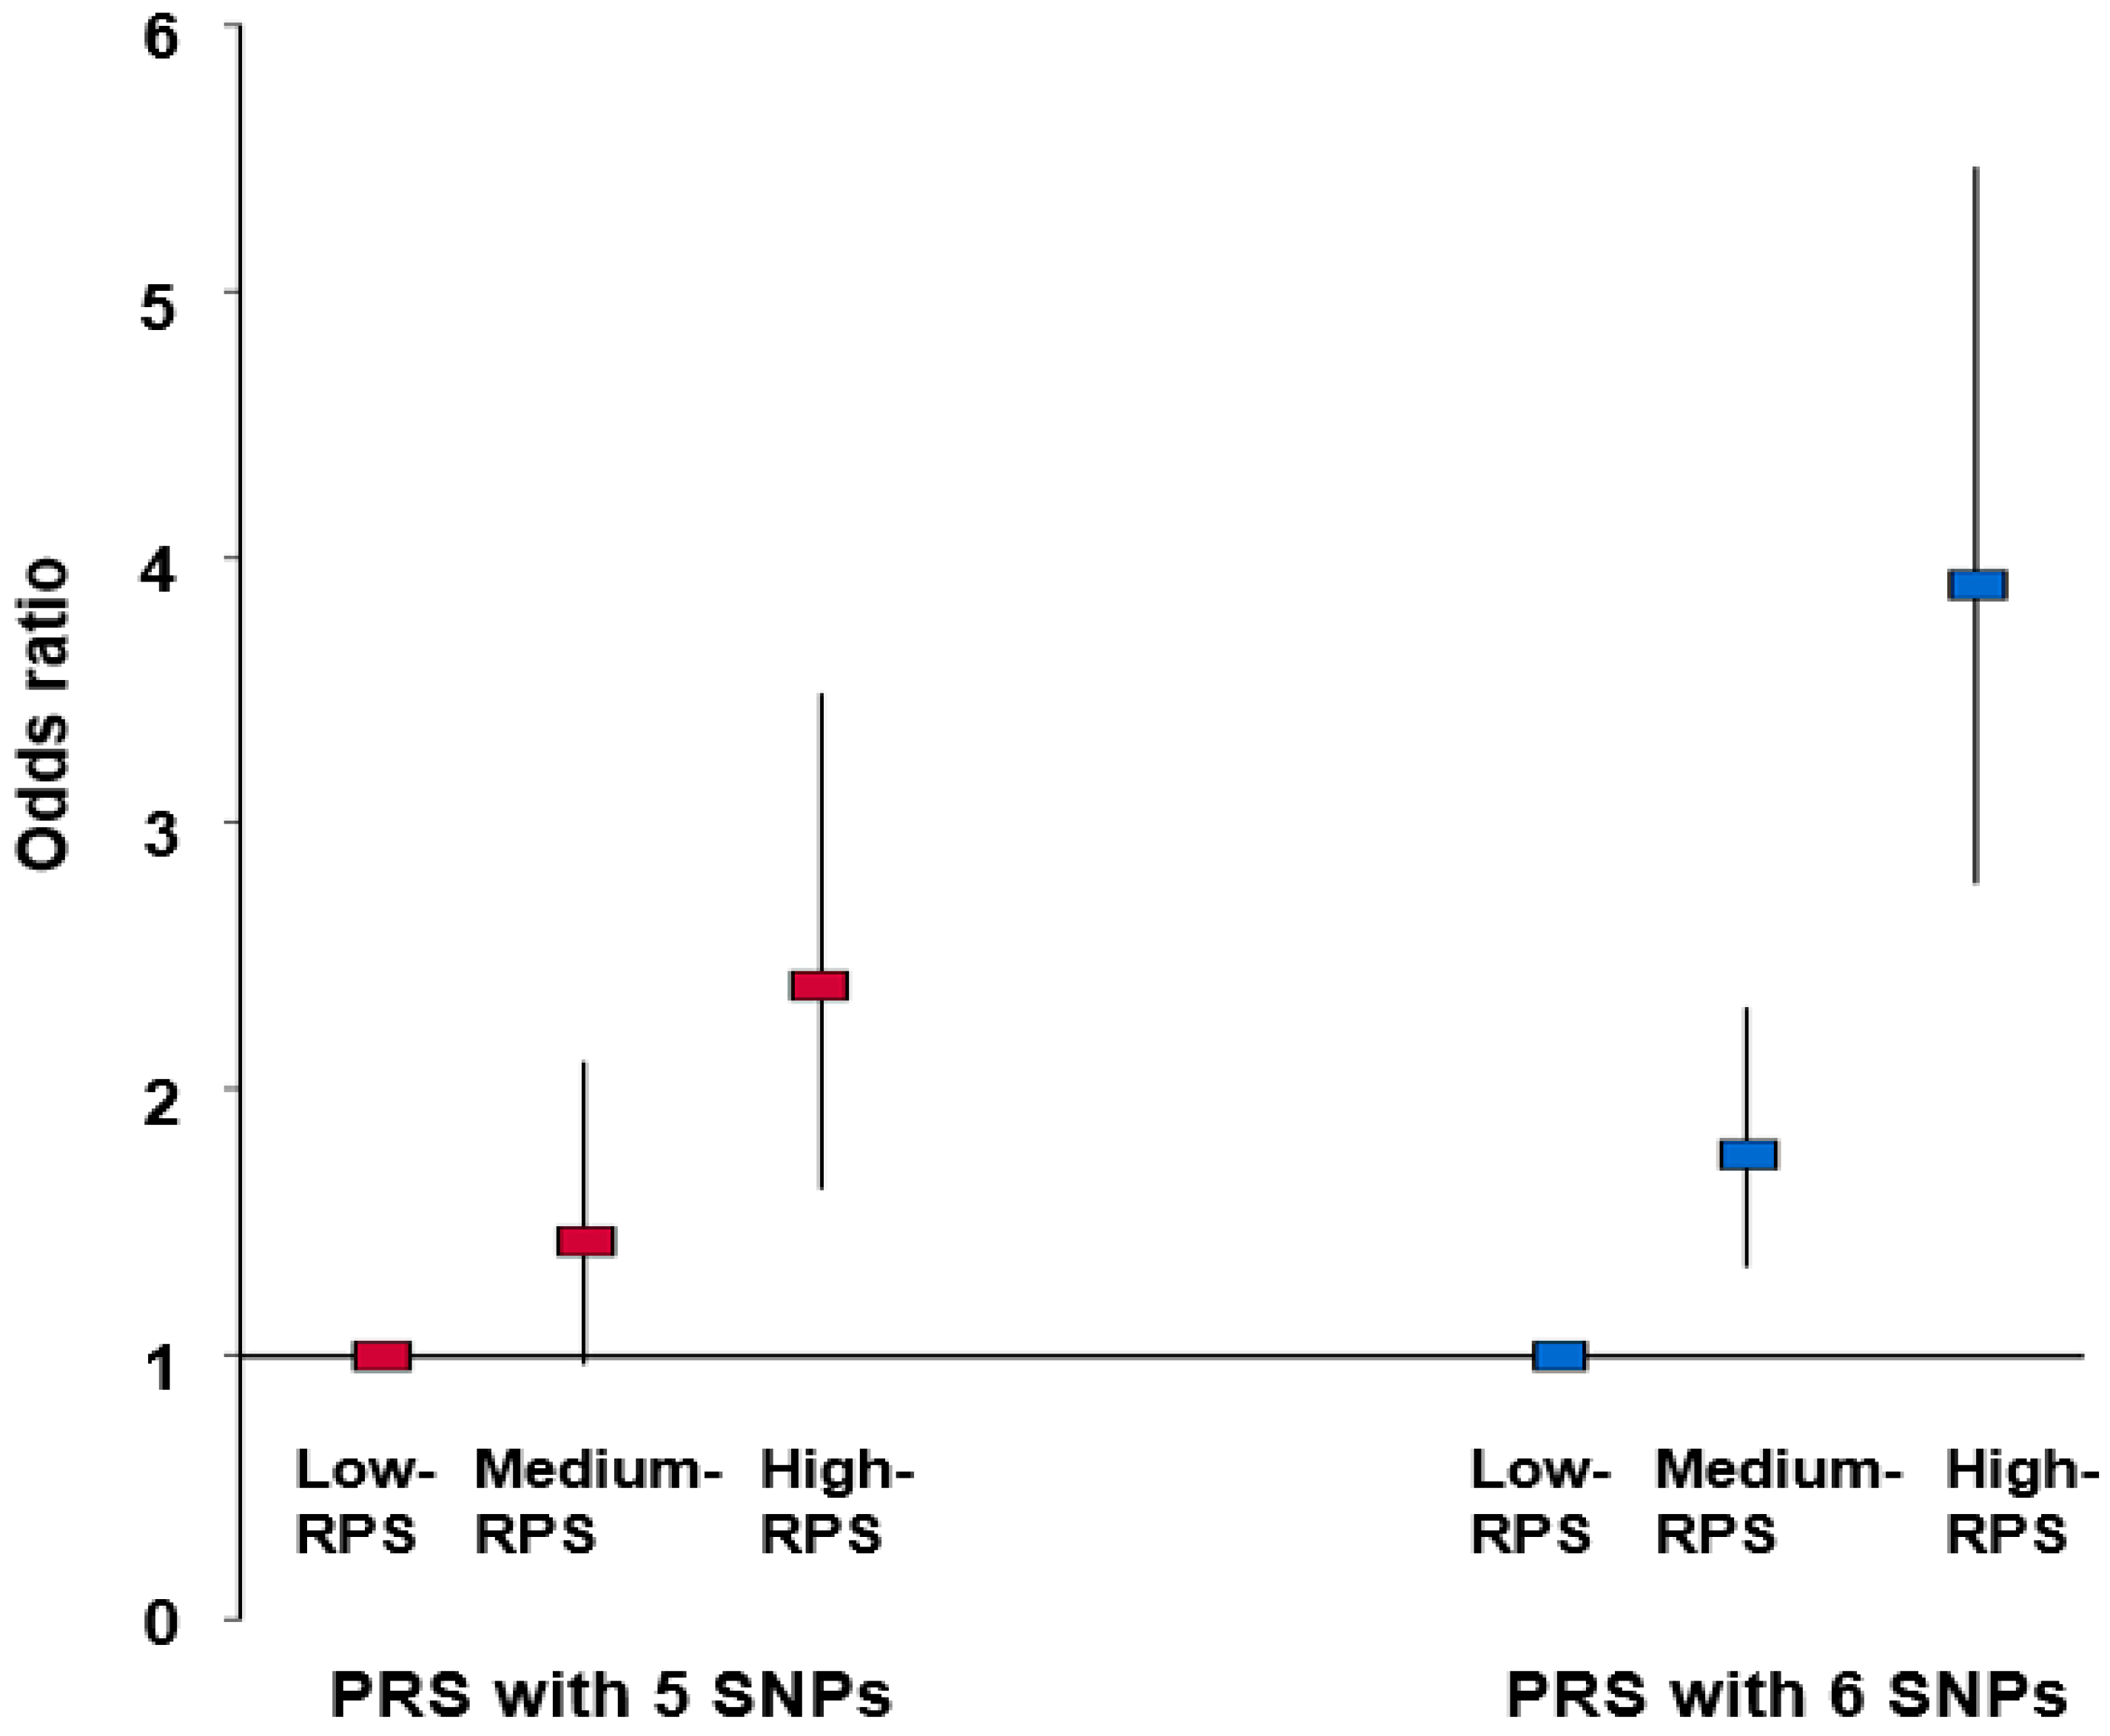
3.4. Association between PRSs Obtained by Summation of Risk Alleles in the Best Model and Thyroid Cancer after Adjustment for Covariates
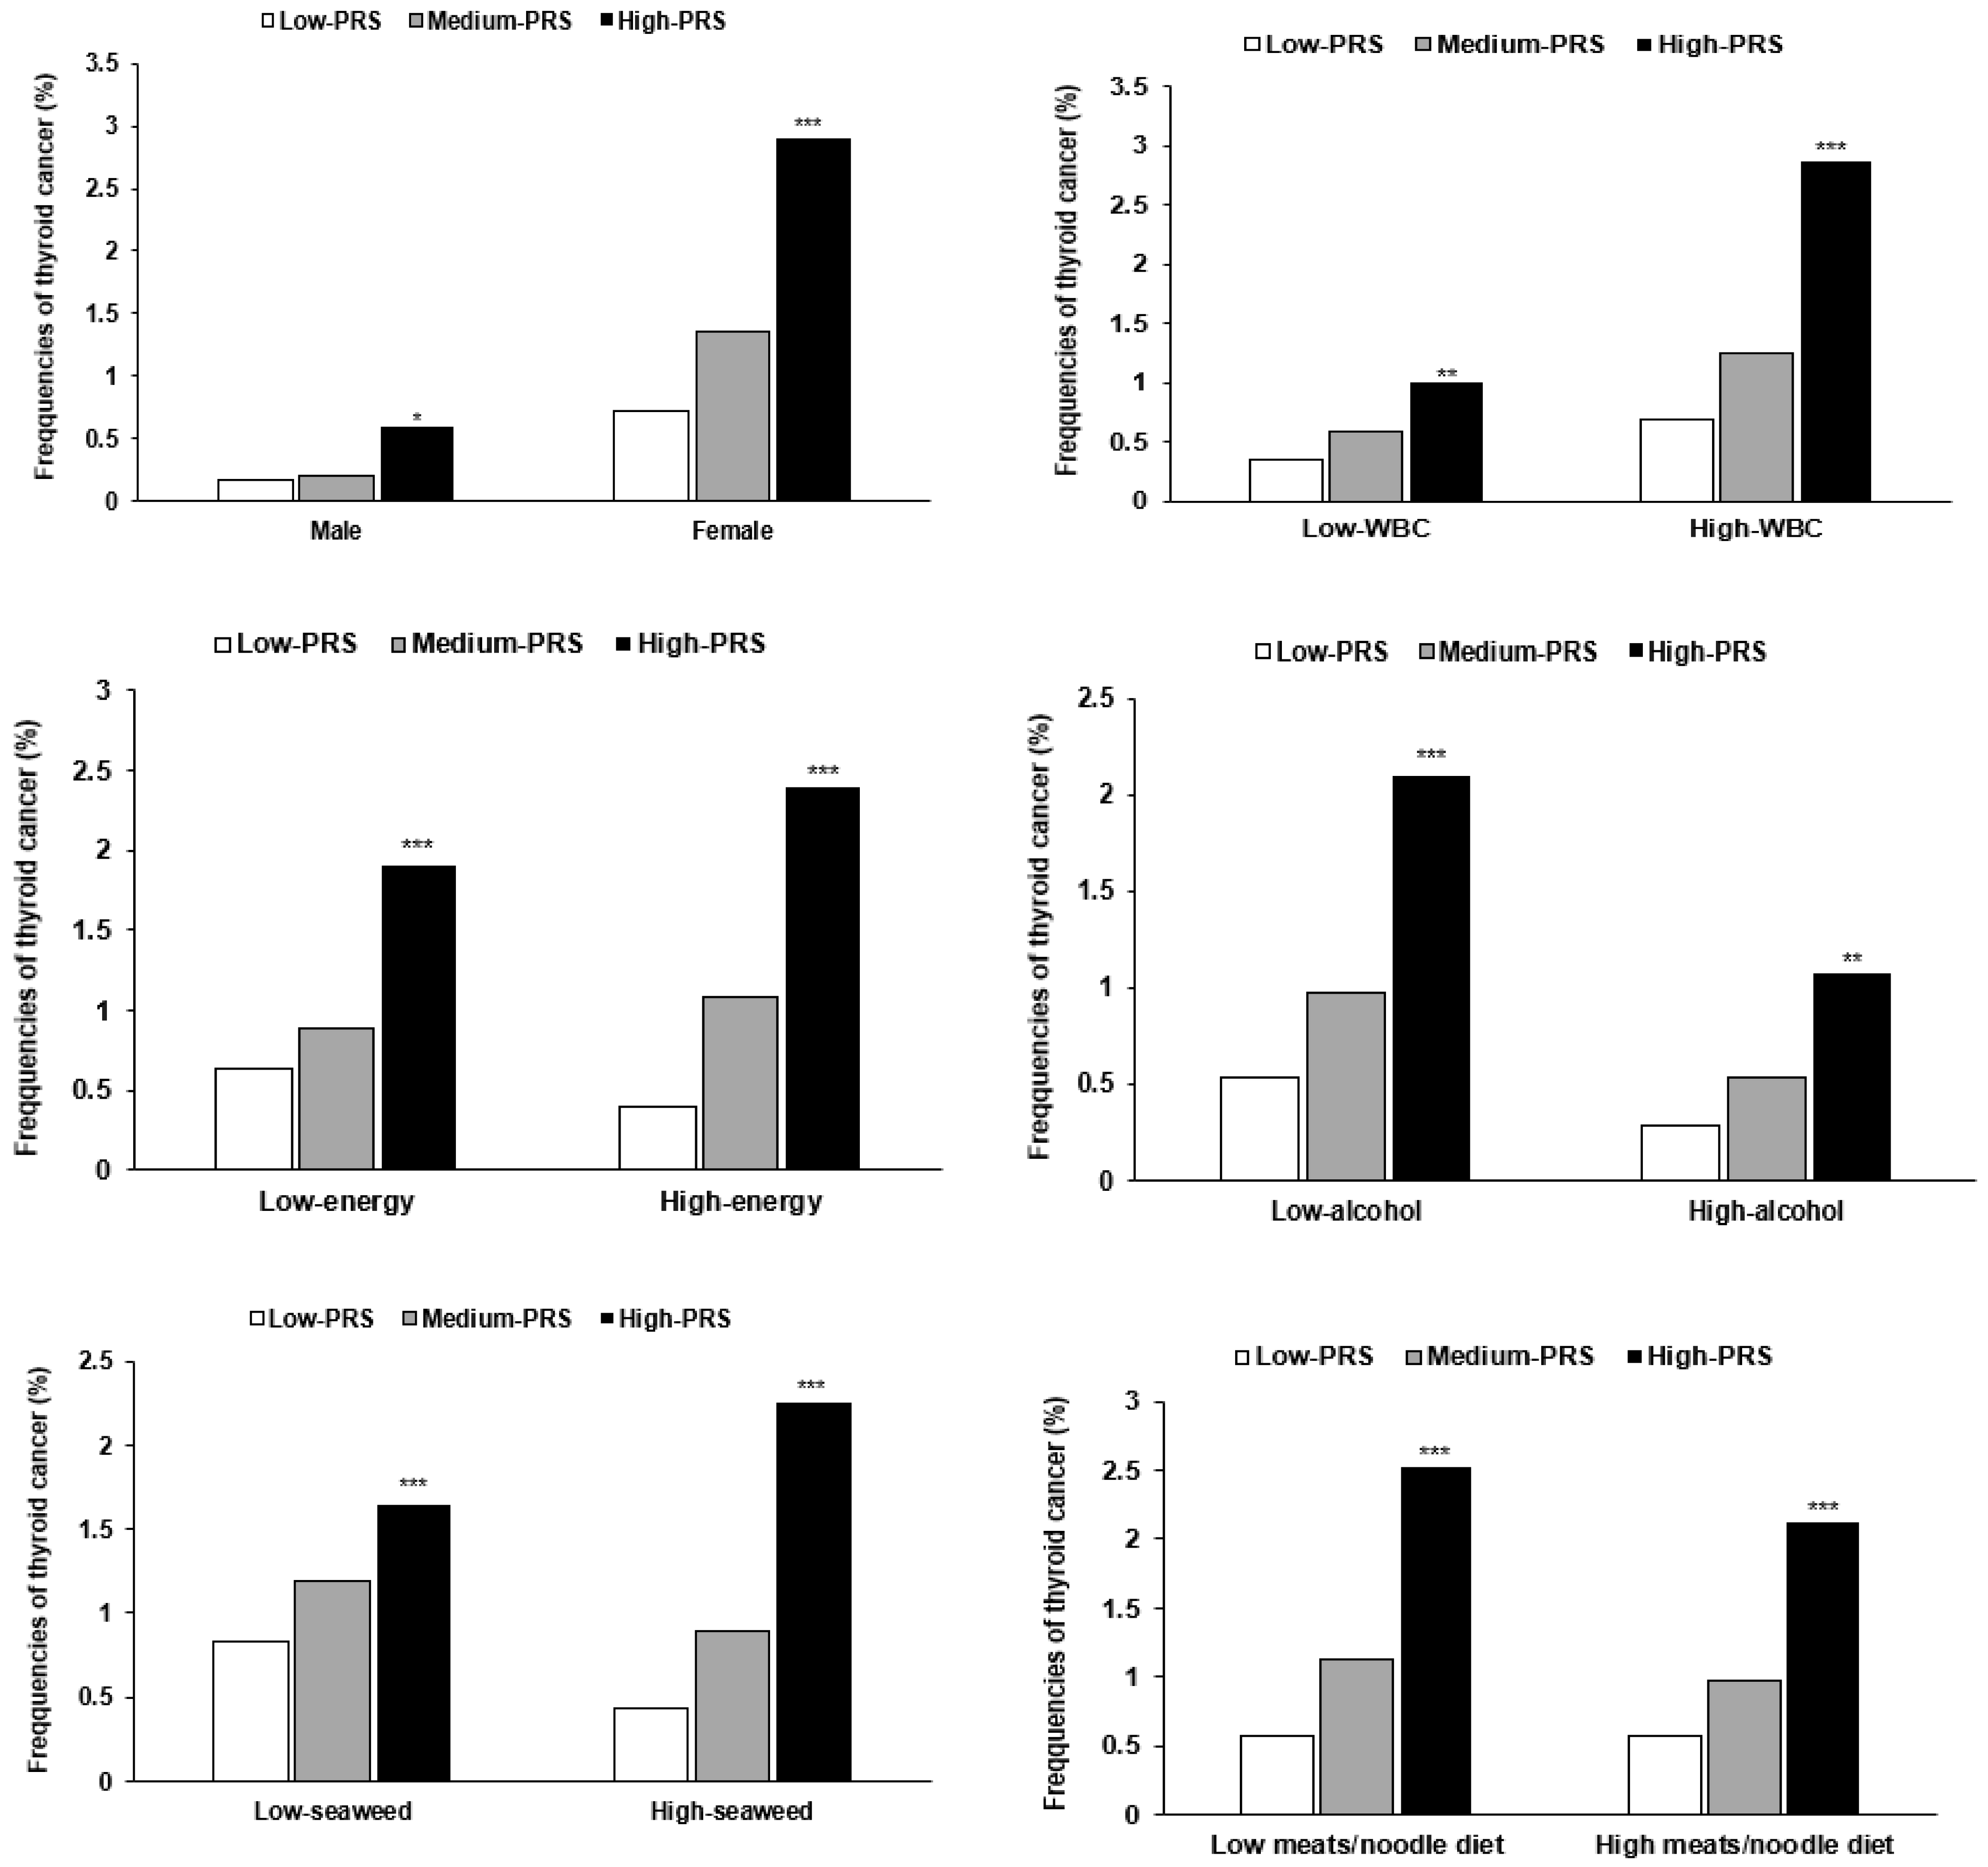
3.5. Interaction between PRSs and General Characteristics and Lifestyles in Thyroid Cancer
4. Discussion
5. Conclusions
Author Contributions
Funding
Institutional Review Board Statement
Informed Consent Statement
Data Availability Statement
Conflicts of Interest
Abbreviations
References
- Luzón-Toro, B.; Fernández, R.M.; Villalba-Benito, L.; Torroglosa, A.; Antiñolo, G.; Borrego, S. Influencers on Thyroid Cancer Onset: Molecular Genetic Basis. Genes 2019, 10, 913. [Google Scholar] [CrossRef] [PubMed]
- Wiltshire, J.J.; Drake, T.M.; Uttley, L.; Balasubramanian, S.P. Systematic Review of Trends in the Incidence Rates of Thyroid Cancer. Thyroid 2016, 26, 1541–1552. [Google Scholar] [CrossRef] [PubMed]
- Bray, F.; Ferlay, J.; Soerjomataram, I.; Siegel, R.L.; Torre, L.A.; Jemal, A. Global cancer statistics 2018: GLOBOCAN estimates of incidence and mortality worldwide for 36 cancers in 185 countries. CA Cancer J. Clin. 2018, 68, 394–424. [Google Scholar] [CrossRef] [PubMed]
- Rashid, F.A.; Munkhdelger, J.; Fukuoka, J.; Bychkov, A. Prevalence of BRAF(V600E) mutation in Asian series of papillary thyroid carcinoma-a contemporary systematic review. Gland Surg. 2020, 9, 1878–1900. [Google Scholar] [CrossRef] [PubMed]
- Liyanarachchi, S.; Gudmundsson, J.; Ferkingstad, E.; He, H.; Jonasson, J.G.; Tragante, V.; Asselbergs, F.W.; Xu, L.; Kiemeney, L.A.; Netea-Maier, R.T.; et al. Assessing thyroid cancer risk using polygenic risk scores. Proc. Natl. Acad. Sci. USA 2020, 117, 5997–6002. [Google Scholar] [CrossRef]
- Yuan, F.; Yuan, R.; Ren, D.; Bi, Y.; Niu, W.; Guo, Z.; Wu, X.; Xu, F.; Sun, Q.; Ma, G.; et al. A novel NR3C2 polymorphism and the increased thyroid-stimulating hormone concentration are associated with venlafaxine treatment outcome in Chinese Han MDD patients. Psychiatry Res. 2020, 284, 112690. [Google Scholar] [CrossRef]
- Zidane, M.; Cazier, J.B.; Chevillard, S.; Ory, C.; Schlumberger, M.; Dupuy, C.; Deleuze, J.F.; Boland, A.; Haddy, N.; Lesueur, F.; et al. Genetic susceptibility to radiation-related differentiated thyroid cancers: A systematic review of literature. Endocr. Relat. Cancer 2019, 26, R583–R596. [Google Scholar] [CrossRef] [PubMed]
- Liu, Y.; Su, L.; Xiao, H. Review of Factors Related to the Thyroid Cancer Epidemic. Int. J. Endocrinol. 2017, 2017, 5308635. [Google Scholar] [CrossRef]
- Barrea, L.; Gallo, M.; Ruggeri, R.M.; Giacinto, P.D.; Sesti, F.; Prinzi, N.; Adinolfi, V.; Barucca, V.; Renzelli, V.; Muscogiuri, G.; et al. Nutritional status and follicular-derived thyroid cancer: An update. Crit. Rev. Food Sci. Nutr. 2021, 61, 25–59. [Google Scholar] [CrossRef]
- Kim, H.J.; Kim, N.K.; Park, H.K.; Byun, D.W.; Suh, K.; Yoo, M.H.; Min, Y.K.; Kim, S.W.; Chung, J.H. Strong association of relatively low and extremely excessive iodine intakes with thyroid cancer in an iodine-replete area. Eur. J. Nutr. 2017, 56, 965–971. [Google Scholar] [CrossRef]
- Ristić-Medić, D.; Dullemeijer, C.; Tepsić, J.; Petrović-Oggiano, G.; Popović, T.; Arsić, A.; Glibetić, M.; Souverein, O.W.; Collings, R.; Cavelaars, A.; et al. Systematic review using meta-analyses to estimate dose-response relationships between iodine intake and biomarkers of iodine status in different population groups. Nutr. Rev. 2014, 72, 143–161. [Google Scholar] [CrossRef]
- Köhler, A.; Chen, B.; Gemignani, F.; Elisei, R.; Romei, C.; Figlioli, G.; Cipollini, M.; Cristaudo, A.; Bambi, F.; Hoffmann, P.; et al. Genome-Wide Association Study on Differentiated Thyroid Cancer. J. Clin. Endocrinol. Metab. 2013, 98, E1674–E1681. [Google Scholar] [CrossRef] [PubMed]
- Son, H.Y.; Hwangbo, Y.; Yoo, S.K.; Im, S.W.; Yang, S.D.; Kwak, S.J.; Park, M.S.; Kwak, S.H.; Cho, S.W.; Ryu, J.S.; et al. Genome-wide association and expression quantitative trait loci studies identify multiple susceptibility loci for thyroid cancer. Nat. Commun. 2017, 8, 15966. [Google Scholar] [CrossRef]
- Liu, M.; Jin, H.S.; Park, S. Protein and fat intake interacts with the haplotype of PTPN11_rs11066325, RPH3A_rs886477, and OAS3_rs2072134 to modulate serum HDL concentrations in middle-aged people. Clin. Nutr. 2020, 39, 942–949. [Google Scholar] [CrossRef] [PubMed]
- Park, S.; Ahn, J.; Lee, B.K. Self-rated Subjective Health Status Is Strongly Associated with Sociodemographic Factors, Lifestyle, Nutrient Intakes, and Biochemical Indices, but Not Smoking Status: KNHANES 2007-2012. J. Korean Med. Sci. 2015, 30, 1279–1287. [Google Scholar] [CrossRef] [PubMed]
- Kim, Y.; Han, B.G. Cohort Profile: The Korean Genome and Epidemiology Study (KoGES) Consortium. Int. J. Epidemiol 2017, 46, 1350. [Google Scholar] [CrossRef] [PubMed]
- Ahn, Y.; Kwon, E.; Shim, J.E.; Park, M.K.; Joo, Y.; Kimm, K.; Park, C.; Kim, D.H. Validation and reproducibility of food frequency questionnaire for Korean genome epidemiologic study. Eur. J. Clin. Nutr. 2007, 61, 1435–1441. [Google Scholar] [CrossRef]
- Park, S.; Kang, S. A Western-style diet interacts with genetic variants of the LDL receptor to hyper-LDL cholesterolemia in Korean adults. Public Health Nutr. 2020, 1–11. [Google Scholar] [CrossRef]
- Lee, S.K.; Kim, M.K. Relationship of sodium intake with obesity among Korean children and adolescents: Korea National Health and Nutrition Examination Survey. Br. J. Nutr. 2016, 115, 834–841. [Google Scholar] [CrossRef]
- Rabbee, N.; Speed, T.P. A genotype calling algorithm for affymetrix SNP arrays. Bioinformatics 2006, 22, 7–12. [Google Scholar] [CrossRef] [PubMed]
- Uma Jyothi, K.; Reddy, B.M. Gene-gene and gene-environment interactions in the etiology of type 2 diabetes mellitus in the population of Hyderabad, India. Meta Gene 2015, 5, 9–20. [Google Scholar] [CrossRef] [PubMed]
- Hong, K.W.; Kim, S.H.; Zhang, X.; Park, S. Interactions among the variants of insulin-related genes and nutrients increase the risk of type 2 diabetes. Nutr. Res. 2018, 51, 82–92. [Google Scholar] [CrossRef]
- Pstrąg, N.; Ziemnicka, K.; Bluyssen, H.; Wesoły, J. Thyroid cancers of follicular origin in a genomic light: In-depth overview of common and unique molecular marker candidates. Mol. Cancer 2018, 17, 116. [Google Scholar] [CrossRef]
- Zheng, C.; Quan, R.D.; Wu, C.Y.; Hu, J.; Lin, B.Y.; Dong, X.B.; Xia, E.J.; Bhandari, A.; Zhang, X.H.; Wang, O.C. Growth-associated protein 43 promotes thyroid cancer cell lines progression via epithelial-mesenchymal transition. J. Cell. Mol. Med. 2019, 23, 7974–7984. [Google Scholar] [CrossRef] [PubMed]
- He, H.; Li, W.; Liyanarachchi, S.; Wang, Y.; Yu, L.; Genutis, L.K.; Maharry, S.; Phay, J.E.; Shen, R.; Brock, P.; et al. The Role of NRG1 in the Predisposition to Papillary Thyroid Carcinoma. J. Clin. Endocrinol. Metab. 2018, 103, 1369–1379. [Google Scholar] [CrossRef] [PubMed]
- Wang, H.; Gong, P.; Li, J.; Fu, Y.; Zhou, Z.; Liu, L. Role of CD133 in human embryonic stem cell proliferation and teratoma formation. Stem Cell Res. Ther. 2020, 11, 208. [Google Scholar] [CrossRef] [PubMed]
- Prazeres, H.; Torres, J.; Rodrigues, F.; Pinto, M.; Pastoriza, M.C.; Gomes, D.; Cameselle-Teijeiro, J.; Vidal, A.; Martins, T.C.; Sobrinho-Simões, M.; et al. Chromosomal, epigenetic and microRNA-mediated inactivation of LRP1B, a modulator of the extracellular environment of thyroid cancer cells. Oncogene 2017, 36, 146. [Google Scholar] [CrossRef] [PubMed]
- Figlioli, G.; Chen, B.; Elisei, R.; Romei, C.; Campo, C.; Cipollini, M.; Cristaudo, A.; Bambi, F.; Paolicchi, E.; Hoffmann, P.; et al. Novel genetic variants in differentiated thyroid cancer and assessment of the cumulative risk. Sci. Rep. 2015, 5, 8922. [Google Scholar] [CrossRef]
- Wójcicka, A.; Czetwertyńska, M.; Świerniak, M.; Długosińska, J.; Maciąg, M.; Czajka, A.; Dymecka, K.; Kubiak, A.; Kot, A.; Płoski, R.; et al. Variants in the ATM-CHEK2-BRCA1 axis determine genetic predisposition and clinical presentation of papillary thyroid carcinoma. Genes Chromosomes Cancer 2014, 53, 516–523. [Google Scholar] [CrossRef]
- Patel, S.; Pappoppula, L.; Guddati, A.K.; Annamaraju, P. Analysis of Race and Gender Disparities in Incidence-Based Mortality in Patients Diagnosed with Thyroid Cancer from 2000 to 2016. Int. J. Gen. Med. 2020, 13, 1589–1594. [Google Scholar] [CrossRef]
- Ari, A.; Gunver, F. Comparison of neutrophil-lymphocyte ratio and platelet-lymphocyte ratio in patients with thyroiditis and papillary tumors. J. Int. Med. Res. 2019, 47, 2077–2083. [Google Scholar] [CrossRef]
- Ozmen, S.; Timur, O.; Calik, I.; Altinkaynak, K.; Simsek, E.; Gozcu, H.; Arslan, A.; Carlioglu, A. Neutrophil-lymphocyte ratio (NLR) and platelet-lymphocyte ratio (PLR) may be superior to C-reactive protein (CRP) for predicting the occurrence of differentiated thyroid cancer. Endocr. Regul. 2017, 51, 131–136. [Google Scholar] [CrossRef]
- Zamora-Ros, R.; Rinaldi, S.; Tsilidis, K.K.; Weiderpass, E.; Boutron-Ruault, M.C.; Rostgaard-Hansen, A.L.; Tjønneland, A.; Clavel-Chapelon, F.; Mesrine, S.; Katzke, V.A.; et al. Energy and macronutrient intake and risk of differentiated thyroid carcinoma in the European Prospective Investigation into Cancer and Nutrition study. Int. J. Cancer 2016, 138, 65–73. [Google Scholar] [CrossRef] [PubMed]
- Marcello, M.A.; Sampaio, A.C.; Geloneze, B.; Vasques, A.C.; Assumpção, L.V.; Ward, L.S. Obesity and excess protein and carbohydrate consumption are risk factors for thyroid cancer. Nutr. Cancer 2012, 64, 1190–1195. [Google Scholar] [CrossRef]
- Wang, X.; Cheng, W.; Li, J.; Zhu, J. A meta-analysis of alcohol consumption and thyroid cancer risk. Oncotarget 2016, 7, 55912–55923. [Google Scholar] [CrossRef] [PubMed]
- Hong, S.H.; Myung, S.K.; Kim, H.S. Alcohol Intake and Risk of Thyroid Cancer: A Meta-Analysis of Observational Studies. Cancer Res. Treat. 2017, 49, 534–547. [Google Scholar] [CrossRef] [PubMed]
- Wang, C.; Yatsuya, H.; Li, Y.; Ota, A.; Tamakoshi, K.; Fujino, Y.; Mikami, H.; Iso, H.; Tamakoshi, A. Prospective study of seaweed consumption and thyroid cancer incidence in women: The Japan collaborative cohort study. Eur. J. Cancer Prev. 2016, 25, 239–245. [Google Scholar] [CrossRef]
- Michikawa, T.; Inoue, M.; Shimazu, T.; Sawada, N.; Iwasaki, M.; Sasazuki, S.; Yamaji, T.; Tsugane, S. Seaweed consumption and the risk of thyroid cancer in women: The Japan Public Health Center-based Prospective Study. Eur. J. Cancer Prev. 2012, 21, 254–260. [Google Scholar] [CrossRef]
- Cao, L.; Xie, J.; Peng, X.; Wen, H.; Li, S.; Yang, Y. Association of Iodine Intake and Iodine-enriched Food with Risk of Thyroid Cancer: A Meta-analysis. Cancer Res. Prev. Treat. 2016, 43, 616–622. [Google Scholar] [CrossRef]
- Sangsefidi, Z.S.; Ghafouri-Taleghani, F.; Zakavi, S.R.; Norouzy, A.; Kashanifar, R.; Pourbaferani, R.; Safarian, M.; Hosseinzadeh, M. Major dietary patterns and differentiated thyroid cancer. Clin. Nutr. ESPEN 2019, 33, 195–201. [Google Scholar] [CrossRef]
- Liang, J.; Zhao, N.; Zhu, C.; Ni, X.; Ko, J.; Huang, H.; Ma, S.; Udelsman, R.; Zhang, Y. Dietary patterns and thyroid cancer risk: A population-based case-control study. Am. J. Transl. Res. 2020, 12, 180–190. [Google Scholar] [PubMed]
- Fiore, M.; Cristaldi, A.; Okatyeva, V.; Lo Bianco, S.; Oliveri Conti, G.; Zuccarello, P.; Copat, C.; Caltabiano, R.; Cannizzaro, M.; Ferrante, M. Dietary habits and thyroid cancer risk: A hospital-based case-control study in Sicily (South Italy). Food Chem. Toxicol. 2020, 146, 111778. [Google Scholar] [CrossRef] [PubMed]
- Przybylik-Mazurek, E.; Hubalewska-Dydejczyk, A.; Kuźniarz-Rymarz, S.; Kieć-Klimczak, M.; Skalniak, A.; Sowa-Staszczak, A.; Gołkowski, F.; Kostecka-Matyja, M.; Pach, D. Dietary patterns as risk factors of differentiated thyroid carcinoma. Postepy Hig. Med. Dosw. 2012, 66, 11–15. [Google Scholar] [CrossRef] [PubMed]


| Non-Thyroid Cancer (n = 56,439) | Thyroid Cancer (n = 495) | Adjusted OR (95% CI) 16 | |
|---|---|---|---|
| Age 1 (years) | 53.6 (53.5, 53.7) | 54.1 (53.4, 54.8) | 1.140 (0.888–1.463) |
| Age at diagnosis (years) | - | 51.3 ± 0.34 | - |
| Genders (men: N, %) | 19,173 (34.9) | 50 (10.1) *** | 4.056 (2.359–6.974) *** |
| Initial menstruation age 2 (years) | 15.1 (15.1, 15.2) | 14.9 (14.8, 15.1) * | 0.663 (0.510–0.860) ** |
| Menopause age 3 (years) | 49.3 (49.3, 49.4) | 48.8 (48.3, 49.4) | 0.971 (0.755–1.247) |
| Pregnancy experience 4 (Yes, %) | 35,443 (96.7) | 431 (97.1) | 1.523 (0.669–3.465) |
| BMI 5 (kg/m2) | 23.9 (23.9, 23.9) | 23.9 (23.6, 24.2) | 0.947 (0.734–1.220) |
| Waist circumference 6 (cm) | 80.7 (80.7, 80.8) | 80.9 (80.5, 81.4) | 0.864 (0.598–1.249) |
| Plasma total cholesterol 7 (mg/dL) | 197 (197, 198) | 189 (186, 193) *** | 0.693 (0.543–0.886) ** |
| Plasma HDL 8 (mg/dL) | 53.8 (53.7, 53.9) | 52.3 (51.2, 53.5) * | 1.292 (1.061–1.573) * |
| Plasma triglyceride 9 (mg/dL) | 125 (124, 126) | 125 (117, 132) | 1.004 (0.769–1.310) |
| Hypertension 10 (N, %) | 13,764 (24.4) | 121 (24.4) | 1.136 (0.900–1.434) |
| Type 2 diabetes 11 (N, %) 10 | 13,921 (24.7) | 117 (23.6) | 1.173 (0.935–1.472) |
| Normal thyroid (N, %) | 54,649 (97.2) | 433 (89.5) | 1 |
| Hypothyroidism Hyperthyroidism | 784 (1.39)805 (1.43) | 27 (5.58) *** 24 (4.96) *** | 2.733 (1.789–4.176) *** 2.962 (1.938–4.525) *** |
| White blood cell counts 12 (109/L) | 5.71 (5.69, 5.72) | 5.61 (5.46, 5.77) | 1.378 (1.122–1.693) ** |
| Plasma hs-CRP 13 (ng/mL) | 0.139 (0.135, 0.142) | 0.147 (0.111, 0.183) | 1.440 (0.915–2.268) |
| Education 14 (Number, %) <High schoolHigh school, collegeCollege more | 7513 (18.5) 8925 (22.0) 24,125 (59.5) | 60 (16.0) 86 (22.9) 229 (61.1) | 1.521 (0.970–2.383) |
| Income 15 (Number, %) > 2000 <$2000/year | 16,516 (31.0) | 137 (29.2) | 1.012 (0.706–1.451) |
| $2000–4000/ | 23,342 (43.8) | 206 (43.8) | |
| >$4000 | 13,479 (25.3) | 127 (27.0) |
| Non-Thyroid Cancer (n = 56,439) | Thyroid Cancer (n = 495) | Adjusted OR (95% CI) 2 | |
|---|---|---|---|
| Energy intake 3 (%) | 96.1 ± 0.14 1 | 98.1 ± 1.44 | 0.979 (0.810–1.184) |
| CHO percent intake 4 | 71.7 ± 0.03 | 72.6 ± 0.32 ** | 1.368 (1.020–1.027) * |
| Protein percent intake 5 | 13.4 ± 0.01 | 13.1 ± 0.12 ** | 0.824 (0.649–1.045) |
| Fat percent intake 6 | 13.9 ± 0.02 | 13.3 ± 0.25 ** | 0.781 (0.565–1.079) |
| Cholesterol intake 7 | 169 ± 0.5 | 171 ± 5.3 | 0.900 (0.691–1.173) |
| Exercise (Number, %) No Yes | 25,605 (45.5) 30,676 (54.5) | 198 (40.1) * 296 (59.9) | 1.358 (1.119–1.646) ** 0.737 (0.607–0.893) |
| Smoking (Number, %) No Former smoking Smoking | 41,096 (73.0) 8893 (15.8) 6303 (11.2) | 449 (91.6) *** 32 (6.53) 9 (1.84) | 1 0.807 (0.508–1.284) |
| Alcohol intake (Number, %) No Mild drink (0–20 g) | 31,747 (56.3) 1214 (2.15) | 378 (76.4) *** 7 (1.41) | 1 0.609 (0.471–0.788) ** |
| Moderate drink (≥20 g) | 23,478 (41.6) | 110 (22.2) | |
| Coffee intake 8 (Number %) Low (<3 g/day) | 21,222 (37.6) | 233 (47.1) *** | 1 0.766 (0.632–0.929) ** |
| Medium (3–16 g/day) | 34,650 (61.4) | 258 (52.1) | |
| High (≥16 g/day) | 567 (1.0) | 4 (0.81) | |
| Traditional balanced diet 9 | 18,293 (32.4) | 132 (26.7) ** | 0.792 (0.600–1.046) |
| Prudent diet | 18,205 (32.3) | 220 (44.4) *** | 1.446 (1.139–1.834) ** |
| Noodle/meat diet | 18,303 (32,4) | 110 (22.2) *** | 0.673 (0.506–0.894) ** |
| Rice-based diet | 18,263 (32.4) | 153 (30.9) | 0.840 (0.653–1.082) |
| Chr 1 | SNP 2 | Position | Mi 3 | Ma 4 | OR 5 | 6p Value for ORs | 7 MAF | 8p Value for HWE | Gene | Functional Consequence | Left Gene | Right Gene |
|---|---|---|---|---|---|---|---|---|---|---|---|---|
| 2 | rs6759952 | 218271719 | T | C | 0.76 (0.64~0.89) | 0.000899 | 0.2491 | 0.825 | DIRC3 | Intron | TNP1 | DIRC3 |
| 2 | rs1369535 | 142636357 | G | A | 1.27 (1.11~1.45) | 0.000488 | 0.3784 | 0.062 | LRP1B | Intron | MRPS18BP2 | UBE2V1P14 |
| 3 | rs13059137 | 115347556 | C | T | 1.29 (1.13~1.48) | 0.000261 | 0.3443 | 0.261 | GAP43 | Intron | ZBTB20 | LSAMP |
| 4 | rs72616195 | 16043608 | T | C | 1.29 (1.12~1.47) | 0.000263 | 0.3467 | 0.407 | PROM1 | Intron | FGFBP2 | TAPT1 |
| 8 | rs76981250 | 18761954 | T | C | 1.77 (1.27~2.45) | 0.000635 | 0.02597 | 0.744 | PSD3 | Intron | RPL35P6 | SH2D4A |
| 8 | rs78371177 | 23224452 | G | A | 1.66 (1.25~2.2) | 0.000524 | 0.03784 | 0.777 | LOXL2 | Intron | R3HCC1 | ENTPD4 |
| 8 | rs7834206 | 32406148 | G | A | 1.46 (1.25~1.69) | 8.51 × 10⁻⁷ | 0.209 | 0.549 | NRG1 | utr-5 | NRG1-IT3 | MST131 |
| 11 | rs605859 | 126407440 | C | T | 1.51 (1.2~1.89) | 0.000403 | 0.06575 | 0.081 | KIRREL3 | Intron | ST3GAL4 | PRR10 |
| 12 | rs11175834 | 65992636 | C | T | 1.39 (1.18~1.64) | 8.06 × 10⁻⁵ | 0.1554 | 0.238 | LOC100507065 | intron | MSRB3 | PCNPP3 |
| 22 | rs2276010 | 22142501 | C | T | 1.94 (1.38~2.73) | 0.000129 | 0.02019 | 0.094 | MAPK1 | intron | YPEL1 | PPM1F |
| No Adjusted | Adjusted for Age, Residence Area, BMI | |||||||
|---|---|---|---|---|---|---|---|---|
| Model | TRBA 1 | TEBA 2 | p Value 3 | CVC 5 | TRBA | TEBA | p Value 4 | CVC |
| GAP43_rs13059137 | 0.5532 | 0.5157 | 8 (0.0547) | 5/10 | 0.5538 | 0.5160 | 8 (0.0547) | 5/10 |
| NRG1_rs7834206 PROM1_rs72616195 | 0.5699 | 0.5155 | 7 (0.1719) | 4/10 | 0.5708 | 0.5164 | 8 (0.0547) | 5/10 |
| NRG1_rs7834206 PROM1_rs72616195 KIRREL3_rs605859 | 0.5847 | 0.5312 | 9 (0.0107) | 5/10 | 0.5858 | 0.5321 | 9 (0.0107) | 5/10 |
| DIRC3_rs6759952 GAP43_rs13059137 NRG1_rs7834206 PROM1_rs72616195 | 0.6121 | 0.5599 | 10 (0.0010) | 8/10 | 0.6132 | 0.5615 | 10 (0.0010) | 8/10 |
| LRP1B_rs1369535 plus Model 4 | 0.6491 | 0.5516 | 10 (0.0010) | 10/10 | 0.6498 | 0.5494 | 10 (0.0010) | 10/10 |
| LINC02454_rs11175834 plus model 5 | 0.6935 | 0.5625 | 10 (0.0010) | 10/10 | 0.6936 | 0.5646 | 10 (0.0010) | 10/10 |
| KIRREL3_rs605859 plus model 6 | 0.7226 | 0.5275 | 7 (0.1719) | 9/10 | 0.7223 | 0.5257 | 7 (0.1719) | 8/10 |
| LOXL2_rs78371177 plus model 7 | 0.7468 | 0.5212 | 7 (0.1719) | 7/10 | 0.7468 | 0.5224 | 6 (0.3770) | 7/10 |
| PSD3_rs76981250 plus model 8 | 0.7701 | 0.5351 | 9 (0.0107) | 10/10 | 0.7704 | 0.5380 | 9 (0.0107) | 10/10 |
| MAPK1_rs2276010 plus model 9 | 0.7849 | 0.5204 | 7 (0.1719) | 10/10 | 0.7853 | 0.5224 | 7 (0.1719) | 10/10 |
| Low-PRS (n = 13,888) | Medium-PRS (n = 29,907) | High-PRS (n = 3911) | Gene–Nutrient Interaction p-Value | |
|---|---|---|---|---|
| Men Women | 1 | 1.277 (0.567–2.872) 1.895 (1.427–2.518) | 2.546 (0.880–7.363) 4.212 (2.972–5.969) *** | <0.0001 |
| Young 1 Aged | 1 | 1.657 (1.175–2.338) 2.098 (1.368–3.218) | 3.182 (2.036–4.973) *** 5.376 (3.254–8.880) | 0.2518 |
| Low WBC 2 High WBC | 1 | 1.869 (1.078–3.242) 1.810 (1.332–2.459) | 3.879 (1.931–7.792) ** 4.032 (2.768–5.871) *** | 0.0042 |
| Low energy 3 High energy | 1 | 1.376 (0.996–1.899) 3.076 (1.869–5.063) | 2.948 (1.942–4.475) ** 7.100 (3.944–12.43) *** | 0.0143 |
| Low CHO 4 High CHO | 1 | 1.983 (0.866–4.539) 1.803 (1.359–2.393) | 5.449 (2.126–13.96) *** 3.816 (2.677–5.441) *** | 0.4267 |
| Low protein 5 High protein | 1 | 1.703 (1.181–2.456) 1.963 (1.325–2.909) | 4.211 (2.699–6.571) *** 3.757 (2.291–6.161) *** | 0.1945 |
| Low fat 6 High fat | 1 | 1.701 (1.291–2.242) 4.427 (1.342–14.60) | 3.777 (2.675–5.333) *** 9.059 (2.433–33.72) *** | 0.6550 |
| Low cholesterol 7 High cholesterol | 1 | 1.818 (1.357–2.435) 1.838 (0.942–3.586) | 3.803 (2.636–5.486) *** 5.107 (2.350–11.10) *** | 0.6959 |
| Mild alcohol 8 Moderate alcohol | 1 | 1.873 (1.429–2.457) 1.706 (1.011–2.878) | 4.105 (2.939–5.734) *** 3.326 (1.688–6.554) *** | 0.0014 |
| No exercise Exercise | 1 | 1.674 (1.107–2.530) 1.924 (1.353–2.735) | 3.776 (2.255–6.321) *** 4.176 (2.712–6.439) *** | 0.4585 |
| Non-smoke Smoker+former | 1 | 1.779 (1.349–2.346) 2.306 (0.786–6.770) | 3.877 (2.752–5.461) *** 5.775 (1.616–20.63) *** | 0.8004 |
| Low seaweed 9 High seaweed | 1 | 1.455 (0.939–2.255) 1.823 (1.395–2.383) | 2.052 (0.997–3.838) 4.020 (2.889–5.596) *** | 0.0480 |
| Low KBD diet 10 High KBD diet | 1 | 1.817 (1.390–2.375) *** 1.775 (1.305–2.413) | 3.969 (2.852–5.522) 3.756 (2.555–5.521) | 0.4320 |
| Low prudent diet 10 High prudent diet | 1 | 1.817 (1.390–2.375) 1.407 (0.998–1.974) | 3.969 (2.852–5.522) ** 3.403 (2.236–5.179) *** | 0.1113 |
| Low meat/noodle diet 10 High meat/noodle diet | 1 | 1.817 (1.390–2.375) 1.989 (1.455–2.718) | 3.969 (2.852–5.522) *** 4.408 (3.005–6.466) *** | 0.0023 |
| Rice-main diet 10 Rice-main diet | 1 | 1.817 (1.390–2.375) 1.953 (1.404–2.717) | 3.969 (2.852–5.522) *** 4.370 (2.927–6.524) *** | 0.1568 |
Publisher’s Note: MDPI stays neutral with regard to jurisdictional claims in published maps and institutional affiliations. |
© 2021 by the authors. Licensee MDPI, Basel, Switzerland. This article is an open access article distributed under the terms and conditions of the Creative Commons Attribution (CC BY) license (http://creativecommons.org/licenses/by/4.0/).
Share and Cite
Song, S.S.; Huang, S.; Park, S. Association of Polygenetic Risk Scores Related to Cell Differentiation and Inflammation with Thyroid Cancer Risk and Genetic Interaction with Dietary Intake. Cancers 2021, 13, 1510. https://doi.org/10.3390/cancers13071510
Song SS, Huang S, Park S. Association of Polygenetic Risk Scores Related to Cell Differentiation and Inflammation with Thyroid Cancer Risk and Genetic Interaction with Dietary Intake. Cancers. 2021; 13(7):1510. https://doi.org/10.3390/cancers13071510
Chicago/Turabian StyleSong, Sang Shin, ShaoKai Huang, and Sunmin Park. 2021. "Association of Polygenetic Risk Scores Related to Cell Differentiation and Inflammation with Thyroid Cancer Risk and Genetic Interaction with Dietary Intake" Cancers 13, no. 7: 1510. https://doi.org/10.3390/cancers13071510
APA StyleSong, S. S., Huang, S., & Park, S. (2021). Association of Polygenetic Risk Scores Related to Cell Differentiation and Inflammation with Thyroid Cancer Risk and Genetic Interaction with Dietary Intake. Cancers, 13(7), 1510. https://doi.org/10.3390/cancers13071510