Simple Summary
Dynamic contrast-enhanced magnetic resonance imaging (DCE-MRI) is an important method to analyze the perfusion model of tumors, allowing noninvasive quantification of microvascular structure and function. Furthermore, simultaneous [68Ga]Ga-prostate-specific membrane antigen (PSMA)-11 positron emission tomography (PET)/MRI is currently the most advantageous way for assessing prostate cancer staging. Therefore, combining these two examinations helps to diagnose the lesions more comprehensively. Our study analyzes perfusion parameters between intraprostatic lesions and the correlation between perfusion parameters and [68Ga]Ga-PSMA-11 PET. This study highlights the significant effect of PSMA uptake on perfusion parameters.
Abstract
We aimed to retrospectively compare the perfusion parameters measured from dynamic contrast-enhanced (DCE) magnetic resonance imaging (MRI) of prostate benign lesions and malignant lesions to determine the relationship between perfusion parameters. DCE-MRI was performed in patients with PCa who underwent simultaneous [68Ga]Ga-prostate-specific membrane antigen (PSMA)-11 positron emission tomography (PET)/MRI. Six perfusion parameters (arrival time (AT), time to peak (TTP), wash-in slope (W-in), wash-out slope (W-out), peak enhancement intensity (PEI), and initial area under the 60-s curve (iAUC)), and a semi-quantitative parameter, standardized uptake values maximum (SUVmax) were calculated by placing regions of interest in the largest area of the lesions. The DCE-MRI parameters between prostate benign and malignant lesions were compared. The DCE-MRI parameters in both the benign and malignant lesions subgroup with SUVmax ≤ 3.0 and SUVmax > 3.0 were compared. The correlation of DCE-MRI parameters was investigated. Malignant lesions demonstrated significantly shorter TTP and higher SUVmax than did benign lesions. In the benign and malignant lesions subgroup, perfusion parameters of lesions with SUVmax ≤ 3.0 show no significant difference to those with SUVmax > 3.0. DCE-MRI perfusion parameters show a close correlation with each other. DCE-MRI parameters reflect the perfusion characteristics of intraprostatic lesions with malignant lesions, demonstrating significantly shorter TTP. There is a moderate to strong correlation between DCE-MRI parameters. Semi-quantitative analysis reflects that malignant lesions show a significantly higher SUVmax than benign lesions.
1. Introduction
Prostate cancer (PCa) is one of the most common diseases in men. In the US, it accounts for 21% of new cases, and it is the second leading cause of death in men, accounting for 10% of all deaths [1].
Multiparameters magnetic resonance imaging (mpMRI) with the assessment of images using the Prostate Imaging Reporting and Data System (PI-RADS) is widely used to evaluate prostate lesions. Dynamic contrast-enhanced (DCE)-MRI is a technique used to measure the perfusion, blood flow, and tissue vascularity by analyzing the tissue’s signal enhancement curve. DCE-MRI, which can assess micro-vascular properties, provides helpful additional information for characterizing lesions [2]. In many current clinical trials, DCE-MRI for a new anti-angiogenic agent is used as an early imaging biomarker to evaluate patients’ response to treatment [3]. Microvessel density has been reported to be associated with tumor stage, recurrence, metastatic potential, and prognosis in patients with prostate cancer [4,5,6]. This signal enhancement of perfusion can be quantified with semi-quantitative analysis [7,8]. Semi-quantitative parameters can be extracted and calculated from the signal intensity curve [9,10]. The signal intensity curve reveals several parameters, including arrival time (AT), time to peak (TTP), wash-in slope (W-in), wash-out slope (W-out), peak enhancement intensity (PEI), and initial area under the 60-sec curve (iAUC). AT is arrival time, which is the time point when contrast enhancement starts. TTP is time to peak, which is the time from arrival time to the end of wash-in. A shorter TTP indicates the shorter time needed to reach the peak. Wash-in slope is the slope of the fitted line between AT and the end of wash-in. The higher W-in is, the faster the wash-in speed. W-out slope is the fitted line slope between the start of wash-out and the end of the measurement. The higher the W-out is, the faster the wash-out speed. PEI indicates the highest value of enhancement. And iAUC calculates the initial area under the curve in 60 s, reflecting the total intensity of enhancement during the first one minute.
Molecular imaging of prostate cancer is a beneficial tool for systematically evaluating tumor biology [11]. Agents targeting cell metabolism, hormone receptors, or membrane proteins have been developed to an advanced stage. Over the last few years, prostate-specific membrane antigen (PSMA) have gained much interest as specific targets for PCa imaging, which is a promising and specific target. It is a transmembrane glycoprotein related to tumor progression and disease recurrence that has been found to be overexpressed in prostate cancer cells [12,13]. PSMA-ligands as prostate cancer-specific PET tracers show and differentiate cancerous lesions within the prostate more accurately than other tracers. A whole-body hybrid PET/MRI scanner with simultaneous acquisition of PET imaging and mpMRI has enabled functional and molecular information to be combined [14,15,16]. Initial results suggest that [68Ga]Ga-PSMA-11 PET/MRI is a beneficial imaging method for detecting suspicious focal prostate cancer lesions [17,18] and monitoring recurrence [19]. Combining MRI and positron emission tomography (PET) improves diagnostic accuracy [20,21]. Compared with the current standard imaging like CT, MRI, and bone scintigraphy, PSMA-PET imaging shows a higher specificity and sensitivity and is suitable for patients with primary middle-risk or high-risk prostate cancer [22].
Therefore, this study’s purpose was to retrospectively compare the perfusion parameters of DCE-MRI of prostate benign lesions and malignant lesions, and determine the correlation between these perfusion parameters.
2. Results
2.1. Comparison of Parameters between Benign and Malignant Lesions
TTP and SUVmax were significantly different between benign lesions and malignant lesions (p < 0.05) regarding the perfusion parameters and semi-quantitative parameters. No significant differences were observed in other parameters (Table 1).

Table 1.
Comparison of parameters between benign and malignant lesions.
2.2. Effect of SUVmax on DCE-MRI Parameters
All lesions were assigned into two subgroups, including benign lesions group and malignant lesions group. In both subgroups, DCE-MRI parameters between lesions with SUVmax ≤ 3.0 and SUVmax > 3.0 were compared. In the benign lesions subgroup, perfusion parameters of lesions with SUVmax ≤ 3.0 show no significant difference from those with SUVmax > 3.0 (Table 2). In the malignant lesions subgroup, perfusion parameters of lesions with SUVmax > 3.0 perfusion parameters of lesions with SUVmax ≤ 3.0 show no significant difference from those with SUVmax > 3.0 (Table 3).
Table 2.
Comparison of parameters between benign lesions with SUVmax ≤ 3.0 and SUVmax > 3.0.
Table 3.
Comparison of parameters between malignant lesions with SUVmax ≤ 3.0 and SUVmax > 3.0.
2.3. Pearson Correlation between Perfusion Parameters of Intraprostatic Lesions
There is a moderate to strong correlation between the perfusion parameters of intraprostatic lesions (Table 4).
Table 4.
Pearson correlation analysis between the perfusion parameters.
3. Discussion
DCE-MRI is an important diagnostic method in detecting focal prostate cancer lesions, which improves the accuracy of examination for detection and evaluation of intraprostatic tumor lesions [23]. It visualizes focal lesions in the prostate with varying degrees of enhancement and provides information for lesion characterization. Combining the advantages of [68Ga]Ga-PSMA-11 PET/MRI and DCE-MRI contributes to a better differentiation of intraprostatic lesions [24]. PSMA-PET imaging can add molecular information to multiparameter MRI to describe suspicious lesions for target biopsy [25]. The clinical value of this study is the quantitative analysis of the multimodality characteristics of the lesions. DCE parameters reflect lesions’ microvascular structure, while SUVmax reflects lesions’ prostate-specific membrane antigen concentration. A combination of information allows for a comprehensive evaluation of tumor condition and for choosing an appropriate treatment plan.
Intraprostatic lesions perfusion parameters are investigated by several studies before [26]. Vos et al. [27] reported that quantitative parameters and semi-quantitative parameters derived from DCE-MRI at 3.0 T MRI could assess the aggressiveness of PCa in the peripheral zone. Chen et al. [28] proved that the wash-out gradient shows a significant association with Gleason score and good diagnostic performance in assessing prostate tumor aggressiveness. PCa has increased microvascularity and, therefore, can be detected by contrast-enhanced MRI techniques, as van Niekerk et al. reported [29]. These parameters provide detailed information about the aggressiveness of tumors in different prostate gland regions as, for example, in Figure 1, Figure 2 and Figure 3. Therefore, the perfusion differences between prostate benign lesions and malignant lesions may be detected and quantified with DCE-MRI. MpMRI of prostate scanning includes complementary and synergistic T2, diffusion, and perfusion sequences. Ren et al. [30] proved that DCE-MRI curves could differentiate benign tissue from malignant prostate tissue based on T2-weighted imaging. The omission of DCE-MRI increases the risk that some aggressive lesions will not be detected, thus discrediting prostate imaging by MRI. The sequence of contrast enhancement agents is essential in the detection of recurrence and post-treatment follow-up.
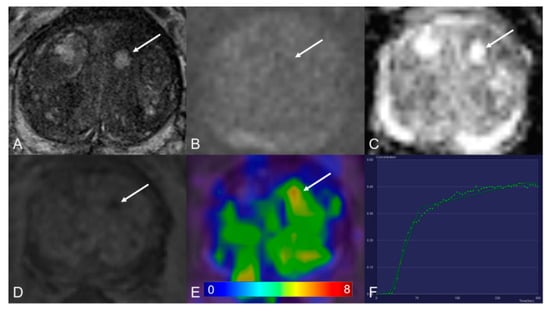
Figure 1.
Transition zone with a PI-RADS 1 change. (A) Axial T2WI shows typical benign prostatic hyperplasia (BPH) change. (B) DWI (b = 1000 s/mm2) shows no lesion with a marked hyperintense signal above the background. (C) ADC map image presents no diffusion restriction. (D) Early dynamic contrast-enhanced image presents no enhancement within the typical BPH nodule. (E) [68Ga]Ga-PSMA-11 PET/MRI fusion image shows moderate [68Ga]Ga-PSMA-11 uptake, with SUVmax of 6.3. (F) DCE-MRI time-intensity curve demonstrates persistent increase enhancement. AT: 0.39 min; TTP: 1.09 min; W-in: 0.16; W-out: 0.02; PEI: 0.25; iAUC: 0.10.
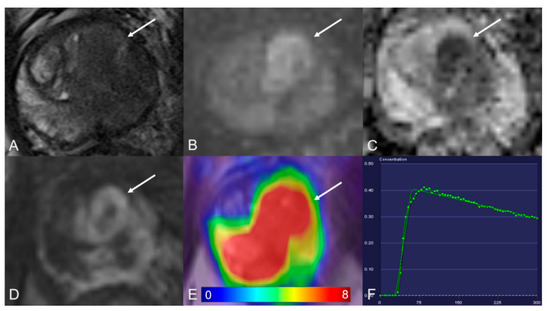
Figure 2.
Transition zone with a PI-RADS 5 lesion. (A) Axial T2WI shows homogeneous hypointense. (B) DWI (b = 1000 s/mm2) shows a marked hyperintense signal above the background. (C) ADC map image presents a lesion with hypointense signal below the background. (D) Early dynamic contrast-enhanced image presents positive enhancement within the lesion. (E) [68Ga]Ga-PSMA-11 PET/MRI fusion image shows avid [68Ga]Ga-PSMA-11 uptake, with SUVmax of 29.2. (F) DCE-MRI time-intensity curve demonstrates a decline after initial up-slope enhancement. AT: 0.47 min; TTP: 0.50 min; W-in: 0.80; W-out: −0.03; PEI: 0.41; iAUC: 0.31.
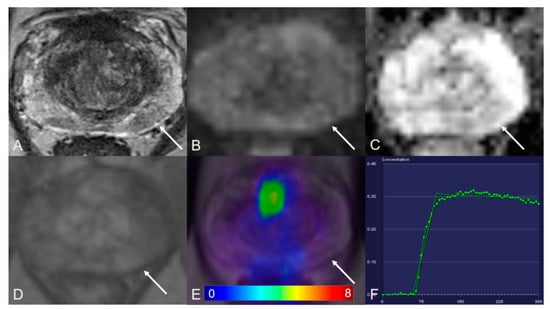
Figure 3.
Peripheral zone with a PI-RADS 3 lesion. (A) Axial T2WI shows hypointense. (B) DWI (b = 1000 s/mm2) shows a mild hyperintense signal. (C) ADC map image presents a moderate hypointense signal below the background. (D) Early dynamic contrast-enhanced image presents no early enhancement within the lesion. (E) [68Ga]Ga-PSMA-11 PET/MRI fusion image shows no positive [68Ga]Ga-PSMA-11 uptake. (F) DCE-MRI time-intensity curve demonstrates plateau enhancement. AT: 0.98 min; TTP: 0.67 min; W-in: 0.26; W-out: 0.003; PEI: 0.20; iAUC: 0.13.
The advantage of the curve analysis method is that it is easy to calculate. Model-based measurement parameters are complex, but they provide more specific information about vascular physiology [31]. In this study, we compared perfusion parameters between benign lesions and malignant lesions. TTP was significantly different. TTP is the time that contrast enhancement reaches the peak. A shorter TTP indicates the shorter time needed to reach the peak. Then it can be explained that the blood vessels are more abundant in the corresponding lesions. We further divided the lesions into two subgroups. The lesions were divided into two groups in the benign lesion group according to SUVmax ≤ 3.0 and SUVmax > 3.0. All perfusion parameters did not show obvious differences between SUVmax ≤ 3.0 and SUVmax > 3.0. This indicates that SUVmax does not affect the perfusion parameters in benign lesions. In the malignant lesions group, the same results were found.
Moreover, we determined the correlations between perfusion parameters to understand further the physiological significance of semi-quantitative parameters in intraprostatic lesions. They may reflect gross angiogenesis within a focal lesion. AT is arrival time, the point in time when contrast enhancement starts. A shorter AT indicates that the contrast agent flows into the lesion in a shorter time. It further shows that the lesion is rich in blood vessels. W-in is the fitted line’s slope between AT and the end of wash-in, reflecting the speed at which the contrast agent flows into the lesion. The slope is significantly correlated with blood flow so that it can be used to evaluate perfusion within a lesion. Another parameter, iAUC, is the initial area under the curve in 60 s. It suggests that iAUC denotes a combination of blood flow and permeability. These correlations may help select the most suitable semi-quantitative parameter to represent tumor perfusion, flow, and angiogenesis in daily practice.
Angiogenesis is an essential process in tumor growth, and a multitude of pharmacologic therapies primarily target angiogenesis by affecting vascular endothelial growth factor (VEGF) ligand binding [32]. Microvascular distribution is considered a vital sign of neovascularization, responsible for local growth and tumor metastasis [33,34]. In these applications, the potential of PSMA as an imaging biomarker is related to the exact function of PSMA in tumor-related endothelium. Conway et al. [35] demonstrated that PSMA is required for angiogenesis in vivo and is essential for endothelial cell invasion in vitro. Their results of linking PSMA with p21-activated kinase regulation suggest that PSMA is an important regulator of endothelial cell invasion and angiogenesis and may be a therapeutic target for angiogenesis-related diseases. Chang et al. [36] proved that PSMA was consistently expressed in the neovasculature of a wide variety of malignant neoplasms. More malignant lesions usually have more abundant microvascular structures [37,38,39,40]. DCE-MRI is one of the most mature imaging biomarkers of tumor microvessels. DCE-MRI and PSMA-PET can be performed simultaneously in a PET/MRI scanner so that these markers can be directly correlated.
Early research indicated that ADT causes a reduction of blood flow in the prostate gland that precedes apoptosis of the epithelium [41,42]. Another study held a different opinion. Roe et al. [43] reported that their key findings were the increased tumor vascularization following ADT. However, the above experimental conclusions are based on animal experiments. Human studies characterizing vascular effects following ADT are limited. The long-term impact of ADT on tumor vascularization needs to be further investigated. The effects following radiotherapy of prostate measured with quantitative MRI were reported by Kershaw et al. [44] They proved that tumor blood flow decreased after treatment. Nevertheless, because of this study’s relatively small sample size, a larger number of sample systematic quantitative studies are needed. Therefore, the effect of radiotherapy on the microvascular structure of the human prostate has not been conclusively established. Based on what has been discussed above, ADT and radiotherapy’s effects on microvasculature were not considered in this study. There are some limitations to our study. The patient cohort is relatively small. There are only eleven patients who performed radical prostatectomy (RP) after scanning. Therefore, we were not able to take histopathology results as a gold standard.
4. Materials and Methods
4.1. Patients
This retrospective study was approved by the institutional ethics review board (EA1/060/16), and informed consent was waived for retrospective analysis.
We enrolled and excluded patients by the following criteria. Inclusion criteria: (1) patients with biopsy-proven prostate cancer who underwent [68Ga]Ga-PSMA-11 PET/MRI between January 2017 and July 2020 in our clinic; (2) necessary information could be obtained. Exclusion criteria: (1) patients, who underwent radical prostatectomy before scanning, were excluded; (2) patients did not undergo DCE-MRI during the scan. Patients’ inclusion and exclusion are summarized in the flowchart in Figure 4.
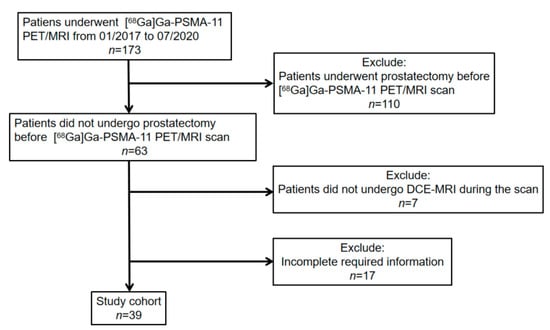
Figure 4.
[68Ga]Ga-PSMA-11 PET: gallium 68-labeled prostate-specific membrane antigen PET, DCE-MRI: Dynamic contrast-enhanced magnetic resonance imaging.
Patients who did not undergo radical prostatectomy before [68Ga]Ga-PSMA-11 PET/MRI and performed DCE-MRI in [68Ga]Ga-PSMA-11 PET/MRI examination were retrospectively selected from our institute’s database and included in this analysis. All patients were confirmed PCa by systematic biopsy before [68Ga]Ga-PSMA-11 PET PET/MRI scanning. Biopsy techniques included 12-core prostate biopsy and 14-core prostate biopsy. The needle biopsy technique introduced by Hodge et al. [45] has become the gold standard method for diagnosing prostate cancers. Both 12-core and 14-core prostate biopsy significantly increase the detection rate of prostate cancer and the accuracy of the biopsy Gleason score [46,47]. Clinical characteristics are compiled in Table 5.
Table 5.
Summary of clinical characteristics.
4.2. [68Ga]Ga-PSMA-11 PET/MRI Imaging Protocol
[68Ga]Ga-PSMA-11 was synthesized using a clinical-grade 68Ge/68Ga radionuclide generator (Eckert & Ziegler Radiopharma GmbH, Berlin, Germany) and PSMA-HBED-CC (ABX GmbH, Radeberg, Germany). Patients were imaged after 79 (72, 109) min after intravenous injection of a mean activity of 162.2 ± 22.1 MBq (4.4 ± 0.6 mCi) [68Ga]Ga-PSMA-11, corresponding to activity: 1.8–2.2 MBq (0.049–0.060mCi) per kilogram bodyweight. To minimize the halo artifact caused by scattering overcorrection associated with high renal and urinary tracer activity, furosemide is injected 30 min before the start of PET acquisition. Patients were asked to void urine immediately before the start of the examination. No adverse effects were observed after [68Ga]Ga-PSMA-11 injection.
PET and MRI were performed using the same protocol for every patient. Imaging was obtained with a 3.0 T PET/MRI system (SIEMENS MAGNETOM Biograph mMR, Erlangen, Germany). The acquisition was split into two parts. First, body PET/MRI cover from the vertex to mid-thigh was performed with 3 min of PET acquisition in each bed position, with coverage of 24 cm. Pre-contrast MRI sequences were acquired simultaneously using a combination of a dedicated mMR head-and-neck coil and phased-array mMR body surface coils. Siemens StarVIBE eliminates motion artifacts. The second part was a dedicated MRI scan of the pelvis, followed by PET data reconstruction. MRI sequence parameters are summarized in Table 6. Reconstruction was conducted with an ordered subset expectation maximization algorithm (OSEM), with 3 iterations/21 subsets, based on an x-matrix acquisition with a 4 mm Gaussian filter and relative scatter scaling. Contrast-enhanced agent gadobutrol (Gadovist®, Bayer Pharma AG, Berlin, Germany) is intravenously administered at a clinical dose of 0.1 mmol/kg bodyweight. Following the acquisition of precontrast data, a total of 60 contrast-enhanced data were obtained, with the start of the first postcontrast acquisition corresponding with the start of the contrast injection.
Table 6.
Imaging parameters used for MRI.
4.3. Image Analysis
Post-processing of all imaging data was performed with a dedicated post-processing software, Syngo.via (Siemens Healthcare, Erlangen, Germany). Regions of interest (ROIs) were defined as regions with an abnormal signal on MRI images and manually drawn. The MRI datasets were interpreted using PI-RADS version 2.1 [48]. Lesions with PI-RADS 1 to 3 were considered benign, while those with PI-RADS 4 and 5 were considered malignant. SUVmax is measured based on ROI, which is defined as corresponding to the finding on T2-weighted imaging (T2WI). All images were read by the same double-trained doctor. All perfusion parameters extracted from time-intensity curves were generated using Syngo.via MR Tissue 4D (Siemens Healthcare; Erlangen, Germany). Perfusion parameters, including arrival time (AT), time to peak (TTP), wash-in slope (W-in), wash-out slope (W-out), peak enhancement intensity (PEI), and initial area under the 60-sec curve (iAUC), were calculated. For the time-intensity curve, X-axis refers to time, and Y-axis refers to the ratio between baseline and post-contrast intensity. Previous publications suggested values between SUVmax 2.0 to 3.0 as appropriate cutoff values to minimize false-positive interpretation of faintly PSMA positive uptake [49,50]. A cutoff of SUVmax 3.0 was selected in this study. The definition of the above parameters is presented in Table 7.
Table 7.
Definition of DCE-MRI Parameters.
4.4. Statistical Analysis
The DCE-MRI parameters between benign and malignant lesion groups were compared by Mann–Whitney U test. Comparison of parameters between benign lesions with SUVmax ≤ 3.0 and SUVmax > 3.0 was accessed by Mann–Whitney U test, as were malignant lesions. Pearson correlation was used to determine the correlations among various DCE-MRI parameters. All statistical analyses were performed with statistical software SPSS 25 for Windows (IBM Corp, Armonk, NY, USA). The significance level was set to two-tailed p < 0.05. Patient demographics and clinical characteristics are summarized using descriptive statistics. Normal distributed data are reported as mean ± standard deviation (SD), and non-normal distributed data are reported as median (interquartile range) (IQR Q1, Q3).
5. Conclusions
In conclusion, various DCE-MRI parameters can be used to quantify perfusion in intraprostatic lesions. DCE-MRI parameters reflect the perfusion characteristics of intraprostatic lesions with malignant lesions demonstrating significantly shorter TTP. There is a moderate to strong correlation between DCE-MRI parameters. Semi-quantitative analysis reflects how malignant lesions show significantly higher SUVmax than benign lesions.
Author Contributions
Conceptualization, J.Z. and M.R.M.; methodology, J.Z.; software, J.Z.; validation, A.K., D.B.M. and J.B.; formal analysis, D.B.M.; writing—original draft preparation, J.Z.; writing—review and editing, A.K.; visualization, J.B.; supervision, M.R.M.; project administration, B.H.; funding acquisition, W.B. All authors have read and agreed to the published version of the manuscript.
Funding
The PET/MRI scanner is funded in part by the German Research Foundation (INST 335/454-1). We acknowledge support from the German Research Foundation (DFG) and the Open Access Publication Fund of Charité—Universitätsmedizin Berlin.
Institutional Review Board Statement
All procedures performed in studies involving human participants were in accordance with the ethical standards of the institutional and national research committee and with the 1964 Helsinki declaration and its later amendments or comparable ethical standards. This retrospective study was approved by the institutional ethics review board (EA1/060/16), and the institutional review board waived the requirement for informed consent for this retrospective analysis.
Informed Consent Statement
Patient consent was waived due to retrospective analysis.
Data Availability Statement
The datasets analyzed and generated during this study are included in this published study.
Acknowledgments
J.Z. thanks German Research Foundation (GRK2260, BIOQIC) for the support.
Conflicts of Interest
The authors declare that they have no conflict of interest.
Abbreviations
| AT | Arrival time; |
| BPH | Benign prostatic hyperplasia; |
| CT | Computed tomography; |
| DCE-MRI | Dynamic contrast-enhanced magnetic resonance imaging; |
| DWI | Diffusion-weighted imaging; |
| FOV | Field of view; |
| Ga | Gallium; |
| GS | Gleason score; |
| iAUC | initial area under curve; |
| MRI | Magnetic resonance imaging; |
| mpMRI | Multiparametric magnetic resonance imaging; |
| PCa | Prostate cancer; |
| PEI | Peak enhancement intensity; |
| PET/CT | Positron emission tomography / computed tomography; |
| PET/MR | Positron emission tomography /magnetic resonance; |
| PI-RADS | Prostate Imaging Reporting and Data System; |
| PSA | Prostate-specific antigen; |
| PSMA | Prostate-specific membrane antigen; |
| ROI | Region of interest; |
| SUV | Standardized uptake value; |
| TE | Echo time; |
| TR | Repetition time; |
| TTP | Time to peak; |
| T2WI | T2-weighted imaging; |
| W-in | Wash-in slope; |
| W-out | Wash-out slope. |
References
- Miller, K.D.; Siegel, R.L.; Khan, R.; Jemal, A. Cancer Statistics. Cancer Rehabil. 2018, 70, 7–30. [Google Scholar] [CrossRef]
- Delongchamps, N.B.; Rouanne, M.; Flam, T.; Beuvon, F.; Liberatore, M.; Zerbib, M.; Cornud, F. Multiparametric magnetic resonance imaging for the detection and localization of prostate cancer: Combination of T2-weighted, dynamic contrast-enhanced and diffusion-weighted imaging. BJU Int. 2010, 107, 1411–1418. [Google Scholar] [CrossRef]
- O’Connor, J.P.B.; Jackson, A.; Parker, G.J.M.; Roberts, C.; Jayson, G.C. Dynamic contrast-enhanced MRI in clinical trials of antivascular therapies. Nat. Rev. Clin. Oncol. 2012, 9, 167–177. [Google Scholar] [CrossRef] [PubMed]
- Lissbrant, I.F.; Stattin, P.; Damber, J.-E.; Bergh, A. Vascular density is a predictor of cancer-specific survival in prostatic carcinoma. Prostate 1997, 33, 38–45. [Google Scholar] [CrossRef]
- de la Taille, A.; Katz, A.E.; Bagiella, E.; Buttyan, R.; Sharir, S.; Olsson, C.A.; Burchardt, T.; Ennis, R.D.; Rubin, M.A. Microvessel density as a predictor of PSA recurrence after radical prostatectomy. A comparison of CD34 and CD31. Am. J. Clin. Pathol. 2000, 113, 555–562. [Google Scholar] [CrossRef]
- Tan, C.H.; Hobbs, B.P.; Wei, W.; Kundra, V. Dynamic contrast-enhanced MRI for the detection of prostate cancer: Meta-analysis. Am. J. Roentgenol. 2015, 204, W439–W448. [Google Scholar] [CrossRef] [PubMed]
- Miller, J.C.; Pien, H.H.; Sahani, D.; Sorensen, A.G.; Thrall, J.H. Imaging Angiogenesis: Applications and Potential for Drug Development. J. Natl. Cancer Inst. 2005, 97, 172–187. [Google Scholar] [CrossRef]
- Khalifa, F.; Soliman, A.; El-Baz, A.; El-Ghar, M.A.; El-Diasty, T.; Gimel’Farb, G.; Ouseph, R.; Dwyer, A.C. Models and methods for analyzing DCE-MRI: A review. Med. Phys. 2014, 41, 124301. [Google Scholar] [CrossRef]
- Winkel, D.J.; Heye, T.J.; Benz, M.R.; Glessgen, C.G.; Wetterauer, C.; Bubendorf, L.; Block, T.K.; Boll, D.T. Compressed Sensing Radial Sampling MRI of Prostate Perfusion: Utility for Detection of Prostate Cancer. Radiology 2019, 290, 702–708. [Google Scholar] [CrossRef] [PubMed]
- Sung, Y.S.; Kwon, H.-J.; Park, B.-W.; Cho, G.; Lee, C.K.; Cho, K.-S.; Kim, J.K. Prostate Cancer Detection on Dynamic Contrast-Enhanced MRI: Computer-Aided Diagnosis Versus Single Perfusion Parameter Maps. Am. J. Roentgenol. 2011, 197, 1122–1129. [Google Scholar] [CrossRef] [PubMed][Green Version]
- Kader, A.; Brangsch, J.; Kaufmann, J.O.; Zhao, J.; Mangarova, D.B.; Moeckel, J.; Adams, L.C.; Sack, I.; Taupitz, M.; Hamm, B.; et al. Molecular MR Imaging of Prostate Cancer. Biomedicines 2020, 9, 1. [Google Scholar] [CrossRef] [PubMed]
- Rahbar, K.; Weckesser, M.; Huss, S.; Semjonow, A.; Breyholz, H.-J.; Schrader, A.J.; Schäfers, M.; Bögemann, M. Correlation of Intraprostatic Tumor Extent with 68Ga-PSMA Distribution in Patients with Prostate Cancer. J. Nucl. Med. 2016, 57, 563–567. [Google Scholar] [CrossRef]
- Fendler, W.P.; Eiber, M.; Beheshti, M.; Bomanji, J.; Ceci, F.; Cho, S.; Giesel, F.; Haberkorn, U.; Hope, T.A.; Kopka, K.; et al. 68Ga-PSMA PET/CT: Joint EANM and SNMMI procedure guideline for prostate cancer imaging: Version 1.0. Eur. J. Nucl. Med. Mol. Imaging 2017, 44, 1014–1024. [Google Scholar] [CrossRef] [PubMed]
- Souvatzoglou, M.; Eiber, M.; Martínez-Moeller, A.; Fürst, S.; Holzapfel, K.; Maurer, T.; Ziegler, S.; Nekolla, S.; Schwaiger, M.; Beer, A.J. PET/MR in prostate cancer: Technical aspects and potential diagnostic value. Eur. J. Nucl. Med. Mol. Imaging 2013, 40, 79–88. [Google Scholar] [CrossRef]
- Zhao, J.; Hamm, B.; Brenner, W.; Makowski, M.R. Lesion-to-background ratio threshold value of SUVmax of simultaneous [68Ga]Ga-PSMA-11 PET/MRI imaging in patients with prostate cancer. Insights Imaging 2020, 11, 1–11. [Google Scholar] [CrossRef]
- Souvatzoglou, M.; Eiber, M.; Takei, T.; Fürst, S.; Maurer, T.; Gaertner, F.; Geinitz, H.; Drzezga, A.; Ziegler, S.; Nekolla, S.G.; et al. Comparison of integrated whole-body [11C]choline PET/MR with PET/CT in patients with prostate cancer. Eur. J. Nucl. Med. Mol. Imaging 2013, 40, 1486–1499. [Google Scholar] [CrossRef]
- Guberina, N.; Hetkamp, P.; Ruebben, H.; Fendler, W.; Grueneisen, J.; Suntharalingam, S.; Kirchner, J.; Puellen, L.; Harke, N.; Radtke, J.P.; et al. Whole-Body Integrated [68Ga]PSMA-11-PET/MR Imaging in Patients with Recurrent Prostate Cancer: Comparison with Whole-Body PET/CT as the Standard of Reference. Mol. Imaging Biol. 2019, 22, 788–796. [Google Scholar] [CrossRef] [PubMed]
- Mansbridge, M.; Chung, E.; Rhee, H. The Use of MRI and PET Imaging Studies for Prostate Cancer Management: Brief Update, Clinical Recommendations, and Technological Limitations. Med. Sci. 2019, 7, 85. [Google Scholar] [CrossRef]
- Kranzbühler, B.; Müller, J.; Becker, A.S.; Schüler, H.I.G.; Muehlematter, U.J.; Fankhauser, C.D.; Kedzia, S.; Guckenberger, M.; Kaufmann, P.A.; Eberli, D.; et al. Detection Rate and Localization of Prostate Cancer Recurrence Using 68Ga-PSMA-11 PET/MRI in Patients with Low PSA Values ≤ 0.5 ng/mL. J. Nucl. Med. 2019, 61, 194–201. [Google Scholar] [CrossRef] [PubMed]
- Afshar-Oromieh, A.; Haberkorn, U.; Schlemmer, H.P.; Fenchel, M.; Eder, M.; Eisenhut, M.; Hadaschik, B.A.; Kopp-Schneider, A.; Röthke, M. Comparison of PET/CT and PET/MRI hybrid systems using a 68Ga-labelled PSMA ligand for the diagnosis of recurrent prostate cancer: Initial experience. Eur. J. Nucl. Med. Mol. Imaging 2014, 41, 887–897. [Google Scholar] [CrossRef]
- Zhao, J.; Mangarova, D.B.; Brangsch, J.; Kader, A.; Hamm, B.; Brenner, W.; Makowski, M.R. Correlation between Intraprostatic PSMA Uptake and MRI PI-RADS of [68Ga]Ga-PSMA-11 PET/MRI in Patients with Prostate Cancer: Comparison of PI-RADS Version 2.0 and PI-RADS Version 2.1. Cancers 2020, 12, 3523. [Google Scholar] [CrossRef] [PubMed]
- Lecouvet, F.E.; El Mouedden, J.; Collette, L.; Coche, E.; Danse, E.; Jamar, F.; Machiels, J.P.; Berg, B.V.; Omoumi, P.; Tombal, B. Can whole-body magnetic resonance imaging with diffusion-weighted imaging replace Tc 99m bone scanning and computed tomography for single-step detection of metastases in patients with high-risk prostate cancer? Eur. Urol. 2012, 62, 68–75. [Google Scholar] [CrossRef]
- Hara, N.; Okuizumi, M.; Koike, H.; Kawaguchi, M.; Bilim, V. Dynamic contrast-enhanced magnetic resonance imaging (DCE-MRI) is a useful modality for the precise detection and staging of early prostate cancer. Prostate 2004, 62, 140–147. [Google Scholar] [CrossRef] [PubMed]
- Hamm, B.; Asbach, P. Magnetic Resonance Imaging of the Prostate in the PI-RADS Era. Dis. Abdomen Pelvis 2018, 2018–2021, 99–115. [Google Scholar]
- Maurer, T.; Eiber, M.; Schwaiger, M.E.M.; Gschwend, T.M.J.E. Current use of PSMA–PET in prostate cancer management. Nat. Rev. Urol. 2016, 13, 226–235. [Google Scholar] [CrossRef]
- Berman, R.M.; Brown, A.M.; Chang, S.D.; Sankineni, S.; Kadakia, M.; Wood, B.J.; Pinto, P.A.; Choyke, P.L.; Turkbey, B. DCE MRI of prostate cancer. Abdom. Radiol. 2016, 41, 844–853. [Google Scholar] [CrossRef]
- Vos, E.K.; Litjens, G.J.; Kobus, T.; Hambrock, T.; de Kaa, C.A.H.-V.; Barentsz, J.O.; Huisman, H.J.; Scheenen, T.W. Assessment of Prostate Cancer Aggressiveness Using Dynamic Contrast-enhanced Magnetic Resonance Imaging at 3 T. Eur. Urol. 2013, 64, 448–455. [Google Scholar] [CrossRef] [PubMed]
- Chen, Y.-J.; Chu, W.-C.; Pu, Y.-S.; Chueh, S.-C.; Shun, C.-T.; Tseng, W.-Y.I. Washout gradient in dynamic contrast-enhanced MRI is associated with tumor aggressiveness of prostate cancer. J. Magn. Reson. Imaging 2012, 36, 912–919. [Google Scholar] [CrossRef]
- van Niekerk, C.G.; van der Laak, J.A.; Hambrock, T.; Huisman, H.J.; Witjes, J.A.; Barentsz, J.O.; de Kaa, C.A.H. Correlation between dynamic contrast-enhanced MRI and quantitative histopathologic microvascular parameters in organ-confined prostate cancer. Eur. Radiol. 2014, 24, 2597–2605. [Google Scholar] [CrossRef]
- Ren, J.; Huan, Y.; Wang, H.; Chang, Y.-J.; Zhao, H.-T.; Ge, Y.-L.; Liu, Y.; Yang, Y. Dynamic contrast-enhanced MRI of benign prostatic hyperplasia and prostatic carcinoma: Correlation with angiogenesis. Clin. Radiol. 2008, 63, 153–159. [Google Scholar] [CrossRef] [PubMed]
- Yi, B.; Kang, D.K.; Yoon, D.; Jung, Y.S.; Kim, K.S.; Yim, H.; Kim, T.H. Is there any correlation between model-based perfusion parameters and model-free parameters of time-signal intensity curve on dynamic contrast enhanced MRI in breast cancer patients? Eur. Radiol. 2014, 24, 1089–1096. [Google Scholar] [CrossRef] [PubMed]
- Jayson, G.C.; Kerbel, R.; Ellis, L.M.; Harris, A.L. Antiangiogenic therapy in oncology: Current status and future directions. Lancet 2016, 388, 518–529. [Google Scholar] [CrossRef]
- Folkman, J. The role of angiogenesis in tumor growth. Semin. Cancer Biol. 1992, 3, 45–71. [Google Scholar]
- Borre, M.; Offersen, B.V.; Nerstrøm, B.; Overgaard, J. Microvessel density predicts survival in prostate cancer patients subjected to watchful waiting. Br. J. Cancer 1998, 78, 940–944. [Google Scholar] [CrossRef]
- Conway, R.E.; Petrovic, N.; Li, Z.; Heston, W.; Wu, D.; Shapiro, L.H. Prostate-Specific Membrane Antigen Regulates Angiogenesis by Modulating Integrin Signal Transduction. Mol. Cell. Biol. 2006, 26, 5310–5324. [Google Scholar] [CrossRef]
- Chang, S.S.; Reuter, V.E.; Heston, W.D.; Bander, N.H.; Grauer, L.S.; Gaudin, P.B. Five different anti-prostate-specific membrane antigen (PSMA) antibodies confirm PSMA expression in tumor-associated neovasculature. Cancer Res. 1999, 59, 3192–3198. [Google Scholar] [PubMed]
- Singanamalli, A.; Rusu, M.; Sparks, R.E.; Shih, N.N.; Ziober, A.; Wang, L.-P.; Tomaszewski, J.; Rosen, M.; Feldman, M.; Madabhushi, A. Identifying in vivo DCE MRI markers associated with microvessel architecture and gleason grades of prostate cancer. J. Magn. Reson. Imaging 2015, 43, 149–158. [Google Scholar] [CrossRef] [PubMed]
- van den Ouden, D.; Kranse, R.; Hop, W.C.; van der Kwast, T.H.; Schroder, F.H. Microvascular invasion in prostate cancer: Prognostic significance in patients treated by radical prostatectomy for clinically localized carcinoma. Urol. Int. 1998, 60, 17–24. [Google Scholar] [CrossRef]
- Antunes, A.A.; Srougi, M.; Dall’Oglio, M.F.; Crippa, A.; Paranhos, M.; Cury, J.; Nesrallah, L.J.; Leite, K.R. Microvascular invasion is an independent prognostic factor in patients with prostate cancer treated with radical prostatectomy. Int. Braz. J. Urol. 2006, 32, 668–677. [Google Scholar] [CrossRef]
- Salomao, D.R.; Graham, S.D.; Bostwick, D.G. Microvascular invasion in prostate cancer correlates with pathologic stage. Arch. Pathol. Lab. Med. 1995, 119, 1050–1054. [Google Scholar]
- Shabsigh, A.; Chang, D.T.; Heitjan, D.F.; Kiss, A.; Olsson, C.A.; Puchner, P.J.; Buttyan, R. Rapid reduction in blood flow to the rat ventral prostate gland after castration: Preliminary evidence that androgens influence prostate size by regulating blood flow to the prostate gland and prostatic endothelial cell survival. Prostate 1998, 36, 201–206. [Google Scholar] [CrossRef]
- Shabsigh, A.; Lee, B.; Buttyan, R. Unique morphological aspects of the rat ventral prostate gland revealed by vascular corrosion casting. Prostate 1999, 39, 240–245. [Google Scholar] [CrossRef]
- Røe, K.; Mikalsen, L.T.; Van Der Kogel, A.J.; Bussink, J.; Lyng, H.; Ree, A.H.; Marignol, L.; Olsen, D.R. Vascular responses to radiotherapy and androgen-deprivation therapy in experimental prostate cancer. Radiat. Oncol. 2012, 7, 75. [Google Scholar] [CrossRef] [PubMed]
- Kershaw, L.E.; Logue, J.P.; Hutchinson, C.E.; Clarke, N.W.; Buckley, D.L. Late tissue effects following radiotherapy and neoadjuvant hormone therapy of the prostate measured with quantitative magnetic resonance imaging. Radiother. Oncol. 2008, 88, 127–134. [Google Scholar] [CrossRef]
- Hodge, K.K.; McNeal, J.E.; Terris, M.K.; Stamey, T.A. Random Systematic Versus Directed Ultrasound Guided Transrectal Core Biopsies of the Prostate. J. Urol. 1989, 142, 71–74. [Google Scholar] [CrossRef]
- Elabbady, A.A.; Khedr, M.M. Extended 12-Core Prostate Biopsy Increases Both the Detection of Prostate Cancer and the Accuracy of Gleason Score. Eur. Urol. 2006, 49, 49–53. [Google Scholar] [CrossRef]
- Uno, H.; Nakano, M.; Ehara, H.; Deguchi, T. Indications for Extended 14-Core Transrectal Ultrasound-Guided Prostate Biopsy. Urology 2008, 71, 23–27. [Google Scholar] [CrossRef]
- Turkbey, B.; Rosenkrantz, A.B.; Haider, M.A.; Padhani, A.R.; Villeirs, G.; Macura, K.J.; Tempany, C.M.; Choyke, P.L.; Cornud, F.; Margolis, D.J.; et al. Prostate Imaging Reporting and Data System Version 2.1: 2019 Update of Prostate Imaging Reporting and Data System Version 2. Eur. Urol. 2019, 76, 340–351. [Google Scholar] [CrossRef] [PubMed]
- Giesel, F.L.; Fiedler, H.; Stefanova, M.; Sterzing, F.; Rius, M.; Kopka, K.; Moltz, J.H.; Afshar-Oromieh, A.; Choyke, P.L.; Haberkorn, U.; et al. PSMA PET/CT with Glu-urea-Lys-(Ahx)-[68Ga(HBED-CC)] versus 3D CT volumetric lymph node assessment in recurrent prostate cancer. Eur. J. Nucl. Med. Mol. Imaging 2015, 42, 1794–1800. [Google Scholar] [CrossRef]
- Woythal, N.; Arsenic, R.; Kempkensteffen, C.; Miller, K.; Janssen, J.-C.; Huang, K.; Makowski, M.R.; Brenner, W.; Prasad, V. Immunohistochemical Validation of PSMA Expression Measured by 68Ga-PSMA PET/CT in Primary Prostate Cancer. J. Nucl. Med. 2018, 59, 238–243. [Google Scholar] [CrossRef] [PubMed]
Publisher’s Note: MDPI stays neutral with regard to jurisdictional claims in published maps and institutional affiliations. |
© 2021 by the authors. Licensee MDPI, Basel, Switzerland. This article is an open access article distributed under the terms and conditions of the Creative Commons Attribution (CC BY) license (http://creativecommons.org/licenses/by/4.0/).