
SWATH-MS Based Proteomic Profiling of Prostate Cancer Cells Reveals Adaptive Molecular Mechanisms in Response to Anti-Androgen Therapy

 , ,
, , 
Abstract
:Simple Summary
Abstract

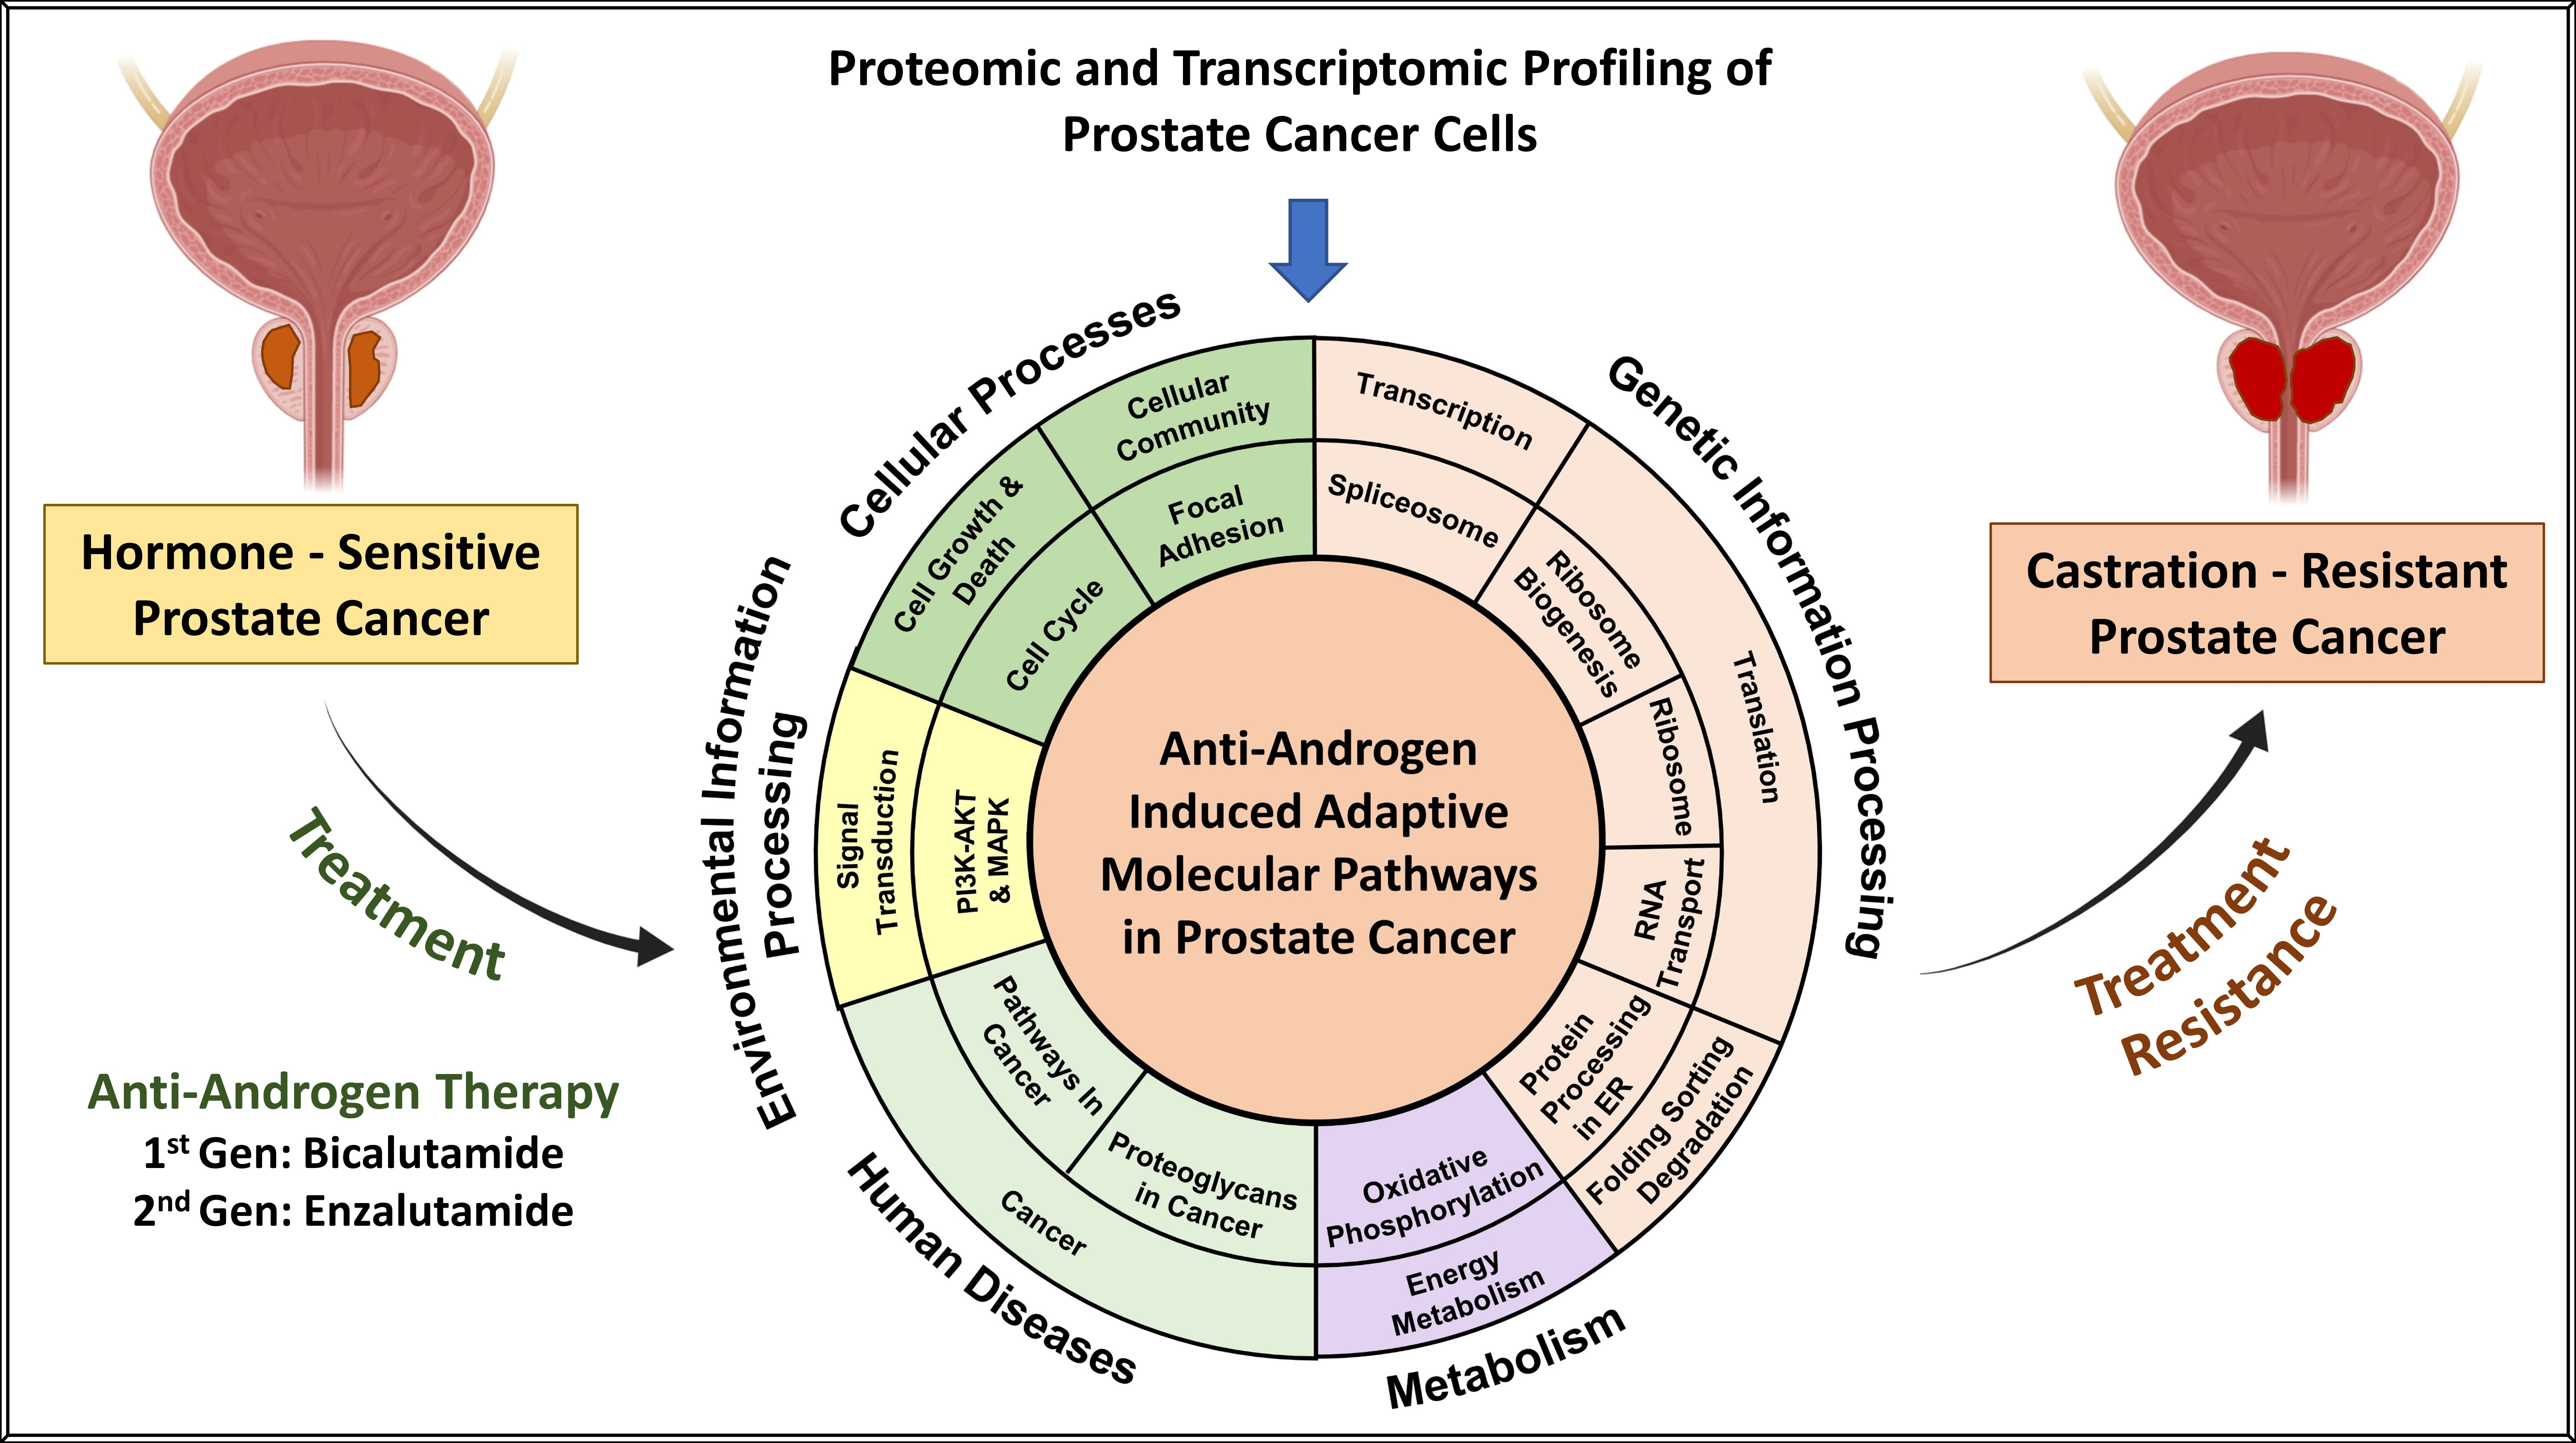
1. Introduction
2. Results
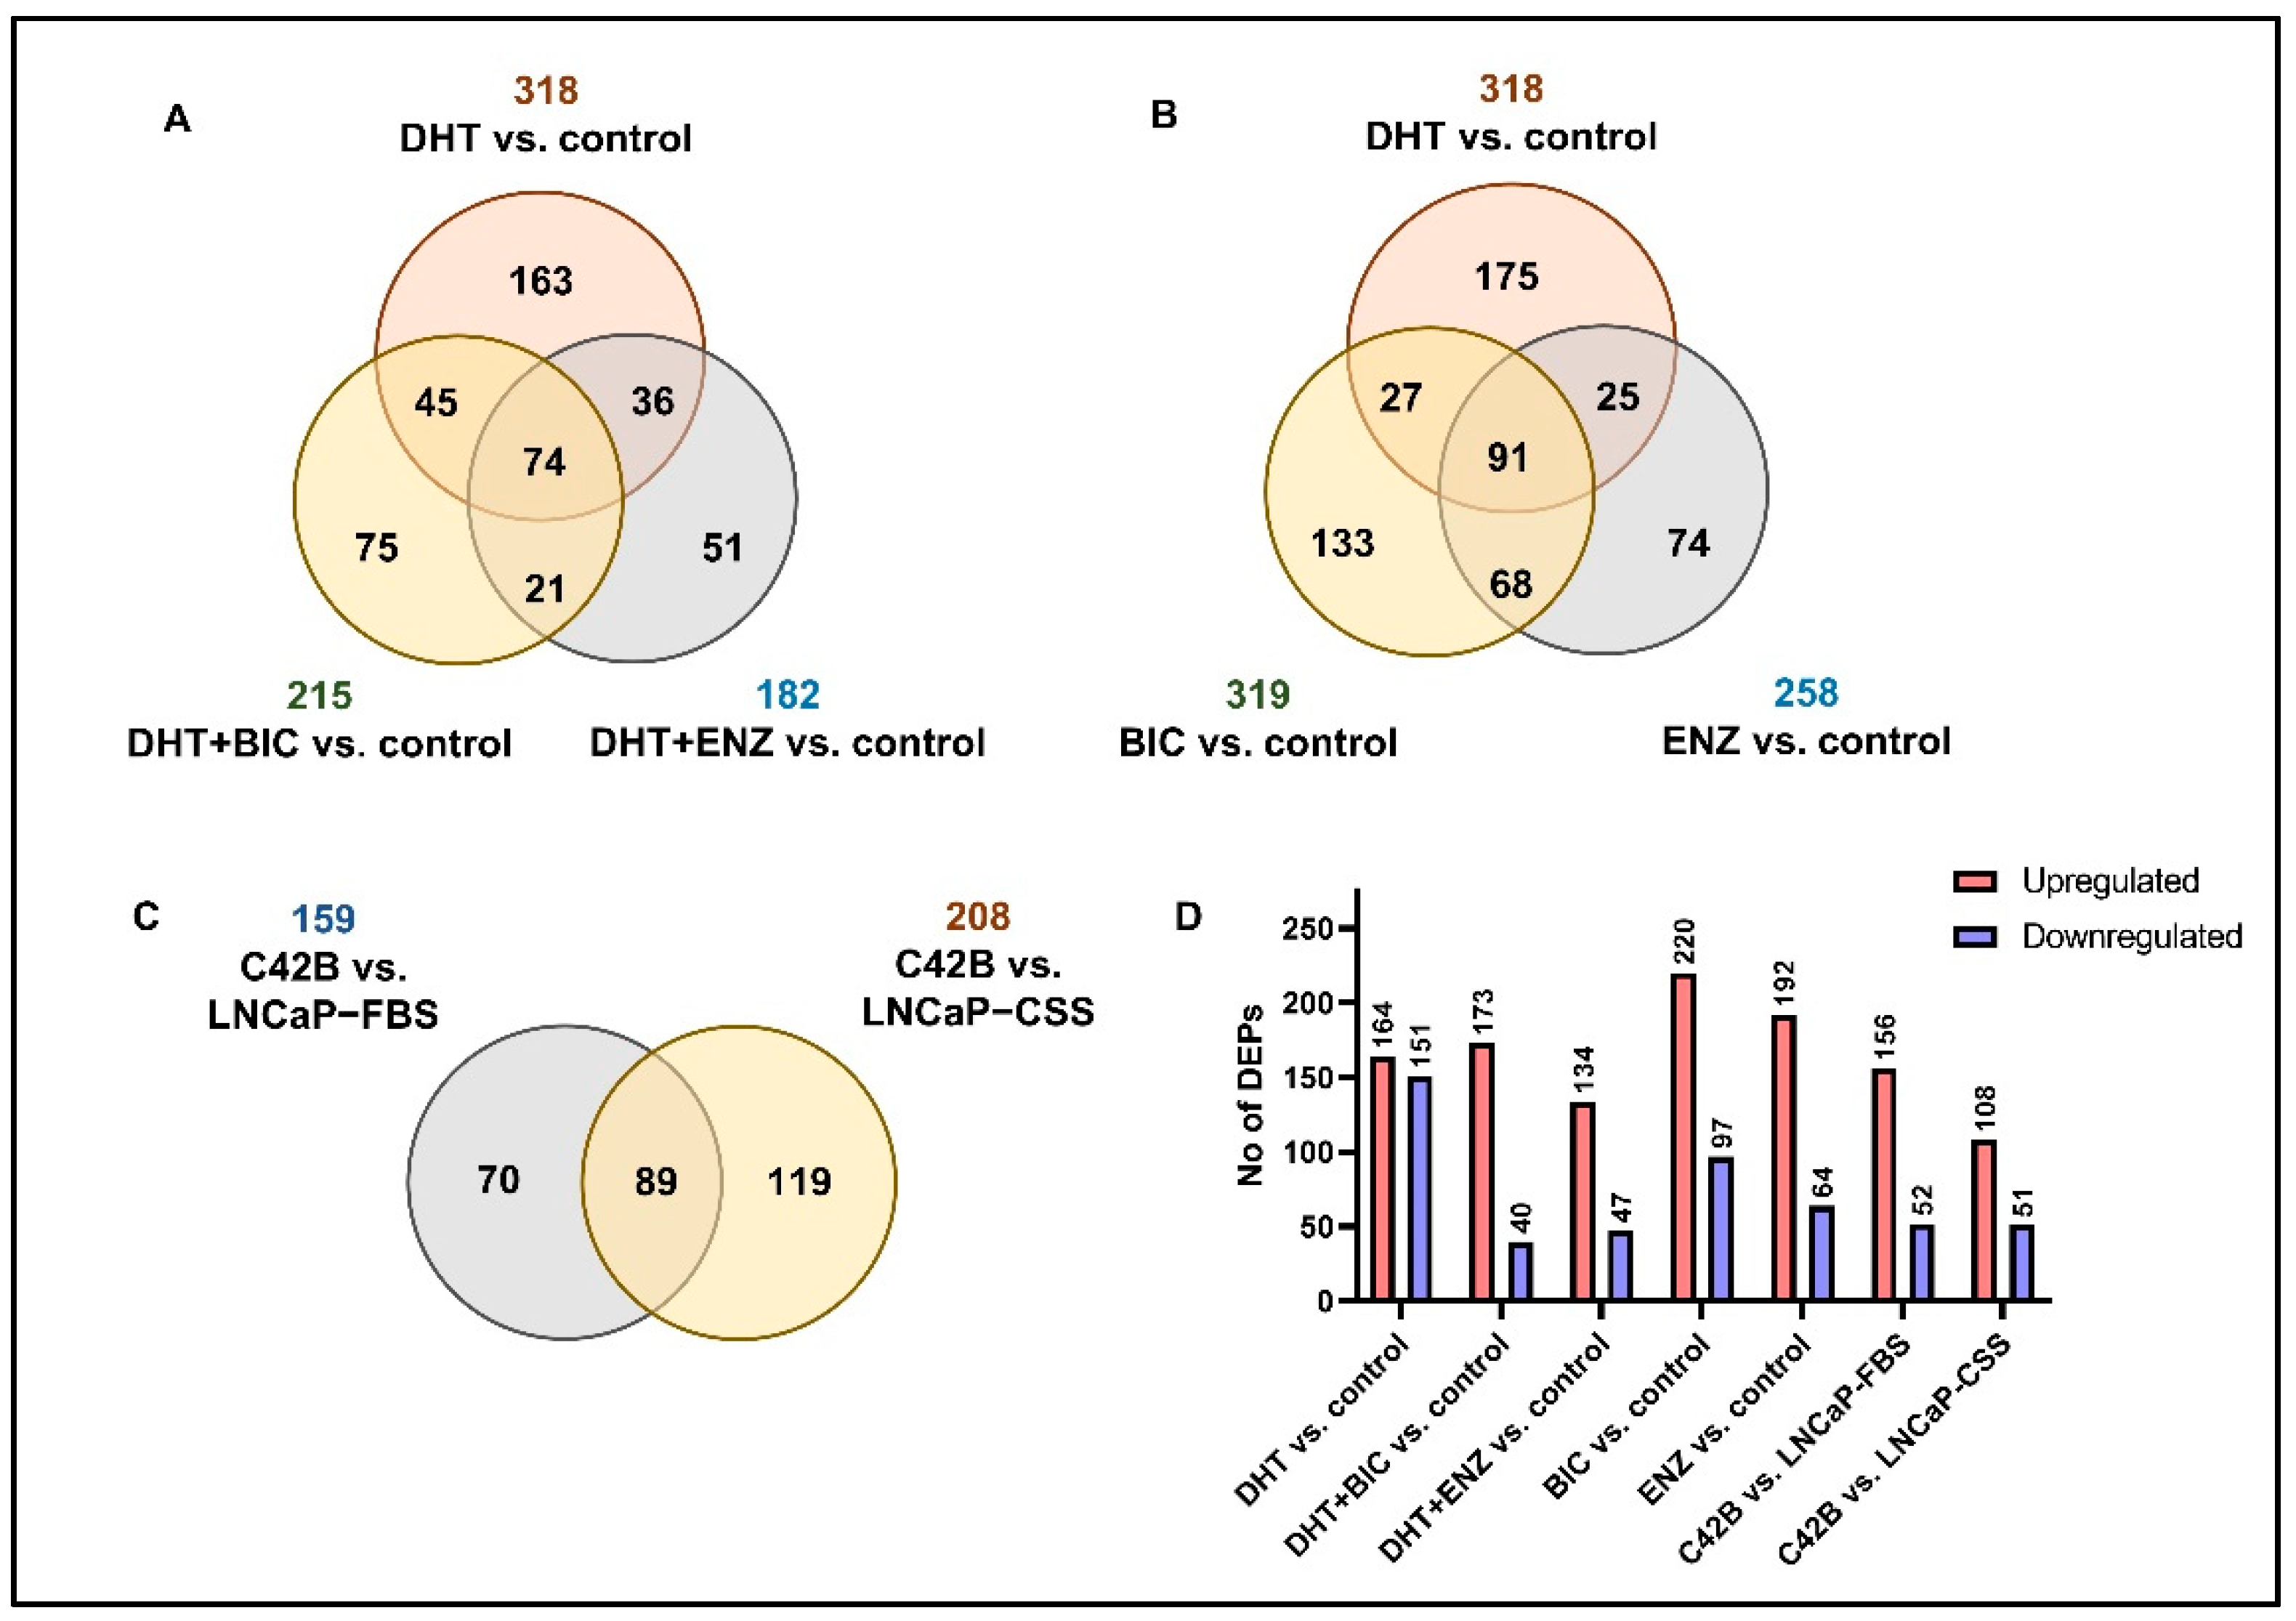
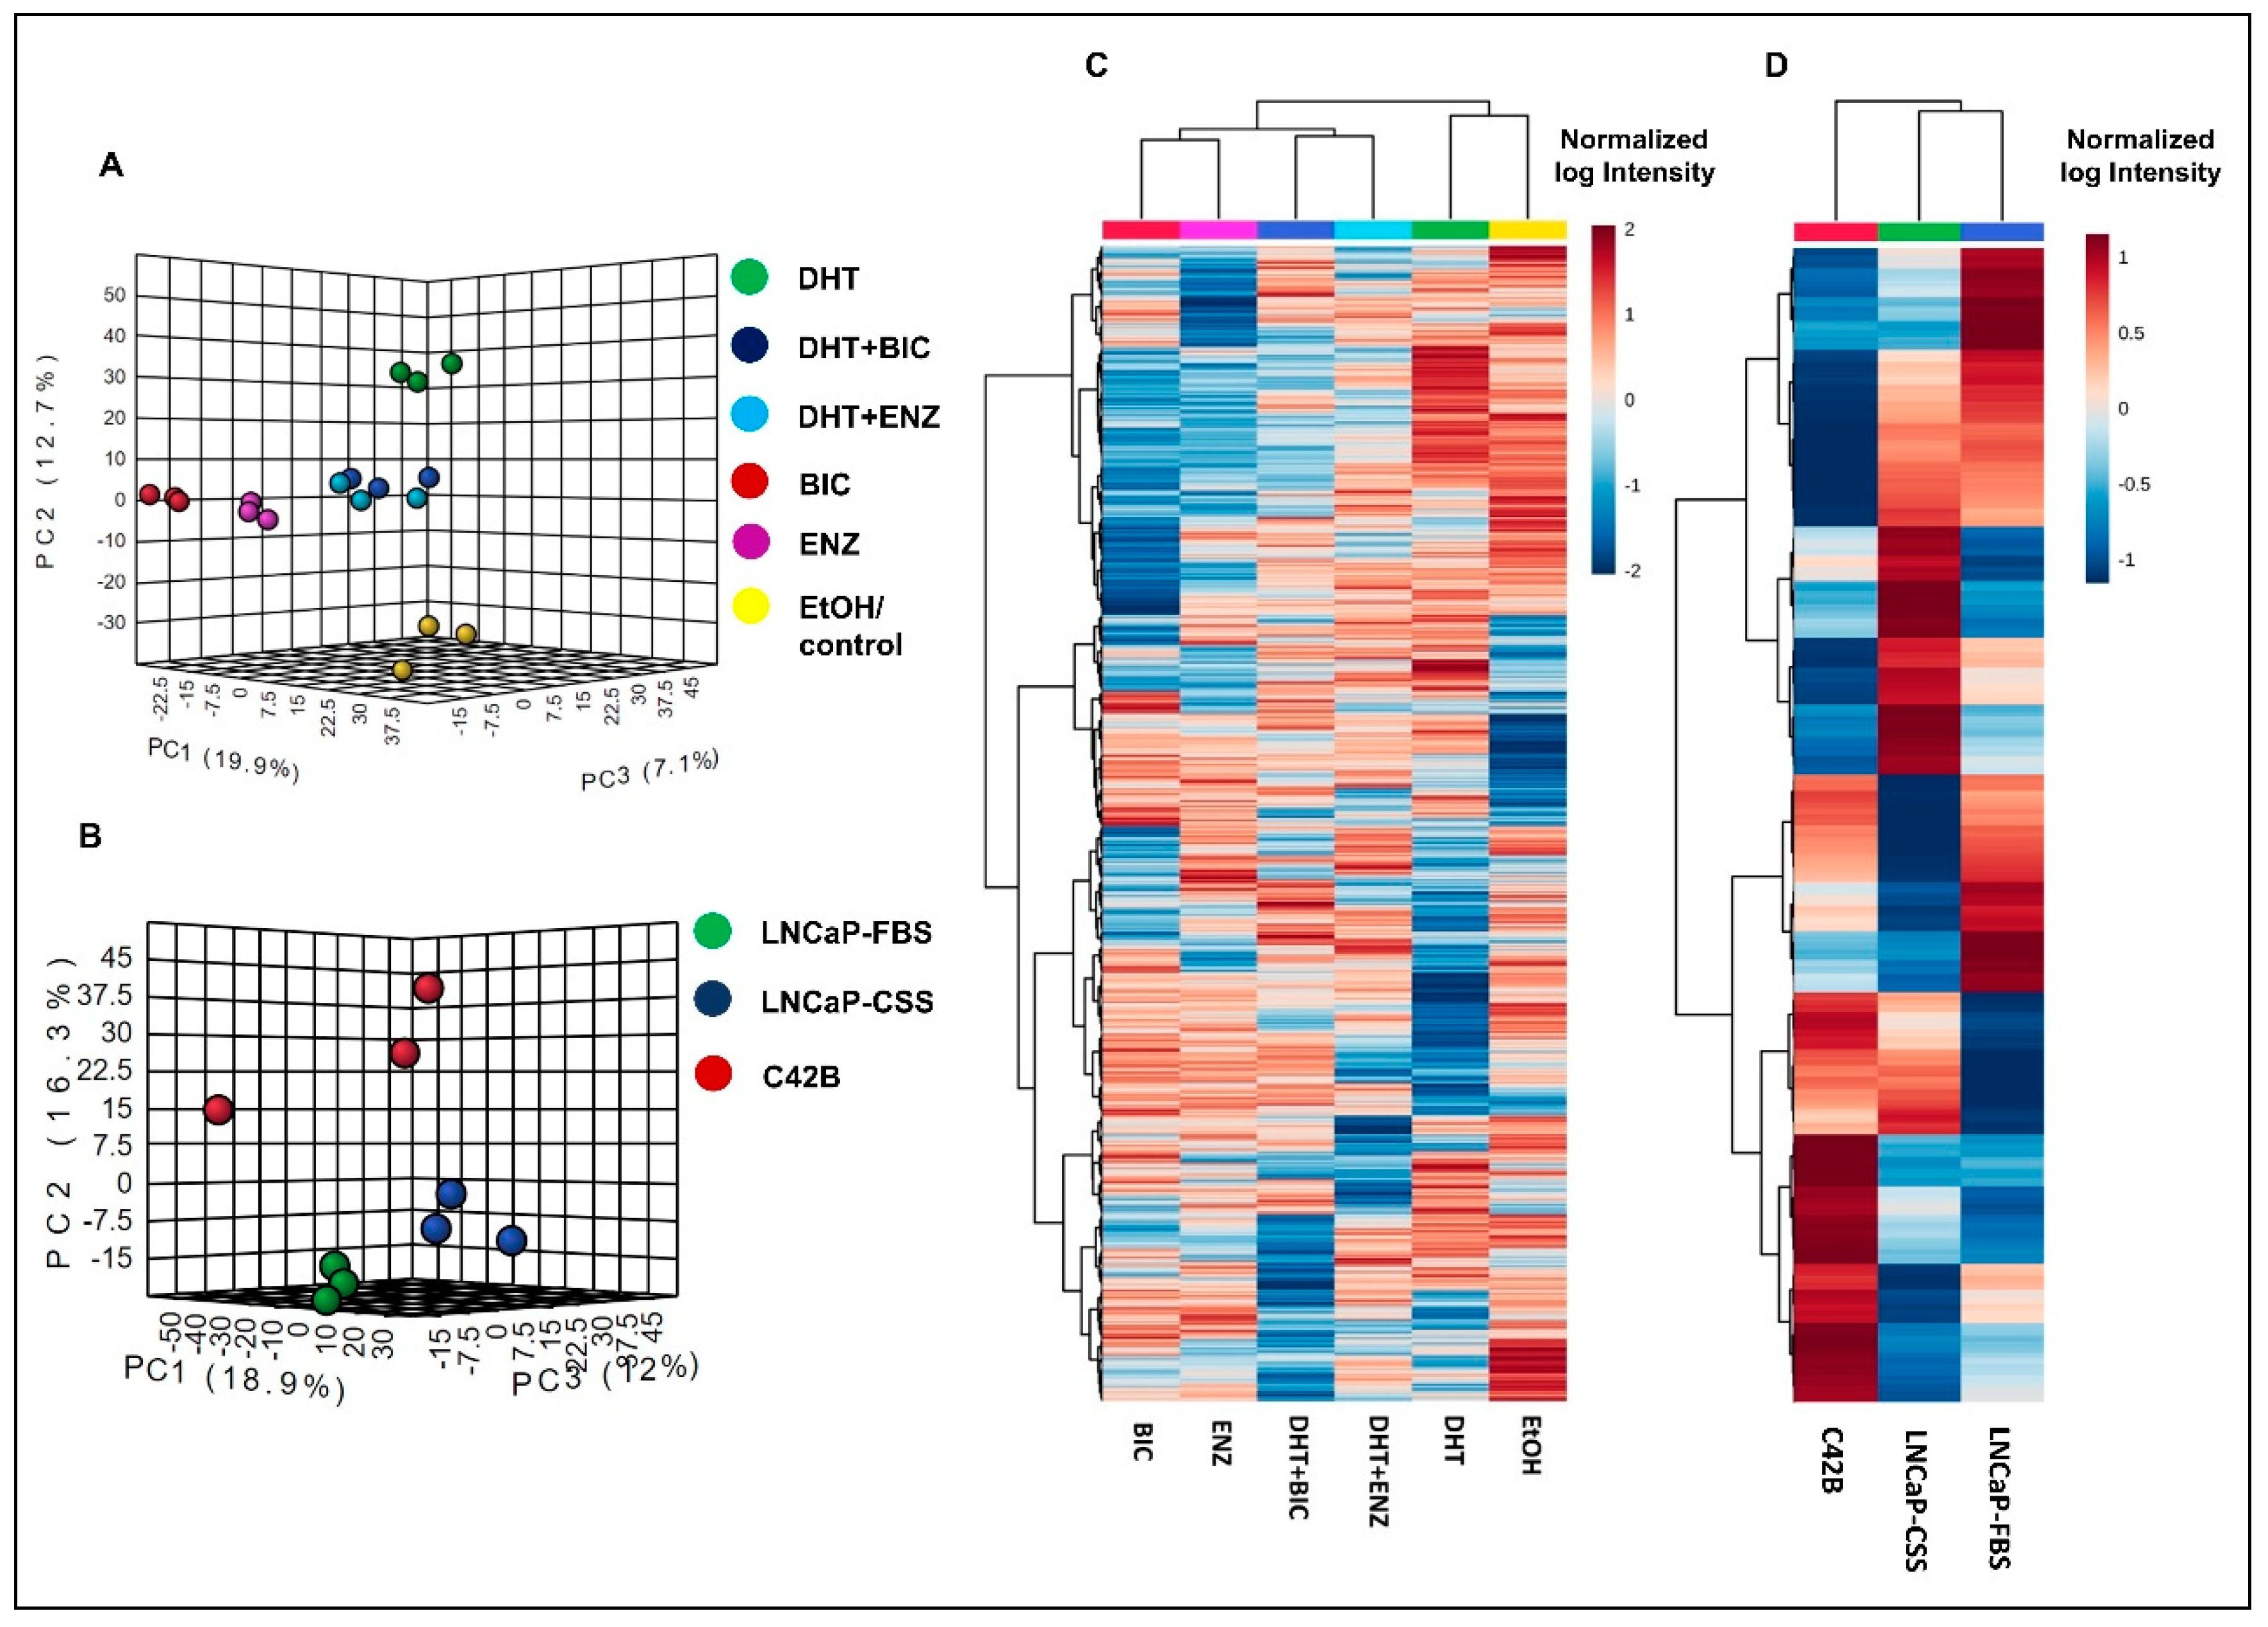
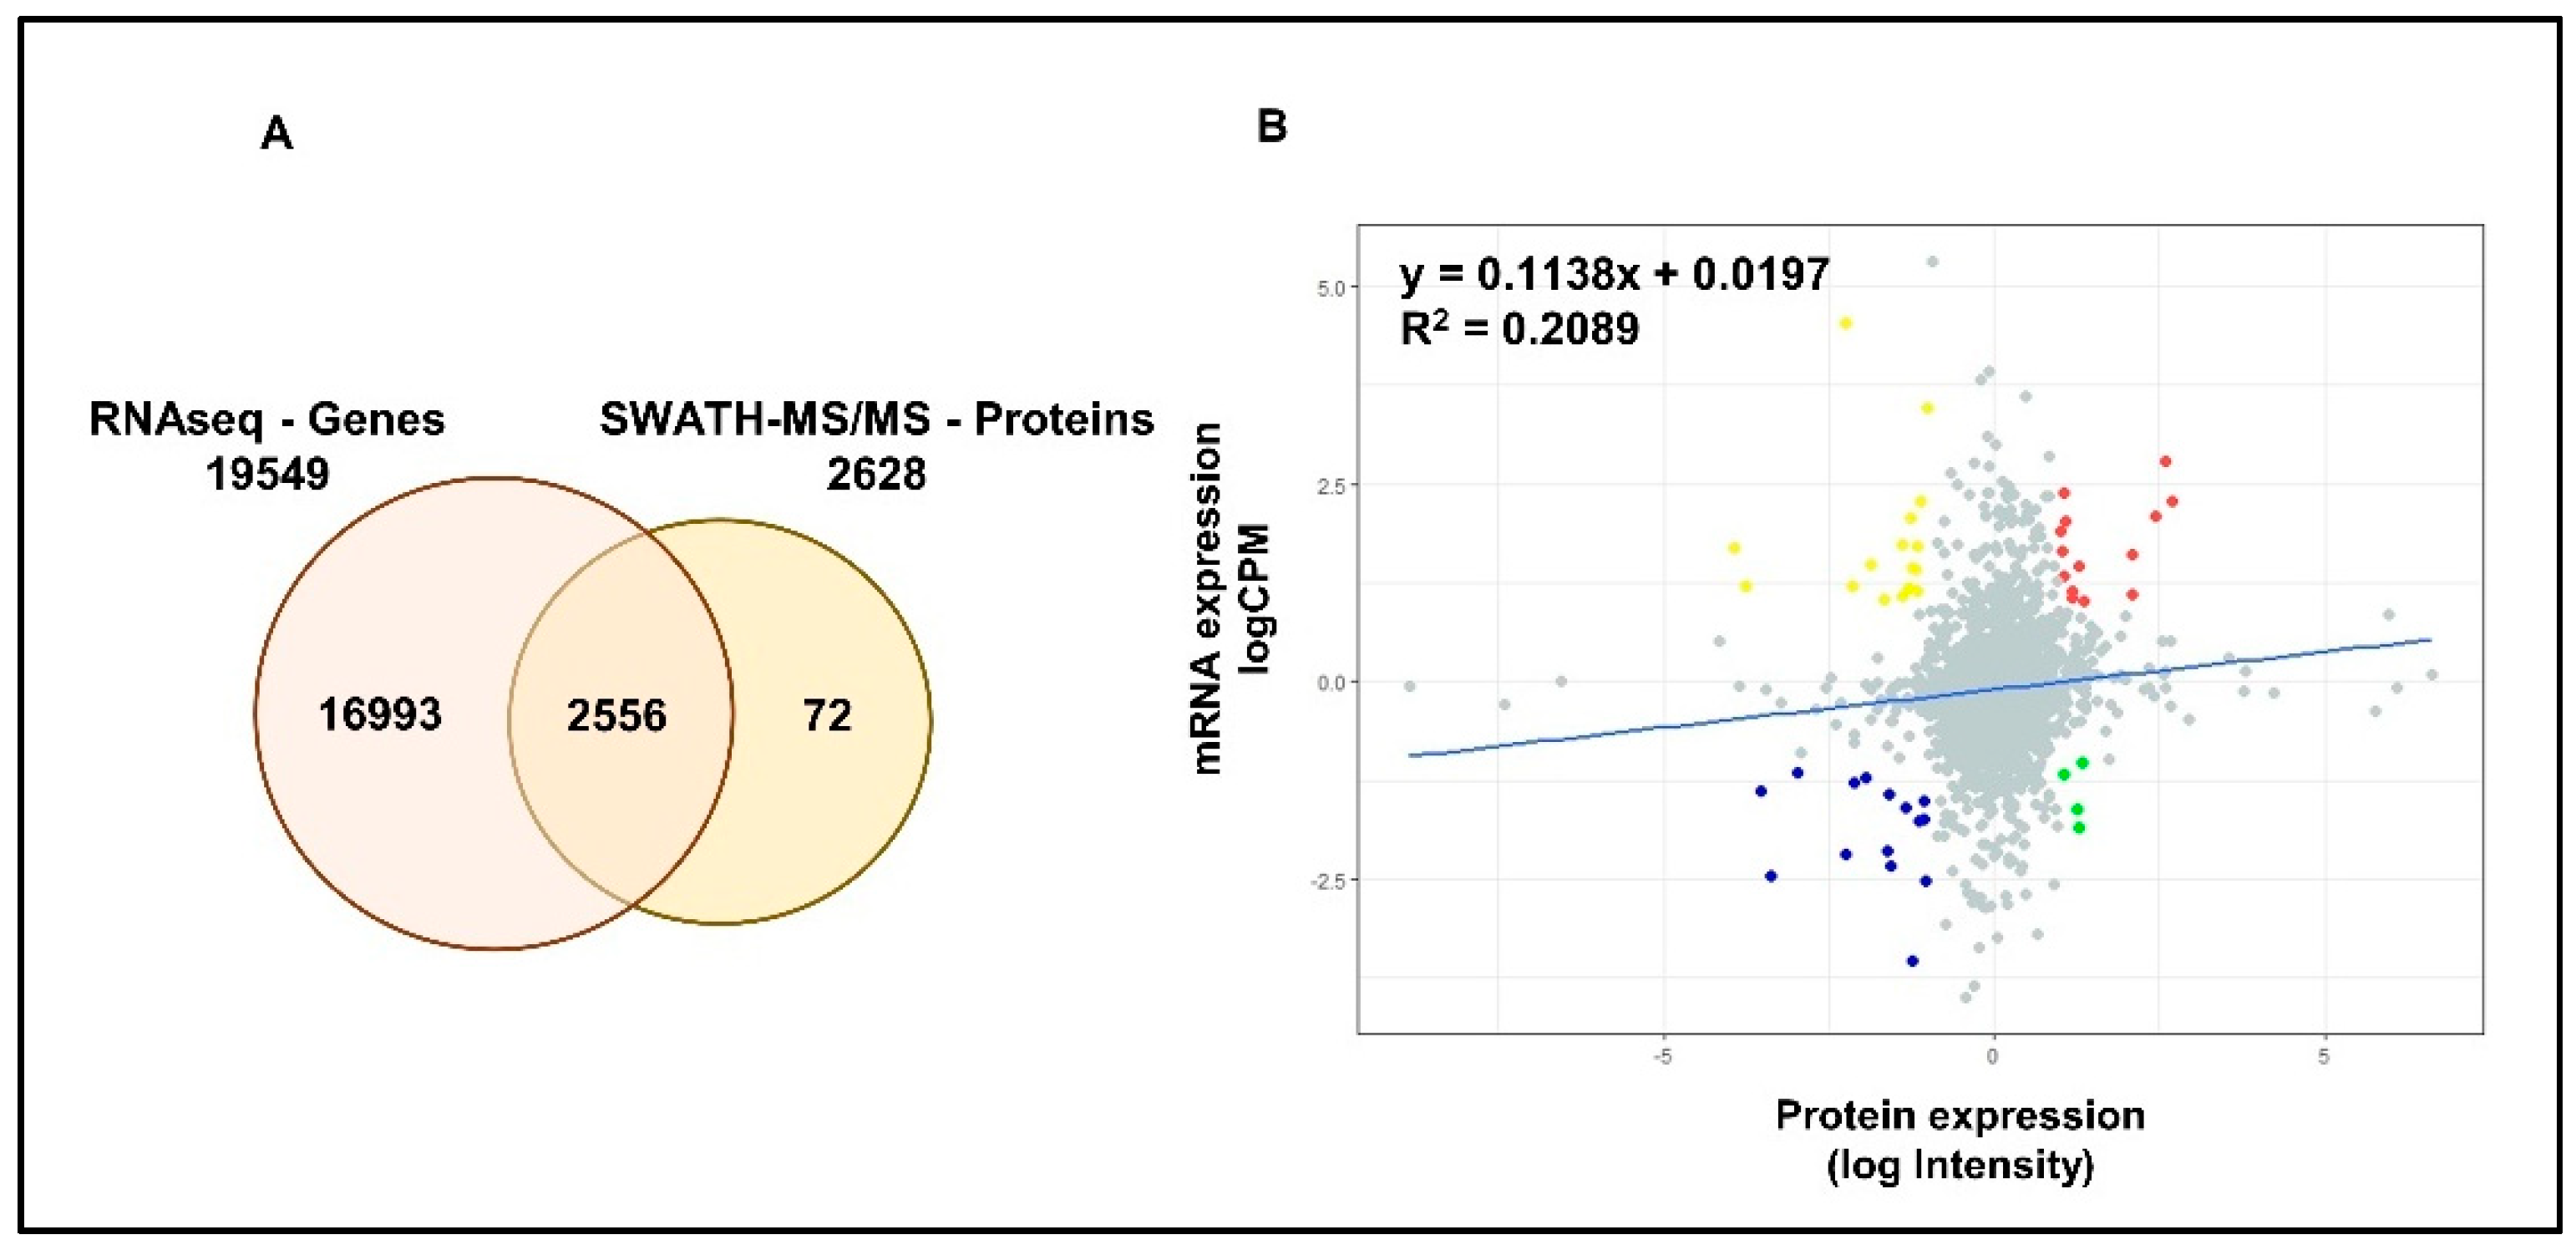
2.1. Summary of the Proteomic and Transcriptomic Profiling of PCa Cell Lines
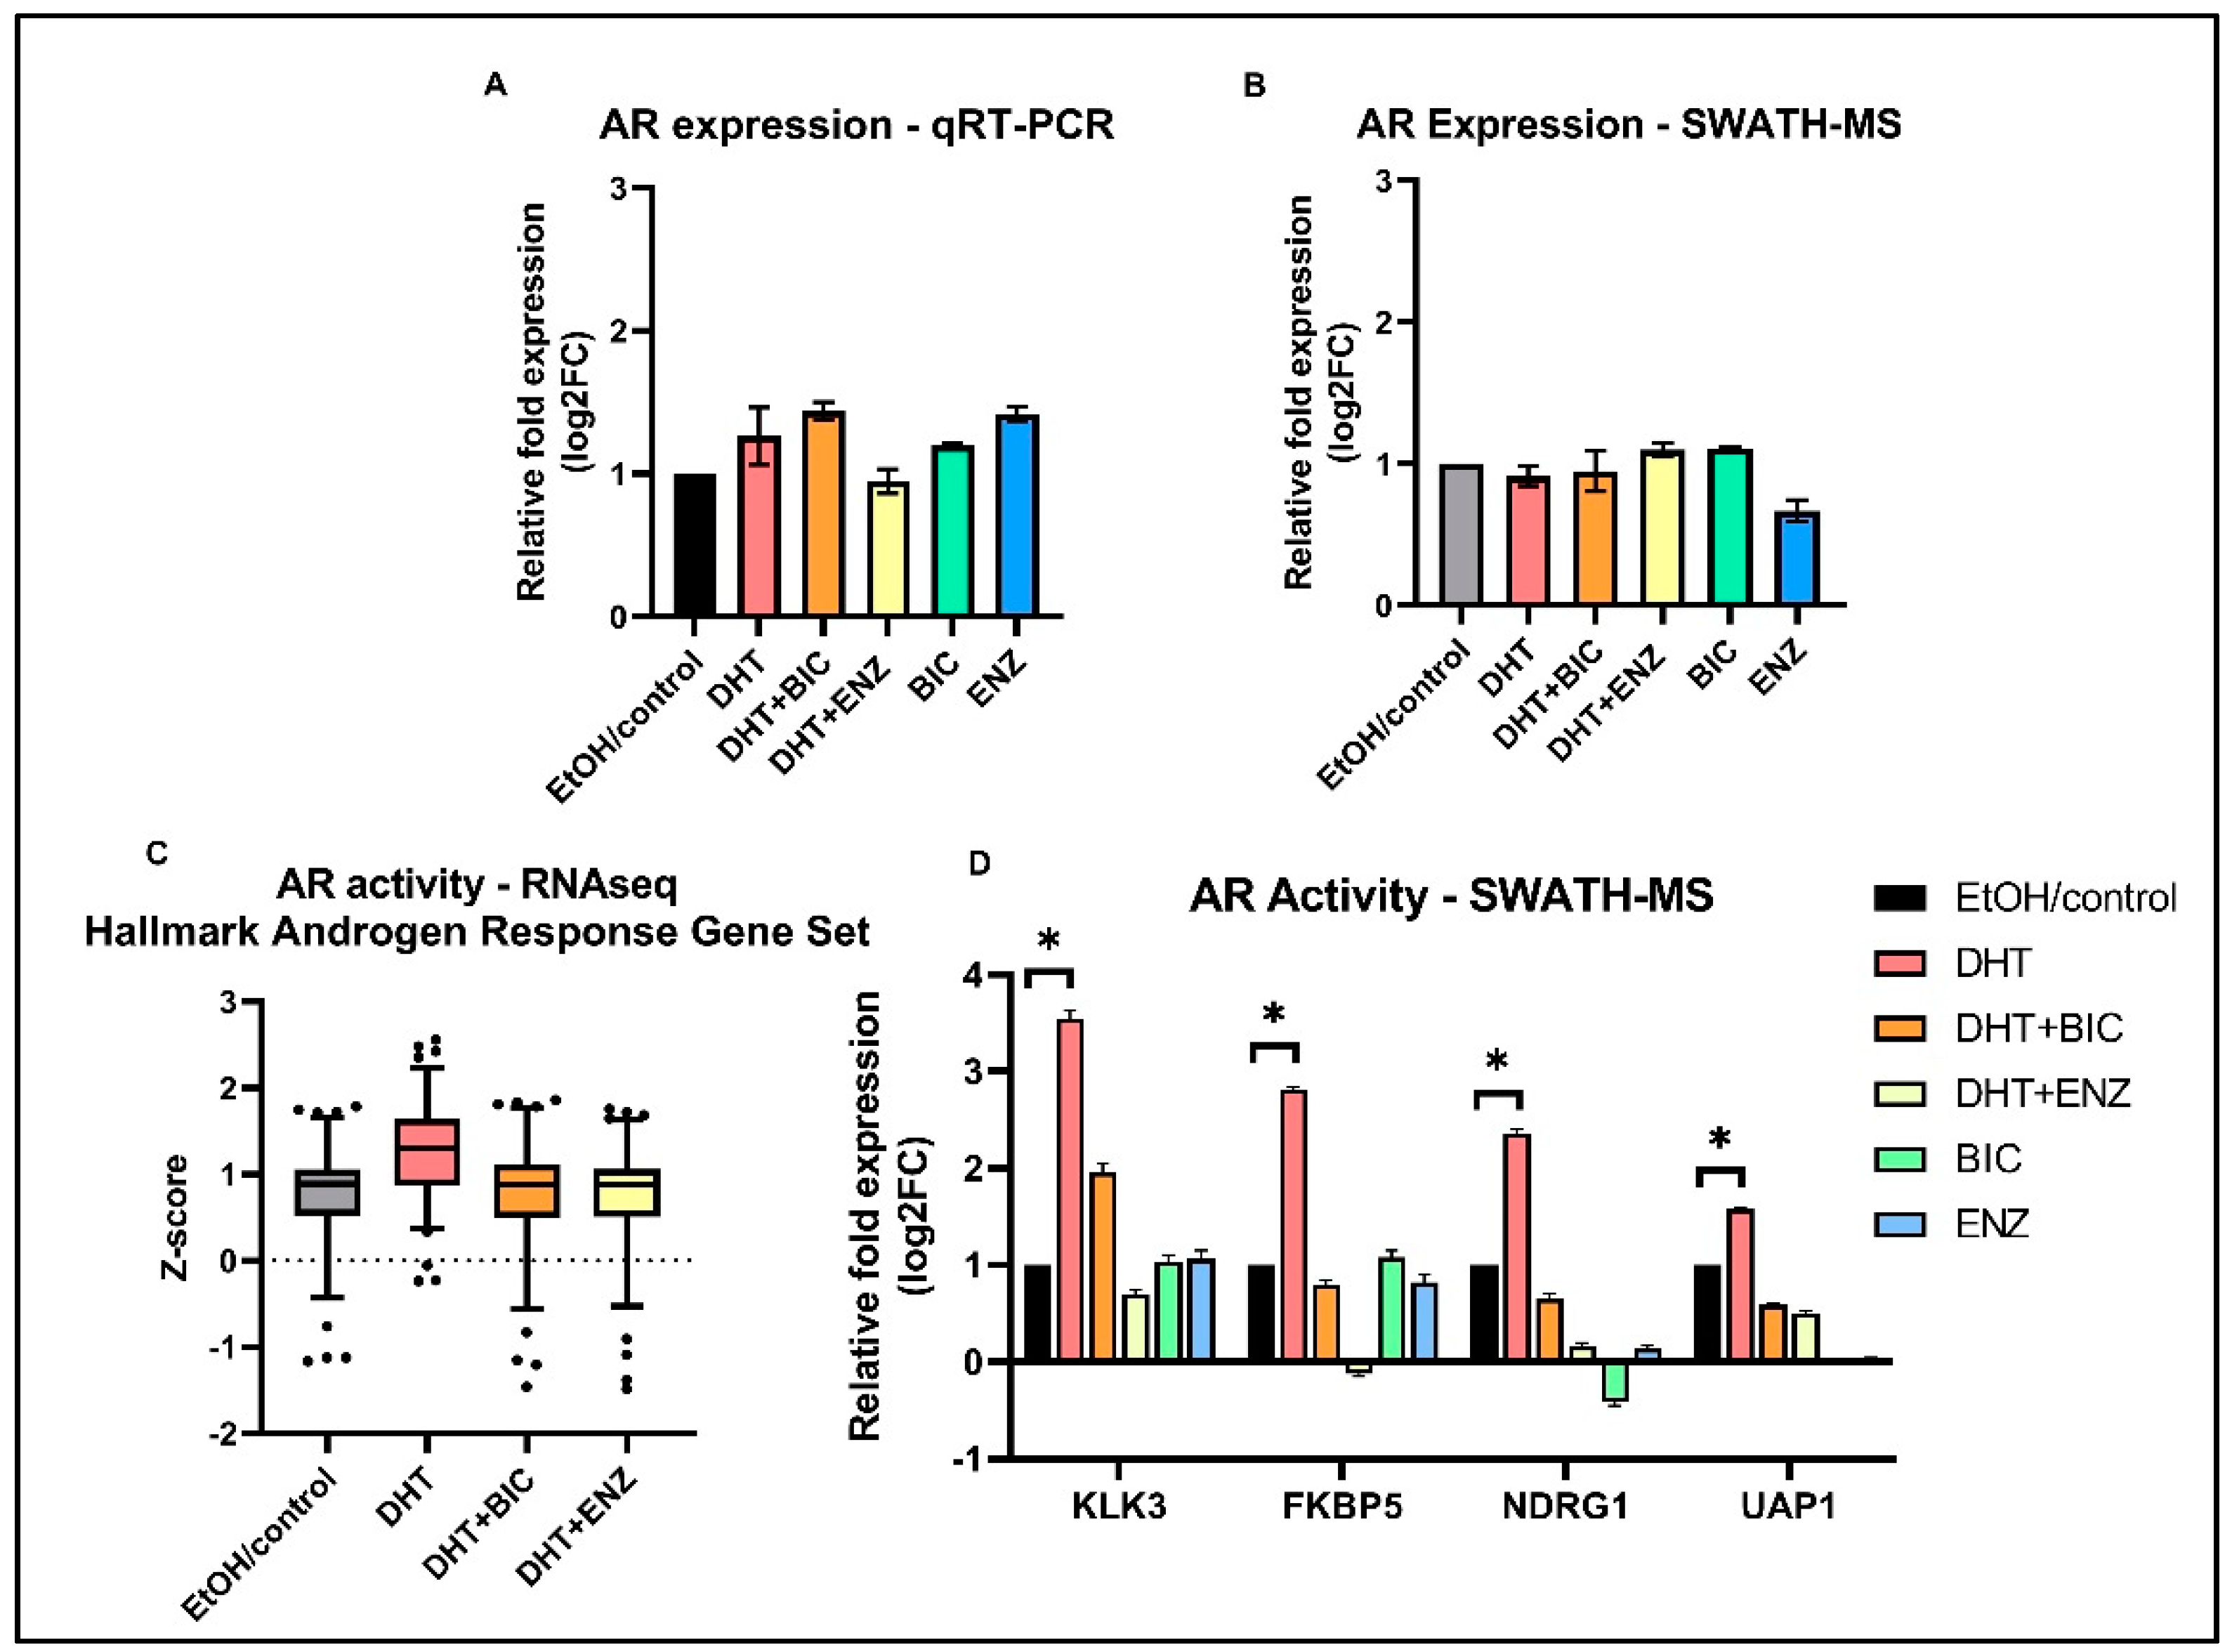
2.2. Effects on AR Signaling during Anti-Androgen Treatment
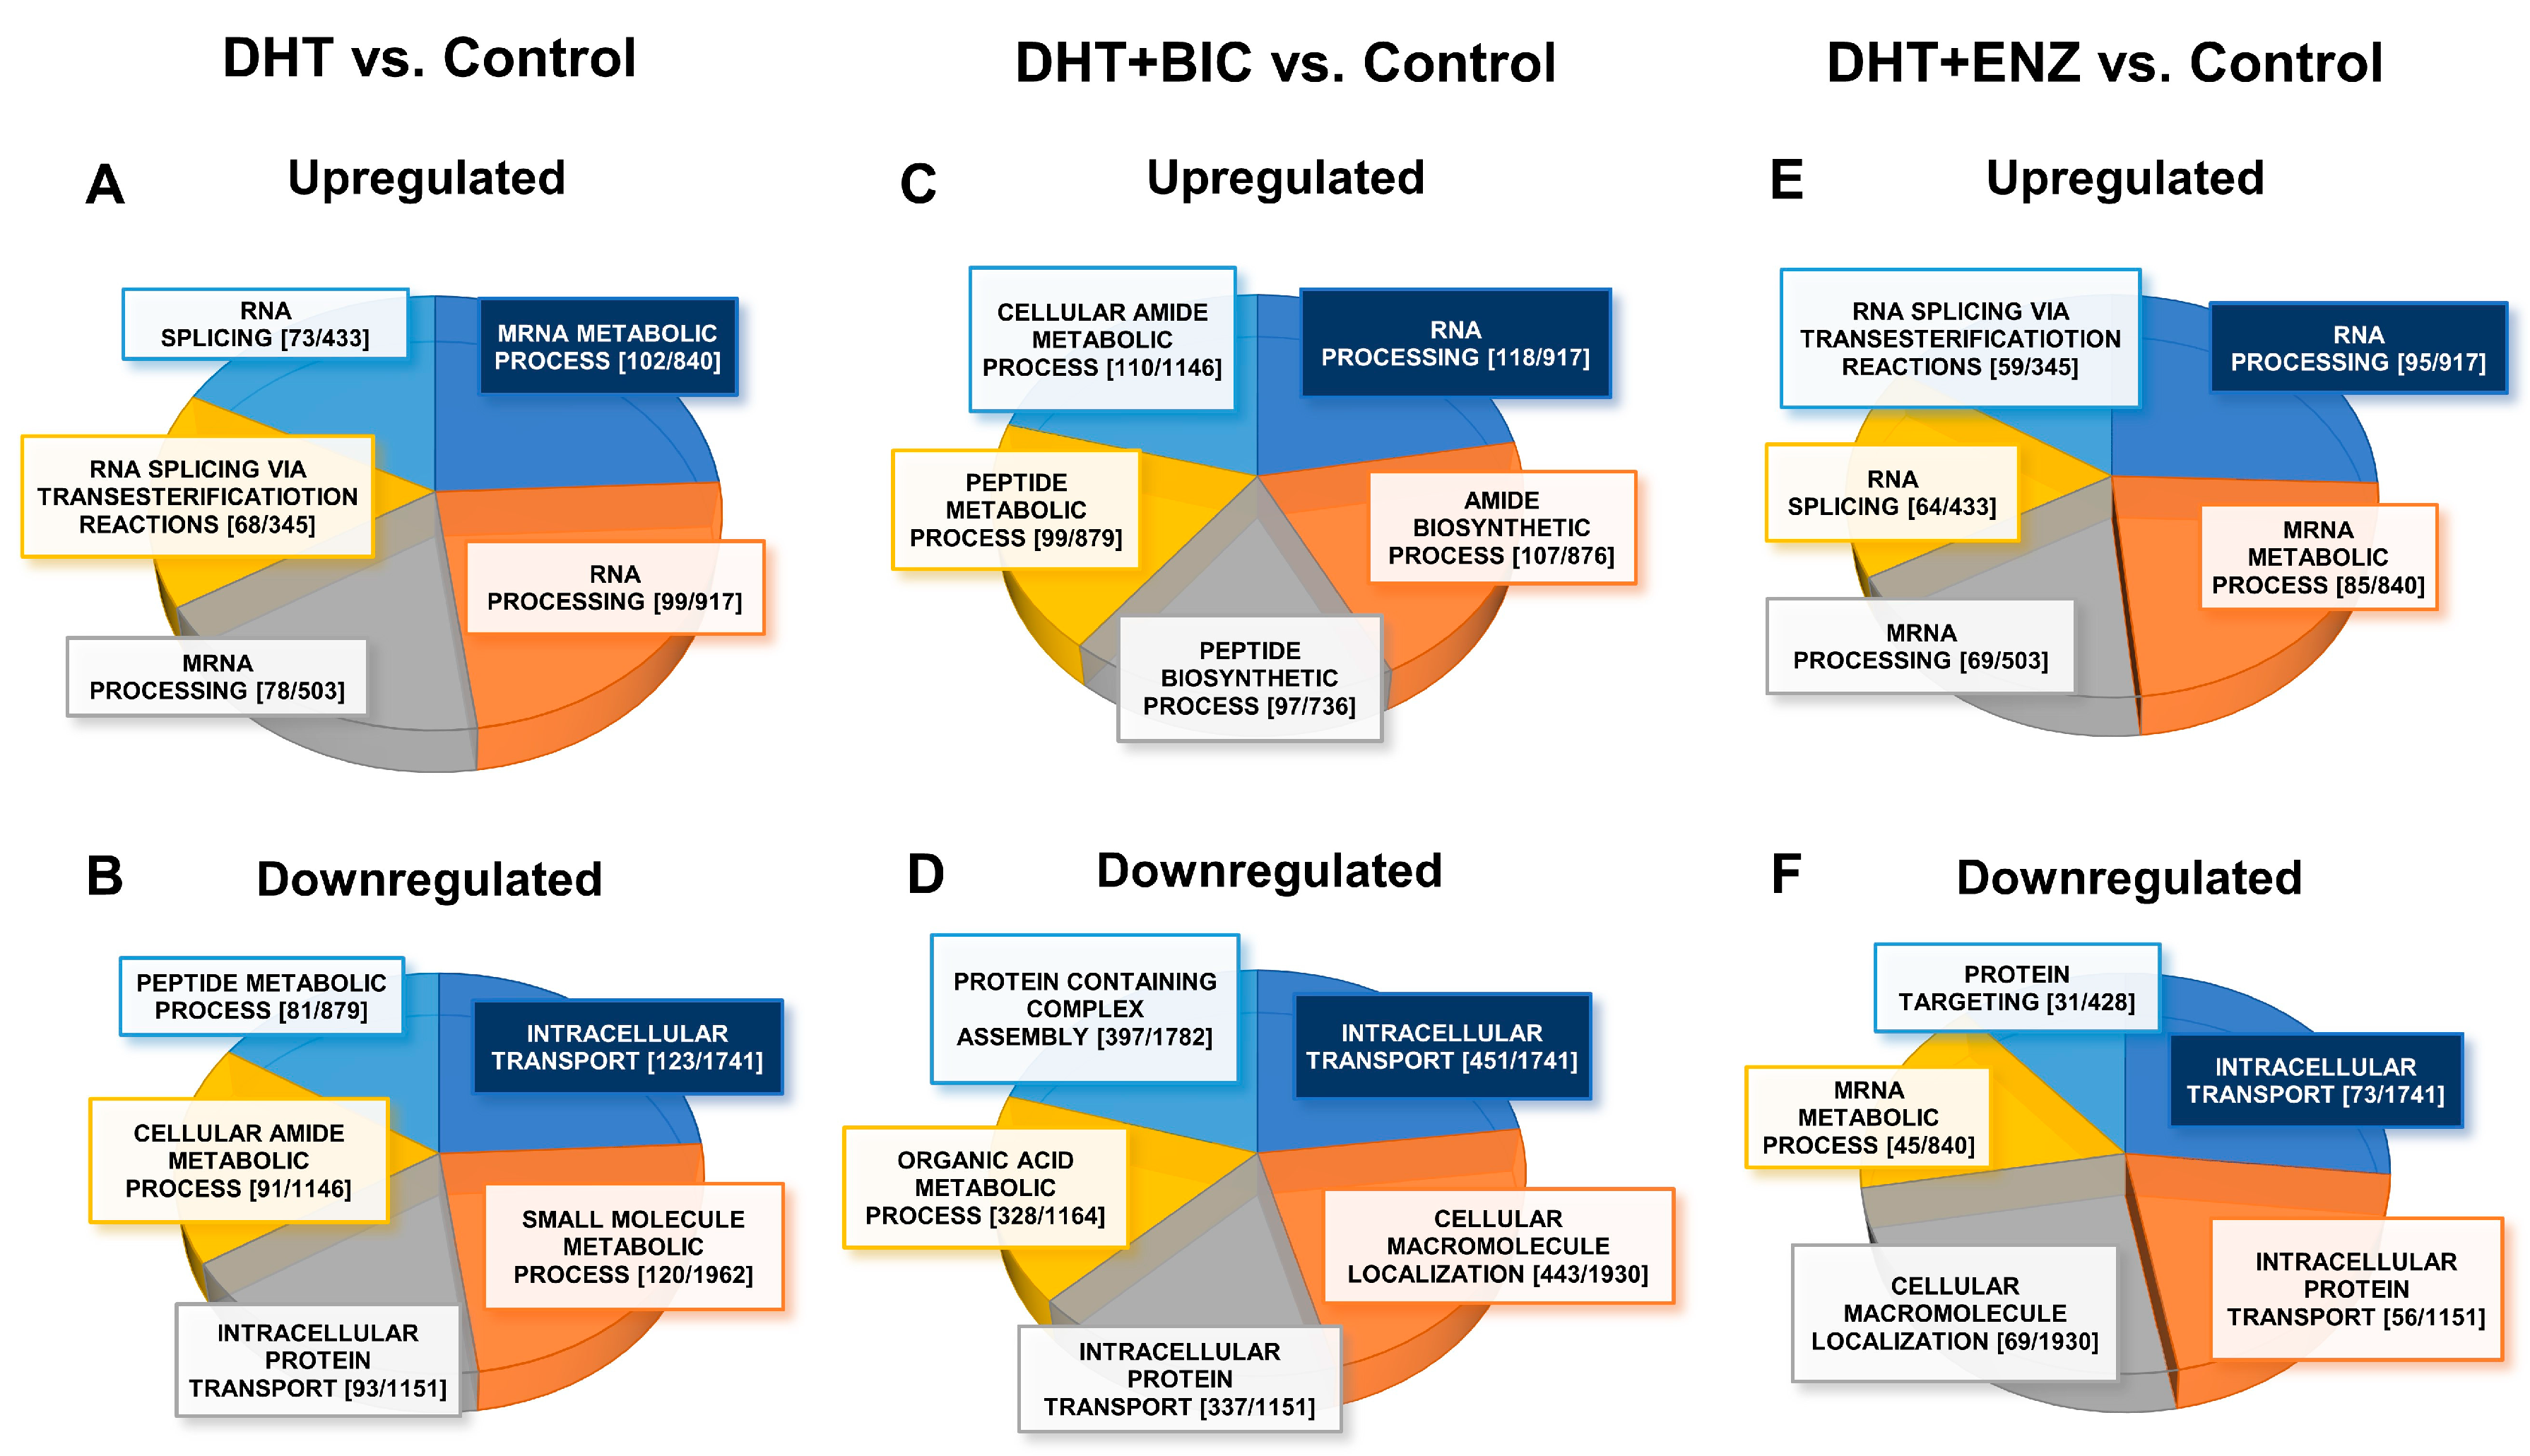
2.3. Androgen and Anti-Androgen Mediated Molecular Networks and Biological Processes in PCa Cells
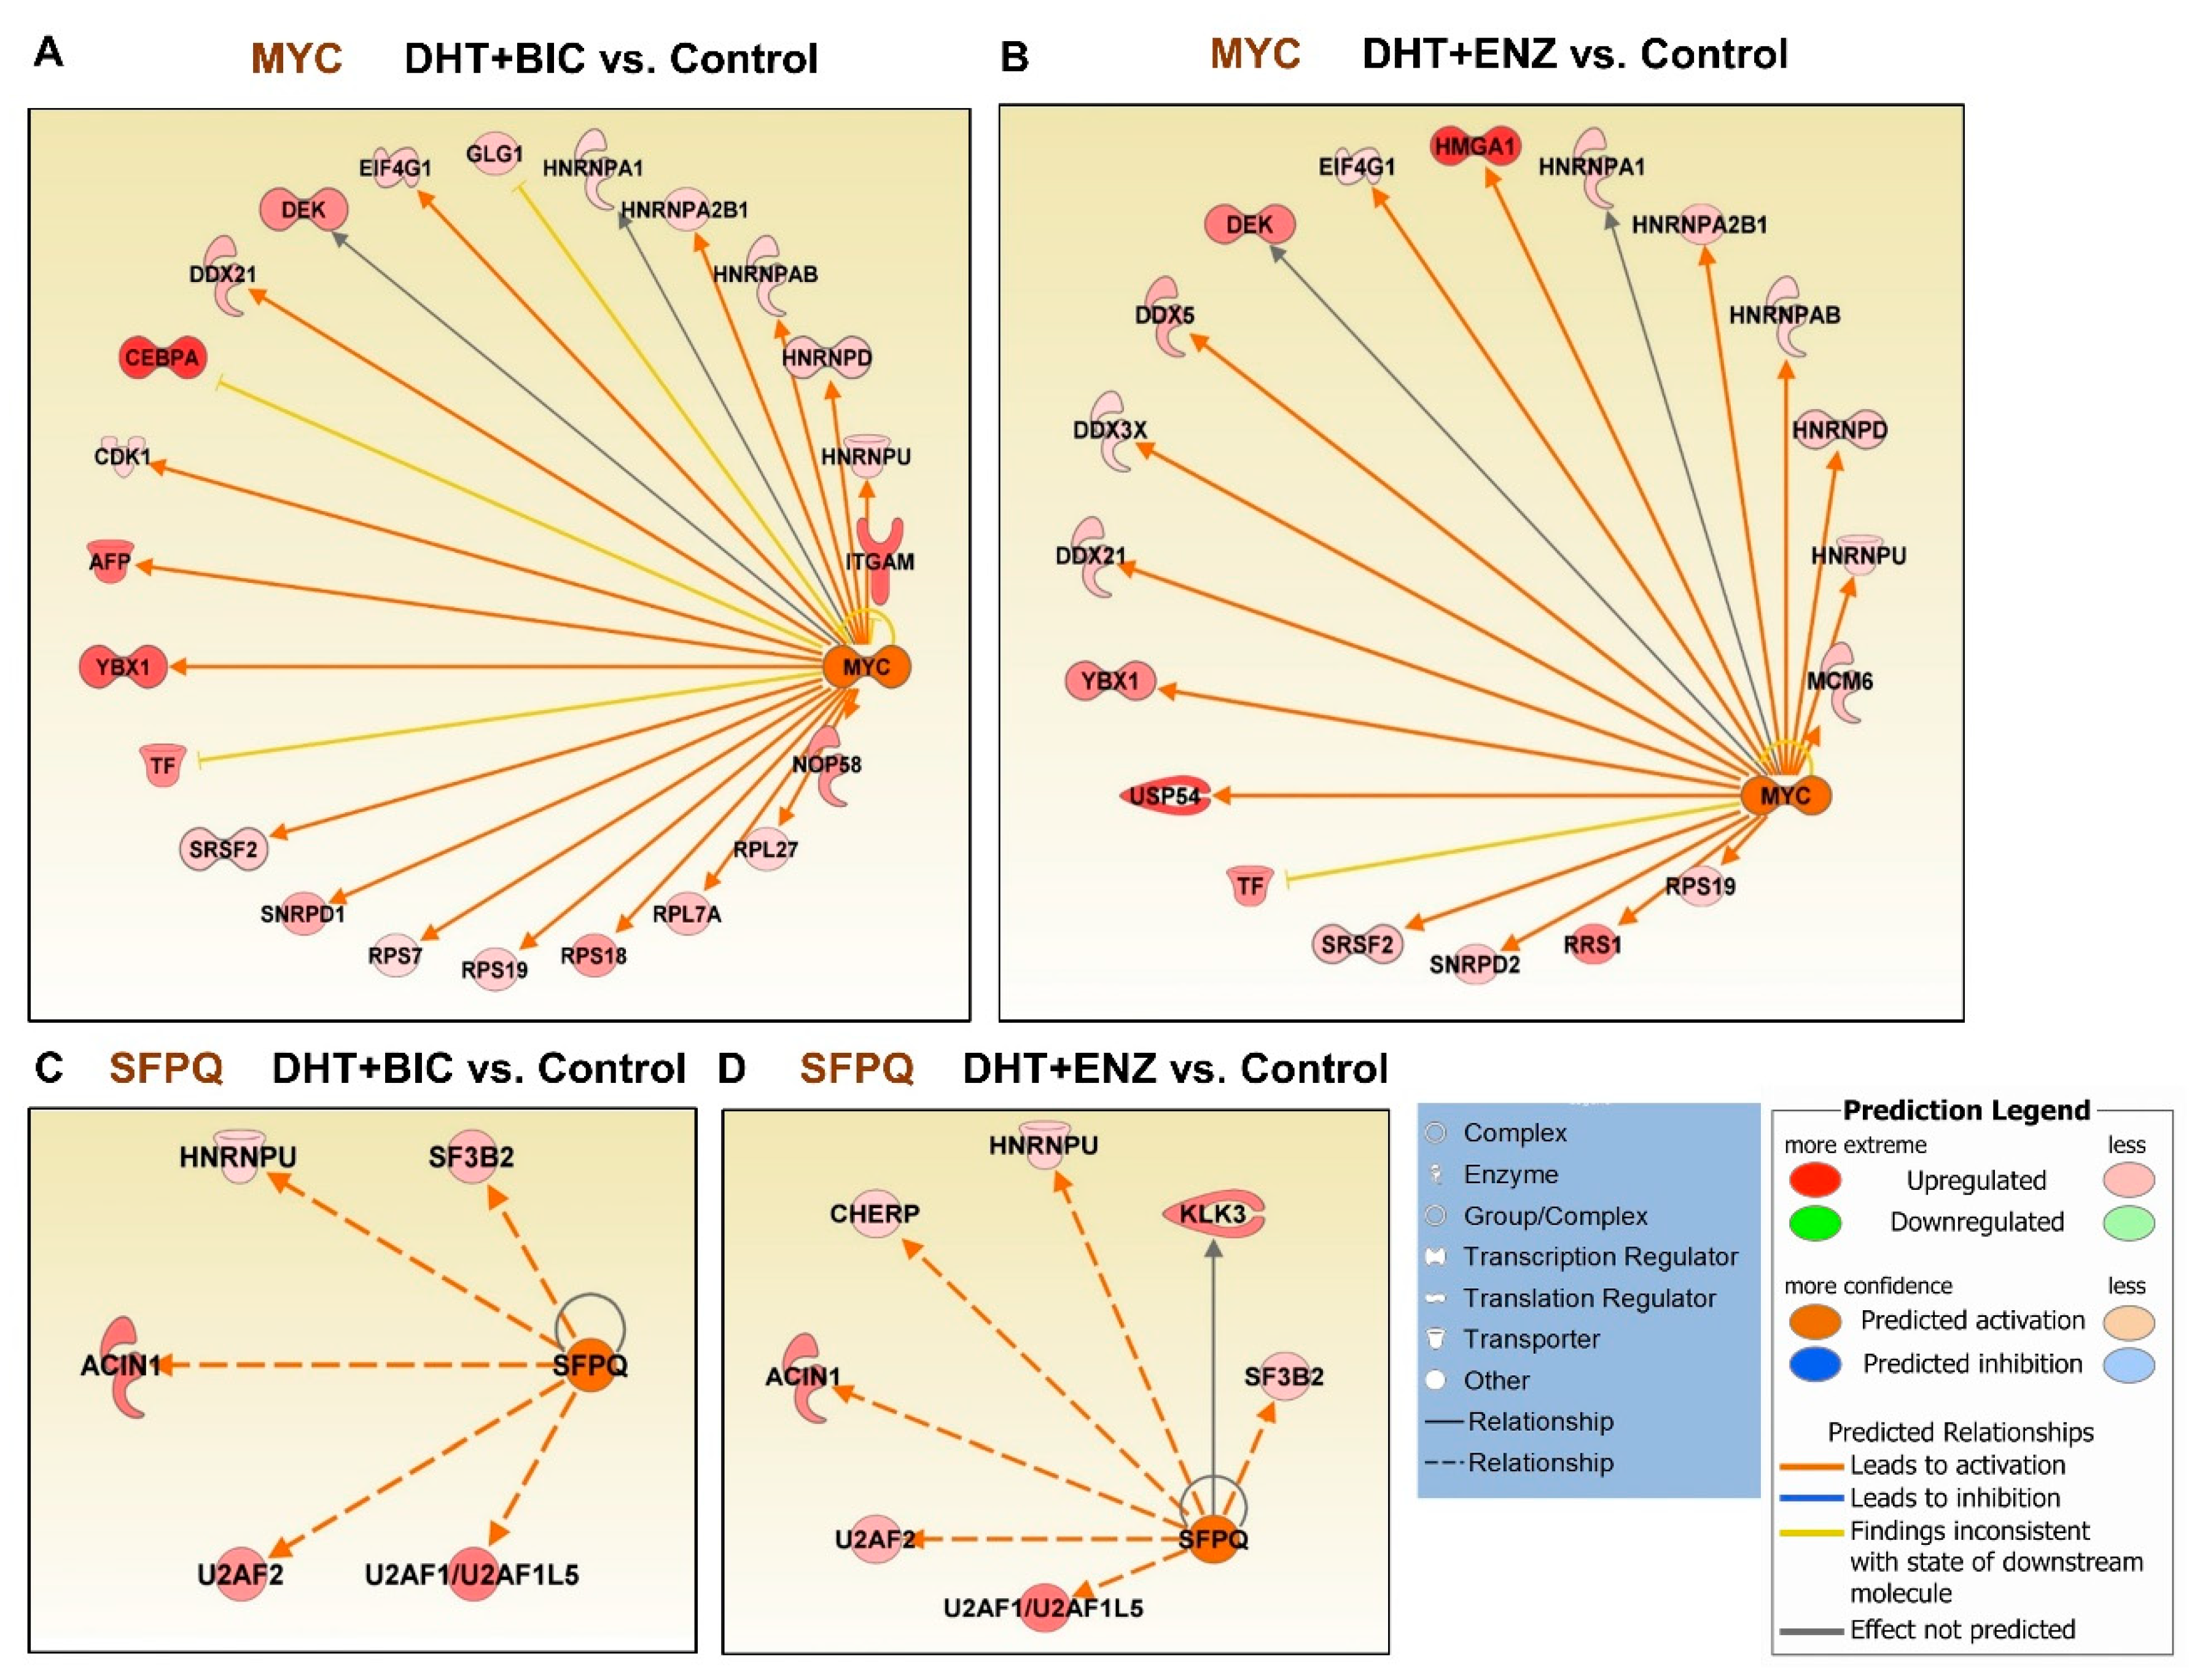
2.4. Upstream Regulators Dysregulated in Response to the Anti-Androgen Treatment
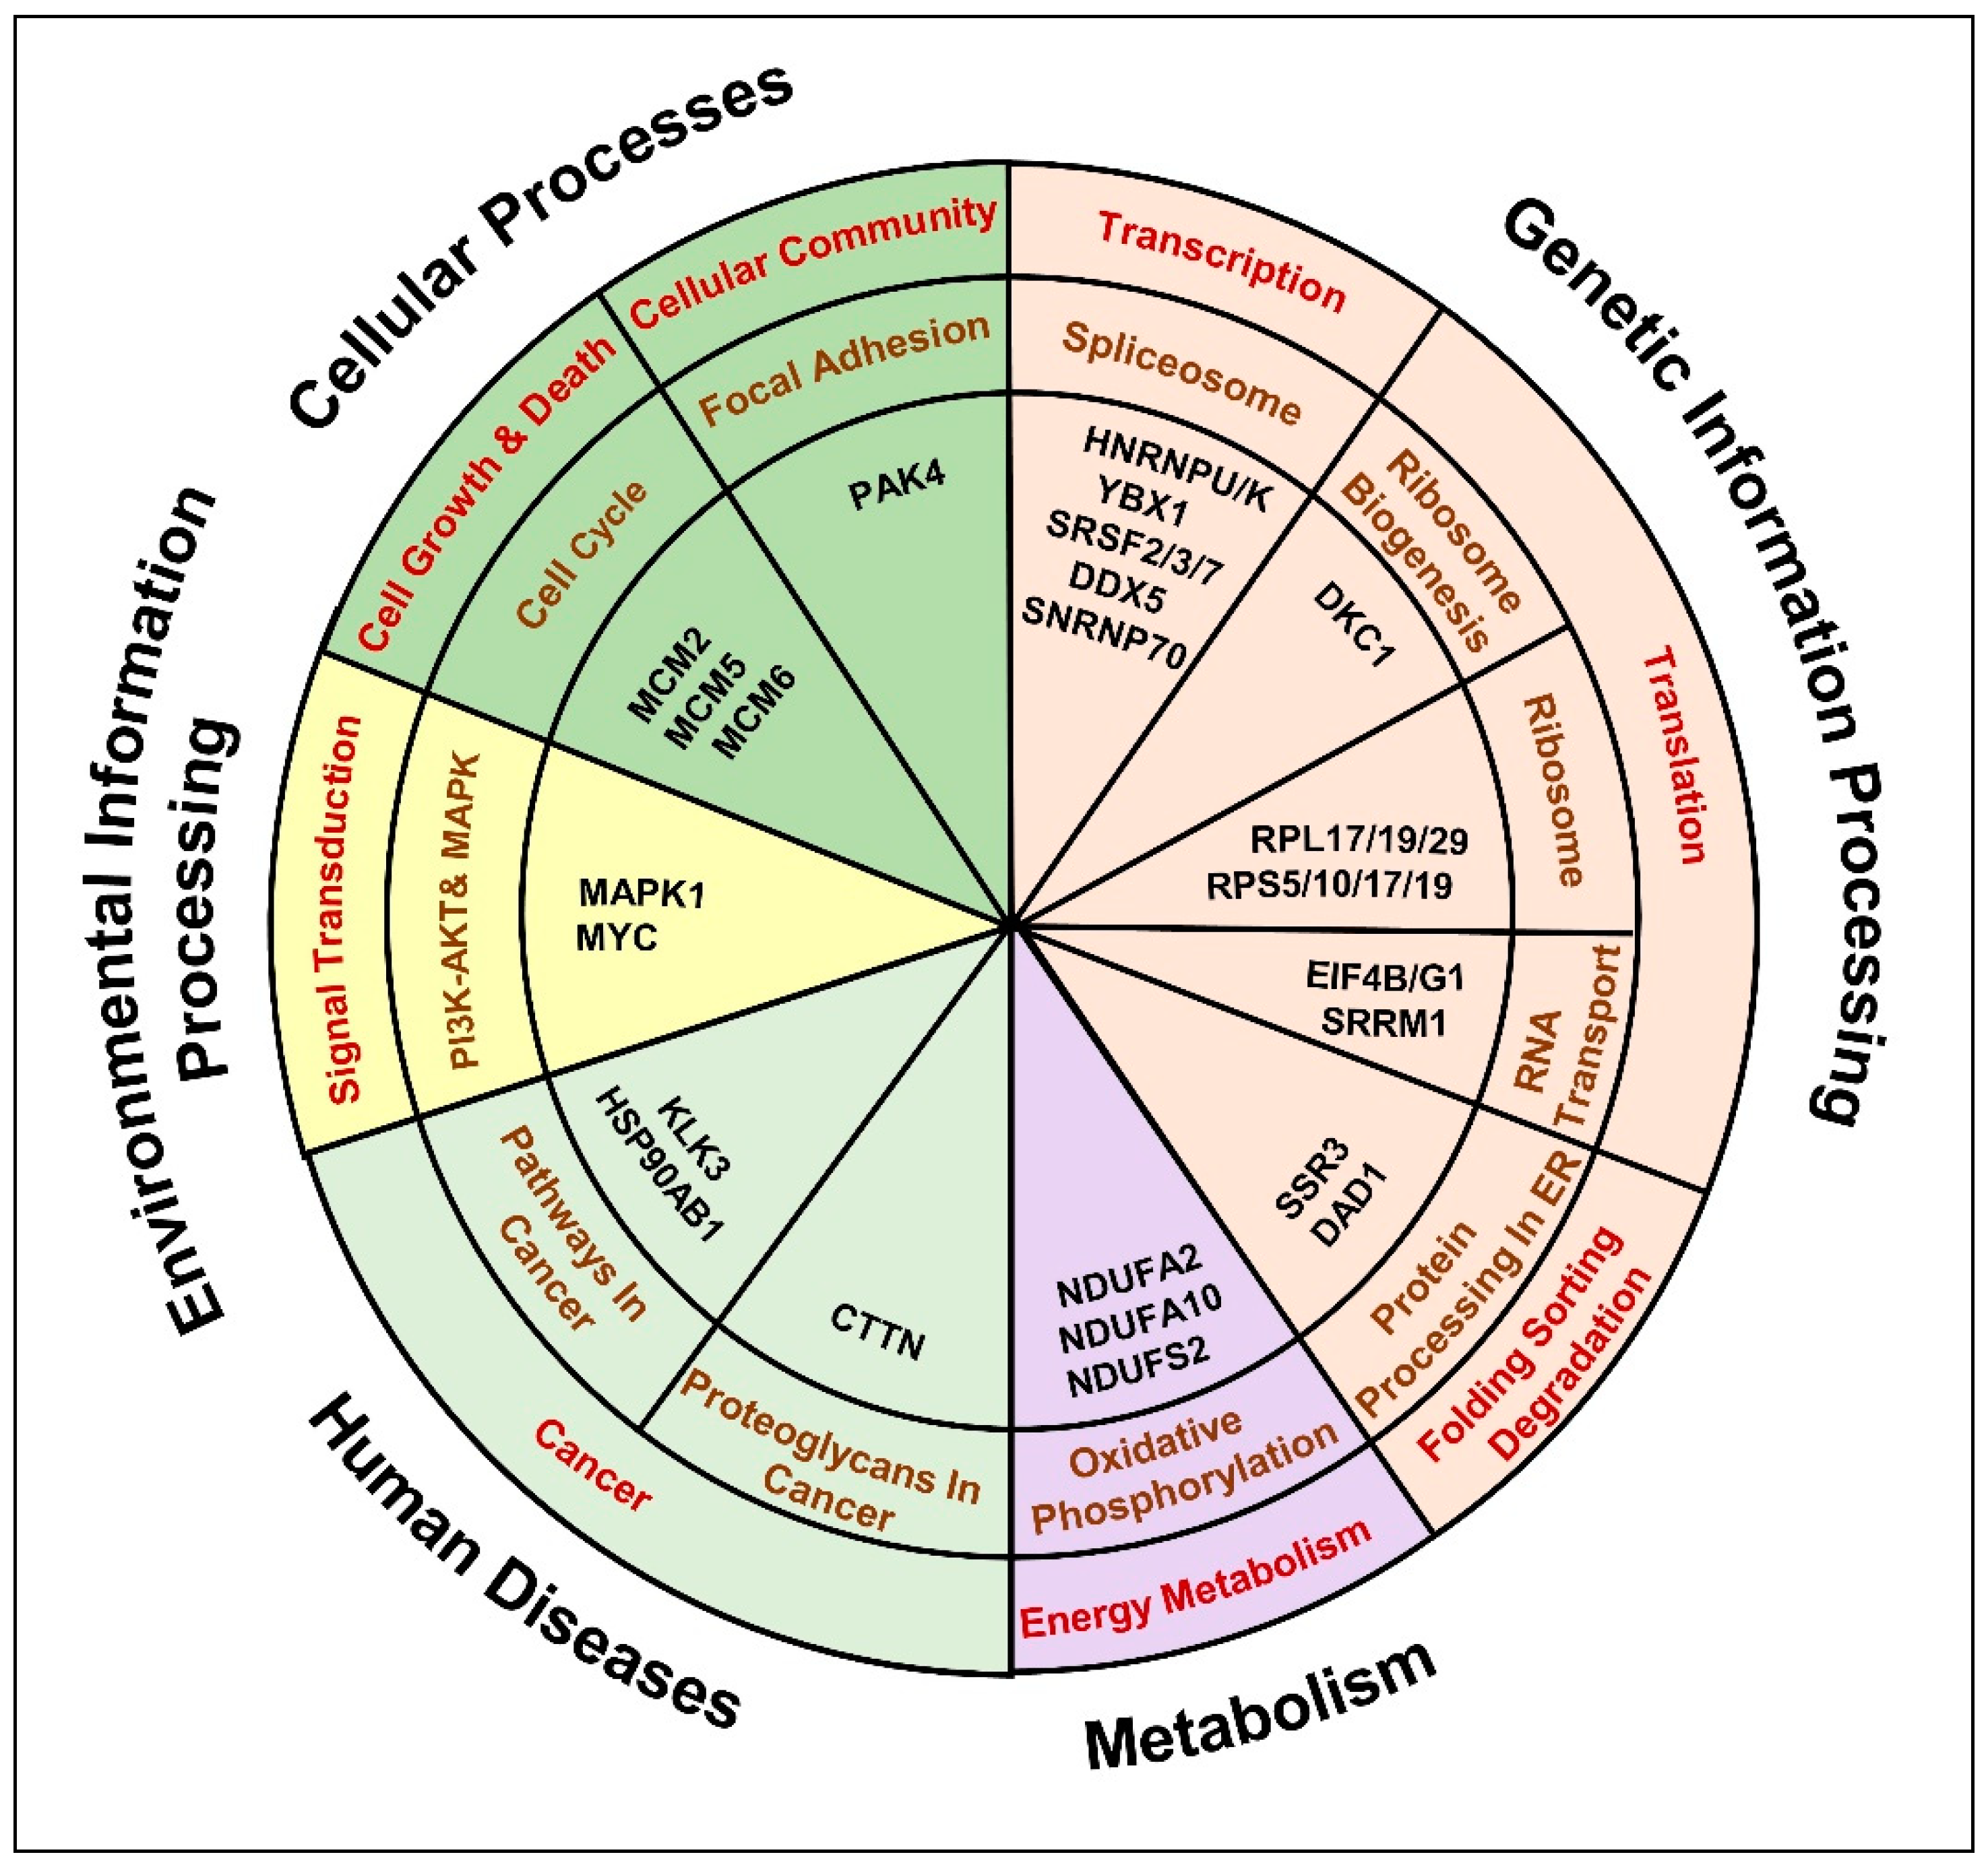
2.5. Anti-Androgen Induced Molecular Pathways That Denote the Metastatic Androgen Independent PCa Phenotype
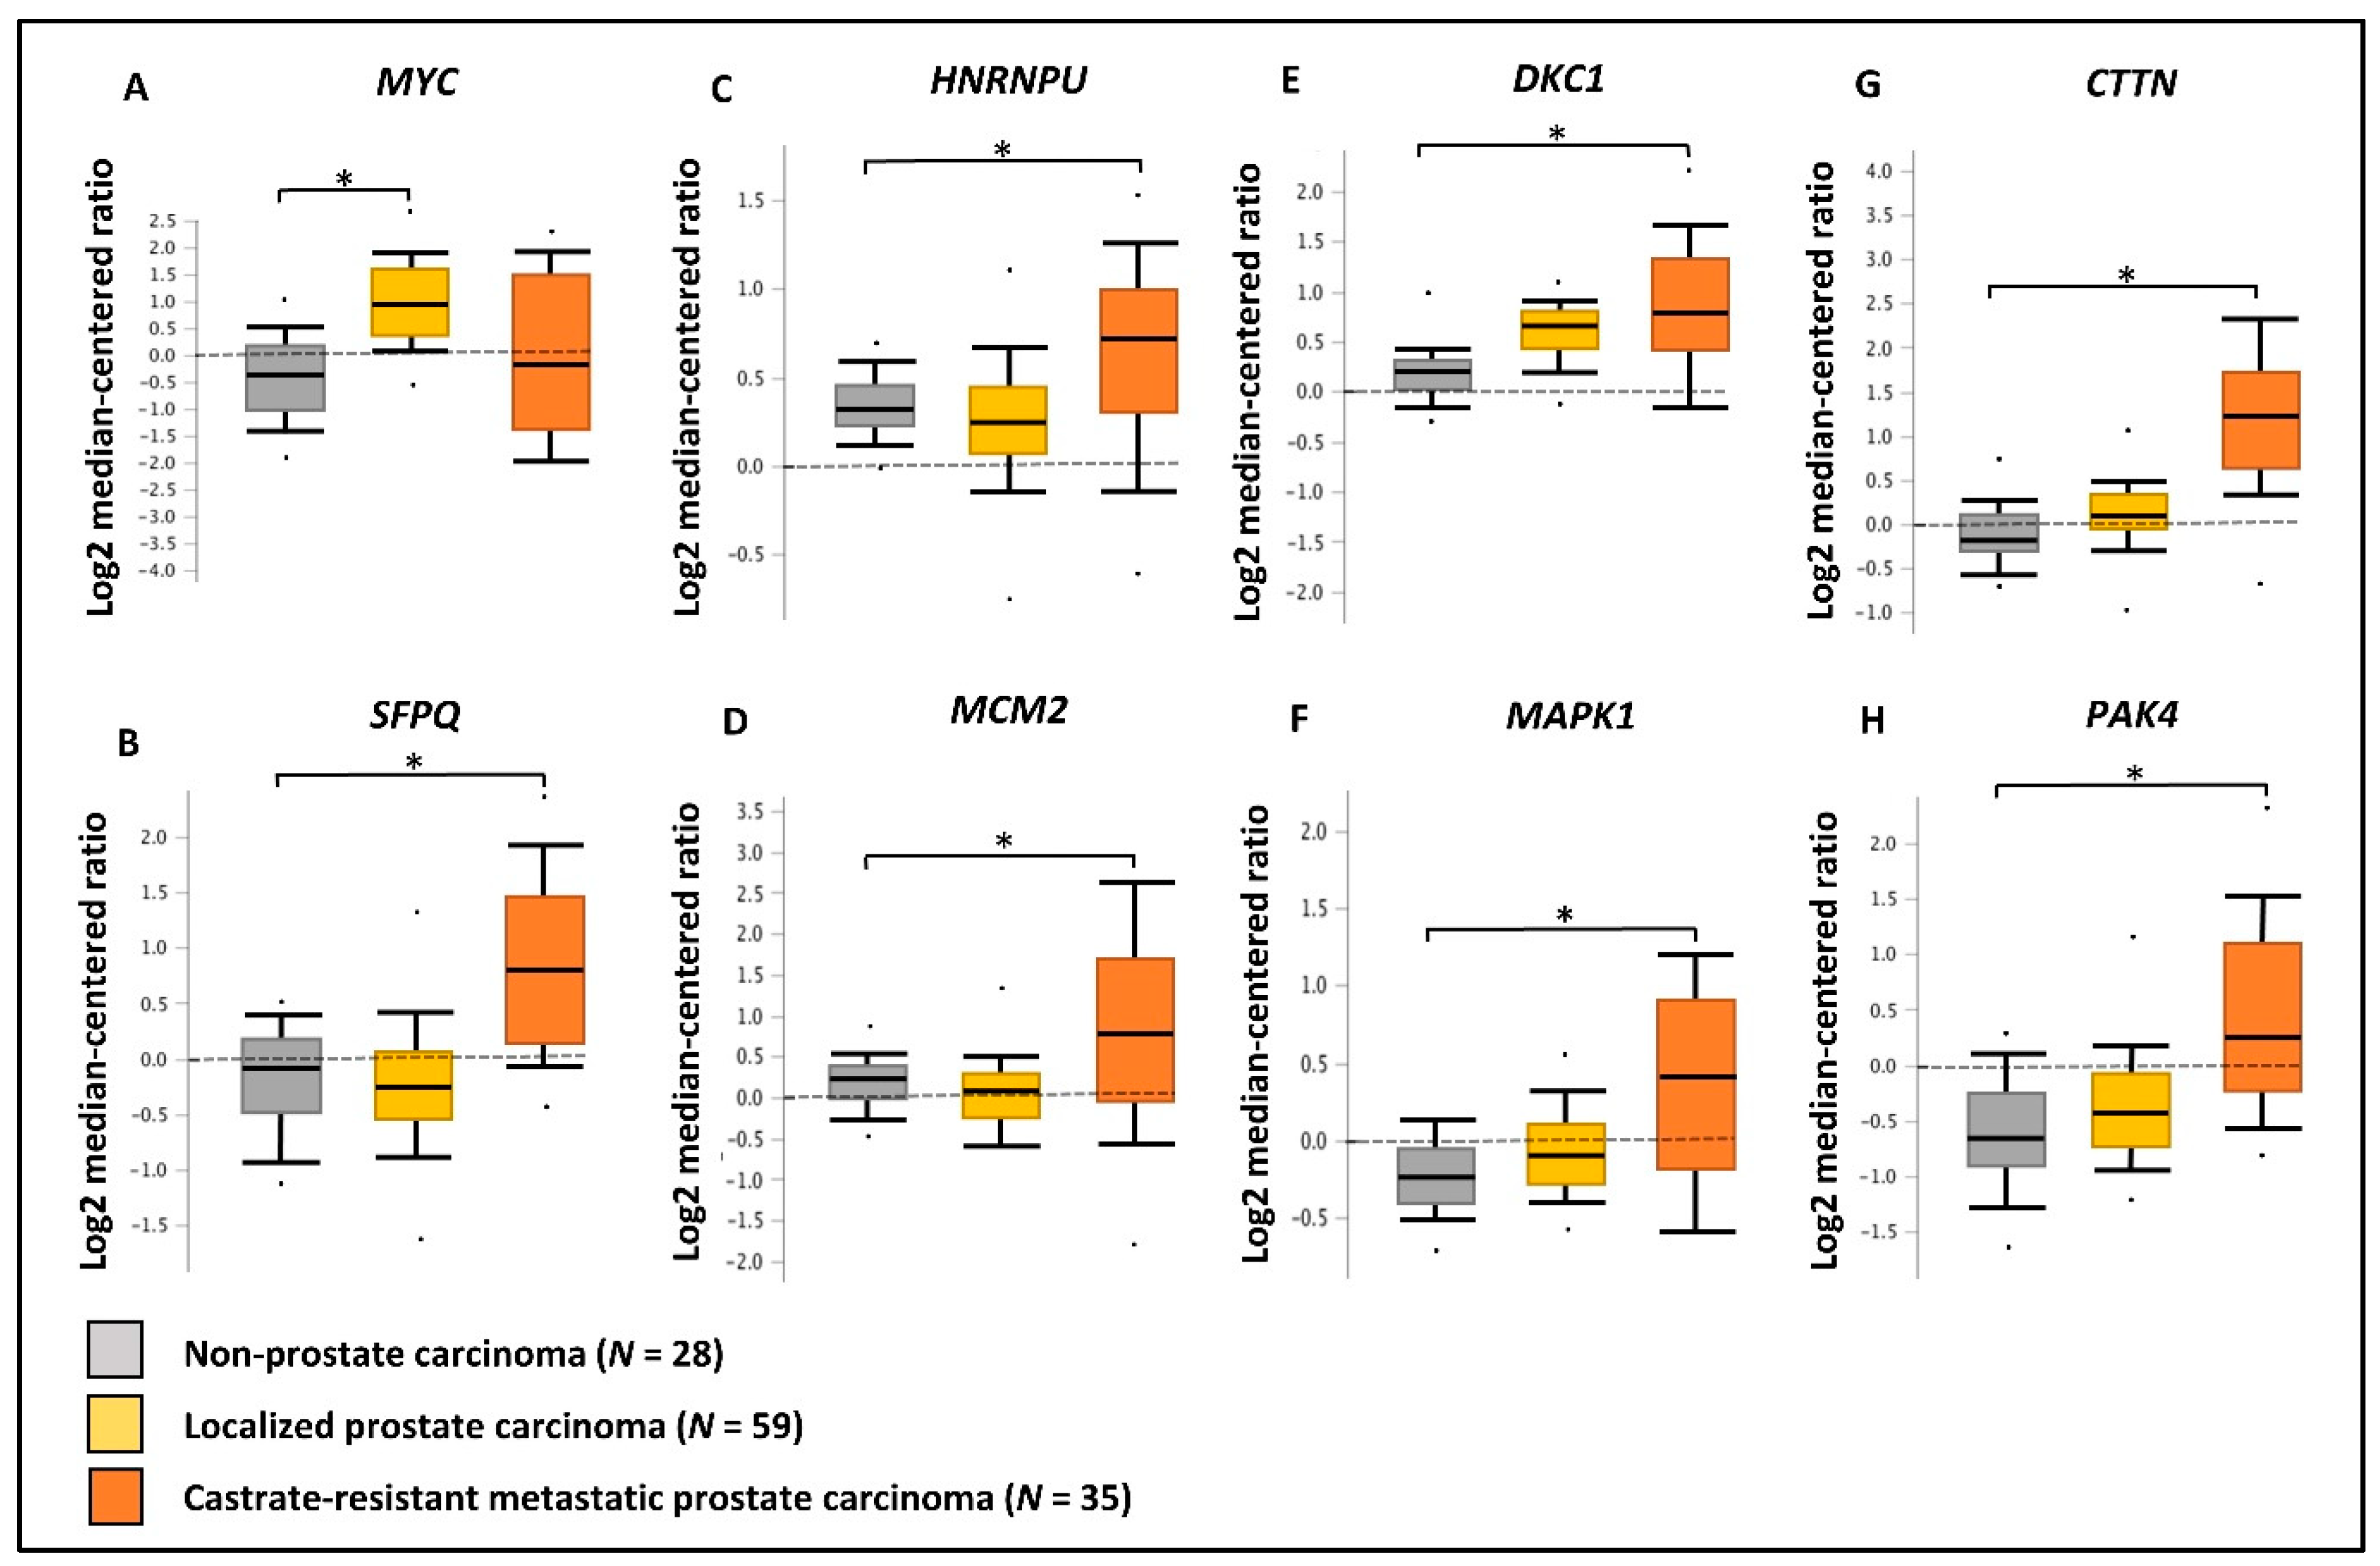
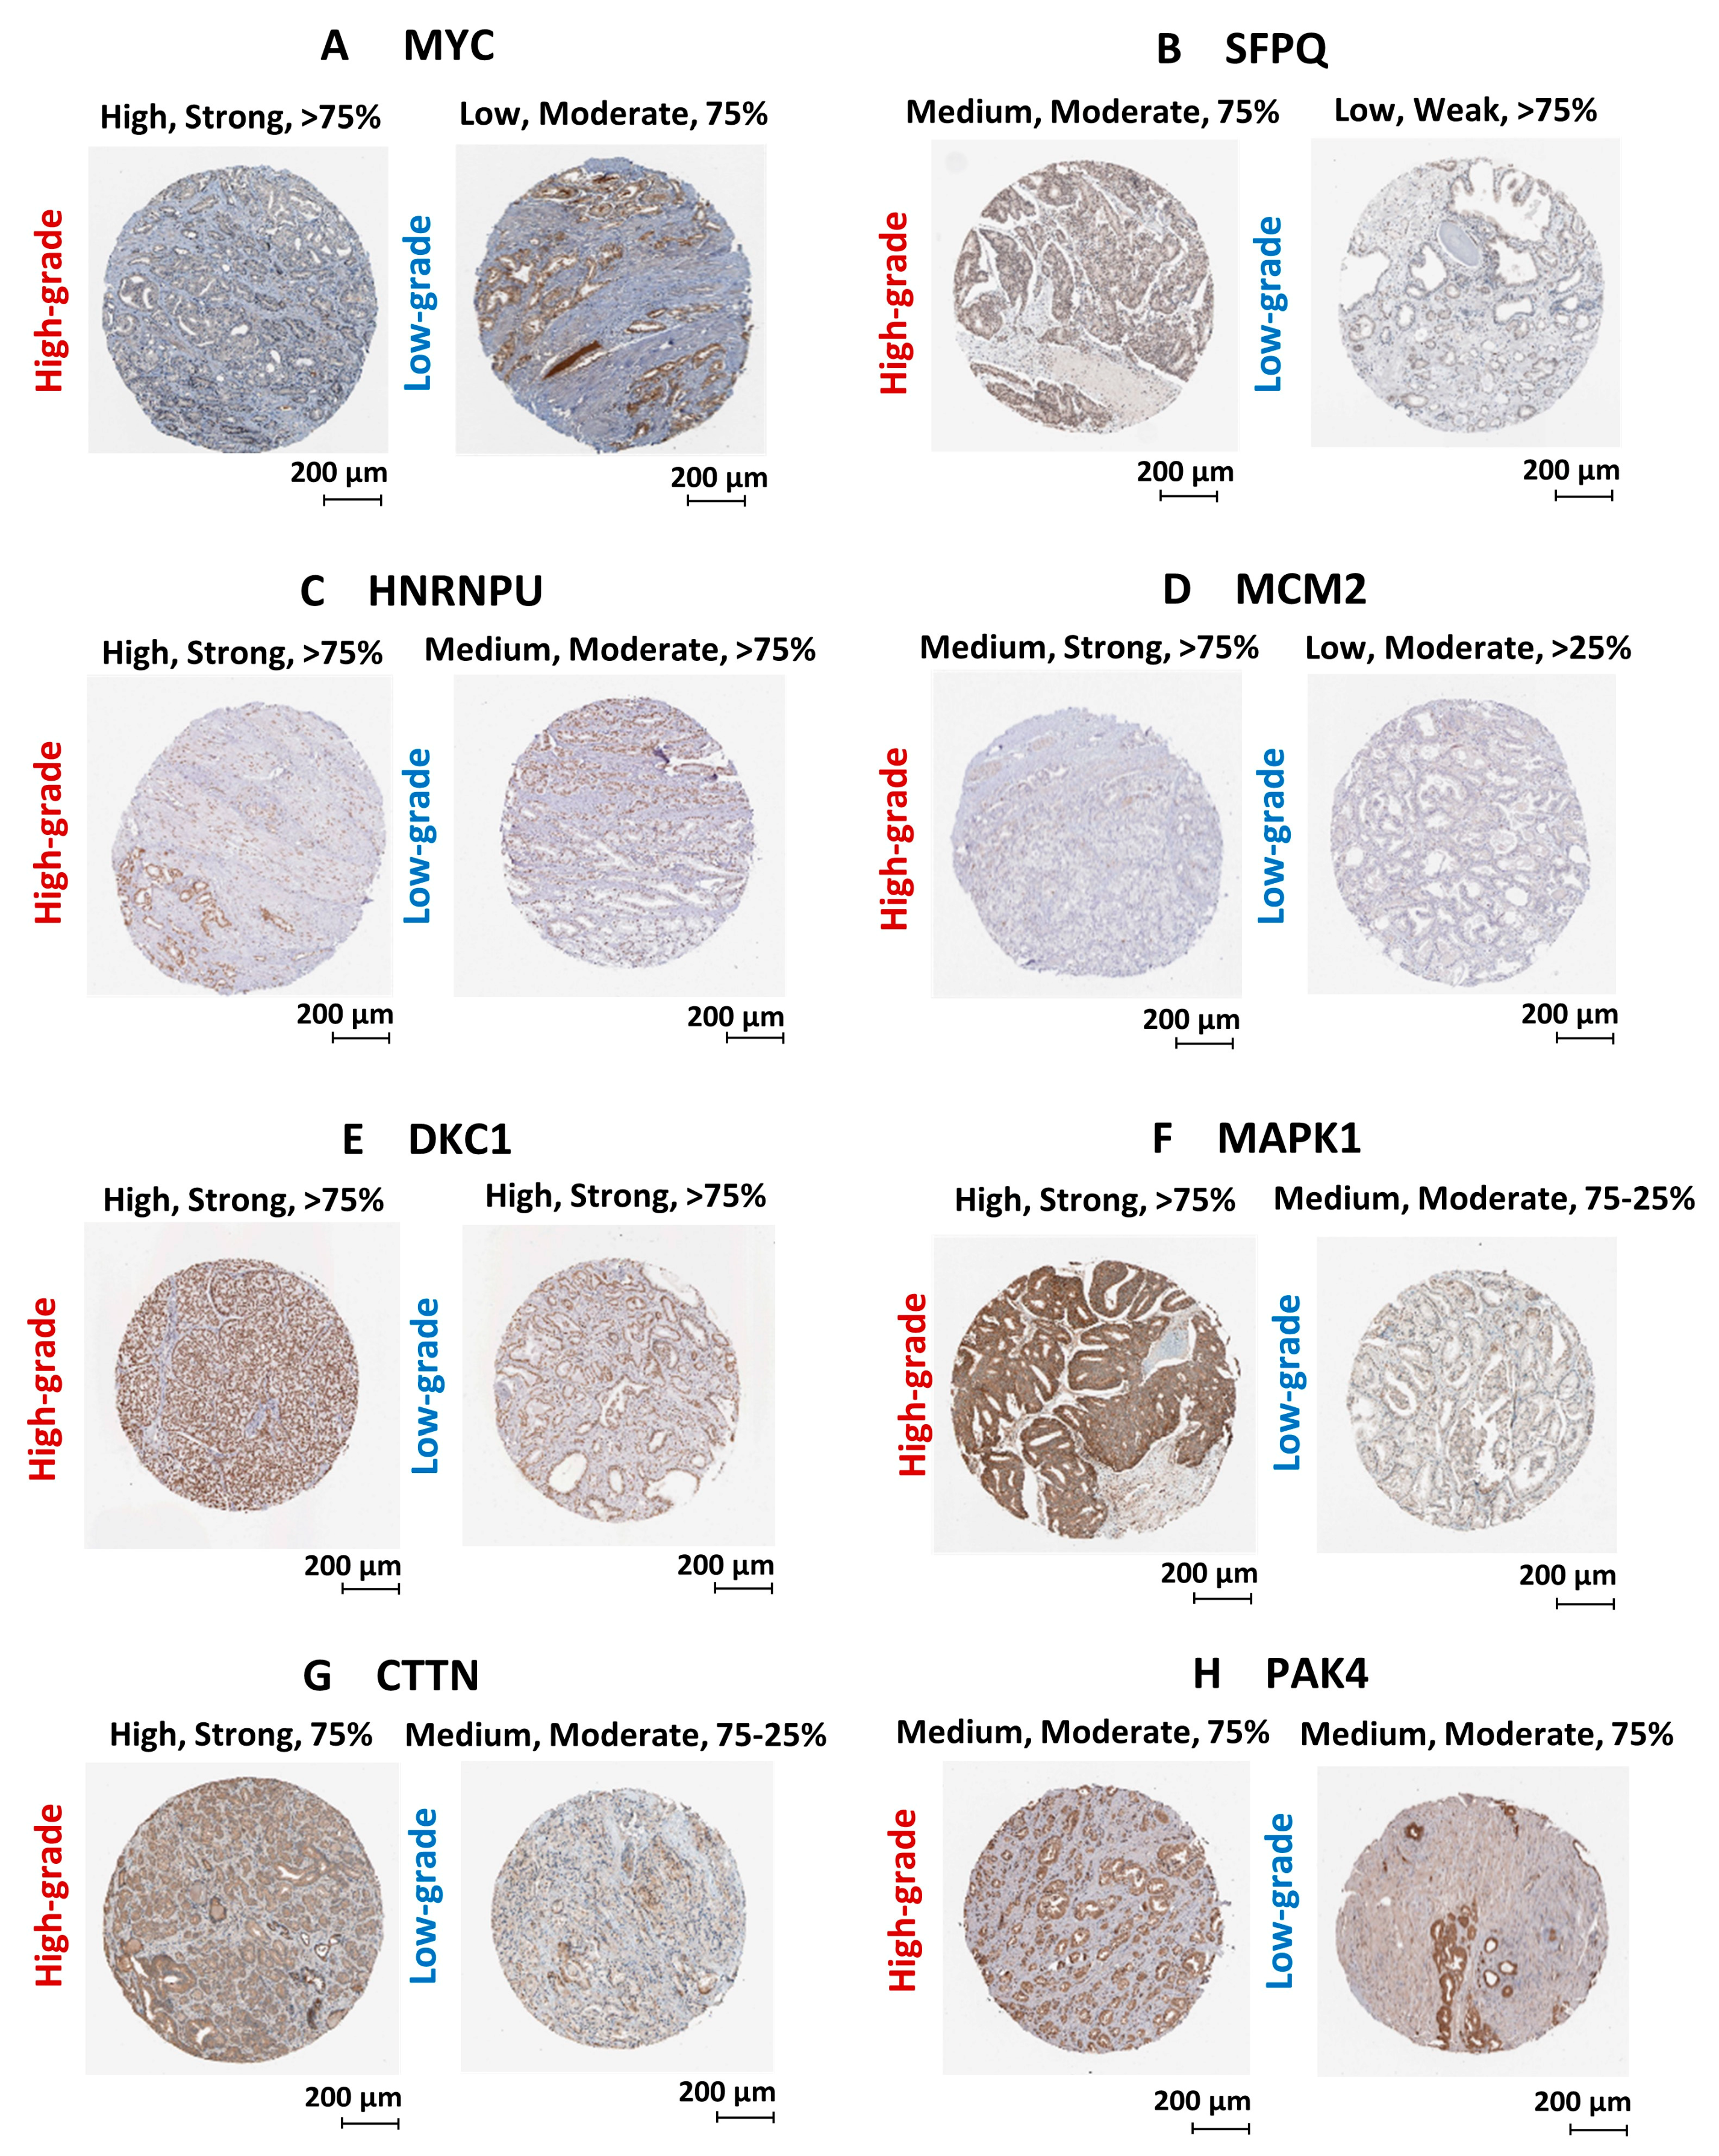
2.6. Validation of Gene/Protein Expression Using PCa Clinical Data
3. Discussion
4. Materials and Methods
4.1. Cell Culture and Androgen/Anti-Androgen Treatment
4.2. Liquid Chromatography Tandem Mass Spectrometry (LC-MS/MS)
4.2.1. Sample Preparation
4.2.2. Data Dependent Acquisition (DDA)
4.2.3. Data Independent Acquisition (DIA)—SWATH-MS/MS
4.3. LC-MS/MS Data Analysis
4.3.1. Spectral Library Generation
4.3.2. SWATH-MS/MS Data Analysis
4.4. RNA Isolation
4.5. Real-Time Quantitative PCR (qRT-PCR) Analysis
4.6. RNAseq Analysis
4.7. Statistical Analysis
4.8. Network Analysis
4.9. Upstream Regulatory Analysis
4.10. Gene Set Enrichment Analysis
4.11. KEGG Mapper Analysis
4.12. Validating the Expression of Differentially Regulated Genes/Protein
5. Conclusions
Supplementary Materials
Author Contributions
Funding
Institutional Review Board Statement
Informed Consent Statement
Data Availability Statement
Acknowledgments
Conflicts of Interest
References
- Rawla, P. Epidemiology of Prostate Cancer. World J. Oncol. 2019, 10, 63–89. [Google Scholar] [CrossRef] [PubMed] [Green Version]
- Schultheiss, D.; Machtens, S. Re: Prostate cancer: A brief history and the discovery of hormonal ablation treatment. J. Urol. 2002, 167, 1801. [Google Scholar] [CrossRef]
- Crawford, E.D.; Heidenreich, A.; Lawrentschuk, N.; Tombal, B.; Pompeo, A.C.L.; Mendoza-Valdes, A.; Miller, K.; Debruyne, F.M.J.; Klotz, L. Androgen-targeted therapy in men with prostate cancer: Evolving practice and future considerations. Prostate Cancer Prostatic Dis. 2019, 22, 24–38. [Google Scholar] [CrossRef] [PubMed] [Green Version]
- Egan, A.; Dong, Y.; Zhang, H.; Qi, Y.; Balk, S.P.; Sartor, O. Castration-resistant prostate cancer: Adaptive responses in the androgen axis. Cancer Treat. Rev. 2014, 40, 426–433. [Google Scholar] [CrossRef]
- Huo, C.; Kuo, Y.Y.; Chuu, C.P. Different Role of Androgen Receptor in Regulation of Prostate Cancer Metastasis with or without Androgen. Cancer Sci. 2018, 109, 996. [Google Scholar]
- Liao, R.S.; Ma, S.; Miao, L.; Li, R.; Yin, Y.; Raj, G.V. Androgen receptor-mediated non-genomic regulation of prostate cancer cell proliferation. Transl. Androl. Urol. 2013, 2, 187–196. [Google Scholar] [CrossRef]
- Heinlein, C.A.; Chang, C. Androgen receptor in prostate cancer. Endocr. Rev. 2004, 25, 276–308. [Google Scholar] [CrossRef] [Green Version]
- Handle, F.; Prekovic, S.; Helsen, C.; Van den Broeck, T.; Smeets, E.; Moris, L.; Eerlings, R.; Kharraz, S.E.; Urbanucci, A.; Mills, I.G.; et al. Drivers of AR indifferent anti-androgen resistance in prostate cancer cells. Sci. Rep. 2019, 9, 13786. [Google Scholar] [CrossRef] [Green Version]
- Hoefer, J.; Akbor, M.; Handle, F.; Ofer, P.; Puhr, M.; Parson, W.; Culig, Z.; Klocker, H.; Heidegger, I. Critical role of androgen receptor level in prostate cancer cell resistance to new generation antiandrogen enzalutamide. Oncotarget 2016, 7, 59781–59794. [Google Scholar] [CrossRef] [Green Version]
- Subramanian, A.; Tamayo, P.; Mootha, V.K.; Mukherjee, S.; Ebert, B.L.; Gillette, M.A.; Paulovich, A.; Pomeroy, S.L.; Golub, T.R.; Lander, E.S.; et al. Gene set enrichment analysis: A knowledge-based approach for interpreting genome-wide expression profiles. Proc. Natl. Acad. Sci. USA 2005, 102, 15545–15550. [Google Scholar] [CrossRef] [PubMed] [Green Version]
- Gillet, L.C.; Navarro, P.; Tate, S.; Rost, H.; Selevsek, N.; Reiter, L.; Bonner, R.; Aebersold, R. Targeted data extraction of the MS/MS spectra generated by data-independent acquisition: A new concept for consistent and accurate proteome analysis. Mol. Cell Proteom. 2012, 11. [Google Scholar] [CrossRef] [Green Version]
- Huang, Q.; Yang, L.; Luo, J.; Guo, L.; Wang, Z.; Yang, X.; Jin, W.; Fang, Y.; Ye, J.; Shan, B.; et al. SWATH enables precise label-free quantification on proteome scale. Proteomics 2015, 15, 1215–1223. [Google Scholar] [CrossRef] [PubMed]
- Cha, S.; Shin, D.H.; Seok, J.R.; Myung, J.K. Differential proteome expression analysis of androgen-dependent and -independent pathways in LNCaP prostate cancer cells. Exp. Cell Res. 2017, 359, 215–225. [Google Scholar] [CrossRef]
- Garrido-Rodriguez, M.; Ortea, I.; Calzado, M.A.; Munoz, E.; Garcia, V. SWATH proteomic profiling of prostate cancer cells identifies NUSAP1 as a potential molecular target for Galiellalactone. J. Proteom. 2019, 193, 217–229. [Google Scholar] [CrossRef] [PubMed]
- Singh, A.N.; Sharma, N. Quantitative SWATH-Based Proteomic Profiling for Identification of Mechanism-Driven Diagnostic Biomarkers Conferring in the Progression of Metastatic Prostate Cancer. Front. Oncol. 2020, 10, 493. [Google Scholar] [CrossRef] [PubMed]
- Ferrari, N.; Granata, I.; Capaia, M.; Piccirillo, M.; Guarracino, M.R.; Vene, R.; Brizzolara, A.; Petretto, A.; Inglese, E.; Morini, M.; et al. Adaptive phenotype drives resistance to androgen deprivation therapy in prostate cancer. Cell Commun. Signal. 2017, 15, 51. [Google Scholar] [CrossRef] [Green Version]
- Iglesias-Gato, D.; Wikstrom, P.; Tyanova, S.; Lavallee, C.; Thysell, E.; Carlsson, J.; Hagglof, C.; Cox, J.; Andren, O.; Stattin, P.; et al. The Proteome of Primary Prostate Cancer. Eur. Urol. 2016, 69, 942–952. [Google Scholar] [CrossRef]
- Liu, Y.; Beyer, A.; Aebersold, R. On the Dependency of Cellular Protein Levels on mRNA Abundance. Cell 2016, 165, 535–550. [Google Scholar] [CrossRef] [Green Version]
- Tran, C.; Ouk, S.; Clegg, N.J.; Chen, Y.; Watson, P.A.; Arora, V.; Wongvipat, J.; Smith-Jones, P.M.; Yoo, D.; Kwon, A.; et al. Development of a second-generation antiandrogen for treatment of advanced prostate cancer. Science 2009, 324, 787–790. [Google Scholar] [CrossRef] [Green Version]
- Penson, D.F.; Armstrong, A.J.; Concepcion, R.; Agarwal, N.; Olsson, C.; Karsh, L.; Dunshee, C.; Wang, F.; Wu, K.; Krivoshik, A.; et al. Enzalutamide Versus Bicalutamide in Castration-Resistant Prostate Cancer: The STRIVE Trial. J. Clin. Oncol. 2016, 34, 2098–2106. [Google Scholar] [CrossRef] [Green Version]
- Shore, N.D.; Chowdhury, S.; Villers, A.; Klotz, L.; Siemens, D.R.; Phung, D.; van Os, S.; Hasabou, N.; Wang, F.; Bhattacharya, S. Efficacy and safety of enzalutamide versus bicalutamide for patients with metastatic prostate cancer (TERRAIN): A randomised, double-blind, phase 2 study. Lancet Oncol. 2016, 17, 153–163. [Google Scholar] [CrossRef]
- Paul, R.; Breul, J. Antiandrogen withdrawal syndrome associated with prostate cancer therapies: Incidence and clinical significance. Drug Saf. 2000, 23, 381–390. [Google Scholar] [CrossRef]
- Asim, M.; Tarish, F.; Zecchini, H.I.; Sanjiv, K.; Gelali, E.; Massie, C.E.; Baridi, A.; Warren, A.Y.; Zhao, W.; Ogris, C.; et al. Synthetic lethality between androgen receptor signalling and the PARP pathway in prostate cancer. Nat. Commun. 2017, 8, 374. [Google Scholar] [CrossRef] [Green Version]
- De Bono, J.; Mateo, J.; Fizazi, K.; Saad, F.; Shore, N.; Sandhu, S.; Chi, K.N.; Sartor, O.; Agarwal, N.; Olmos, D.; et al. Olaparib for Metastatic Castration-Resistant Prostate Cancer. N. Engl. J. Med. 2020, 382, 2091–2102. [Google Scholar] [CrossRef] [PubMed]
- Baumgart, S.J.; Nevedomskaya, E.; Haendler, B. Dysregulated Transcriptional Control in Prostate Cancer. Int. J. Mol. Sci. 2019, 20, 2883. [Google Scholar] [CrossRef] [PubMed] [Green Version]
- Hernandez, G.; Ramirez, J.L.; Pedroza-Torres, A.; Herrera, L.A.; Jimenez-Rios, M.A. The Secret Life of Translation Initiation in Prostate Cancer. Front. Genet. 2019, 10, 14. [Google Scholar] [CrossRef] [PubMed]
- Barfeld, S.J.; Urbanucci, A.; Itkonen, H.M.; Fazli, L.; Hicks, J.L.; Thiede, B.; Rennie, P.S.; Yegnasubramanian, S.; DeMarzo, A.M.; Mills, I.G. c-Myc Antagonises the Transcriptional Activity of the Androgen Receptor in Prostate Cancer Affecting Key Gene Networks. EBioMedicine 2017, 18, 83–93. [Google Scholar] [CrossRef] [Green Version]
- Bai, S.; Cao, S.; Jin, L.; Kobelski, M.; Schouest, B.; Wang, X.; Ungerleider, N.; Baddoo, M.; Zhang, W.; Corey, E.; et al. A positive role of c-Myc in regulating androgen receptor and its splice variants in prostate cancer. Oncogene 2019, 38, 4977–4989. [Google Scholar] [CrossRef] [PubMed]
- Yang, S.; Jiang, M.; Grabowska, M.M.; Li, J.; Connelly, Z.M.; Zhang, J.; Hayward, S.W.; Cates, J.M.; Han, G.; Yu, X. Androgen receptor differentially regulates the proliferation of prostatic epithelial cells in vitro and in vivo. Oncotarget 2016, 7, 70404–70419. [Google Scholar] [CrossRef] [PubMed]
- Asangani, I.A.; Wilder-Romans, K.; Dommeti, V.L.; Krishnamurthy, P.M.; Apel, I.J.; Escara-Wilke, J.; Plymate, S.R.; Navone, N.M.; Wang, S.; Feng, F.Y.; et al. BET Bromodomain Inhibitors Enhance Efficacy and Disrupt Resistance to AR Antagonists in the Treatment of Prostate Cancer. Mol. Cancer Res. 2016, 14, 324–331. [Google Scholar] [CrossRef] [Green Version]
- Nadiminty, N.; Tummala, R.; Liu, C.; Lou, W.; Evans, C.P.; Gao, A.C. NF-kappaB2/p52:c-Myc:hnRNPA1 Pathway Regulates Expression of Androgen Receptor Splice Variants and Enzalutamide Sensitivity in Prostate Cancer. Mol. Cancer Ther. 2015, 14, 1884–1895. [Google Scholar] [CrossRef] [Green Version]
- Wyatt, A.W.; Azad, A.A.; Volik, S.V.; Annala, M.; Beja, K.; McConeghy, B.; Haegert, A.; Warner, E.W.; Mo, F.; Brahmbhatt, S.; et al. Genomic Alterations in Cell-Free DNA and Enzalutamide Resistance in Castration-Resistant Prostate Cancer. JAMA Oncol. 2016, 2, 1598–1606. [Google Scholar] [CrossRef] [PubMed]
- Takayama, K.I.; Suzuki, T.; Fujimura, T.; Yamada, Y.; Takahashi, S.; Homma, Y.; Suzuki, Y.; Inoue, S. Dysregulation of spliceosome gene expression in advanced prostate cancer by RNA-binding protein PSF. Proc. Natl. Acad. Sci. USA 2017, 114, 10461–10466. [Google Scholar] [CrossRef] [Green Version]
- Xiao, R.; Tang, P.; Yang, B.; Huang, J.; Zhou, Y.; Shao, C.; Li, H.; Sun, H.; Zhang, Y.; Fu, X.D. Nuclear matrix factor hnRNP U/SAF-A exerts a global control of alternative splicing by regulating U2 snRNP maturation. Mol. Cell 2012, 45, 656–668. [Google Scholar] [CrossRef] [Green Version]
- Shiota, M.; Fujimoto, N.; Imada, K.; Yokomizo, A.; Itsumi, M.; Takeuchi, A.; Kuruma, H.; Inokuchi, J.; Tatsugami, K.; Uchiumi, T.; et al. Potential Role for YB-1 in Castration-Resistant Prostate Cancer and Resistance to Enzalutamide Through the Androgen Receptor V7. J. Natl. Cancer Inst. 2016, 108. [Google Scholar] [CrossRef] [Green Version]
- Corbo, C.; Orru, S.; Salvatore, F. SRp20: An overview of its role in human diseases. Biochem. Biophys. Res. Commun. 2013, 436, 1–5. [Google Scholar] [CrossRef]
- Clark, E.L.; Hadjimichael, C.; Temperley, R.; Barnard, A.; Fuller-Pace, F.V.; Robson, C.N. p68/DdX5 supports beta-catenin & RNAP II during androgen receptor mediated transcription in prostate cancer. PLoS ONE 2013, 8, e54150. [Google Scholar] [CrossRef] [Green Version]
- Rebello, R.J.; Pearson, R.B.; Hannan, R.D.; Furic, L. Therapeutic Approaches Targeting MYC-Driven Prostate Cancer. Genes 2017, 8, 71. [Google Scholar] [CrossRef] [Green Version]
- Jimenez-Vacas, J.M.; Herrero-Aguayo, V.; Montero-Hidalgo, A.J.; Gomez-Gomez, E.; Fuentes-Fayos, A.C.; Leon-Gonzalez, A.J.; Saez-Martinez, P.; Alors-Perez, E.; Pedraza-Arevalo, S.; Gonzalez-Serrano, T.; et al. Dysregulation of the splicing machinery is directly associated to aggressiveness of prostate cancer. EBioMedicine 2020, 51, 102547. [Google Scholar] [CrossRef] [PubMed] [Green Version]
- Zhi, J.; Sun, J.; Wang, Z.; Ding, W. Support vector machine classifier for prediction of the metastasis of colorectal cancer. Int. J. Mol. Med. 2018, 41, 1419–1426. [Google Scholar] [CrossRef] [PubMed]
- Sieron, P.; Hader, C.; Hatina, J.; Engers, R.; Wlazlinski, A.; Muller, M.; Schulz, W.A. DKC1 overexpression associated with prostate cancer progression. Br. J. Cancer 2009, 101, 1410–1416. [Google Scholar] [CrossRef] [PubMed] [Green Version]
- Arthurs, C.; Murtaza, B.N.; Thomson, C.; Dickens, K.; Henrique, R.; Patel, H.R.H.; Beltran, M.; Millar, M.; Thrasivoulou, C.; Ahmed, A. Expression of ribosomal proteins in normal and cancerous human prostate tissue. PLoS ONE 2017, 12, e0186047. [Google Scholar] [CrossRef] [PubMed] [Green Version]
- Vasanthaiah, H.K.; Ravishankar, K.V.; Shivashankara, K.S.; Anand, L.; Narayanaswamy, P.; Mukunda, G.; Prasad, T.G. Cloning and characterization of differentially expressed genes of internal breakdown in mango fruit (Mangifera indica). J. Plant. Physiol. 2006, 163, 671–679. [Google Scholar] [CrossRef] [PubMed]
- Dehm, S.M.; Tindall, D.J. Molecular regulation of androgen action in prostate cancer. J. Cell Biochem. 2006, 99, 333–344. [Google Scholar] [CrossRef]
- Patel, N.M.; Nozaki, S.; Shortle, N.H.; Bhat-Nakshatri, P.; Newton, T.R.; Rice, S.; Gelfanov, V.; Boswell, S.H.; Goulet, R.J., Jr.; Sledge, G.W., Jr.; et al. Paclitaxel sensitivity of breast cancer cells with constitutively active NF-kappaB is enhanced by IkappaBalpha super-repressor and parthenolide. Oncogene 2000, 19, 4159–4169. [Google Scholar] [CrossRef] [PubMed] [Green Version]
- Landers, K.A.; Samaratunga, H.; Teng, L.; Buck, M.; Burger, M.J.; Scells, B.; Lavin, M.F.; Gardiner, R.A. Identification of claudin-4 as a marker highly overexpressed in both primary and metastatic prostate cancer. Brit. J. Cancer 2008, 99, 491–501. [Google Scholar] [CrossRef]
- True, L.; Coleman, I.; Hawley, S.; Huang, C.Y.; Gifford, D.; Coleman, R.; Beer, T.M.; Gelmann, E.; Datta, M.; Mostaghel, E.; et al. A molecular correlate to the Gleason grading system for prostate adenocarcinoma. Proc. Natl. Acad. Sci. USA 2006, 103, 10991–10996. [Google Scholar] [CrossRef] [Green Version]
- Shiota, M.; Yokomizo, A.; Naito, S. Oxidative stress and androgen receptor signaling in the development and progression of castration-resistant prostate cancer. Free Radic. Biol. Med. 2011, 51, 1320–1328. [Google Scholar] [CrossRef]
- Shiota, M.; Yokomizo, A.; Naito, S. Pro-survival and anti-apoptotic properties of androgen receptor signaling by oxidative stress promote treatment resistance in prostate cancer. Endocr. Relat. Cancer 2012, 19, R243–R253. [Google Scholar] [CrossRef] [Green Version]
- Hoti, N.; Shah, P.; Hu, Y.; Yang, S.; Zhang, H. Proteomics analyses of prostate cancer cells reveal cellular pathways associated with androgen resistance. Proteomics 2017, 17. [Google Scholar] [CrossRef] [Green Version]
- Schopf, B.; Weissensteiner, H.; Schafer, G.; Fazzini, F.; Charoentong, P.; Naschberger, A.; Rupp, B.; Fendt, L.; Bukur, V.; Giese, I.; et al. OXPHOS remodeling in high-grade prostate cancer involves mtDNA mutations and increased succinate oxidation. Nat. Commun. 2020, 11, 1487. [Google Scholar] [CrossRef] [Green Version]
- Stewart, P.A.; Khamis, Z.I.; Zhau, H.E.; Duan, P.; Li, Q.; Chung, L.W.K.; Sang, Q.A. Upregulation of minichromosome maintenance complex component 3 during epithelial-to-mesenchymal transition in human prostate cancer. Oncotarget 2017, 8, 39209–39217. [Google Scholar] [CrossRef]
- Kobierzycki, C.; Pula, B.; Skiba, M.; Jablonska, K.; Latkowski, K.; Zabel, M.; Nowak-Markwitz, E.; Spaczynski, M.; Kedzia, W.; Podhorska-Okolow, M.; et al. Comparison of minichromosome maintenance proteins (MCM-3, MCM-7) and metallothioneins (MT-I/II, MT-III) expression in relation to clinicopathological data in ovarian cancer. Anticancer Res. 2013, 33, 5375–5383. [Google Scholar]
- Rezvani, G.; Andisheh-Tadbir, A.; Ashraf, M.J.; Amanpour, S.; Kamali, F.; Fardisi, S. Evaluation of Minichromosome Maintenance-3 (MCM3) in Oral Squamous Cell Carcinoma. J. Dent. 2015, 16, 87–92. [Google Scholar]
- Wells, C.M.; Whale, A.D.; Parsons, M.; Masters, J.R.W.; Jones, G.E. PAK4: A pluripotent kinase that regulates prostate cancer cell adhesion. J. Cell Sci. 2010, 123, 1663–1673. [Google Scholar] [CrossRef] [Green Version]
- Das, D.K.; Naidoo, M.; Ilboudo, A.; Park, J.Y.; Ali, T.; Krampis, K.; Robinson, B.D.; Osborne, J.R.; Ogunwobi, O.O. miR-1207-3p regulates the androgen receptor in prostate cancer via FNDC1/fibronectin. Exp. Cell Res. 2016, 348, 190–200. [Google Scholar] [CrossRef] [Green Version]
- van der Horst, G.; Bos, L.; van der Mark, M.; Cheung, H.; Heckmann, B.; Clement-Lacroix, P.; Lorenzon, G.; Pelger, R.C.; Bevers, R.F.; van der Pluijm, G. Targeting of alpha-v integrins reduces malignancy of bladder carcinoma. PLoS ONE 2014, 9, e108464. [Google Scholar] [CrossRef]
- Bitting, R.L.; Armstrong, A.J. Targeting the PI3K/Akt/mTOR pathway in castration-resistant prostate cancer. Endocr. Relat. Cancer 2013, 20, R83–R99. [Google Scholar] [CrossRef] [PubMed] [Green Version]
- Chow, H.; Ghosh, P.M.; deVere White, R.; Evans, C.P.; Dall’Era, M.A.; Yap, S.A.; Li, Y.; Beckett, L.A.; Lara, P.N., Jr.; Pan, C.X. A phase 2 clinical trial of everolimus plus bicalutamide for castration-resistant prostate cancer. Cancer 2016, 122, 1897–1904. [Google Scholar] [CrossRef] [Green Version]
- Marques, R.B.; Dits, N.F.; Erkens-Schulze, S.; van Weerden, W.M.; Jenster, G. Bypass mechanisms of the androgen receptor pathway in therapy-resistant prostate cancer cell models. PLoS ONE 2010, 5, e13500. [Google Scholar] [CrossRef] [Green Version]
- Jia, L.; Coetzee, G.A. Androgen receptor-dependent PSA expression in androgen-independent prostate cancer cells does not involve androgen receptor occupancy of the PSA locus. Cancer Res. 2005, 65, 8003–8008. [Google Scholar] [CrossRef] [PubMed] [Green Version]
- Mikhailova, M.; Wang, Y.; Bedolla, R.; Lu, X.H.; Kreisberg, J.I.; Ghosh, P.M. AKT regulates androgen receptor-dependent growth and PSA expression in prostate cancer. Adv. Exp. Med. Biol. 2008, 617, 397–405. [Google Scholar] [CrossRef]
- Saxena, P.; Trerotola, M.; Wang, T.; Li, J.; Sayeed, A.; Vanoudenhove, J.; Adams, D.S.; Fitzgerald, T.J.; Altieri, D.C.; Languino, L.R. PSA regulates androgen receptor expression in prostate cancer cells. Prostate 2012, 72, 769–776. [Google Scholar] [CrossRef] [Green Version]
- Georget, V.; Terouanne, B.; Nicolas, J.C.; Sultan, C. Mechanism of antiandrogen action: Key role of hsp90 in conformational change and transcriptional activity of the androgen receptor. Biochemistry 2002, 41, 11824–11831. [Google Scholar] [CrossRef] [PubMed]
- Nikitovic, D.; Berdiaki, A.; Spyridaki, I.; Krasanakis, T.; Tsatsakis, A.; Tzanakakis, G.N. Proteoglycans-Biomarkers and Targets in Cancer Therapy. Front. Endocrinol. 2018, 9, 69. [Google Scholar] [CrossRef] [PubMed] [Green Version]
- Haider, S.; Pal, R. Integrated analysis of transcriptomic and proteomic data. Curr. Genom. 2013, 14, 91–110. [Google Scholar] [CrossRef]
- Ludwig, C.; Gillet, L.; Rosenberger, G.; Amon, S.; Collins, B.C.; Aebersold, R. Data-independent acquisition-based SWATH-MS for quantitative proteomics: A tutorial. Mol. Syst. Biol. 2018, 14, e8126. [Google Scholar] [CrossRef]
- Rice, M.A.; Malhotra, S.V.; Stoyanova, T. Second-Generation Antiandrogens: From Discovery to Standard of Care in Castration Resistant Prostate Cancer. Front. Oncol. 2019, 9, 801. [Google Scholar] [CrossRef]
- Lai, J.; An, J.; Nelson, C.C.; Lehman, M.L.; Batra, J.; Clements, J.A. Analysis of androgen and anti-androgen regulation of KLK-related peptidase 2, 3, and 4 alternative transcripts in prostate cancer. Biol. Chem. 2014, 395, 1127–1132. [Google Scholar] [CrossRef] [PubMed] [Green Version]
- Kim, D.; Pertea, G.; Trapnell, C.; Pimentel, H.; Kelley, R.; Salzberg, S.L. TopHat2: Accurate alignment of transcriptomes in the presence of insertions, deletions and gene fusions. Genome Biol. 2013, 14, R36. [Google Scholar] [CrossRef] [Green Version]
- Robinson, M.D.; McCarthy, D.J.; Smyth, G.K. edgeR: A Bioconductor package for differential expression analysis of digital gene expression data. Bioinformatics 2010, 26, 139–140. [Google Scholar] [CrossRef] [Green Version]
- Chong, J.; Wishart, D.S.; Xia, J. Using MetaboAnalyst 4.0 for Comprehensive and Integrative Metabolomics Data Analysis. Curr. Protoc. Bioinf. 2019, 68, e86. [Google Scholar] [CrossRef]
- Abazid, A.; Martin, B.; Choinowski, A.; McNeill, R.V.; Brandenburg, L.O.; Ziegler, P.; Zimmermann, U.; Burchardt, M.; Erb, H.; Stope, M.B. The androgen receptor antagonist enzalutamide induces apoptosis, dysregulates the heat shock protein system, and diminishes the androgen receptor and estrogen receptor beta1 expression in prostate cancer cells. J. Cell Biochem. 2019, 120, 16711–16722. [Google Scholar] [CrossRef]
- Liberzon, A. A description of the Molecular Signatures Database (MSigDB) Web site. Methods Mol. Biol. 2014, 1150, 153–160. [Google Scholar] [CrossRef] [PubMed]
- Liberzon, A.; Birger, C.; Thorvaldsdottir, H.; Ghandi, M.; Mesirov, J.P.; Tamayo, P. The Molecular Signatures Database (MSigDB) hallmark gene set collection. Cell Syst. 2015, 1, 417–425. [Google Scholar] [CrossRef] [PubMed] [Green Version]
- Kanehisa, M.; Furumichi, M.; Tanabe, M.; Sato, Y.; Morishima, K. KEGG: New perspectives on genomes, pathways, diseases and drugs. Nucleic Acids Res. 2017, 45, D353–D361. [Google Scholar] [CrossRef] [PubMed] [Green Version]
- Kanehisa, M.; Sato, Y. KEGG Mapper for inferring cellular functions from protein sequences. Protein Sci. 2020, 29, 28–35. [Google Scholar] [CrossRef] [Green Version]
- Kanehisa, M.; Goto, S.; Furumichi, M.; Tanabe, M.; Hirakawa, M. KEGG for representation and analysis of molecular networks involving diseases and drugs. Nucleic Acids Res. 2010, 38, D355–D360. [Google Scholar] [CrossRef] [PubMed] [Green Version]
- Grasso, C.S.; Wu, Y.M.; Robinson, D.R.; Cao, X.; Dhanasekaran, S.M.; Khan, A.P.; Quist, M.J.; Jing, X.; Lonigro, R.J.; Brenner, J.C.; et al. The mutational landscape of lethal castration-resistant prostate cancer. Nature 2012, 487, 239–243. [Google Scholar] [CrossRef] [Green Version]
- Rhodes, D.R.; Yu, J.; Shanker, K.; Deshpande, N.; Varambally, R.; Ghosh, D.; Barrette, T.; Pandey, A.; Chinnaiyan, A.M. ONCOMINE: A cancer microarray database and integrated data-mining platform. Neoplasia 2004, 6, 1–6. [Google Scholar] [CrossRef] [Green Version]
- Uhlen, M.; Fagerberg, L.; Hallstrom, B.M.; Lindskog, C.; Oksvold, P.; Mardinoglu, A.; Sivertsson, A.; Kampf, C.; Sjostedt, E.; Asplund, A.; et al. Proteomics. Tissue-based map of the human proteome. Science 2015, 347, 1260419. [Google Scholar] [CrossRef]
- Uhlen, M.; Bjorling, E.; Agaton, C.; Szigyarto, C.A.; Amini, B.; Andersen, E.; Andersson, A.C.; Angelidou, P.; Asplund, A.; Asplund, C.; et al. A human protein atlas for normal and cancer tissues based on antibody proteomics. Mol. Cell Proteom. 2005, 4, 1920–1932. [Google Scholar] [CrossRef] [Green Version]
Publisher’s Note: MDPI stays neutral with regard to jurisdictional claims in published maps and institutional affiliations. |
© 2021 by the authors. Licensee MDPI, Basel, Switzerland. This article is an open access article distributed under the terms and conditions of the Creative Commons Attribution (CC BY) license (http://creativecommons.org/licenses/by/4.0/).
Share and Cite
Liyanage, C.; Malik, A.; Abeysinghe, P.; Clements, J.; Batra, J. SWATH-MS Based Proteomic Profiling of Prostate Cancer Cells Reveals Adaptive Molecular Mechanisms in Response to Anti-Androgen Therapy. Cancers 2021, 13, 715. https://doi.org/10.3390/cancers13040715
Liyanage C, Malik A, Abeysinghe P, Clements J, Batra J. SWATH-MS Based Proteomic Profiling of Prostate Cancer Cells Reveals Adaptive Molecular Mechanisms in Response to Anti-Androgen Therapy. Cancers. 2021; 13(4):715. https://doi.org/10.3390/cancers13040715
Chicago/Turabian StyleLiyanage, Chamikara, Adil Malik, Pevindu Abeysinghe, Judith Clements, and Jyotsna Batra. 2021. "SWATH-MS Based Proteomic Profiling of Prostate Cancer Cells Reveals Adaptive Molecular Mechanisms in Response to Anti-Androgen Therapy" Cancers 13, no. 4: 715. https://doi.org/10.3390/cancers13040715
APA StyleLiyanage, C., Malik, A., Abeysinghe, P., Clements, J., & Batra, J. (2021). SWATH-MS Based Proteomic Profiling of Prostate Cancer Cells Reveals Adaptive Molecular Mechanisms in Response to Anti-Androgen Therapy. Cancers, 13(4), 715. https://doi.org/10.3390/cancers13040715