
Advances in the First Line Treatment of Pediatric Acute Myeloid Leukemia in the Polish Pediatric Leukemia and Lymphoma Study Group from 1983 to 2019

 , , , , , , , , , , add
Show full author list
, , , , , , , , , , add
Show full author list
Abstract
Simple Summary
Abstract
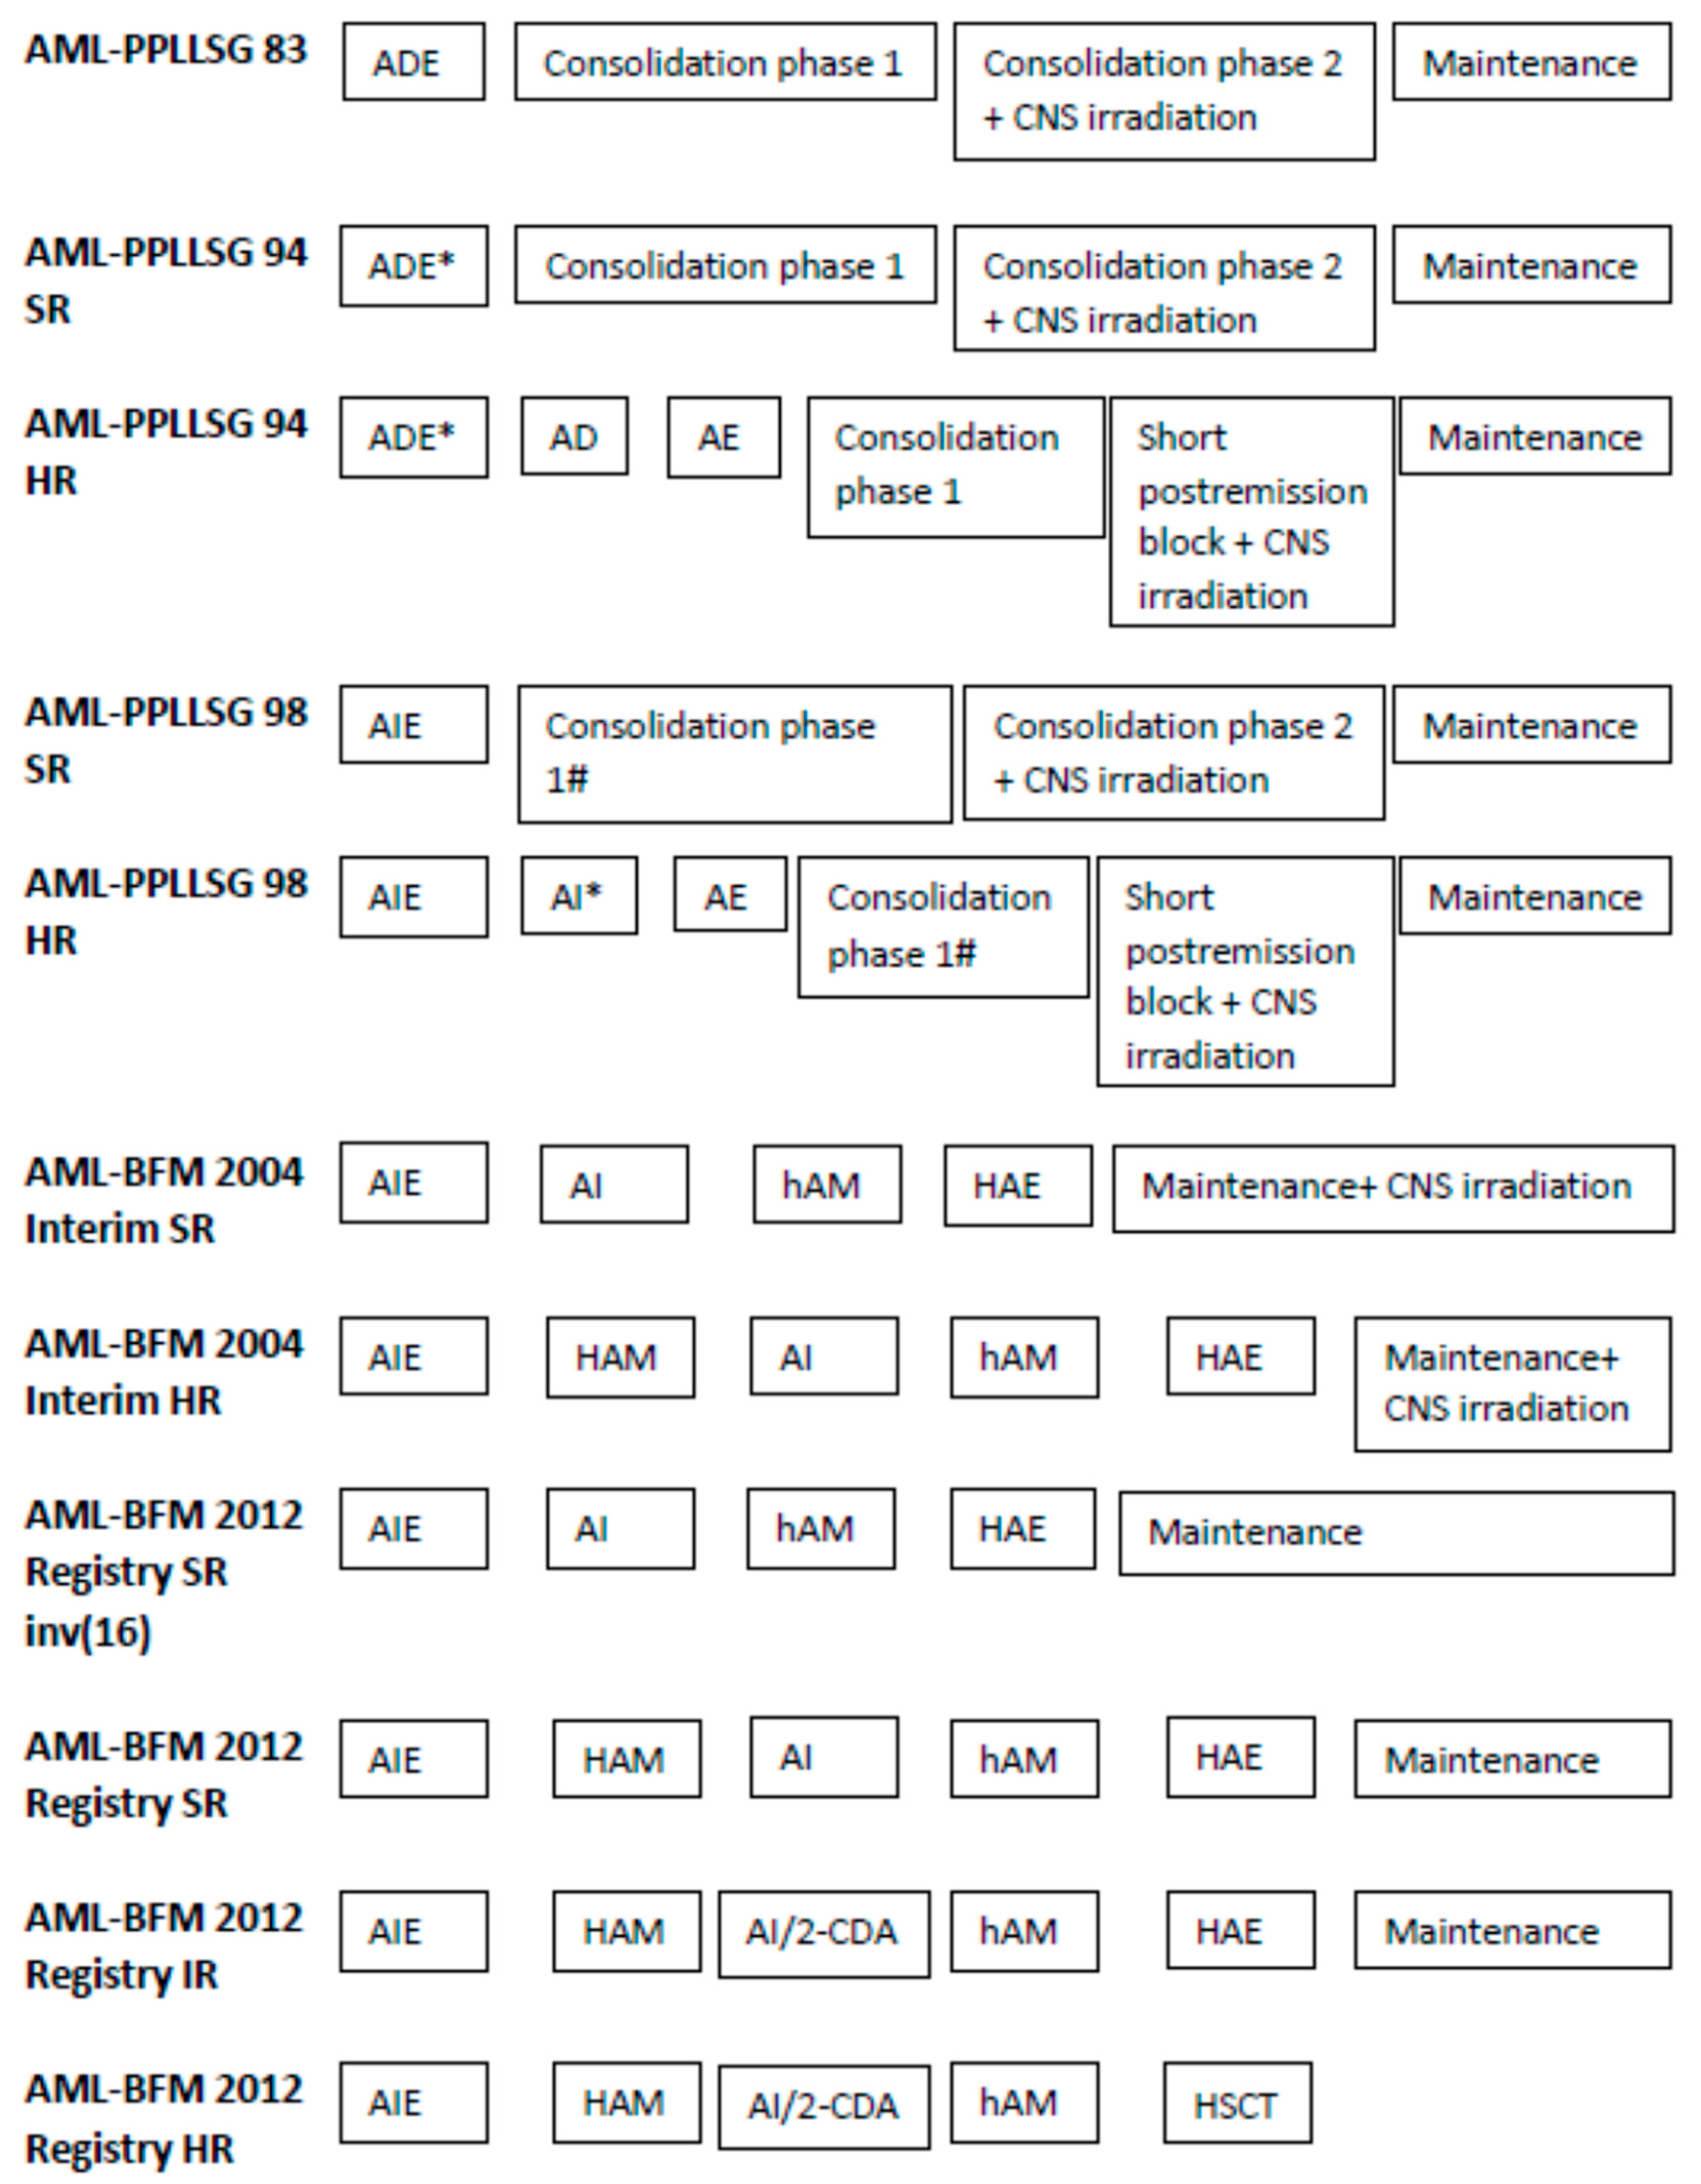
1. Introduction
2. Materials and Methods
2.1. Diagnostics
2.2. Definitions
3. Results
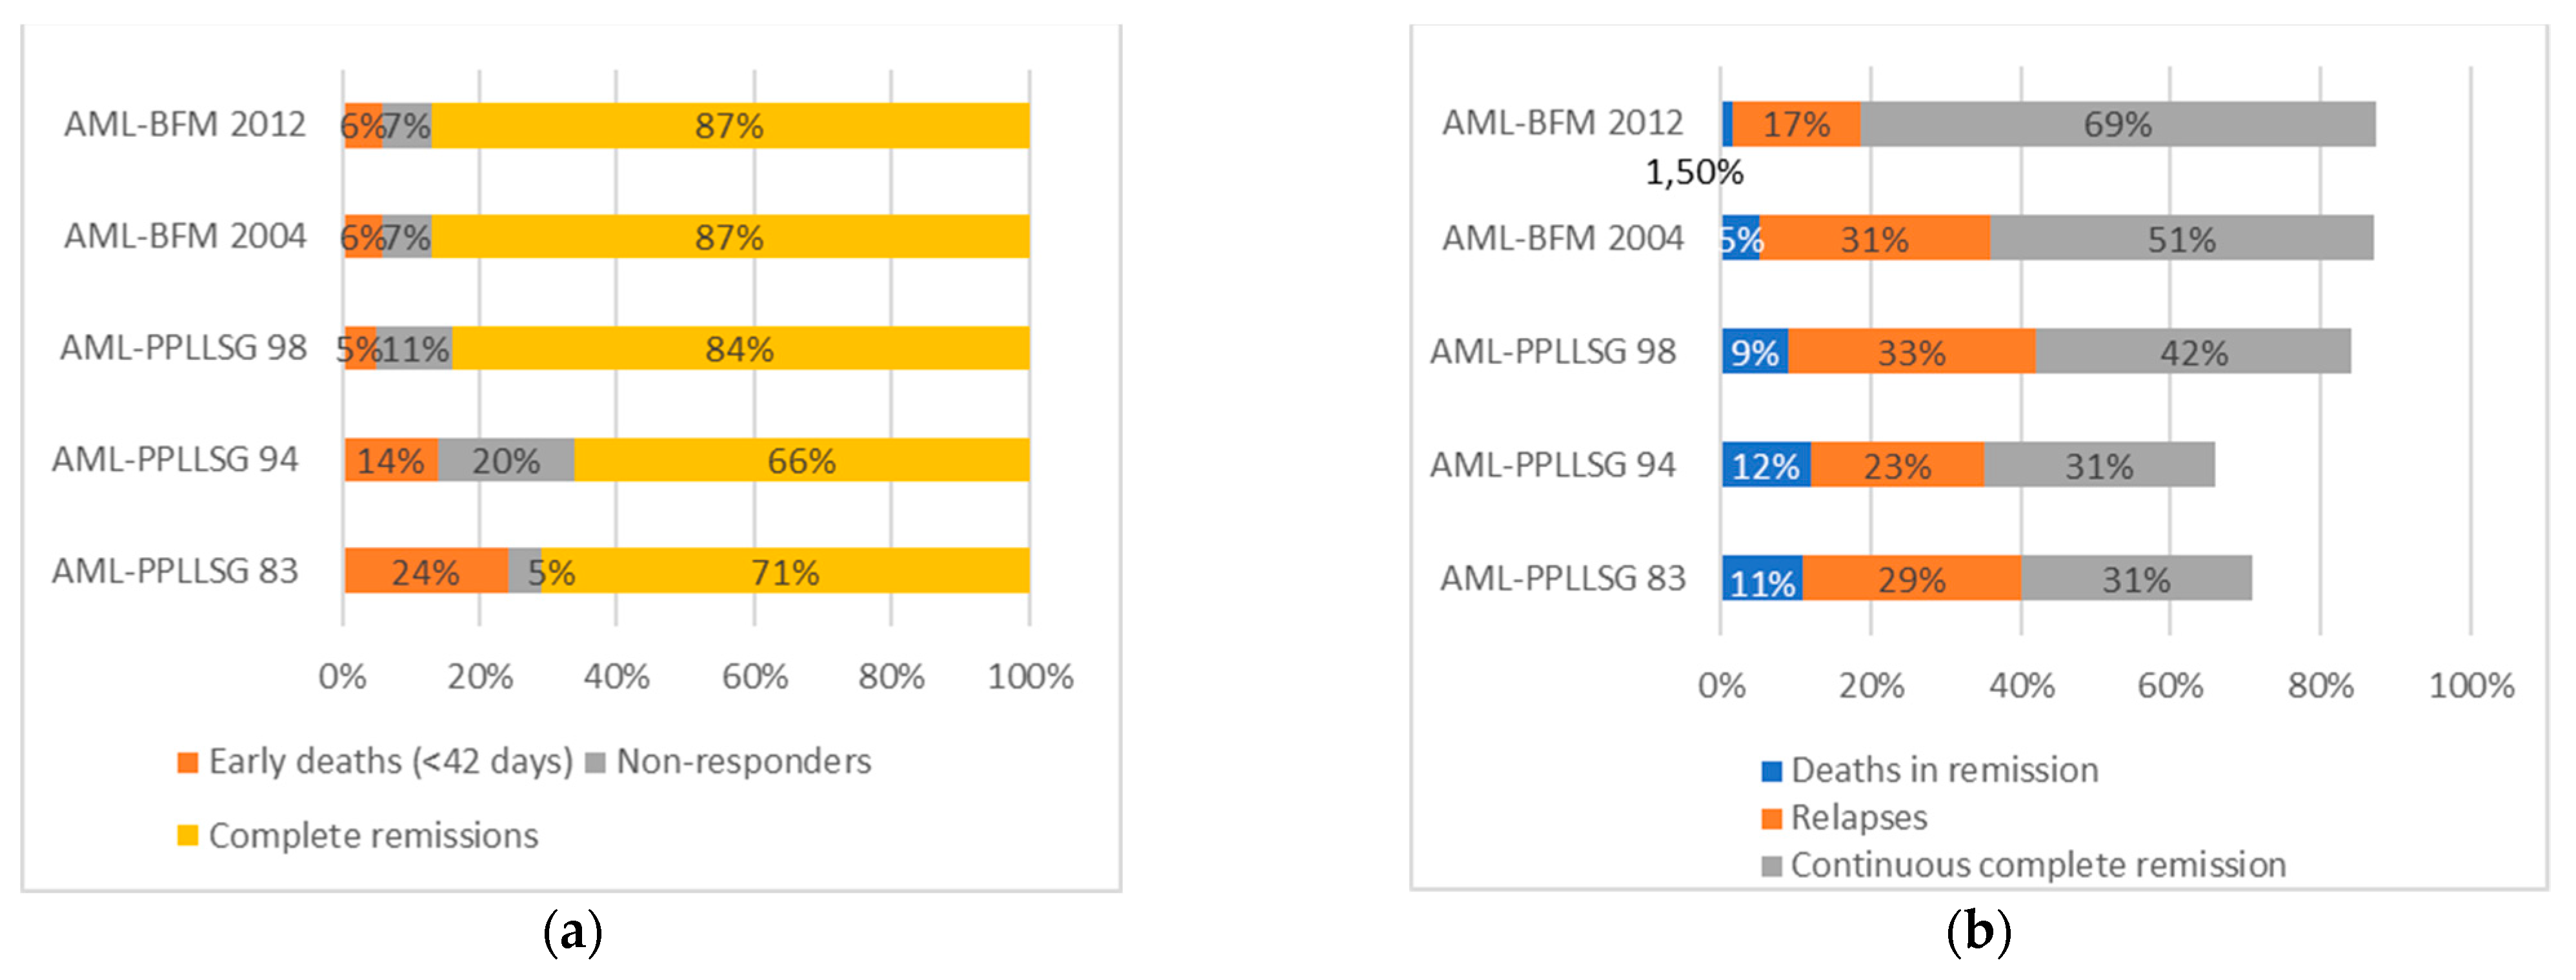
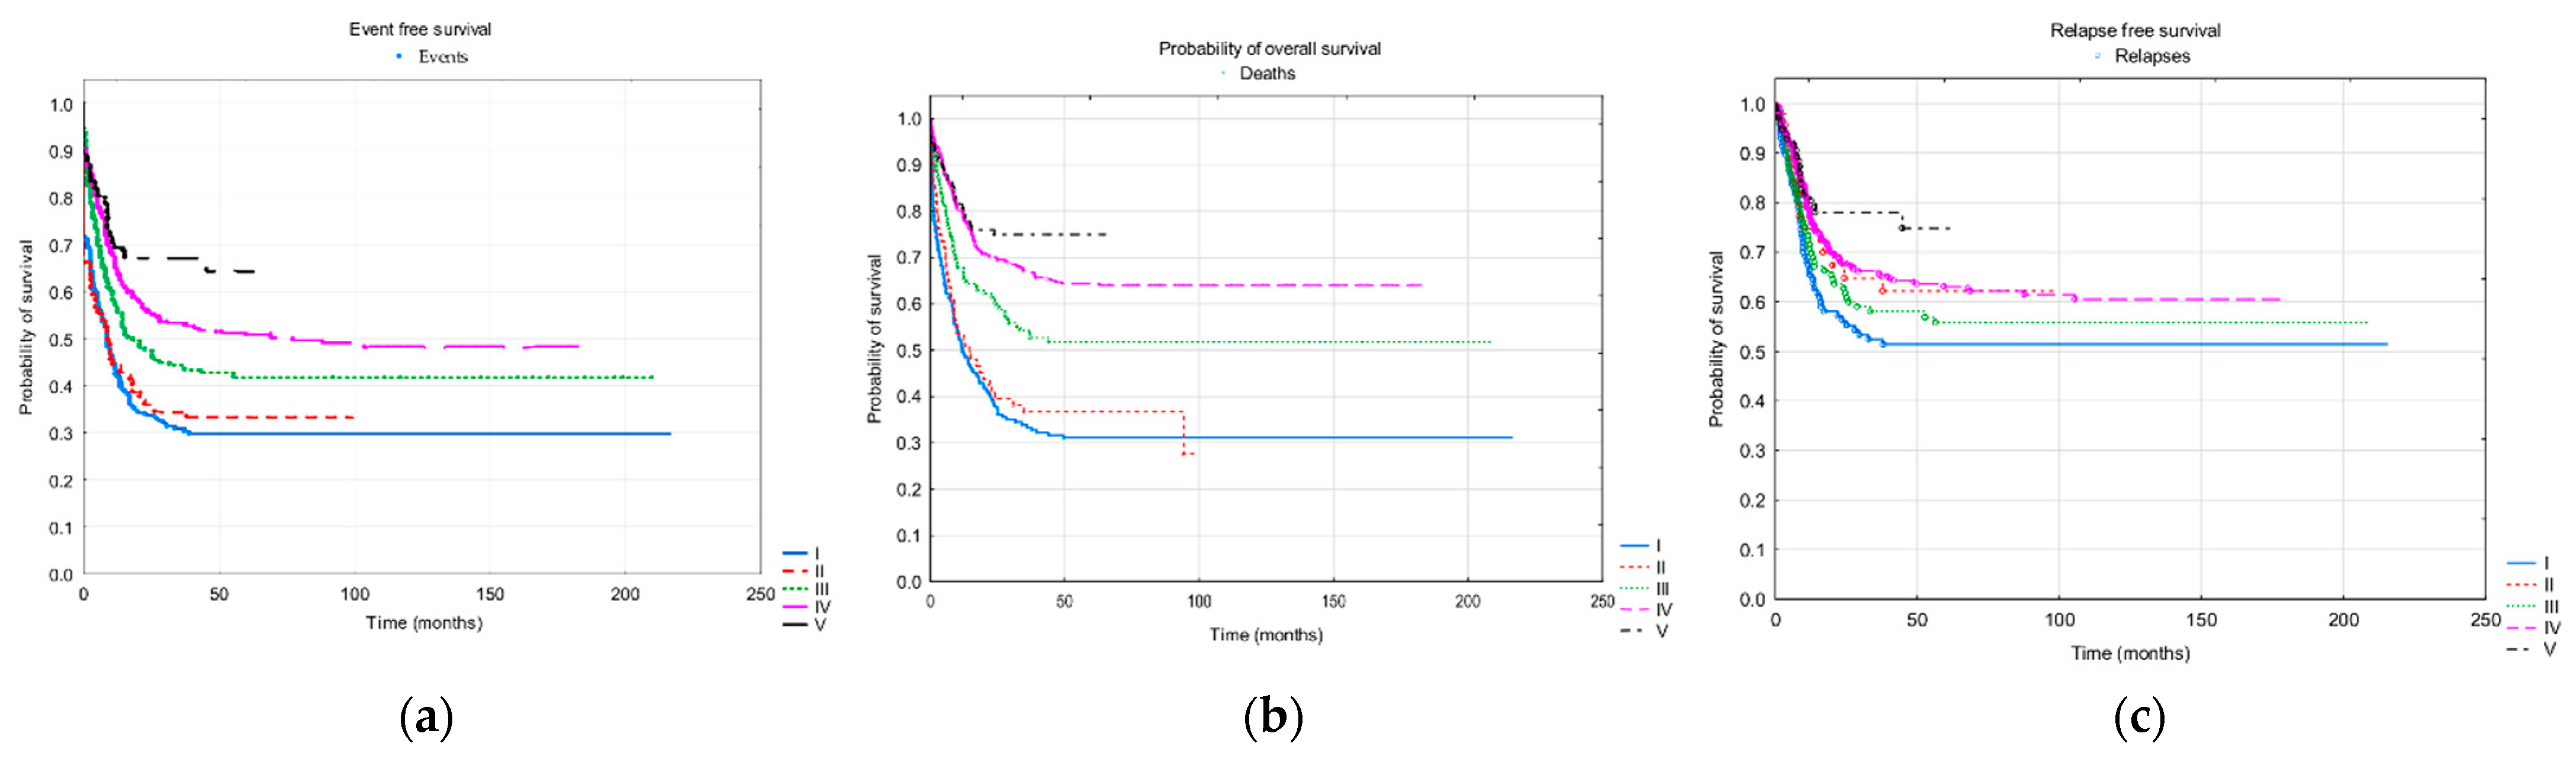
3.1. Treatment Results
3.2. Risk Groups
3.3. The Treatment Results Depending on the Genetics
3.3.1. FLT3-ITD
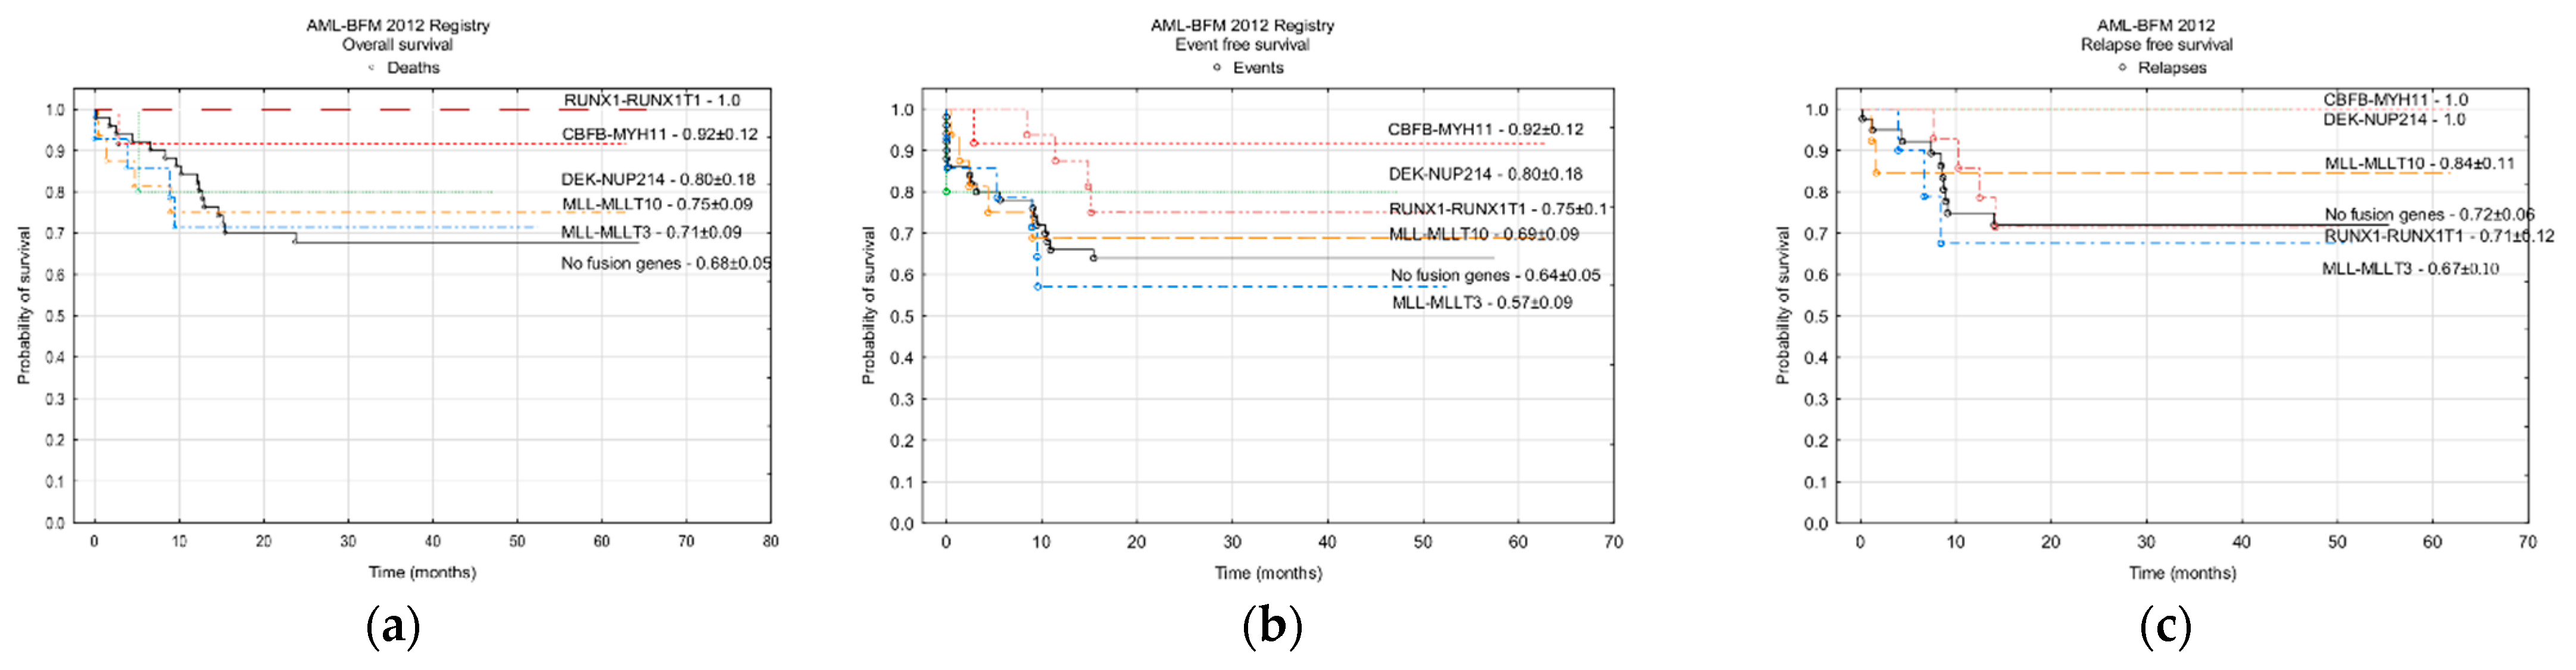
3.3.2. Fusion Genes
3.4. Prognostic Factors—Cox Regression Modelling
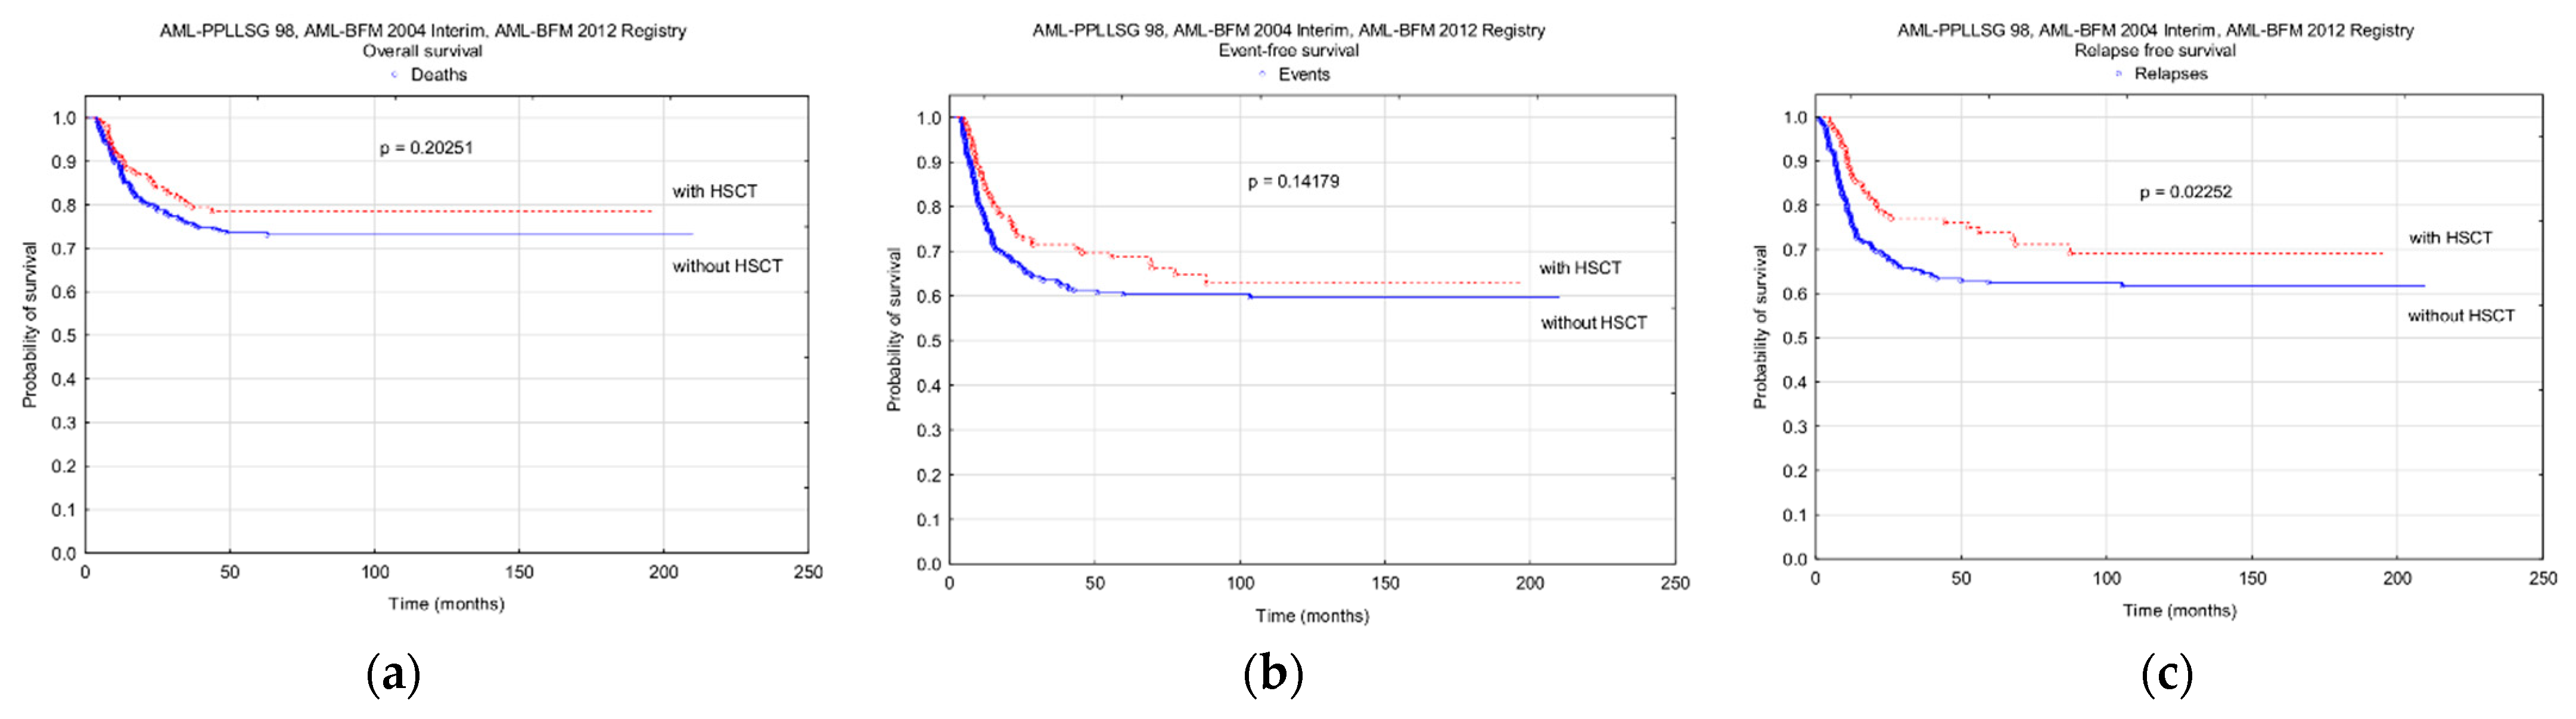
3.5. Hematopoietic Stem Cell Transplantation
4. Discussion
5. Conclusions
Supplementary Materials
Author Contributions
Funding
Institutional Review Board Statement
Informed Consent Statement
Data Availability Statement
Acknowledgments
Conflicts of Interest
References
- Zwaan, C.M.; Kolb, E.A.; Reinhardt, D.; Abrahamsson, J.; Adachi, S.; Aplenc, R.; De Bont, E.S.; De Moerloose, B.; Dworzak, M.; Gibson, B.E.; et al. Collaborative Efforts Driving Progress in Pediatric Acute Myeloid Leukemia. J. Clin. Oncol. 2015, 33, 2949–2962. [Google Scholar] [CrossRef]
- Rasche, M.; Zimmermann, M.; Borschel, L.; Bourquin, J.P.; Dworzak, M.; Klingebiel, T.; Lehrnbecher, T.; Creutzig, U.; Klusmann, J.H.; Reinhardt, D. Successes and challenges in the treatment of pediatric acute myeloid leukemia: A retrospective analysis of the AML-BFM trials from 1987 to 2012. Leukemia 2018, 32, 2167–2177. [Google Scholar] [CrossRef] [PubMed]
- Dluzniewska, A.; Polish Pediatric Leukemia/Lymphoma Study Group (PPLLSG); Balwierz, W.; Armata, J.; Balcerska, A.; Chybicka, A.; Kowalczyk, J.; Matysiak, M.; Ochocka, M.; Radwanska, U.; et al. Twenty years of Polish experience with three consecutive protocols for treatment of childhood acute myelogenous leukemia. Leukemia 2005, 19, 2117–2124. [Google Scholar] [CrossRef]
- Balwierz, W.; Pawinska-Wasikowska, K.; Klekawka, T.; Czogala, M.; Matysiak, M.; Fic-Sikorska, B.; Adamkiewicz-Drozynska, E.; Maciejka-Kapuscinska, L.; Chybicka, A.; Potocka, K.; et al. Development of treatment and clinical results in childhood acute myeloid leukemia in Poland. Memo 2013, 6, 54–62. [Google Scholar] [CrossRef] [PubMed]
- Creutzig, U.; Ritter, J.; Schellong, G. Identification of two risk groups in childhood acute myelogenous leukemia after therapy intensification in the study AML-BFM-83 as compared with study AML BFM-78. Blood 1990, 75, 1932–1940. [Google Scholar] [CrossRef] [PubMed]
- Creutzig, U.; Ritter, J.; Zimmermann, M.; Hermann, J.; Gadner, H.; Sawatzki, D.B.; Niemeyer, C.M.; Schwabe, D.; Selle, B.; Boos, J.; et al. Idarubicin improves blast cell clearance during induction therapy in children with AML: Results of study AML-BFM 93. Leukemia 2001, 15, 348–354. [Google Scholar] [CrossRef] [PubMed]
- Creutzig, U.; Ritter, J.; Zimmermann, M.; Reinhardt, D.; Hermann, J.; Berthold, F.; AML-BFM Study Group. Improved treatment results in high risk pediatric AML patients after intensification with high dose Ara-C and mitoxantrone: Results of study AML-BFM 93. J. Clin. Oncol. 2001, 19, 2705–2713. [Google Scholar] [CrossRef] [PubMed]
- Lehrnbecher, T.; Varwig, D.; Kaiser, J.; Reinhardt, D.; Klingebiel, T.; Creutzig, U. Infectious complications in pediatric acute myeloid leukemia: Analysis of the prospective multi-institutional clinical trial AML-BFM 93. Leukemia 2004, 18, 72–77. [Google Scholar] [CrossRef]
- Creutzig, U.; Zimmermann, M.; Reinhardt, D.; Dworzak, M.; Stary, J.; Lehrnbecher, T. Early deaths and treatment-related mortality in children undergoing therapy for acute myeloid leukemia: Analysis of the multicenter clinical trials AML-BFM 93 and AML-BFM 98. J. Clin. Oncol. 2004, 22, 4384–4393. [Google Scholar] [CrossRef]
- Jastaniah, W.; Abrar, M.B.; Khattab, T.M. Improved outcome in pediatric AML due to augmented supportive care. Pediatr. Blood Cancer 2012, 10, 919–921. [Google Scholar] [CrossRef]
- Bochennek, K.; Hassler, A.; Perner, C.; Gilfert, J.; Schoning, S.; Klingebiel, T.; Reinhardt, D.; Creutzig, U.; Lehrnbecher, T. Infectious complications in children with acute myeloid leukemia: Decreased mortality in multicenter trial AMLBFM 2004. Blood Cancer J. 2016, 6, e382. [Google Scholar] [CrossRef]
- von Neuhoff, C.; Reinhardt, D.; Sander, A.; Zimmermann, M.; Bradtke, J.; Betts, D.R.; Zemanova, Z.; Stary, J.; Bourquin, J.P.; Dworzak, M.N.; et al. Prognostic impact of specific chromosomal aberrations in a large group of pediatric AML patients treated uniformly according to trial AML-BFM 98. J. Clin. Oncol. 2010, 28, 2682–2689. [Google Scholar] [CrossRef]
- Creutzig, U.; Heuvel-Eibrink, M.M.V.D.; Gibson, B.; Dworzak, M.N.; Adachi, S.; De Bont, E.; Harbott, J.; Hasle, H.; Johnston, D.; Kinoshita, A.; et al. Diagnosis and management of acute myeloid leukemia in children and adolescents: Recommendations from an international expert panel. Blood 2012, 120, 3187–3205. [Google Scholar] [CrossRef]
- Betts, D.R.; Ammann, R.A.; Hirt, A.; Hengartner, H.; Beck-Popovic, M.; Kuhne, T.; Nobile, L.; Caflisch, U.; Wacker, P.; Niggli, F.K. The prognostic significance of cytogenetic aberrations in childhood acute myeloid leukaemia. A study of the Swiss Paediatric Oncology Group (SPOG). Eur. J. Haematol. 2007, 78, 468–476. [Google Scholar] [CrossRef] [PubMed]
- Harrison, C.J.; Hills, R.K.; Moorman, A.V.; Grimwade, D.J.; Hann, I.; Webb, D.K.; Wheatley, K.; de Graaf, S.S.; van den Berg, E.; Burnett, A.K.; et al. Cytogenetics of childhood acute myeloid leukemia: United Kingdom Medical Research Council Treatment trials AML 10 and 12. J. Clin. Oncol. 2010, 28, 2674–2681. [Google Scholar] [CrossRef]
- Meshinchi, S.; Alonzo, T.A.; Stirewalt, D.L.; Zwaan, M.; Zimmerman, M.; Reinhardt, D.; Kaspers, G.J.; Heerema, N.A.; Gerbing, R.; Lange, B.J.; et al. Clinical implications of FLT3 mutations in pediatric AML. Blood 2006, 108, 3654–3661. [Google Scholar] [CrossRef] [PubMed]
- Niktoreh, N.; Walter, C.; Zimmermann, M.; von Neuhoff, C.; von Neuhoff, N.; Rasche, M.; Waack, K.; Creutzig, U.; Hanenberg, H.; Reinhardt, D. Mutated WT1, FLT3-ITD, and NUP98-NSD1 Fusion in Various Combinations Define a Poor Prognostic Group in Pediatric Acute Myeloid Leukemia. J. Oncol. 2019, 2019, 1609128. [Google Scholar] [CrossRef] [PubMed]
- Quessada, J.; Cuccuini, W.; Saultier, P.; Loosveld, M.; Harrison, C.J.; Lafage-Pochitaloff, M. Cytogenetics of Pediatric Acute Myeloid Leukemia: A Review of the Current Knowledge. Genes 2021, 12, 924. [Google Scholar] [CrossRef]
- Creutzig, U.; Zimmermann, M.; Bourquin, J.-P.; Dworzak, M.N.; Fleischhack, G.; Graf, N.; Klingebiel, T.; Kremens, B.; Lehrnbecher, T.; Von Neuhoff, C.; et al. Randomized trial comparing liposomal daunorubicin with idarubicin as induction for pediatric acute myeloid leukemia: Results from Study AML-BFM 2004. Blood 2013, 122, 37–43. [Google Scholar] [CrossRef] [PubMed]
- Waack, K.; Schneider, M.; Walter, C.; Creutzig, U.; Klusmann, J.-H.; Rasche, M.; Boztug, H.; Jansen, K.; Escherich, G.; Frühwald, M.; et al. Improved Outcome in Pediatric AML—The AML-BFM 2012 Study. Blood 2020, 136 (Suppl. 1), 12–14. [Google Scholar] [CrossRef]
- Stone, R.M.; Mandrekar, S.J.; Sanford, B.L.; Laumann, K.; Geyer, S.; Bloomfield, C.D.; Thiede, C.; Prior, T.W.; Döhner, K.; Marcucci, G.; et al. Midostaurin plus chemotherapy for acute myeloid leukemia with a FLT3 mutation. N. Engl. J. Med. 2017, 377, 454–464. [Google Scholar] [CrossRef]
- Zwaan, C.M.; Söderhäll, S.; Brethon, B.; Luciani, M.; Rizzari, C.; Stam, R.W.; Besse, E.; Dutreix, C.; Fagioli, F.; Ho, P.A.; et al. A phase 1/2, open-label, dose-escalation study of midostaurin in children with relapsed or refractory acute leukaemia. Br. J. Haematol. 2019, 185, 623–627. [Google Scholar] [CrossRef]
- Chen, J.; Glasser, C.L. New and Emerging Targeted Therapies for Pediatric Acute Myeloid Leukemia (AML). Children 2020, 7, 12. [Google Scholar] [CrossRef]
- Creutzig, U.; Zimmermann, M.; Bourquin, J.-P.; Dworzak, M.N.; Von Neuhoff, C.; Sander, A.; Schrauder, A.; Teigler-Schlegel, A.; Starý, J.; Corbacioglu, S.; et al. Second induction with high-dose cytarabine and mitoxantrone: Different impact on pediatric AML patients with t(8;21) and with inv(16). Blood 2011, 118, 5409–5415. [Google Scholar] [CrossRef] [PubMed][Green Version]
- Rubnitz, J.E.; Raimondi, S.C.; Halbert, A.R.; Tong, X.; Srivastava, D.K.; Razzouk, B.I.; Pui, C.H.; Downing, J.R.; Ribeiro, R.C.; Behm, F.G. Characteristics and outcome of t(8;21)-positive childhood acute myeloid leukemia: A single institution’s experience. Leukemia 2002, 16, 2072–2077. [Google Scholar] [CrossRef] [PubMed]
- Ksiazek, T.; Czogala, M.; Kaczowka, P.; Sadowska, B.; Pawinska-Wasikowska, K.; Bik-Multanowski, M.; Sikorska-Fic, B.; Matysiak, M.; Skalska-Sadowska, J.; Wachowiak, J.; et al. High Frequency of Fusion Gene Transcript Resulting From t(10;11)(p12;q23) Translocation in Pediatric Acute Myeloid Leukemia in Poland. Front. Pediatr. 2020, 8, 278. [Google Scholar] [CrossRef]
- Balgobind, B.V.; Raimondi, S.C.; Harbott, J.; Zimmermann, M.; Alonzo, T.A.; Auvrignon, A.; Beverloo, H.B.; Chang, M.; Creutzig, U.; Dworzak, M.N.; et al. Novel prognostic subgroups in childhood 11q23/MLL-rearranged acute myeloid leukemia: Results of an international retrospective study. Blood 2009, 114, 2489–2496. [Google Scholar] [CrossRef] [PubMed]
- Tarlock, K.; Alonzo, T.A.; Moraleda, P.P.; Gerbing, R.B.; Raimondi, S.C.; Hirsch, B.A.; Ravindranath, Y.; Lange, B.; Woods, W.G.; Gamis, A.S.; et al. Acute myeloid leukaemia (AML) with t(6;9)(p23;q34) is associated with poor outcome in childhood AML regardless of FLT3-ITD status: A report from the Children’s Oncology Group. Br. J. Haematol. 2014, 166, 254–259. [Google Scholar] [CrossRef]
- Ishiyama, K.; Takami, A.; Kanda, Y.; Nakao, S.; Maeda, T.; Naoe, T.; Tanigcuhi, S.; Kawa, K.; Nagamura, T.; Tabuchi, K.; et al. Prognostic factors for acute myeloid leukemia patients with t(6;9)(p23;q34) who underwent an allogeneic hematopoietic stem cell transplant. Leukemia 2012, 26, 1416–1419. [Google Scholar] [CrossRef] [PubMed][Green Version]
- Gibson, B.E.S.; Sauer, M.G.; Amrolia, P. Acute Myeloid Leukemia in Children. In The EBMT Handbook: Hematopoietic Stem Cell Transplantation and Cellular Therapies, 7th ed.; Springer: Cham, Switzerland, 2019; Chapter 70. Available online: https://www.ncbi.nlm.nih.gov/books/NBK554022/ (accessed on 15 July 2021).
- Wilhelmsson, M.; Glosli, H.; Ifversen, M.; Abrahamsson, J.; Winiarski, J.; Jahnukainen, K.; Hasle, H. Long-term health outcomes in survivors of childhood AML treated with allogeneic HSCT: A NOPHO–AML Study. Bone Marrow Transplant. 2019, 54, 726–736. [Google Scholar] [CrossRef] [PubMed]
- Locatelli, F.; AIEOP BMT Working Group; Masetti, R.; Rondelli, R.; Zecca, M.; Fagioli, F.; Rovelli, A.; Messina, C.; Lanino, E.; Bertaina, A.; et al. Outcome of children with high-risk acute myeloid leukemia given autologous or allogeneic hematopoietic cell transplantation in the aieop AML-2002/01 study. Bone Marrow Transplant. 2015, 50, 181–188. [Google Scholar] [CrossRef] [PubMed]
- Doherty, E.; Redell, M.; Sasa, G.; Yassine, K.; John, T.D.; Craddock, J.; Wu, M.; Wang, T.; Martinez, C.A.; Krance, R.A.; et al. Outcomes after Allogeneic Hematopoietic Stem Cell Transplantation for Pediatric Acute Myeloid Leukemia in the Contemporary Era. Blood 2019, 134 (Suppl. 1). [Google Scholar] [CrossRef]


| Protocol | AML-PPLLSG 83 | AML-PPLLSG 94 | AML-PPLLSG 98 | AML-BFM 2004 Interim | AML-BFM 2012 Registry |
|---|---|---|---|---|---|
| Period | 1983–1993 | 1994–1997 | 1998–2003 | 2004–2014 | 2015–2019 |
| Follow-up end-point | 31/03/2002 | 31/03/2002 | 31/07/2015 | 31/12/2020 | 31/12/2020 |
| Median observation time (months) | 128 | 93 | 119 | 90 | 37 |
| Number of patients | 187 | 74 | 151 | 356 | 131 |
| Age median/range (years) | 8.2/0.1–16.7 | 10.0/0.4–16.5 | 8.4/0–17.7 | 10.6/0–18 | 7.8/0.1–17.9 |
| Gender male/female | 93/94 | 36/38 | 87/64 | 184/172 | 73/58 |
| CNS involvement | 10 (5.3) | 5 (6.7) | 7 (5.8) | 40 (11.2) | 13 (9.9) |
| Extramedullary organ involvement | 40 (21.4) | 14 (18.9) | 31 (20.5) | 88 (24.7) | 23 (17.5) |
| FAB types | |||||
| M0 | 0 (0) | 3 (4.0) | 12 (8.1) | 28 (8.1) | 2 (1,7) |
| M1 | 44 (23.5) | 12 (16.2) | 27 (18.2) | 55 (16.0) | 10 (8.3) |
| M2 | 54 (28.9) | 24 (32.4) | 52 (35.1) | 94 (27.3) | 36 (30.0) |
| M4 | 50 (26.7) | 18 (24.3) | 29 (19.6) | 71 (20.6) | 18 (15.0) |
| M5 | 30 (16.0) | 11 (14.9) | 19 (12.8) | 70 (20.3) | 39 (32.5) |
| M6 | 8 (4.3) | 3 (4.0) | 6 (4.1) | 5 (1.4) | 1 (8.3) |
| M7 | 1 (0.5) | 1 (1.3) | 3 (2.0) | 21 (6.1) | 14 (11.7) |
| Non defined | 0 (0) | 2 (2.7) | 3 (2.0) | 12 (3.5) | 11 (9.2) |
| Risk groups | |||||
| SR | - | 30 (40.6) | 78 (51.7) | 71 (19.9) | 25 (18.5) |
| IR | - | - | - | - | 52 (40.0) |
| HR | - | 36 (48.6) | 65 (43.0) | 284 (79.8) | 52 (40.0) |
| Unknown | - | 8 (10.8) | 8 (5.3) | 1 (0.3) | 2 (1.5) |
| Protocol | AML-PPLLSG 83 | AML-PPLLSG 94 | AML-PPLLSG 98 | AML-BFM 2004 Interim | AML-BFM 2012 Registry |
|---|---|---|---|---|---|
| CNS irradiation | |||||
| Cycle | Consolidation phase 2 | SR Consolidation phase 2 | SR and HR during maintenance | No prophylactic CNS irradiation | |
| HR short postremission block | |||||
| Doses | 0–1 years 12 Gy, 1–2 years 15 Gy, >2 years 18 Gy | 0-1 years 12 Gy, 1–2 years 15 Gy, >2 years 18 Gy | 0–1 years no irradiation, 1–2 years 15 Gy, >2 years 18 Gy | <15 months no irradiation, 15 to <24 months 15 Gy, ≥24 months 18 Gy | No prophylactic CNS irradiation |
| Intrathecal therapy | |||||
| Cycle | consolidation phase 2 days 31, 38, 45, and 51 | SR: consolidation phase 2 days 31, 38, 45, and 51 | SR: AIE days 1 and 8, AI days 1 and 6, haM days 0 and 6, HAE day 0; maintenance treatment once a week for the first 4 weeks | cytarabine monotherapy: HAM, hAM, and HAE day 1 triple therapy (cytarabine, methotrexate, and prednizon): AIE days 1 and 8, AI or AI/2-CDA day 1, maintenance therapy days 1, 14, 28, and 42 | |
| HR additional doses during AD and AE, and on days 1, 8, and 15 of a short postremission block | HR: additional dose HAM day 0 | ||||
| Protocol | AML-PPLLSG 94 | AML-PPLLSG 98 | AML-BFM 2004 Interim | AML-BFM 2012 Registry |
|---|---|---|---|---|
| SRG | FAB other than M5 and <5% blasts in BM on day 15 | FAB other than M5, <5% blasts in BM on day 15, no increase in blast count after day 15 | M1/M2 with Auer rods a,b AML with t(8;21) a,b M4Eo with inv16 a,b | t(8;21), inv(16), t(1;11), NPM1, CEBPαdm c |
| IRG | - | - | - | All others d |
| HRG | All other patients | All other patients | M0 M1/M2 without Auer rods M4, M5, M6 and M7 | t(4;11), t(5;11), t(6;11), t(10;11), t(6;9), t(7;12), der12p, isolated monosomy 7, t(9;22), FLT3-ITD-WT1mut, complex karyotype |
| Protocol | AML-PPLLSG 83 N = 187 | AML-PPLLSG 94 N = 74 | AML-PPLLSG 98 N = 151 | AML-BFM 2004 Interim N = 356 | AML-BFM 2012 Registry N = 131 |
|---|---|---|---|---|---|
| Indication for HSCT in the I CR | Very limited access | SRG and HRG: recommended but limited access | SRG: not recommended; HRG: recommended | Allo MSD HSCT: all HRG patients Allo MUD-HSCT: children with >5% of blasts or still in aplasia 4 weeks after second induction | Allo MSD/MUD HSCT: all HRG patients |
| Number of patients with indications (OS < 4 months and death without CR excluded) | 52 | 245 | 43 | ||
| HSCT in I CR (% of all patients/ % of patients with indications) | 6 (3) | 13 (18) | 20 (13/38) | 100 (28/41) | 37 (28/86) |
| Auto-HSCT Allo-HSCT MSD (% of allo) MUD (% of allo) MMD (% of allo) Haplo (% of allo) No data | 0 6 nd nd nd nd 6 | 5 8 nd nd nd nd 8 | 9 11 nd nd nd nd 11 | 1 99 50 (53) 20 (21 3 (3) 0 26 | 0 37 6 (16) 22 (59) 1 (3) 2 (5) 6 |
| Protocol | AML-BFM 2004 Interim N = 356 | AML-BFM 2012 Registry N = 131 |
|---|---|---|
| Fusion genes—number of results (%) | 292 (82) | 125 (95.4) |
| Number of positive results (% of available results) | ||
| RUNX1-RUNX1T1/t(8;21)(q22;q22) | 51 (17.5) | 16 (12.8) |
| CBFβ-MYH11/inv(16)(p13;q22) | 12 (4.1) | 12 (9.6) |
| All KMT2A rearangements | 41 (14.0) | 37 (29.6) |
| KMT2A-ELL/t(11;19)(q23;p13.3) | 1 (0.3) | 2 (1.6) |
| KMT2A-MLLT1/t(11;19)(q23;p13.3) | 4 (1.4) | 1 (0.8) |
| KMT2A-MLLT3/t(9;11)(p22;q23) | 7 (2.4) | 14 (11.2) |
| KMT2A-MLLT4/t(6;11)(q27;q23) | 3 (1.0) | 3 (2.4) |
| KMT2A-MLLT6/t(11;170(q23;q21) | 4 (1.4) | 0 |
| KMT2A-MLLT10/t(10;11)(p12;q23) | 7 (2.4) | 16 (12.8) |
| KMT2A-AFF1/t(4;11)(q21;q23) | 1 (0.3) | 0 |
| ETV6-MN1/t(12;22)(p13;q11) | 0 | 1 (0.8) |
| DEK-NUP214 / t(6;9)(p23;q24) | 3 (1.0) | 5 (4.0) |
| BCR-ABL1/t(9;22)(q34;q11) | 1 (0.3) | 1 (0.8) |
| FLT3-ITD—number of results (%) | 278 (78) | 129 (98) |
| Positive (% of available) | 30 (10.8) | 11 (8.5) |
| Protocol | AML-PPLLSG 83 N = 187 | AML-PPLLSG 94 N = 74 | AML-PPLLSG 98 N = 151 | AML-BFM 2004 Interim N = 356 | AML-BFM 2012 Registry N = 131 |
|---|---|---|---|---|---|
| Complete morphological remission—CR (%) | 133 (71) | 49 (66) | 127 (84) | 310 (87) | 114 (87) |
| Non-responders (%) | 9 (5) | 15 (20) | 16 (11) | 25 (7) | 9 (7) |
| Early deaths (<42 days) (%) | 45 (24) | 10 (14) | 8 (5) | 21 (6) | 8 (6) |
| Deaths in remission (%) | 21 (11) | 9 (12) | 14 (9) | 18 (5) | 2 (1.5) |
| Relapses (%) | 54 (29) | 17 (23) | 50 (33) | 110 (31) | 22 (17) |
| Continuous remission (%) | 58 (31) | 23 (31) | 63 (42) | 182 (51) | 90 (69) |
| Probability of 3-years/5-years OS ± SD | 0.34 ± 0.03/ 0.31 ± 0.03 | 0.37 ± 0.05/ 0.37 ± 0.05 | 0.54 ± 0.04/ 0.52 ± 0.04 | 0.67 ± 0.03/ 0.64 ± 0.03 | 0.75 ± 0.05/nd |
| Probability of 3-years/5-years EFS ± SD | 0.31 ± 0.03/ 0.30 ± 0.03 | 0.34 ± 0.05/ 0.33 ± 0.05 | 0.44 ± 0.04/ 0.42 ± 0.04 | 0.53 ± 0.03/ 0.51 ± 0.03 | 0.67 ± 0.05/nd |
| Probability of 3-years/5-years RFS ± SD | 0.52 ± 0.03/ 0.51 ± 0.03 | 0.65 ± 0.05/ 0.62 ± 0.05 | 0.58 ± 0.04/ 0.56 ± 0.04 | 0.66 ± 0.03/ 0.63 ± 0.03 | 0.78 ± 0.05/nd |
| Prognostic Factor: Survival Time | HR | 95% CI | p |
|---|---|---|---|
| FLT3-ITD: EFS | 2.37 | 1.59–3.53 | 0.000023 |
| FLT3-ITD: RFS | 2.65 | 1.58–4.44 | 0.000233 |
| FLT3-ITD: OS | 1.85 | 1.15–2.39 | 0.011539 |
| WT1 mutation: EFS | 3.14 | 1.44–6.88 | 0.004167 |
| WT1 mutation: RFS | 3.26 | 1.08–9.84 | 0.036058 |
| WT1 mutation: OS | 3.52 | 1.49–8.30 | 0.004035 |
| RUNX1-RUNX1T1: OS | 0.51 | 0.29–0.90 | 0.020423 |
| WBC > 100,000/µL: EFS | 1.82 | 1.38–2.40 | 0.000017 |
| WBC > 100,000/µL: RFS | 1.94 | 1.34–2.79 | 0.002167 |
| WBC > 100,000/µL: OS | 1.62 | 1.18–2.22 | 0.000363 |
Publisher’s Note: MDPI stays neutral with regard to jurisdictional claims in published maps and institutional affiliations. |
© 2021 by the authors. Licensee MDPI, Basel, Switzerland. This article is an open access article distributed under the terms and conditions of the Creative Commons Attribution (CC BY) license (https://creativecommons.org/licenses/by/4.0/).
Share and Cite
Czogała, M.; Balwierz, W.; Pawińska-Wąsikowska, K.; Książek, T.; Bukowska-Strakova, K.; Czogała, W.; Sikorska-Fic, B.; Matysiak, M.; Skalska-Sadowska, J.; Wachowiak, J.; et al. Advances in the First Line Treatment of Pediatric Acute Myeloid Leukemia in the Polish Pediatric Leukemia and Lymphoma Study Group from 1983 to 2019. Cancers 2021, 13, 4536. https://doi.org/10.3390/cancers13184536
Czogała M, Balwierz W, Pawińska-Wąsikowska K, Książek T, Bukowska-Strakova K, Czogała W, Sikorska-Fic B, Matysiak M, Skalska-Sadowska J, Wachowiak J, et al. Advances in the First Line Treatment of Pediatric Acute Myeloid Leukemia in the Polish Pediatric Leukemia and Lymphoma Study Group from 1983 to 2019. Cancers. 2021; 13(18):4536. https://doi.org/10.3390/cancers13184536
Chicago/Turabian StyleCzogała, Małgorzata, Walentyna Balwierz, Katarzyna Pawińska-Wąsikowska, Teofila Książek, Karolina Bukowska-Strakova, Wojciech Czogała, Barbara Sikorska-Fic, Michał Matysiak, Jolanta Skalska-Sadowska, Jacek Wachowiak, and et al. 2021. "Advances in the First Line Treatment of Pediatric Acute Myeloid Leukemia in the Polish Pediatric Leukemia and Lymphoma Study Group from 1983 to 2019" Cancers 13, no. 18: 4536. https://doi.org/10.3390/cancers13184536
APA StyleCzogała, M., Balwierz, W., Pawińska-Wąsikowska, K., Książek, T., Bukowska-Strakova, K., Czogała, W., Sikorska-Fic, B., Matysiak, M., Skalska-Sadowska, J., Wachowiak, J., Moj-Hackemer, M., Kałwak, K., Muszyńska-Rosłan, K., Krawczuk-Rybak, M., Grabowski, D., Kowalczyk, J., Maciejka-Kembłowska, L., Irga-Jaworska, N., Bobeff, K., ... Skoczeń, S. (2021). Advances in the First Line Treatment of Pediatric Acute Myeloid Leukemia in the Polish Pediatric Leukemia and Lymphoma Study Group from 1983 to 2019. Cancers, 13(18), 4536. https://doi.org/10.3390/cancers13184536