
The Clinical Utility of Optical Genome Mapping for the Assessment of Genomic Aberrations in Acute Lymphoblastic Leukemia

 ,
,  , ,
, ,
Abstract
Simple Summary
Abstract
1. Introduction
2. Materials and Methods
2.1. Isolation of Ultra-High Molecular Weight (UHMW) gDNA
2.2. DNA Quantification
2.3. Labeling of UHMW gDNA and Chip Loading
2.4. Assemblies and Variant Calling
2.5. Data Comparison
3. Results
3.1. Patients 1–5
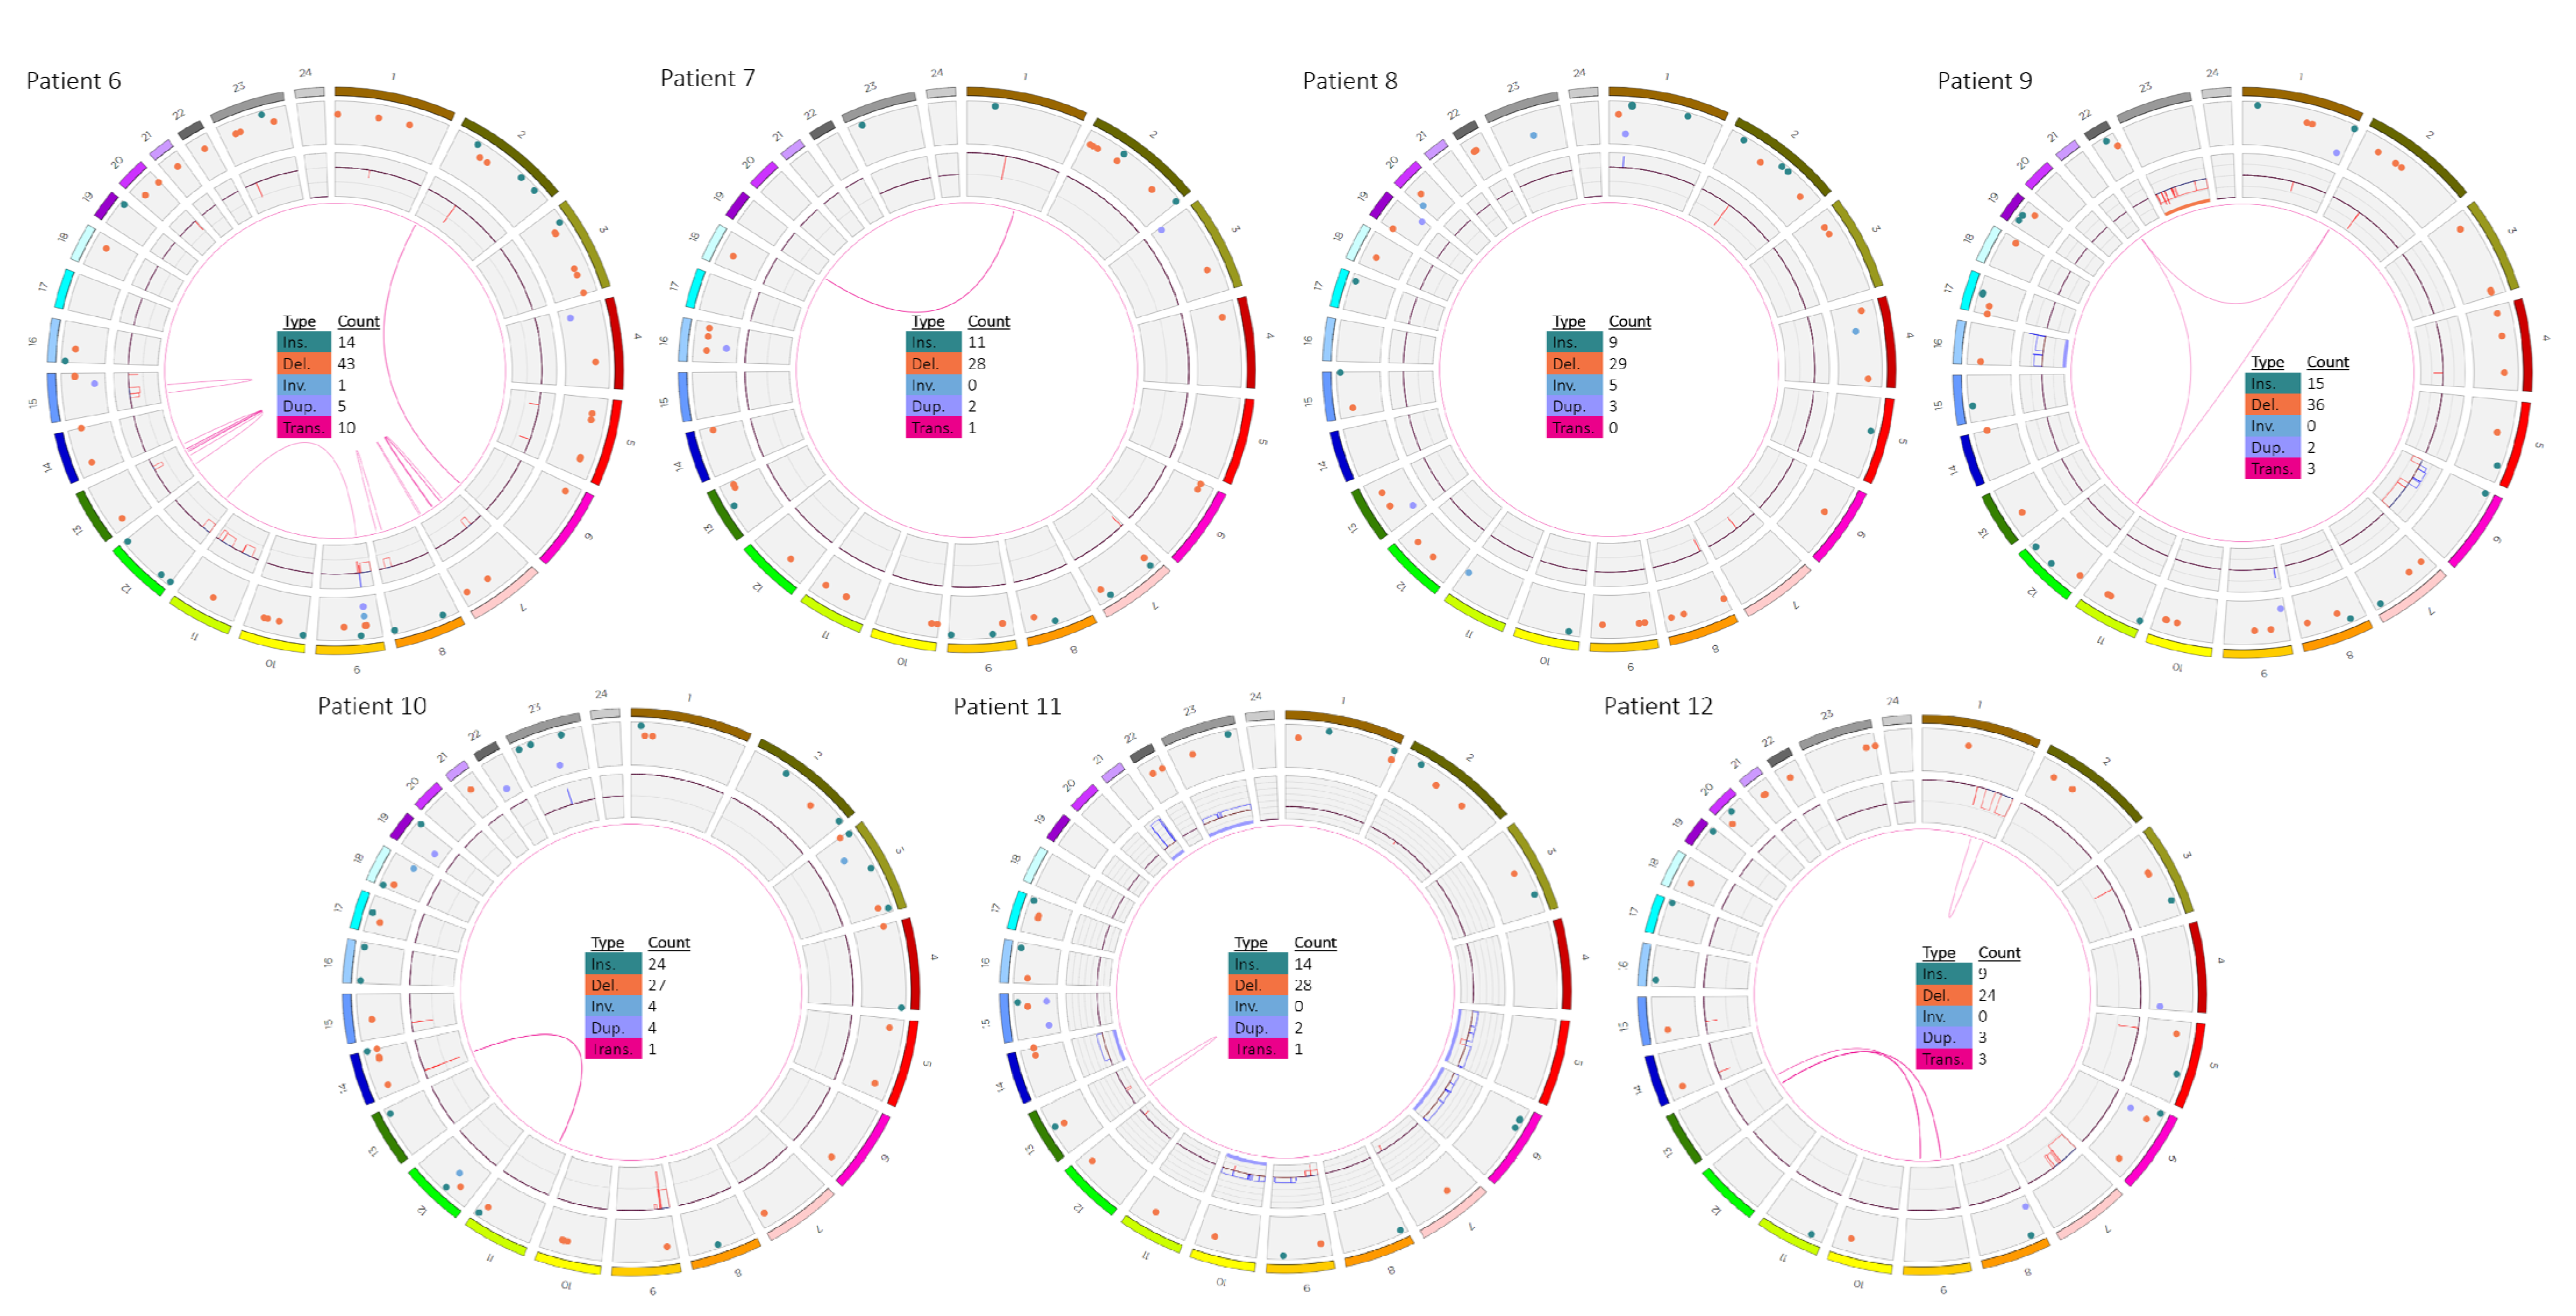
3.2. Patients 6–12
4. Discussion
4.1. IKZF1 Deletion
4.2. Translocations and Fusions
4.3. Dicentric Chromosomes
4.4. CNV Resolution
4.5. Advantages and Limitations of OGM
5. Conclusions
Supplementary Materials
Author Contributions
Funding
Institutional Review Board Statement
Informed Consent Statement
Data Availability Statement
Acknowledgments
Conflicts of Interest
References
- Larsen:, E.C.; Devidas, M.; Chen, S.; Salzer, W.L.; Raetz, E.A.; Loh, M.L.; Mattano, L.A., Jr.; Cole, C.; Eicher, A.; Haugan, M.; et al. Dexamethasone and High-Dose Methotrexate Improve Outcome for Children and Young Adults With High-Risk B-Acute Lymphoblastic Leukemia: A Report From Children’s Oncology Group Study aall0232. Clin. Oncol. 2016, 34, 2380–2388. [Google Scholar] [CrossRef] [PubMed]
- Möricke, A.; Zimmermann, M.; Valsecchi, M.G.; Stanulla, M.; Biondi, A.; Mann, G.; Locatelli, F.; Cazzaniga, G.; Niggli, F.; Aricò, M.; et al. Dexamethasone vs prednisone in induction treatment of pediatric ALL: Results of the randomized trial AIEOP-BFM all 2000. Blood 2016, 127, 2101–2112. [Google Scholar] [CrossRef]
- Schmiegelow, K.; Levinsen, M.F.; Attarbaschi, A.; Baruchel, A.; Devidas, M.; Escherich, G.; Gibson, B.; Heydrich, C.; Horibe, K.; Ishida, Y.; et al. Second Malignant Neoplasms After Treatment of Childhood Acute Lymphoblastic Leukemia. J. Clin. Oncol. 2013, 31, 2469–2476. [Google Scholar] [CrossRef] [PubMed]
- Schrappe, M.; Valsecchi, M.G.; Bartram, C.R.; Schrauder, A.; Panzer-Grümayer, R.; Möricke, A.; Parasole, R.; Zimmermann, M.; Dworzak, M.; Buldini, B.; et al. Late MRD response determines relapse risk overall and in subsets of childhood T-cell ALL: Results of the AIEOP-BFM-ALL 2000 study. Blood 2011, 118, 2077–2084. [Google Scholar] [CrossRef] [PubMed]
- Aricò, M.; Schrappe, M.; Hunger, S.P.; Carroll, W.L.; Conter, V.; Galimberti, S.; Manabe, A.; Saha, V.; Baruchel, A.; Vettenranta, K.; et al. Clinical Outcome of Children With Newly Diagnosed Philadelphia Chromosome–Positive Acute Lymphoblastic Leukemia Treated Between 1995 and 2005. J. Clin. Oncol. 2010, 28, 4755–4761. [Google Scholar] [CrossRef] [PubMed]
- Fischer, U.; Forster, M.; Rinaldi, A.; Risch, T.; Sungalee, S.; Warnatz, H.-J.; Bornhauser, B.; Gombert, M.; Kratsch, C.; Stütz, A.M.; et al. Genomics and drug profiling of fatal TCF3-HLF-positive acute lymphoblastic leukemia identifies recurrent mutation patterns and therapeutic options. Nat. Genet. 2015, 47, 1020–1029. [Google Scholar] [CrossRef]
- Holmfeldt, L.; Wei, L.; Diaz-Flores, E.; Walsh, M.; Zhang, J.; Ding, L.; Payne-Turner, D.; Churchman, M.; Andersson, A.; Chen, S.-C.; et al. The genomic landscape of hypodiploid acute lymphoblastic leukemia. Nat. Genet. 2013, 45, 242–252. [Google Scholar] [CrossRef]
- Mullighan, C.G.; Goorha, S.; Radtke, I.; Miller, C.B.; Coustan-Smith, E.; Dalton, J.D.; Girtman, K.; Mathew, S.; Ma, J.; Pounds, S.B.; et al. Genome-wide analysis of genetic alterations in acute lymphoblastic leukaemia. Nature 2007, 446, 758–764. [Google Scholar] [CrossRef]
- Forestier, E.; Heyman, M.; Andersen, M.K.; Autio, K.; Blennow, E.; Borgström, G.; Golovleva, I.; Heim, S.; Heinonen, K.; Hovland, R.; et al. Outcome of ETV6/RUNX1-positive childhood acute lymphoblastic leukaemia in the NOPHO-ALL-1992 protocol: Frequent late relapses but good overall survival. Br. J. Haematol. 2008, 140, 665–672. [Google Scholar] [CrossRef]
- Bhojwani, D.; Pei, D.; Sandlund, J.T.; Jeha, S.; Ribeiro, R.C.; Rubnitz, J.E.; Raimondi, S.C.; Shurtleff, S.; Onciu, M.; Cheng, C.; et al. ETV6-RUNX1-positive childhood acute lymphoblastic leukemia: Improved outcome with contemporary therapy. Leukemia 2012, 26, 265–270. [Google Scholar] [CrossRef]
- Schrappe, M.; Bleckmann, K.; Zimmermann, M.; Biondi, A.; Möricke, A.; Locatelli, F.; Cario, G.; Rizzari, C.; Attarbaschi, A.; Valsecchi, M.G.; et al. Reduced-Intensity Delayed Intensification in Standard-Risk Pediatric Acute Lymphoblastic Leukemia Defined by Undetectable Minimal Residual Disease: Results of an International Randomized Trial (AIEOP-BFM ALL 2000). J. Clin. Oncol. 2018, 36, 244–253. [Google Scholar] [CrossRef]
- Roberts, K.G.; Pei, D.; Campana, D.; Payne-Turner, D.; Li, Y.; Cheng, C.; Sandlund, J.T.; Jeha, S.; Easton, J.; Becksfort, J.; et al. Outcomes of Children With BCR-ABL1–Like Acute Lymphoblastic Leukemia Treated With Risk-Directed Therapy Based on the Levels of Minimal Residual Disease. J. Clin. Oncol. 2014, 32, 3012–3020. [Google Scholar] [CrossRef]
- Cario, G.; Leoni, V.; Conter, V.; Attarbaschi, A.; Zaliova, M.; Sramkova, L.; Cazzaniga, G.; Fazio, G.; Sutton, R.; Elitzur, S.; et al. Relapses and treatment-related events contributed equally to poor prognosis in children with ABL-class fusion positive B-cell acute lymphoblastic leukemia treated according to AIEOP-BFM protocols. Haematologica 2020, 105, 1887–1894. [Google Scholar] [CrossRef]
- Brown, P.A.; Kairalla, J.A.; Hilden, J.M.; Dreyer, Z.E.; Carroll, A.J.; Heerema, N.A.; Wang, C.; Devidas, M.; Gore, L.; Salzer, W.L.; et al. Flt3 inhibitor lestaurtinib plus chemotherapy for newly diagnosed kmt2a-rearranged infant acute lymphoblastic leukemia: Children’s oncology group trial AALL0631. Leukemia 2021, 35, 1279–1290. [Google Scholar] [CrossRef] [PubMed]
- Li, J.-F.; Dai, Y.-T.; Lilljebjörn, H.; Shen, S.-H.; Cui, B.-W.; Bai, L.; Liu, Y.-F.; Qian, M.-X.; Kubota, Y.; Kiyoi, H.; et al. Transcriptional landscape of B cell precursor acute lymphoblastic leukemia based on an international study of 1223 cases. Proc. Natl. Acad. Sci. USA 2018, 115, E11711–E11720. [Google Scholar] [CrossRef] [PubMed]
- Den Boer, M.L.; Cario, G.; Moorman, A.V.; Boer, J.M.; de Groot-Kruseman, H.A.; Fiocco, M.; Escherich, G.; Imamura, T.; Yeoh, A.; Sutton, R.; et al. Outcomes of paediatric patients with B-cell acute lymphocytic leukaemia with ABL-class fusion in the pre-tyrosine-kinase inhibitor era: A multicentre, retrospective, cohort study. Lancet Haematol. 2021, 8, e55–e66. [Google Scholar] [CrossRef]
- Hamadeh, L.; Enshaei, A.; Schwab, C.; Alonso, C.N.; Attarbaschi, A.; Barbany, G.; den Boer, M.L.; Boer, J.M.; Braun, M.; Dalla Pozza, L.; et al. Validation of the United Kingdom copy-number alteration classifier in 3239 children with B-cell precursor ALL. Blood Adv. 2019, 3, 148–157. [Google Scholar] [CrossRef]
- Stanulla, M.; Dagdan, E.; Zaliova, M.; Möricke, A.; Palmi, C.; Cazzaniga, G.; Eckert, C.; Te Kronnie, G.; Bourquin, J.P.; Bornhauser, B.; et al. IKZF1(plus) Defines a New Minimal Residual Disease–Dependent Very-Poor Prognostic Profile in Pediatric B-Cell Precursor Acute Lymphoblastic Leukemia. J. Clin. Oncol. 2018, 36, 1240–1249. [Google Scholar] [CrossRef] [PubMed]
- Chan, S.; Lam, E.; Saghbini, M.; Bocklandt, S.; Hastie, A.; Cao, H.; Holmlin, E.; Borodkin, M. Structural Variation Detection and Analysis Using Bionano Optical Mapping. Methods Mol. Biol. 2018, 1833, 193–203. [Google Scholar] [CrossRef]
- Chan, E.K.F.; Cameron, D.L.; Petersen, D.C.; Lyons, R.J.; Baldi, B.F.; Papenfuss, A.T.; Thomas, D.M.; Hayes, V.M. Optical mapping reveals a higher level of genomic architecture of chained fusions in cancer. Genome Res. 2018, 28, 726–738. [Google Scholar] [CrossRef]
- Eisfeldt, J.; Pettersson, M.; Vezzi, F.; Wincent, J.; Käller, M.; Gruselius, J.; Nilsson, D.; Syk Lundberg, E.; Carvalho, C.M.B.; Lindstrand, A. Comprehensive structural variation genome map of individuals carrying complex chromosomal rearrangements. PLoS Genet. 2019, 15, e1007858. [Google Scholar] [CrossRef]
- Neveling, K.; Mantere, T.; Vermeulen, S.; Oorsprong, M.; van Beek, R.; Kater-Baats, E.; Pauper, M.; van der Zande, G.; Smeets, D.; Weghuis, D.O.; et al. Next generation cytogenetics: Comprehensive assessment of 52 hematological malignancy genomes by genome imaging. Am. J. Hum. Genet. 2021, 108, 1423–1435. [Google Scholar] [CrossRef]
- Schieck, M.; Lentes, J.; Thomay, K.; Hofmann, W.; Behrens, Y.L.; Hagedorn, M.; Ebersold, J.; Davenport, C.F.; Fazio, G.; Möricke, A.; et al. Implementation of RNA sequencing and array CGH in the diagnostic workflow of the AIEOP-BFM ALL 2017 trial on acute lymphoblastic leukemia. Ann. Hematol. 2020, 99, 809–818. [Google Scholar] [CrossRef]
- Lestringant, V.; Duployez, N.; Penther, D.; Luquet, I.; Derrieux, C.; Lutun, A.; Preudhomme, C.; West, M.; Ouled-Haddou, H.; Devoldere, C.; et al. Optical genome mapping, a promising alternative to gold standard cytogenetic approaches in a series of acute lymphoblastic leukemias. Genes Chromosom. Cancer 2021. [Google Scholar] [CrossRef]
- Roberts, K.G.; Li, Y.; Payne-Turner, D.; Harvey, R.C.; Yang, Y.-L.; Pei, D.; McCastlain, K.; Ding, L.; Lu, C.; Song, G.; et al. Targetable Kinase-Activating Lesions in Ph-like Acute Lymphoblastic Leukemia. N. Engl. J. Med. 2014, 371, 1005–1015. [Google Scholar] [CrossRef] [PubMed]
- Chen, X.; Wang, F.; Zhang, Y.; Ma, X.; Liu, M.; Cao, P.; Zhou, L.; Wang, L.; Zhang, X.; Wang, T.; et al. Identification of RNPC3 as a novel JAK2 fusion partner gene in B-acute lymphoblastic leukemia refractory to combination therapy including ruxolitinib. Mol. Genet. Genom. Med. 2020, 8, e1110. [Google Scholar] [CrossRef]
- Ding, Y.-Y.; Stern, J.W.; Jubelirer, T.F.; Wertheim, G.B.; Lin, F.; Chang, F.; Gu, Z.; Mullighan, C.G.; Li, Y.; Harvey, R.C.; et al. Clinical efficacy of ruxolitinib and chemotherapy in a child with Philadelphia chromosome-like acute lymphoblastic leukemia with GOLGA5-JAK2 fusion and induction failure. Haematologica 2018, 103, e427–e431. [Google Scholar] [CrossRef]
- Wouters, Y.; Nevejan, L.; Louwagie, A.; Devos, H.; Dewaele, B.; Selleslag, D.; Michaux, L. Efficacy of ruxolitinib in B-lymphoblastic leukaemia with the PCM1–JAK2 fusion gene. Br. J. Haematol. 2021, 192, e112–e115. [Google Scholar] [CrossRef] [PubMed]
- Maude, S.L.; Tasian, S.K.; Vincent, T.; Hall, J.W.; Sheen, C.; Roberts, K.G.; Seif, A.E.; Barrett, D.M.; Chen, I.M.; Collins, J.R.; et al. Targeting jak1/2 and mtor in murine xenograft models of ph-like acute lymphoblastic leukemia. Blood 2012, 120, 3510–3518. [Google Scholar] [CrossRef] [PubMed]
- Carroll, M.; Ohno-Jones, S.; Tamura, S.; Buchdunger, E.; Zimmermann, J.; Lydon, N.B.; Gilliland, D.G.; Druker, B.J. Cgp 57148, a tyrosine kinase inhibitor, inhibits the growth of cells expressing bcr-abl, tel-abl, and tel-pdgfr fusion proteins. Blood 1997, 90, 4947–4952. [Google Scholar] [CrossRef]
- Zaliova, M.; Moorman, A.V.; Cazzaniga, G.; Stanulla, M.; Harvey, R.C.; Roberts, K.G.; Heatley, S.L.; Loh, M.L.; Konopleva, M.; Chen, I.-M.; et al. Characterization of leukemias with ETV6-ABL1 fusion. Haematologica 2016, 101, 1082–1093. [Google Scholar] [CrossRef] [PubMed]
- Yoshida, M.; Kato, M. Genetic basis of subsequent malignant neoplasms. Rinsho Ketsueki 2020, 61, 1174–1178. [Google Scholar] [PubMed]
- Dreisig, K.; Brünner, E.D.; Marquart, H.V.; Helt, L.R.; Nersting, J.; Frandsen, T.L.; Jonsson, O.G.; Taskinen, M.; Vaitkeviciene, G.; Lund, B.; et al. TPMT polymorphisms and minimal residual disease after 6-mercaptopurine post-remission consolidation therapy of childhood acute lymphoblastic leukaemia. Pediatr. Hematol. Oncol. 2020, 138, 227–238. [Google Scholar] [CrossRef]
- Stanulla, M.; Schaeffeler, E.; Flohr, T.; Cario, G.; Schrauder, A.; Zimmermann, M.; Welte, K.; Ludwig, W.D.; Bartram, C.R.; Zanger, U.M.; et al. Thiopurine methyltransferase (tpmt) genotype and early treatment response to mercaptopurine in childhood acute lymphoblastic leukemia. JAMA 2005, 293, 1485–1489. [Google Scholar] [CrossRef]
- Clark, R.; Byatt, S.-A.; Bennett, C.F.; Brama, M.; Martineau, M.; Moorman, A.V.; Roberts, K.; Secker-Walker, L.M.; Richards, S.; Eden, O.B.; et al. Monosomy 20 as a pointer to dicentric (9;20) in acute lymphoblastic leukemia. Leukemia 2000, 14, 241–246. [Google Scholar] [CrossRef][Green Version]
- Zachariadis, V.; Gauffin, F.; Kuchinskaya, E.; Heyman, M.; Schoumans, J.; Blennow, E.; Gustafsson, B.; Barbany, G.; Golovleva, I.; Ehrencrona, H.; et al. The frequency and prognostic impact of dic(9;20)(p13.2;q11.2) in childhood B-cell precursor acute lymphoblastic leukemia: Results from the NOPHO ALL-2000 trial. Leukemia 2011, 25, 622–628. [Google Scholar] [CrossRef]
- Pichler, H.; Möricke, A.; Mann, G.; Teigler-Schlegel, A.; Niggli, F.; Nebral, K.; König, M.; Inthal, A.; Krehan, D.; Dworzak, M.N.; et al. Prognostic relevance of dic(9;20)(p11;q13) in childhood B-cell precursor acute lymphoblastic leukaemia treated with Berlin-Frankfurt-Münster (BFM) protocols containing an intensive induction and post-induction consolidation therapy. Br. J. Haematol. 2010, 149, 93–100. [Google Scholar] [CrossRef] [PubMed]
- An, Q.; Wright, S.L.; Moorman, A.V.; Parker, H.; Griffiths, M.; Ross, F.M.; Davies, T.; Harrison, C.J.; Strefford, J.C. Heterogeneous breakpoints in patients with acute lymphoblastic leukemia and the dic(9;20)(p11 13;q11) show recurrent involvement of genes at 20q11.21. Haematologica 2009, 94, 1164–1169. [Google Scholar] [CrossRef][Green Version]
- Letouzey, M.; Penther, D.; Roche-Lestienne, C.; Nelken, B.; Devoldère, C.; Vannier, J.-P.; Schneider, P. Detection of dicentric chromosome (9;20) in paediatric B-cell acute lymphoblastic leukaemia: Prognostic significance. Ann. Hematol. 2015, 94, 187–193. [Google Scholar] [CrossRef]
- Strehl, S.; König, M.; Dworzak, M.N.; Kalwak, K.; Haas, O.A. PAX5/ETV6 fusion defines cytogenetic entity dic(9;12)(p13;p13). Leukemia 2003, 17, 1121–1123. [Google Scholar] [CrossRef]
- Jawhar, M.; Naumann, N.; Knut, M.; Score, J.; Ghazzawi, M.; Schneider, B.; Kreuzer, K.-A.; Hallek, M.; Drexler, H.G.; Chacko, J.; et al. Cytogenetically cryptic ZMYM2-FLT3 and DIAPH1-PDGFRB gene fusions in myeloid neoplasms with eosinophilia. Leukemia 2017, 31, 2271–2273. [Google Scholar] [CrossRef]
- Roberts, K.G.; Gu, Z.; Payne-Turner, D.; McCastlain, K.; Harvey, R.C.; Chen, I.-M.; Pei, D.; Iacobucci, I.; Valentine, M.; Pounds, S.B.; et al. High Frequency and Poor Outcome of Philadelphia Chromosome–Like Acute Lymphoblastic Leukemia in Adults. J. Clin. Oncol. 2017, 35, 394–401. [Google Scholar] [CrossRef] [PubMed]
- Skucha, A.; Ebner, J.; Grebien, F. Roles of SETD2 in Leukemia—Transcription, DNA-Damage, and Beyond. Int. J. Mol. Sci. 2019, 20, 1029. [Google Scholar] [CrossRef] [PubMed]
- Mar, B.G.; Bullinger, L.B.; McLean, K.M.; Grauman, P.V.; Harris, M.H.; Stevenson, K.; Neuberg, D.S.; Sinha, A.U.; Sallan, S.E.; Silverman, L.B.; et al. Mutations in epigenetic regulators including SETD2 are gained during relapse in paediatric acute lymphoblastic leukaemia. Nat. Commun. 2014, 5, 3469. [Google Scholar] [CrossRef] [PubMed]


| Patient | Karyotype | Fish | Array-CGH/SNP-Array/MLPA 1 | RNA-Seq Fusion |
|---|---|---|---|---|
| 1 | 46,XX,del(11)(?q21q23) | BCR/ABL, ETV6/RUNX1 and MLL negative | (ARHGAP24)x1,(EBF1)x1,(IKZF1)x1,(SERP2)x1, (SLX4IP)x1 | NPAT/JAK2 |
| 2 | - | BCR/ABL, ETV6/RUNX1 and MLL negative | (IKZF1)x1,(CDKN2A)x0,(PAX5)x0 | No fusion 2 |
| 3 | - | BCR/ABL, ETV6/RUNX1 and MLL negative | (IKZF1)x1,(CDKN2A)x0,(CDKN2B)x0,(PAX5)x1 | No fusion |
| 4 | - | BCR/ABL, ETV6/RUNX1 and MLL negative | (FHIT)x1,(IKZF1)x1,(CDKN2A)x0,(CDKN2B)x1, (PAX5)x1,(BTG1)x1,(ATP10A)x1,(SLX4IP)x1 | No fusion |
| 5 | - | BCR/ABL, ETV6/RUNX1 and MLL negative | (IKZF1)x1,(PAX5)x1,(Xp22.33)x1,(X)x3 | No fusion 2 |
| 6 | 44,XX,-7,dic(9;12)(p13;p13),- 11,del(15)(q21),+mar1~2[15] /46,XX[5] | nuc ish 12p13(ETV6x1),21q22(RUNX1x2)[97/100],11q2 3(MLLx1)[96/100] | arr[GRCh37] 3q25.1(152025150_152078949)x1,7p14.2p12.1(36862295_5292 0052)x1,8q23.1q24.21(110045943_128549318)x1,9p24.3p21.1 (205069_29299751)x1,9p13.3p13.2(35259627_38394815)x1,10q 23.31(89650155_89697232)x1,11p15.1q24.2(20291195_127532 511)x1,12p13.33p12.1(162848_25877293)x1,15q13.2q22.1(303 66065_59117244)x1,18q21.2(52973141_53080556)x1,Xp11.3(4 4783685_44852481)x1 | No fusion |
| 7 | 46,XY,t(1;19)(q23;q13),inc[4] /46,XY[5] | 9q34(ABL1x2),22q11(BCRx2)[97/100],12p13 (ETV6x2),21q22(RUNX1x3~4)[12/100],11q23 (MLLx2)[100/100],19p13(TCF3x2)(5′TCF3sep3′TCF3x 1)[90/100] | arr[GRCh37] 9p21.3(21986358_21993460)x0 | TCF3/PBX1 |
| 8 | 46,XX[25] | nuc ish 8q24(CMYCx2)[99/100],9q34(ABL1x2),22q11 (BCRx2)[100/100],11q23(MLLx2)[100/100],12p13 (ETV6x2),21q22(RUNX1x2)[98/100],19p13 (TCF3x2)[97/100] | arr[GRCh37] 9p21.3(21938547_21993460)x0,13q14.2(48984925_49065340)x0 | No fusion |
| 9 | - | 12p13(ETV6x2~4),21q22(RUNX1x3~6)(ETV6 conRUNX1x1~2)[100/100] | - | - |
| 10 | - | nuc ish 9q34(ABL1x2),22q11(BCRx2)[100/100],11q23 (MLLx2)[100/100] 3 | - | - |
| 11 | - | nuc ish 9q34(ABL1x3),22q11(BCRx2)[52/100],12p13 (ETV6x2),21q22(RUNX1x4~5)[13/100],12p13 (ETV6x2),21q22(RUNX1x6)[29/100],12p13(ETV6x2), 21q22(RUNX1x7)[54/100],19p13(TCF3x2) | arr[GRCh37] 5p15.33q15(26142_95134494)x3,5q22.1q35.3(110817009_1806 96806)x3,6p25.3q27(204009_170911240)x3,9p21.3(21689983_ 22268884)x0,9p24.3p13.1(205069_38805758)x1,9q21.11q34.3 (70984481_141115978)x3,10p15.3q26.3(102539_135434178)x3, 13q14.2q14.3(47355214_53035715)x1,14q11.1q32.3(19043189 _106552084)x3,21q11.2q22.3(14539679_48090317)x~6, Xp22.33q28(204448_106552084)x3 | ZMYM2/ESD |
| 12 | 45,XY,del(1)(q25),del(7) (p11),add(9)(q21),del(9)(p12), -13,add(15)(p13)[4]// 46,XY[11] | nuc ish 9q34(ABL1x2),22q11(BCRx2)[97/100],11q23 (MLLx2)[98/100],12p13(ETV6x2),21q22 (RUNX1x2)[98/100],19p13(TCF3x2)[92/100] | arr[GRCh37] 1q25.1q44(173487058_249218792)x1,7p22.3p11.2(45130_5757 7373)x1,7q11.21q21.11(61821749_81088370)x1,15q12(260538 34_26096681)x1 | No fusion |
| Patient | Results Validated by OGM 1 | Novel Findings 1 |
|---|---|---|
| 1 | ogm[hg19] 4q21.23(86445426_86506057)x1,5q33.3(157949400_158533971)x1,7p12.2(50339 472_50467354)x1,13q14.11(44845663_45020217)x1,20p12.2(10409635_1045849 8)x1 | ogm[hg19] 46,XX,t(9;11)(p24.1;q22.3) NPAT-JAK2 fusion 2: t(9p24.1;11q22.3)(5081915;108055699) |
| 2 | ogm[hg19] 7p14.3p11.2(30305758_54598807)x1,9p24.3p13.1(14566_39639975)x1,9p21.3 (21805860_22082060)x0,9p13.2(36841196_36892517)x0,20q11.21q13.33 (31411836_62965071)x1,Xp22.33(61554_1595639)x0~1 | ogm[hg19] 46,XY,4p16.3p16.1(1217567_7779679)x1,t(7;20)(p14.3;q11.21) |
| 3 | ogm[hg19] 7p12.2p11.2(49589366_57834044)x1,9p21.3(21254326_22118700)x0,9p21.3p13. 1(22121006_38792295)x1 | ogm[hg19] 46,XY,6p25.3p22.3(76216_18127228)x1,t(6;9)(p22.3;p21.3), 6p22.3(18127932_18519285)x0,7p22.3p13(10487_44611328) x1 |
| 4 | ogm[hg19] 3p14.2(59995117_60552466)x1,7p12.2(50345917_50475683)x1,9p24.3p13.1(145 66_38598581)x1,9p21.3(21771311_22031191)x0,12q21.33(92168916_92587734) x1,15q12(25998721_26114333)x1,20p12.2(10409635_10458498)x1 | ogm[hg19] 46,XX,8q13.19q24.1(66365779_144244501)x3,dic(9;20)(p13. 1;q11.23),9p13.1(38633406_39450127)x3,9p12(41639858_42 518127)x3,ins(12;9)(p13.2;q34.13)3,20q11.22q11.23(3277215 5_37232954)x3,20q11.23q13.33(37233950_62965071)x1,t(X; 20)(q27.1;q11.22),Xq27.1q28(138091547_155255277)x3 ETV6-ABL fusion 2,3: ins(12;9)(p13.2;q34.13)(12:12034841_12043458ins(9:133722 840_133791173) |
| 5 | ogm[hg19] 47,XX,7p12.2p12.1(50364101_51250510)x1,9p13.2(36846196_36969903)x1,Xp2 2.33(61554_2272814)x0~1,Xp22.33(61554_2274814)x0~2,Xp22.33q28(2674971_ 155255277)x3 | - |
| 6 | ogm[hg19] 3q25.1(152014253_152086683)x1,dic(9;12)(q21.1;q12.1),7p14.1p12.1(36828512 _52954130)x1,8q23.1q24.21(110041918_128585274)x1,9p24.3p21.1(14566_2931 6907)x1,9p13.3p13.1(35227955_38397240)x1,10q23.31(89646060_89698668)x1, 11p15.1p11.12(83377_127712)x1,11q14.1q24.2(85137702_129511096)x1,12p13. 33p12.1(153001_25898742)x1,15q13.2q22.1(30356036_59124264)x1,18q21.2(52 966023_53084105)x1,Xp11.3(44782158_44859857)x1 | ogm[hg19] 46,XX,t(2;6)(p24.3;q27),3p21.31(47126654_47132458)x12,3q 22.3(136418158_136446074)x1,6p22.3(18232924_18249474) x1 4 |
| 7 | ogm[hg19] 46,XY,t(1;19)(q23;p13),9p21.3(21985616_21996138)x0 TCF3/PBX1 fusion: t(1q23;19p13)(164755447;1638015) | - |
| 8 | ogm[hg19] 46,XX,9p21.3(21937565_21996138)x0 | ogm[hg19] 13q14.2(48981801_49084431)x1,13q14.2(48983012_4914880 1)x1 |
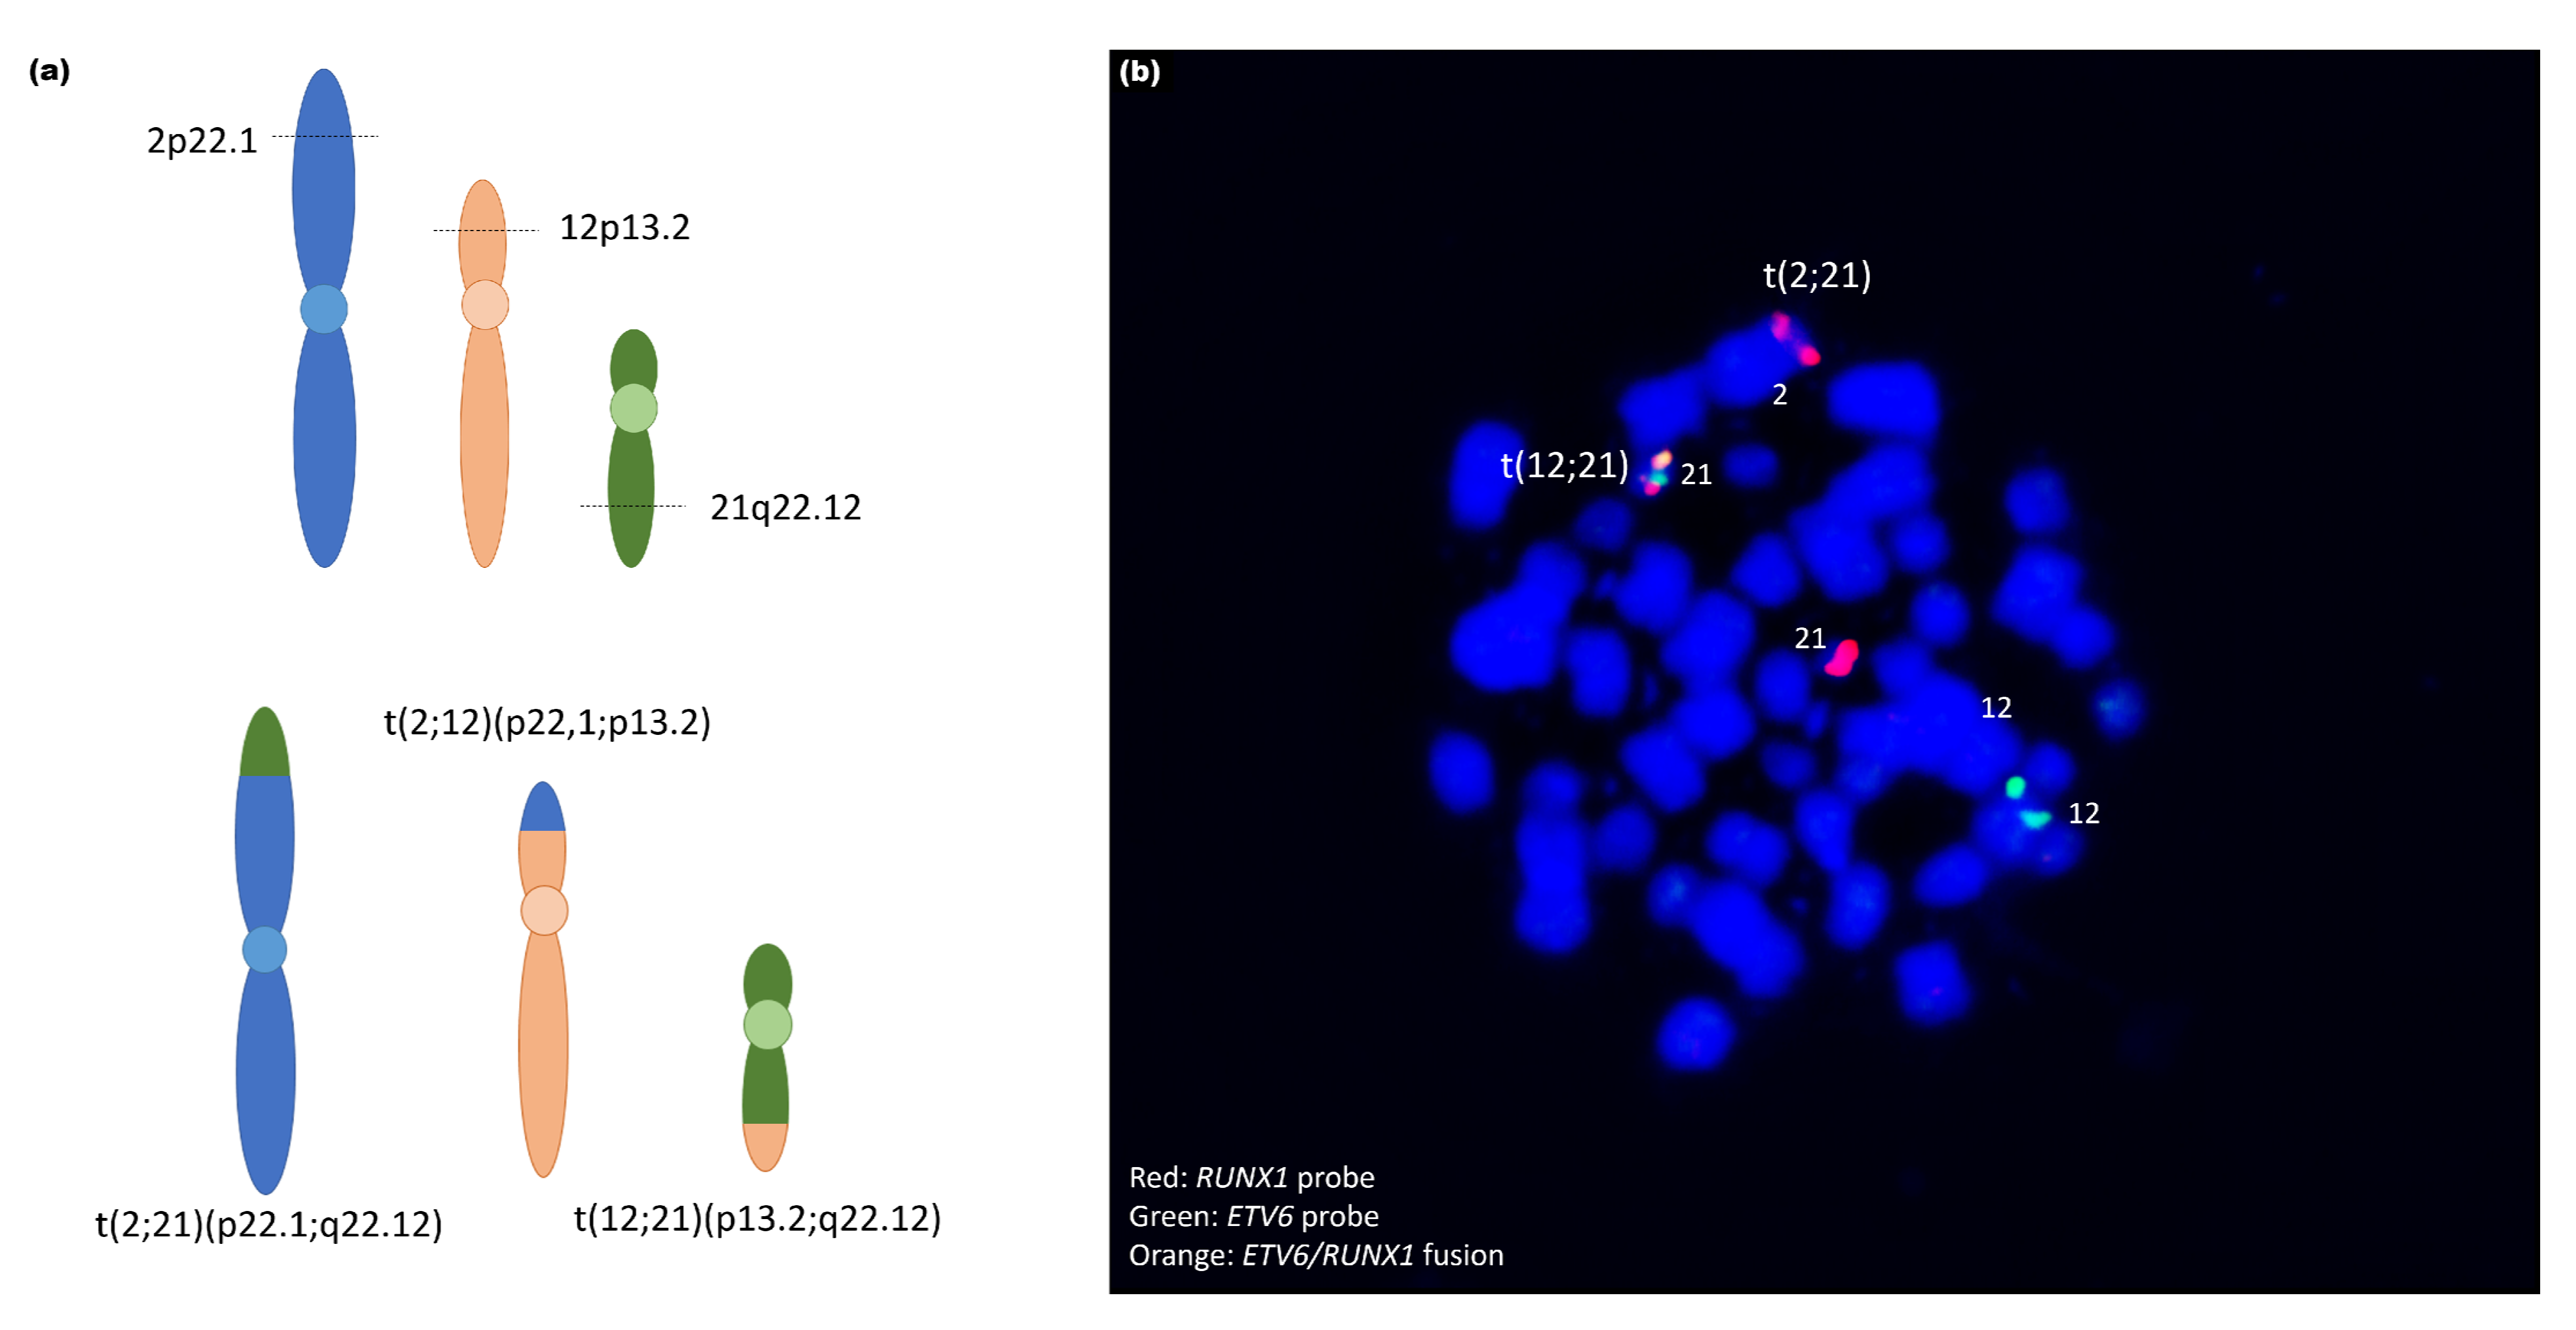
| 9 | ogm[hg19] t(12;21)(p13.2;q22.12) | ogm[hg19] 45,X,t(2;12;21)(p22.1;p13.2;q22.12)4,6p25.3p22.3(76216_168 28004)x1,6p22.1q14.1(16834818_79718301)x3,6q14.1q27(95 680530_170272658)x1,Xp22.33q28(61554_155255277)x1 |
| 10 | ogm[hg19] 1p33(47693608_47790165)x1 | ogm[hg19] 46,XY,9p24.1p21.2(14566_21574877)x1,9p24.1p21.2(215748 77_26276439)x0,9p13.3p13.1(33910882_39639975)x1,10q23 .31(89614306_89733606)x1~2,10q23.31(89688942_8923951) x1,t(11;14)(p13;q11.2) |
| 11 | ogm[hg19] 57,XX,5p15.33q15(1645821_95111596)x3,5q22.1q35.3(110834925_180899715)x 3,6p25.3q27(1851037_170272658)x3,9p24.3p13.1(14566_39639975)x1,9p21.3(2 1678074_22273253)x0,9q22q34.2(67985208_68496607)x3,10p15.3q26.3(64453_ 134158816)x3,13q14.2q14.3(47339725_53082621)x1,14q11.1q32.33(20526493_1 04540474)x3,21q11.2q22.3(14355427_46681324)x~6,Xp22.33q28(2663909_1548 80528)x3 ZMYM2/ESD fusion: dic(13;13)(q14.13;q12.11)(47355206;20574490) | - |
| 12 | ogm[hg19] 46,XY,1q25.1q32.1(173476173_215743425)x1,1q41q44(215736722_249237532)x1, 7p22.3q21.11(1307750_81073681)x1,15q12(26031156_26114333)x1 | ogm[hg19] t(9;13)(p13.2;q14.11),ins(9;13)(q31.2;q22.3q14.11)?,t(13;15)? (q22.3;p13) 4 |
Publisher’s Note: MDPI stays neutral with regard to jurisdictional claims in published maps and institutional affiliations. |
© 2021 by the authors. Licensee MDPI, Basel, Switzerland. This article is an open access article distributed under the terms and conditions of the Creative Commons Attribution (CC BY) license (https://creativecommons.org/licenses/by/4.0/).
Share and Cite
Lühmann, J.L.; Stelter, M.; Wolter, M.; Kater, J.; Lentes, J.; Bergmann, A.K.; Schieck, M.; Göhring, G.; Möricke, A.; Cario, G.; et al. The Clinical Utility of Optical Genome Mapping for the Assessment of Genomic Aberrations in Acute Lymphoblastic Leukemia. Cancers 2021, 13, 4388. https://doi.org/10.3390/cancers13174388
Lühmann JL, Stelter M, Wolter M, Kater J, Lentes J, Bergmann AK, Schieck M, Göhring G, Möricke A, Cario G, et al. The Clinical Utility of Optical Genome Mapping for the Assessment of Genomic Aberrations in Acute Lymphoblastic Leukemia. Cancers. 2021; 13(17):4388. https://doi.org/10.3390/cancers13174388
Chicago/Turabian StyleLühmann, Jonathan Lukas, Marie Stelter, Marie Wolter, Josephine Kater, Jana Lentes, Anke Katharina Bergmann, Maximilian Schieck, Gudrun Göhring, Anja Möricke, Gunnar Cario, and et al. 2021. "The Clinical Utility of Optical Genome Mapping for the Assessment of Genomic Aberrations in Acute Lymphoblastic Leukemia" Cancers 13, no. 17: 4388. https://doi.org/10.3390/cancers13174388
APA StyleLühmann, J. L., Stelter, M., Wolter, M., Kater, J., Lentes, J., Bergmann, A. K., Schieck, M., Göhring, G., Möricke, A., Cario, G., Žaliová, M., Schrappe, M., Schlegelberger, B., Stanulla, M., & Steinemann, D. (2021). The Clinical Utility of Optical Genome Mapping for the Assessment of Genomic Aberrations in Acute Lymphoblastic Leukemia. Cancers, 13(17), 4388. https://doi.org/10.3390/cancers13174388