Simple Summary
Uveal melanoma (UM) is a rare type of intraocular malignancy, which often gives rise to metastases. While treatment with immune checkpoint inhibitors is often effective in the treatment of cutaneous melanoma metastases, it is hardly effective in the case of UM metastases. Lymphocyte-activation gene 3 (LAG3) is a recently recognized immune checkpoint; we determined the distribution of LAG3 expression and its ligands in three sets of primary UM. High-risk UM (epithelioid cell type, loss of chromosome 3/BAP1 staining) had a higher expression of LAG3 and its ligands, which correlated with the presence of infiltrating immune cells. We concluded that not only LAG3 but also its ligands Galectin-3 and HLA class II are especially expressed in high-risk UM and may be a target for adjuvant immunotherapy in UM.
Abstract
Uveal melanoma (UM) is a rare ocular malignancy which originates in the uveal tract, and often gives rise to metastases. Potential targets for immune checkpoint inhibition are lymphocyte-activation gene 3 (LAG3) and its ligands. We set out to analyse the distribution of these molecules in UM. The expression of mRNA was determined using an Illumina array in 64 primary UM from Leiden. The T lymphocyte fraction was determined by digital droplet PCR. In a second cohort of 15 cases from Leiden, mRNA expression was studied by Fluidigm qPCR, while a third cohort consisted of 80 UM from TCGA. In the first Leiden cohort, LAG3 expression was associated with the presence of epithelioid cells (p = 0.002), monosomy of chromosome 3 (p = 0.004), and loss of BAP1 staining (p = 0.001). In this Leiden cohort as well as in the TCGA cohort, LAG3 expression correlated positively with the expression of its ligands: LSECtin, Galectin-3, and the HLA class II molecules HLA-DR, HLA-DQ, and HLA-DP (all p < 0.001). Furthermore, ligands Galectin-3 and HLA class II were increased in monosomy 3 tumours and the expression of LAG3 correlated with the presence of an inflammatory phenotype (T cell fraction, macrophages, HLA-A and HLA-B expression: all p < 0.001). High expression levels of LAG3 (p = 0.01), Galectin-3 (p = 0.001), HLA-DRA1 (p = 0.002), HLA-DQA1 (p = 0.04), HLA-DQB2 (p = 0.03), and HLA-DPA1 (p = 0.007) were associated with bad survival. We conclude that expression of the LAG ligands Galectin-3 and HLA class II strongly correlates with LAG3 expression and all are increased in UM with Monosomy 3/BAP1 loss. The distribution suggests a potential benefit of monoclonal antibodies against LAG3 or Galectin-3 as adjuvant treatment in patients with high-risk UM.
1. Introduction
Uveal melanoma (UM) is a rare ocular malignancy which is especially seen in people with a fair skin and light eyes [1,2]. Up to 50% of patients develop metastases and no improvement in survival has occurred over the last 50 years [3,4]. The presence of an inflammatory phenotype is associated with a bad prognosis and involves the presence of a mixed leukocytic infiltrate, which is made up of tumour-infiltrating lymphocytes (TIL), tumour-associated macrophages (TAM), and an increased HLA class I and II expression [5,6,7,8,9]. In spite of the presence of large numbers of lymphocytes and macrophages, local immune responses are not effective against intraocular tumours and do not inhibit their growth and metastases formation; instead, the presence of infiltrating leukocytes seems to stimulate growth [10,11,12]. Overall, one can regard UM as having an immunosuppressive environment, which is characterized by the presence of FOXP3+ regulatory T cells [8], while macrophages may function as myeloid-derived suppressor cells [13]. We have suggested that genetic changes, specifically loss of BAP1 expression, were responsible for the influx of macrophages and lymphocytes, as well as for creating the immunosuppressive environment [14]. In agreement with this, another study also showed the association between loss of BAP1 and the infiltration of leukocytes and upregulation of genes related to immunosuppression using CYTOF technology and, furthermore, showed that such genes are expressed in UM metastases [15].
In order to obtain an effective immune response, it is important to find the reason behind the unresponsiveness of the immune cell population. T cell responses are modulated through binding of stimulatory and inhibitory ligands to cell surface receptors. Some of these ligands are known as immune checkpoints, which can prevent immune overstimulation and auto-immune responses. Well-known immune checkpoints are cytotoxic T-lymphocyte-associated protein 4 (CTLA-4) and programmed cell death protein-1 (PD-1) [16,17]. Another immune checkpoint is lymphocyte-activation gene-3 (LAG3), which is present on the surface of T cells, NK cells, and plasmacytoid dendritic cells [18]. The LAG3 protein forms a stable connection with HLA class II via its 30-amino acid loop structure, and selectively binds to peptide-containing major histocompatibility class II (MHCII) molecules [19,20]. Under normal circumstances, LAG3 may help to prevent auto-immune responses, or excessive responses against viral infections [21]. However, tumour cells may use immune checkpoints to avoid immune recognition and exhaust cytotoxic T cells. LAG3 is highly associated and synergistic with PD-1 as it is co-expressed with this immune checkpoint on CD4 and CD8 T cells: one study found that more macrophages, CD3, CD4, and CD8 T cells were present in murine tumours when LAG3 and PD-1 were both knocked out, which suggests that the combined deletion of these two factors alters regulator T cell homeostasis while enhancing tumour immunity [22].
Recently, Durante et al. called attention to the potential role of LAG3 in UM, indicating that LAG3 may be the dominant exhaustion marker in this malignancy [23]. Single cell RNA sequencing showed that most CD8 cytotoxic T cells in UM expressed LAG3 at a high level. The authors suggested that this was the reason that anti-PD-1 and anti-CTLA-4 therapies were not effective [24,25]. Figueiredo et al. independently reported on the presence of LAG3 in UM, and using the TCGA data, showed that an increased expression is related to loss of BAP1 [15]. They reported an association between a high LAG3 expression and a high rate of metastases.
Several studies have addressed the beneficial usage of anti-LAG3 therapy in different malignancies: one monoclonal anti-LAG3 antibody, IMP321, was able to activate antigen-presenting cells (APCs) and T cells in breast cancer [26]. Another anti-LAG3 therapeutic approach proved efficacious with a high safety profile when it was combined with anti-PD-1 blockade in cutaneous melanoma patients [27,28].
While LAG3 is expressed on regulator T cells, it may interact with multiple cell surface receptors, such as LSECtin, Galectin-3, and HLA class II. In general, the effectiveness of targeted therapies is influenced by the expression of the target, and this also applies to the use of monoclonal antibodies against immune checkpoints; with this assumption, we analysed not only the expression of LAG3 but also of its ligands in two new sets of primary UM as well as in the TCGA dataset to determine how to identify patients who can be targeted for adjuvant therapy.
2. Materials and Methods
2.1. Study Population
UM tissue was obtained from two groups of patients from the Leiden University Medical Center (LUMC) in Leiden, The Netherlands: the first group consisted of 64 patients who underwent an enucleation for UM between 1999 and 2008, of which 51% were male and 49% were female. The mean age at the time of enucleation was 61 years. The mean follow-up time (defined as the time period between enucleation and death) was 83 months (range 2 to 229 months). Follow-up was updated in 2020. At the end of follow up, 17 (27%) patients were alive, 37 (58%) patients had died because of metastasis, four (6%) had died because of other causes and six (9%) died with the cause of death unknown; the second group from Leiden was made up of 15 patients who underwent an enucleation for UM at the LUMC between 2016 and 2017: 60% of these patients were male while 40% were female. The mean age at the time of enucleation was 59 years; the mean follow-up time was 26 months (range 9 to 34 months). At the end of follow up, 13 (87%) patients were alive, while 2 (13%) patients had died because of metastases. We also looked at mRNA levels of tumours included in the TCGA database (n = 80) [9].
2.2. Chromosome Status
DNA was isolated from archived frozen tumour material using the QIAmp DNA Mini kit (Qiagen, Venlo, The Netherlands). Chromosome 3 aberrations were detected by SNP analysis using the Affymetrix 250K_NSP and Affymetrix SNP 6.0 array [14,29].
2.3. Illumina Array
Gene expression was determined on RNA obtained from archived frozen tumour material using the Illumina HT12v4 array (Illumina, Inc., San Diego, CA, US) for LAG3, Galectin-3, LSECtin, HLA class II (DRalpha, DQalpha1, DQbeta2, DPalpha1), and immune cell markers (CD3, CD4, CD8, CD68, CD163), as described previously [30].
2.4. T Lymphocyte Fraction
The T cell fraction was obtained as previously described, by using a digital droplet PCR (ddPCR) assay directed at a specific locus of the TCR-β gene [12,31].
2.5. Fluidigm qPCR
A Fluidigm qPCR (Fluidigm Corporation, South San Francisco, CA, USA) was performed on 15 UM tumours from Leiden, as previously described [32]. Briefly, total RNA (50–200 ng) was used for cDNA synthesis. Complementary DNA was diluted ten times (1.25 µL) and amplified with 2.5 µL of Taqman Preamp master mix (Applied Biosystems, Foster City, CA, USA) and 1.25 µL pooled primer mix for 14 cycles. QPCR reactions were performed using Eva-green dye and the final results were collected using the BioMark HD system (Fluidigm). Glyceraldehyde 3-phosphate dehydrogenase (GAPDH), β-actin, hypoxanthine phosphoribosyltransferase 1 (HPRT-1), ribosomal protein L13a (RPL13a) and hydroxymethylbilane synthase (HMBS) were used as reference genes. The geometric mean of these reference genes was used to standardize the gene expression signals of interest. The normalized data were log-transformed using Z-scores.
2.6. Statistical Analysis
Data were analysed by SPSS version 22.0 (SPSS, nc., Chicago, IL, USA). Graphs were obtained by GraphPad Prism version 5.0 for windows (GraphPad Software, La Jolla, CA, USA). The Spearman correlation was performed for correlations between non-parametric data. The Mann–Whitney U test was used to compare non-normal groups. A log-rank test was used for the significance analysis of survival graphs.
3. Results
3.1. Association between LAG3 and High-Risk Characteristics of UM
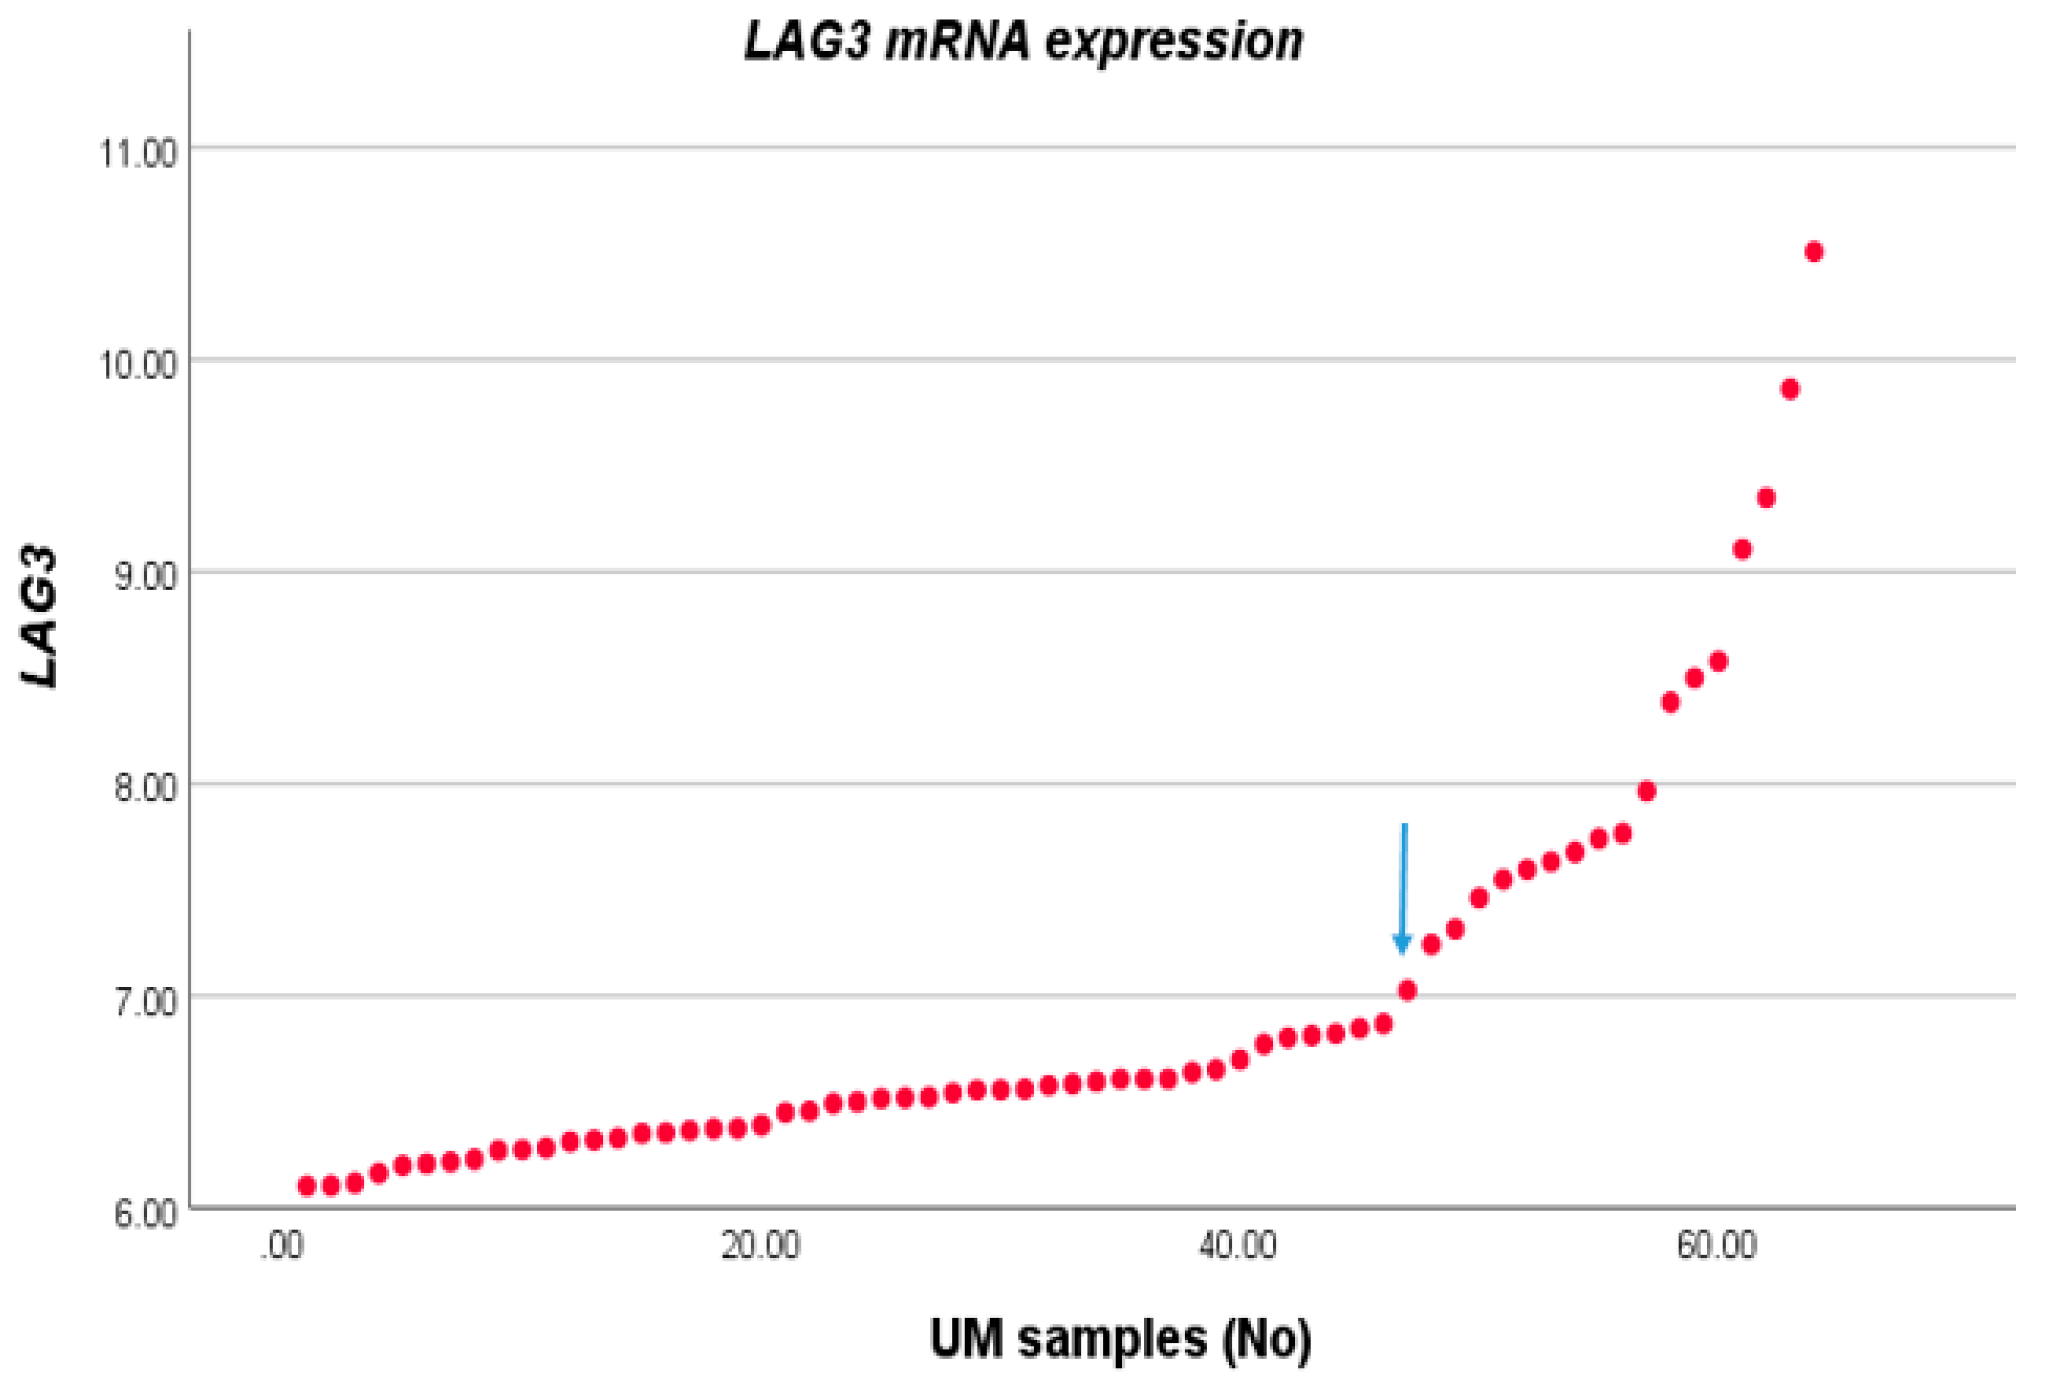
We compared the expression level of LAG3 with the distribution of clinico-pathological characteristics in a cohort of 64 cases of UM from Leiden, The Netherlands. For this, we first sorted LAG3 expression from lowest to highest and observed two potential inflection points (Figure 1). We subsequently separated the cohort into two groups, with expression below and above the inflection point of 6.87. Forty-six tumours fell into the low expression group, and 18 into the high expression group. LAG3 expression was increased in cases with age >60 years (p = 0.04), in the presence of epithelioid cells (p = 0.002), and loss of BAP1 staining as determined by immunohistochemistry (p = 0.001) (Table 1).

Figure 1.
LAG3 expression in UM. The LAG3 expression level of 64 UM as seen in an Illumina array was sorted from low to high; we selected the inflection point of 6.87 to divide the cases into a low and high expression group.

Table 1.
LAG3 expression compared with clinico-pathological and genetic characteristics in a set of 64 UM. Groups were separated according to the inflection point of 6.87; L: low expression, H: high expression. Using Pearson’s Chi-square test, p ≤ 0.05 is considered significant. Significant p values are indicated in bold. Numbers in brackets represent percentages.
3.2. Association between LAG3 and Cell Surface Ligands
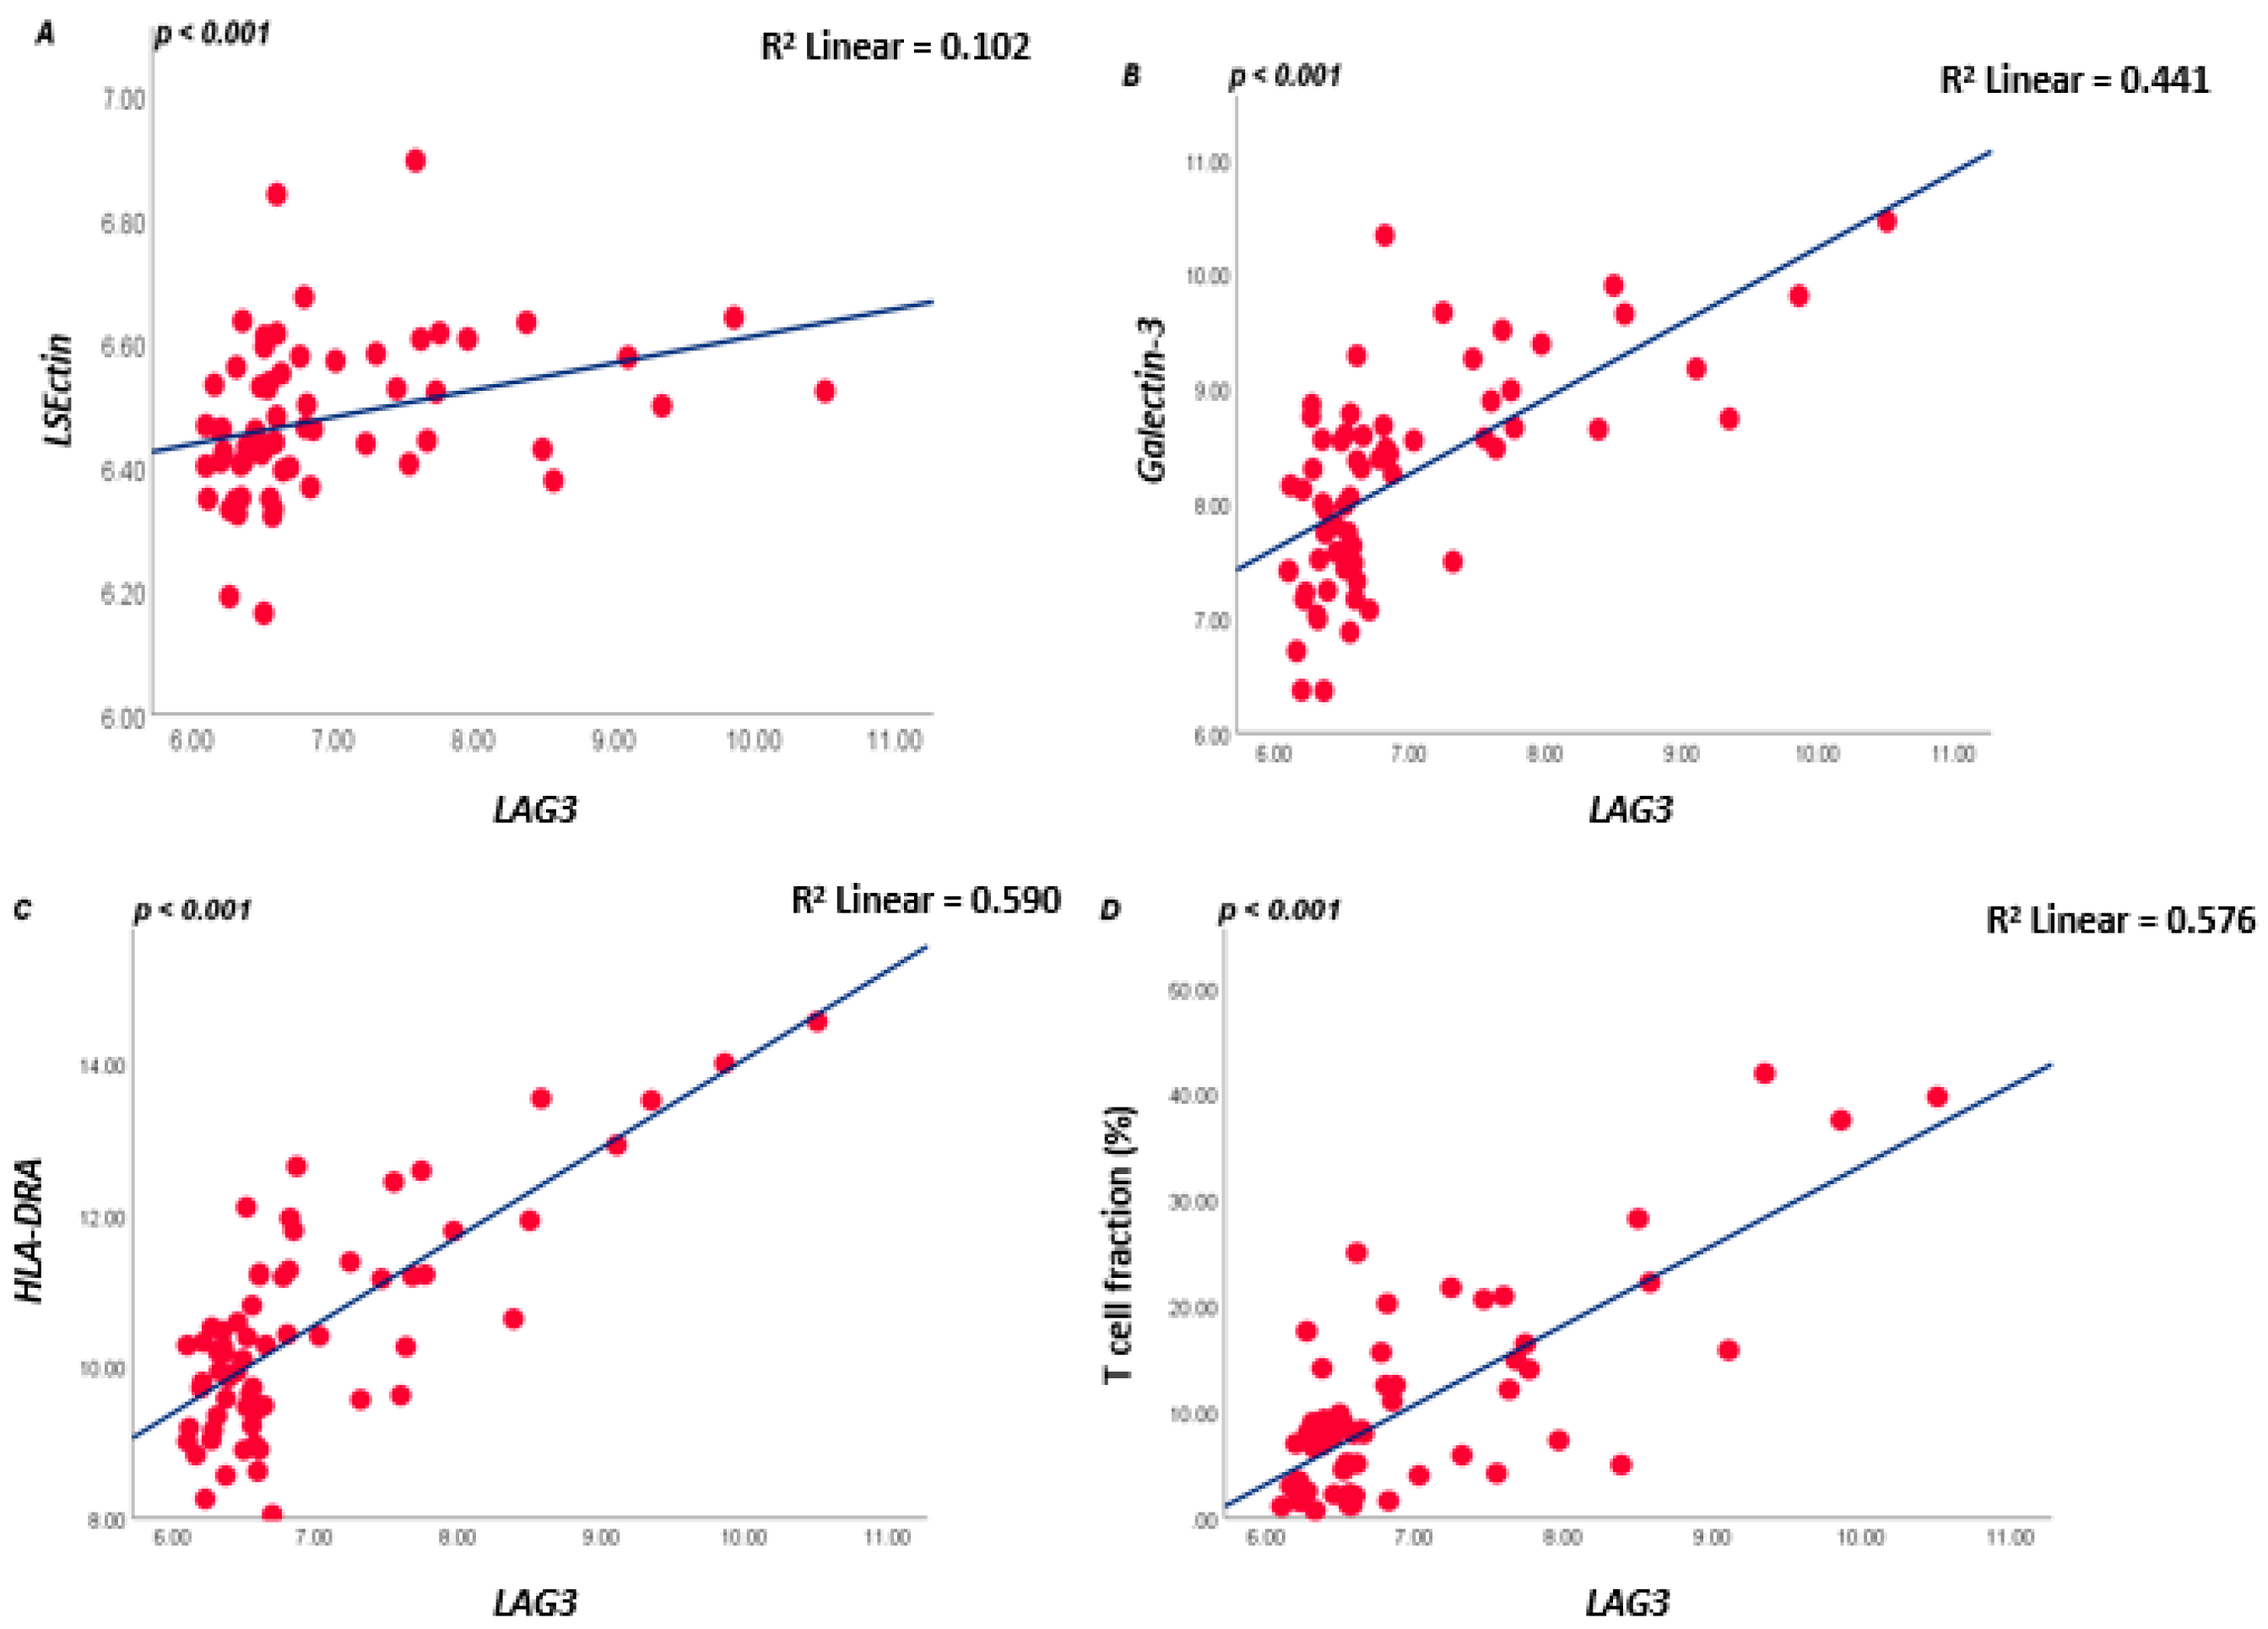
As LAG3 on T lymphocytes binds to ligands on APCs or tumour cells, we subsequently analysed which tumours express these ligands. LAG3 is known to form stable complexes with different cell surface receptors such as LSECtin, Galectin-3, and HLA class II isoforms. In the large Leiden cohort of 64 UM, expression of LSECtin and Galectin-3 was positively correlated with LAG3 (both p < 0.001). Messenger RNA expression levels of the HLA class II genes (HLA-DRalpha, HLA-DQalpha, and HLA-DQbeta2 and HLA-DPalpha1) were positively associated with LAG3 expression (all p ≤ 0.001) (Figure 2; Table S1A).
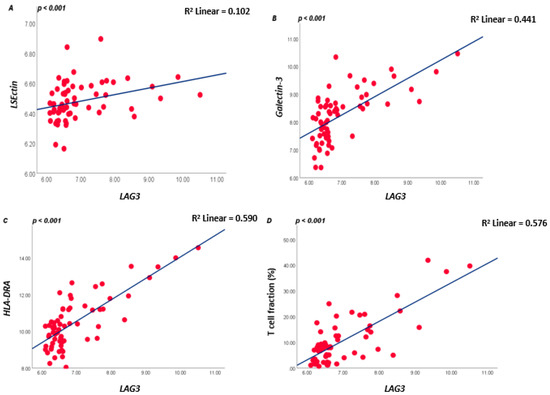
Figure 2.
Correlation between LAG3, LSECtin, Galectin-3, and HLA-DRalpha in the 64 UM cohort from Leiden (A–C), and between LAG3 and lymphocyte fraction as determined by ddPCR (D); a Spearman correlation was applied. p ≤ 0.05 is considered significant.
In order to validate our findings, we performed the same analyses using the TCGA database of 80 UM samples [9] and found almost identical results: LAG3 expression showed a positive correlation with LSECtin, Galectin-3, HLA-DRalpha, HLA-DQalpha, HLA-DQbeta2, and HLA-DPalpha (all p ≤ 0.001) (Table S1B).
3.3. LAG3 and Inflammatory Phenotype
As we previously showed that monosomy of chromosome 3/loss of BAP1 are related to the presence of an inflammatory phenotype [7,14], we checked the associations of LAG3 with immune cell markers: LAG3 showed a positive association with the presence of TILs and TAMs (Spearman correlation coefficient, CD3E R = 0.727, CD4 R = 0.596, CD8A R= 0.832, CD68 R = 0.542, CD163 R = 0.485, all p < 0.001), as well as with HLA class I expression (HLA-A probe 1 R= 0.712, HLA-A probe 2 R= 0.731, HLA-B R= 0.791, all p < 0.001) (Table S1A); the same pattern was observed in the TCGA cohort (Table S1B).
As mRNA and RNAseq data show expression levels but not cell numbers, we additionally looked at the T-cell fraction as determined using a specifically developed ddPCR that quantifies the rearranged T-cell genes [12,31]. A good correlation was present between LAG3 levels and the tumour’s T lymphocyte fraction (R = 0.553, p < 0.001, Figure 2D).
3.4. UM with Monosomy 3 Express Higher Levels of LAG3 Ligands Than with Disomy 3
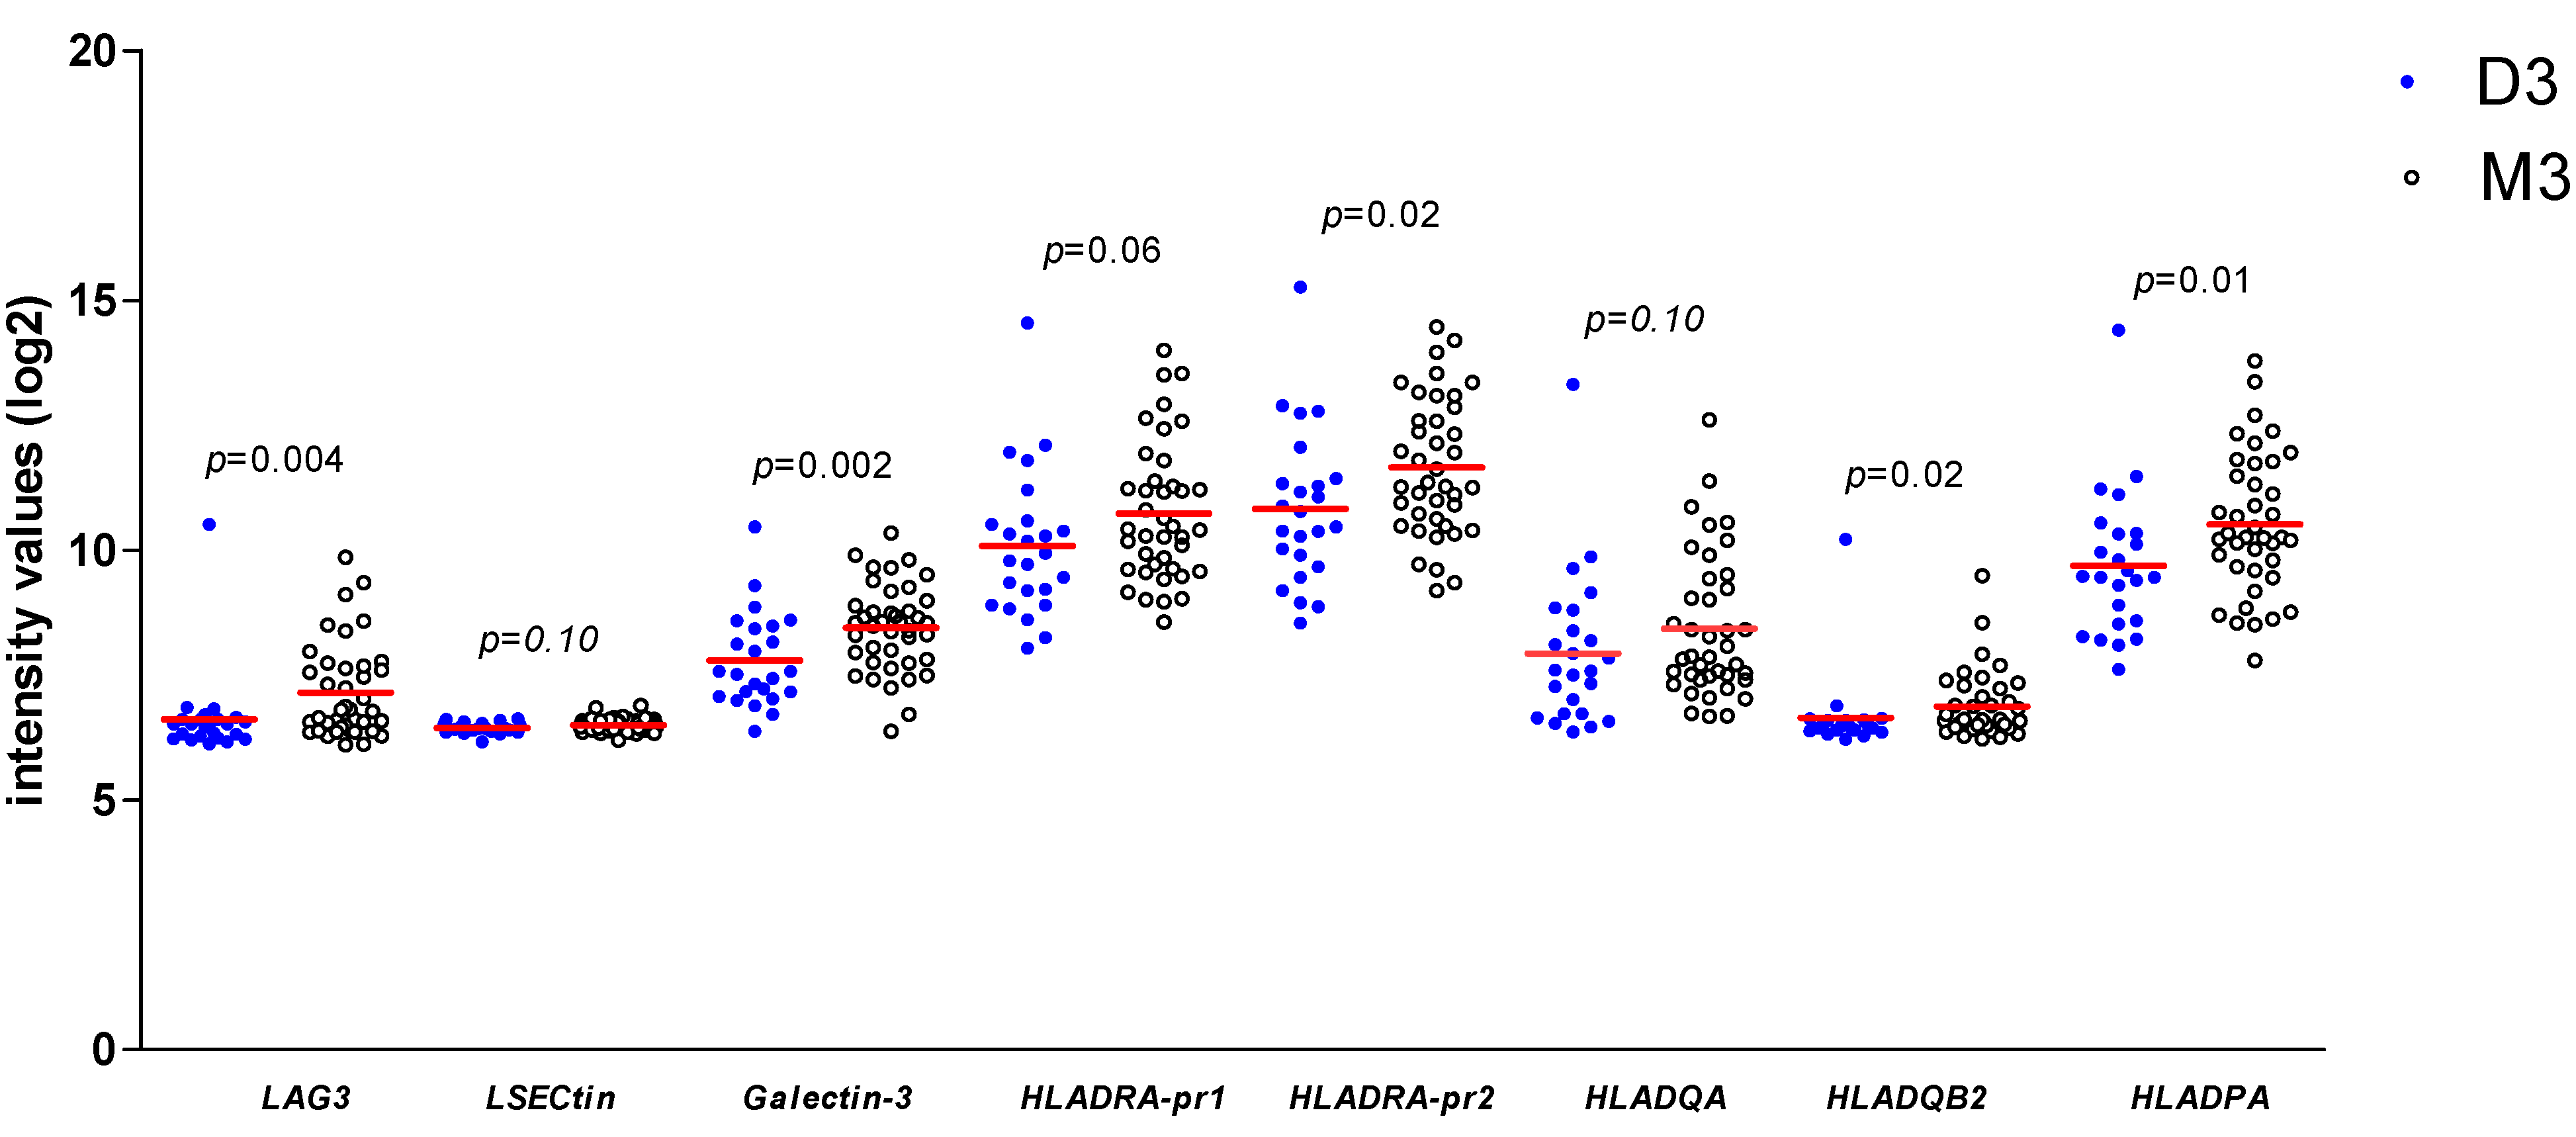
As we found a positive association between LAG3 expression and its ligands and confirmed the association between LAG3 and loss of BAP1 expression/the presence of monosomy 3, we wondered whether expression of LAG3 ligands would similarly show associations with high-risk tumour characteristics. When looking at the Leiden 64-case cohort, expression of Galectin-3 (p = 0.002), one of the probes for HLA-DRalpha (p = 0.02), HLA-DQbeta2 (p = 0.02) and HLA-DPalpha (p = 0.01) was significantly higher in high-risk M3 tumours compared with low-risk D3 tumours (Figure 3).

Figure 3.
Comparison of gene expression of LAG3, LSECtin, Galectin-3, and several HLA class II molecules in 64 UM from Leiden between D3 (n = 24) and M3 (n = 40) UM; a Mann–Whitney U test was applied. Horizontal bars indicate mean gene expression. p ≤ 0.05 is considered significant.
In the TCGA cohort, we observed similar correlations: M3 tumours showed a higher expression than D3 tumours for LAG3, LSECtin, Galectin-3, HLA-DRalpha, HLA-DQalpha, and HLA-DPalpha (all p = 0.001, Mann–Whitney U test) (Figure S1).
As a control for the used mRNA/RNAseq expression levels, we analysed a second set of 15 UM from Leiden by Fluidigm qPCR, and compared the expression of LAG3, HLA-DR, and Galectin-3 between D3 vs. M3 tumours (Table 2). Similar to prior results, the mean value of LAG3 (p = 0.004) and HLA-DR (p = 0.004) was higher in M3 than in D3 tumours; this was not the case for Galectin-3 (p = 0.61).
Table 2.
Mean mRNA expression levels of different immune modulators defined by qPCR in UM tumours (n = 15). A Mann–Whitney U test was performed. p ≤ 0.05 is considered significant (indicated in bold).
3.5. Association between LAG3 and Its Ligands with Survival
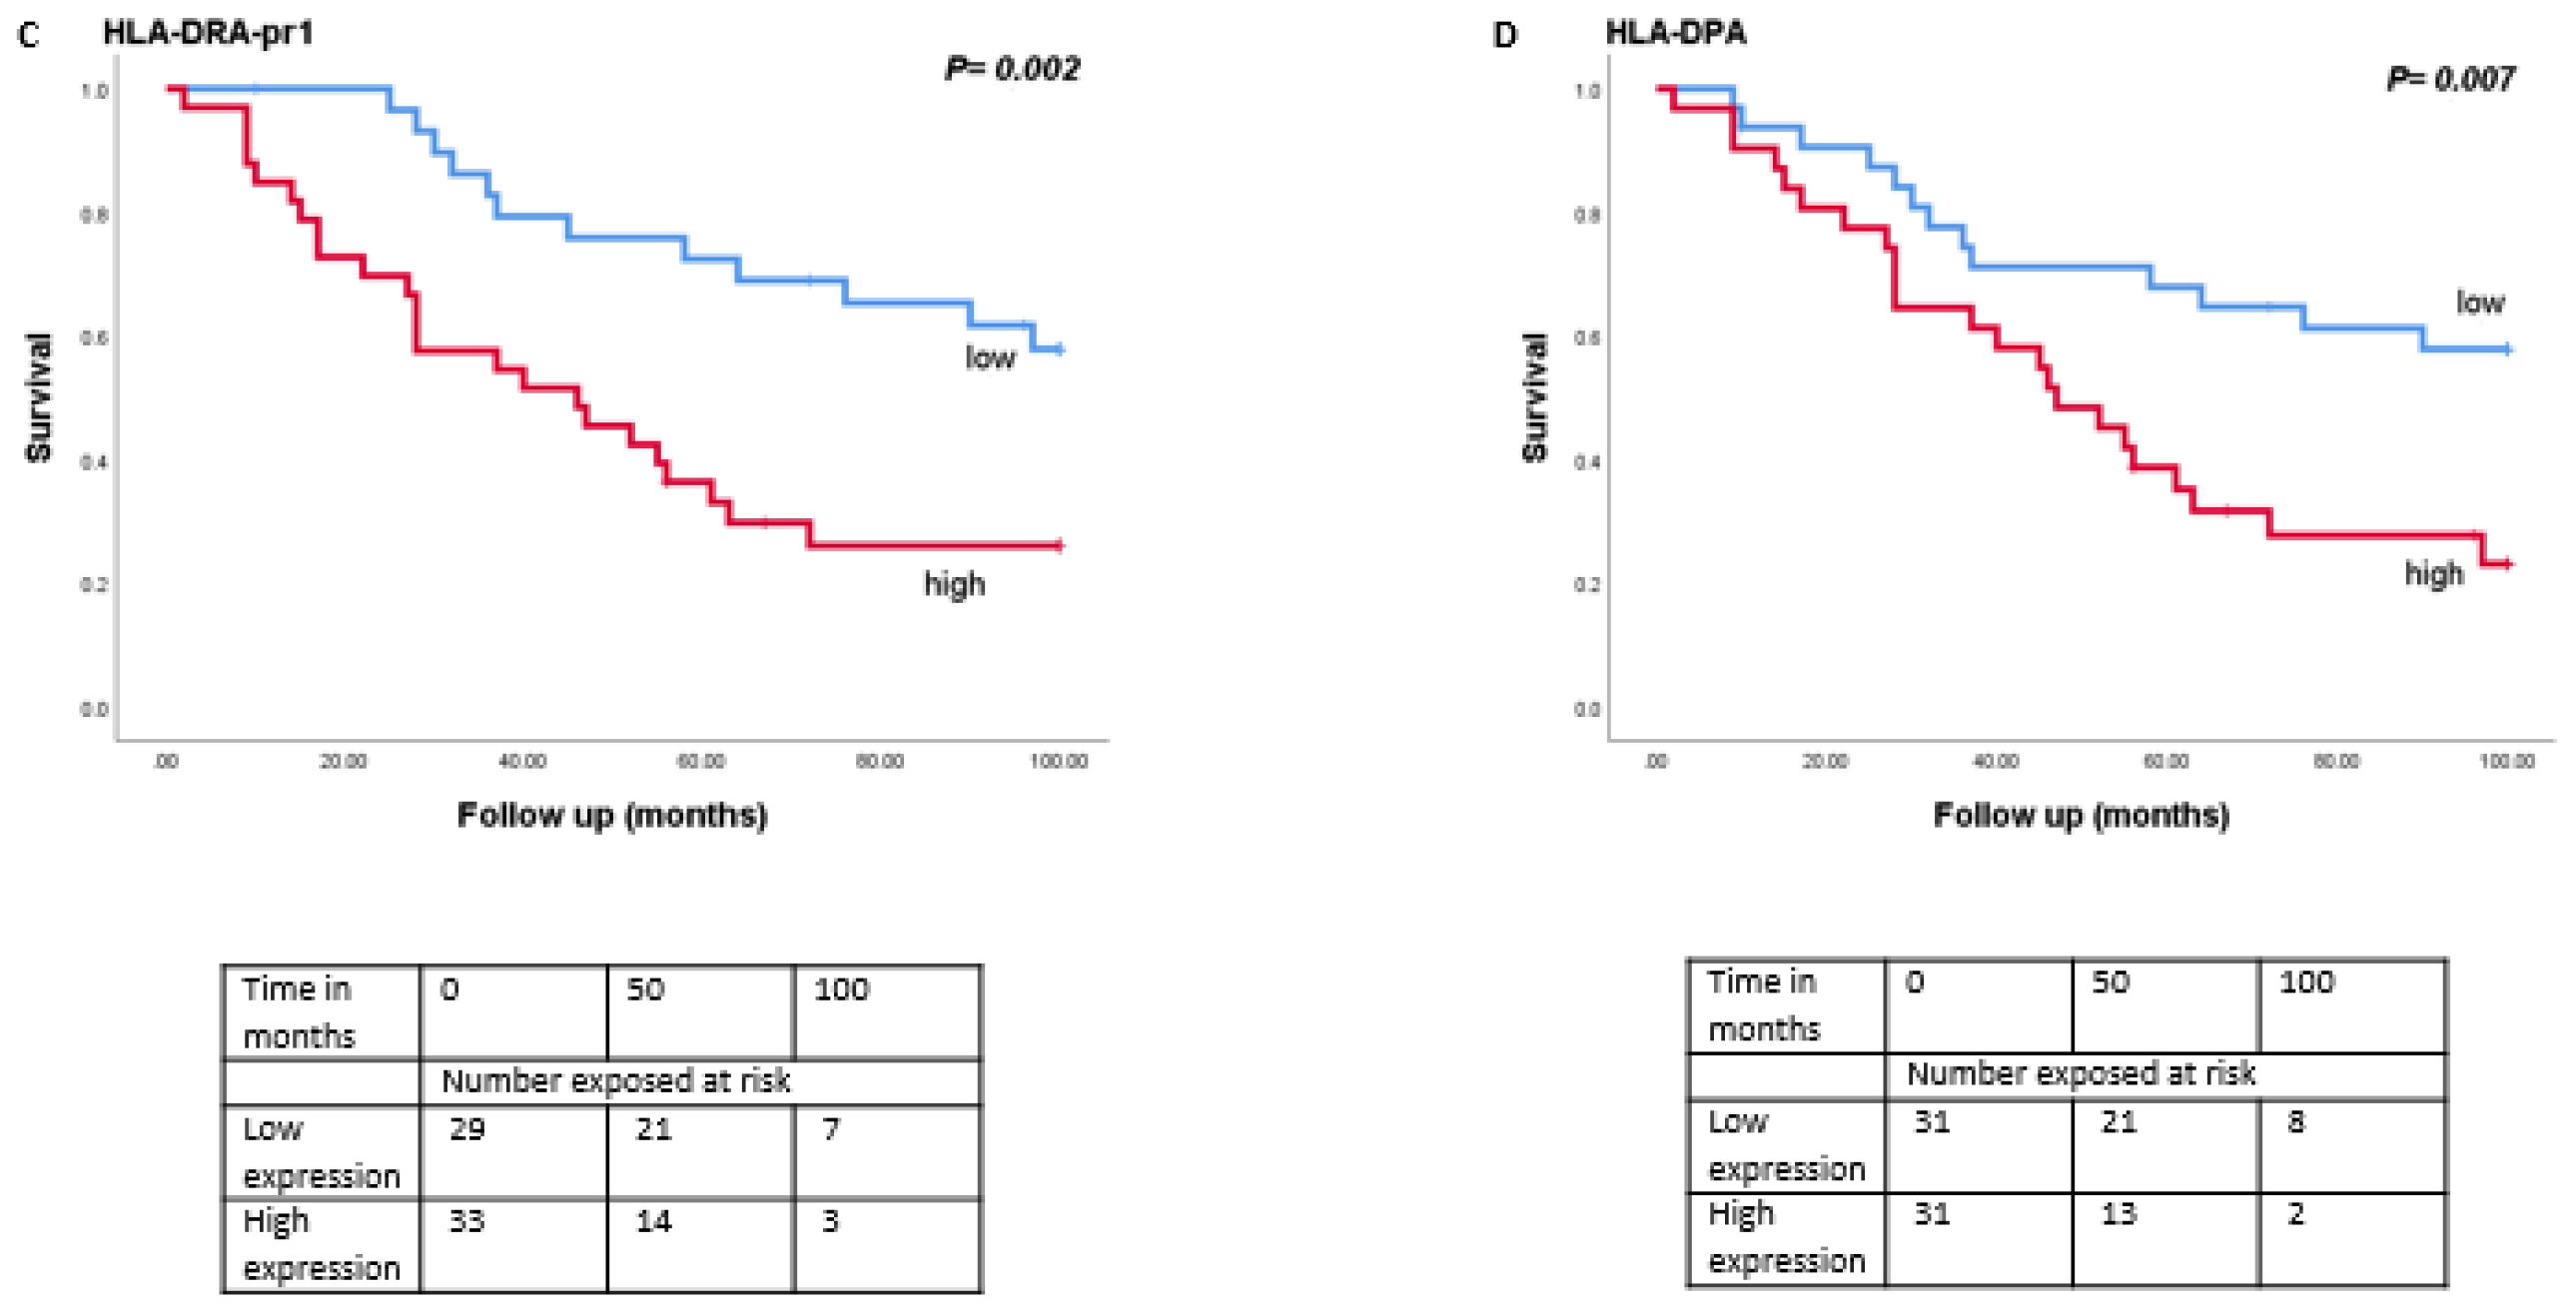
As monosomy 3 is associated with a worse prognosis, we then analysed the relation between expression levels of LAG3, LSECtin, Galectin-3, and HLA class II molecules with survival in the Leiden set of 64 UM (Figure 4). Tumours with a high expression of LAG3 (split at the inflection point into high and low, p = 0.01), Galectin-3 (split at the median, p = 0.001), HLA-DRalpha (split at the median, p = 0.002), HLA-DQalpha (split at the median, p = 0.04), HLA-DQbeta2 (split at the median, p = 0.02) and HLA-DPalpha (split at the median, p = 0.007) were associated with a significantly worse metastasis-related survival, while mRNA expression levels of LSECtin did not show an association with survival (p = 0.39).
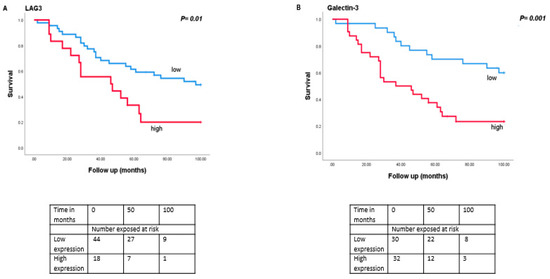
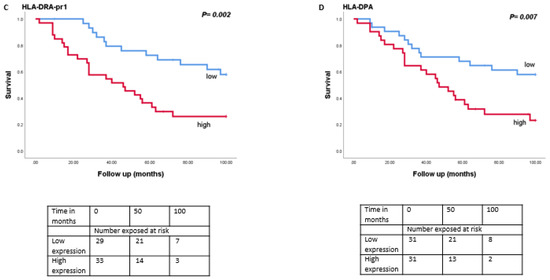
Figure 4.
Kaplan-Meier survival curves based on mRNA expression of LAG3, Galectin-3, and HLA class II molecules. A log-rank test was used for statistical testing. p ≤ 0.05 is considered significant (A): LAG3, (B): Galectin-3, (C): HLA-DR-probe 1, (D): HLA-DPA.
When we split the cohort in D3 and M3 cases, no significant differences were observed in the survival of the D3 group (n = 24) (Figure S2) while in the M3 group (n = 40), increased levels of Galectin-3 (split at the median, p = 0.05) and HLA-DRalpha (split at the median, p = 0.02) were significantly associated with a worse metastasis-related survival (Figure S3).
3.6. LAG3 and Immune Modulators
Combining several monoclonal antibodies directed against checkpoint inhibitors as treatment might boost the overall response to therapy in patients [27,28]. We therefore decided to look at the correlation between expression of LAG3 and other immune modulators: LAG3 showed a positive correlation with PD-1 (two-tailed Spearman correlation coefficient R = 0.655, p < 0.001), CTLA-4 (R = 0.298, p = 0.02), IDO-1 (R = 0.759, p < 0.001) and one of the probes of TIGIT (R = 0.413, p = 0.001), while it did not show a significance association with TIGIT’s second probe (R = −0.207, p = 0.10) (Table S1A). Even higher associations were seen in the TCGA cohort (Table S1B).
4. Discussion
High-risk primary UM is associated with inflammation and its metastases are non-responsive to most current immunotherapy approaches. A treatment for metastases is eagerly awaited: many different studies have tested anti-PD-1 and anti-CTLA-4 therapies in UM patients, but results have been unsatisfactory, especially in comparison with metastasized cutaneous melanoma, with very few complete or partial responses [13,33,34]. As tumours with a high risk of developing metastases can be recognized because they carry specific chromosome aberrations and mutations, developing an early adjuvant therapy for preventing metastases would be most welcome. Such an adjuvant treatment proved useful in cutaneous melanoma patients [35]. Chromosome 3/BAP1 loss is a leading event in the development of the highest risk UM, which often give rise to metastases. A strong association was observed between chromosome 3/BAP1 loss and an inflammatory phenotype, consisting of a mixed arrangement of leukocytes and enhanced inflammation [7,8,14,15,36]. The recent study by Figueiredo et al. showed that BAP1 loss is associated with upregulation of multiple genes responsible for immunosuppression including LAG3 [15].
The immune checkpoints that we specifically investigated were LAG3 and its ligands. In our two Leiden cohorts, we had data on BAP1 immunohistochemistry, and we obtained long-term follow-up information. We confirmed that high levels of LAG3 expression in UM were positively associated with high-risk tumour parameters, such as epithelioid/mixed cell type and chromosome 3/BAP1 loss, and described an association with the presence of inflammatory cells. We show in several datasets that not only a high expression of LAG3 but also of its ligands is associated with bad survival rates. Recently, the group of Harbour commented that LAG3 was the most dominant immune checkpoint molecule in UM [23]. They studied a small series of primary UM and metastases by single cell RNAseq analysis. It might be that the CD8 cytotoxic T cell population in UM is functionally exhausted by the LAG3-signaling cascade. Such a situation was described in follicular lymphoma, with T cells forming a heterogenic population: some of the T cells which expressed PD-1 were also LAG3 positive. The PD-1+LAG-3+ CD8 population was poor in cytokine production compared with the group which was LAG3 negative and hence was immunologically non-functional; moreover, in accordance with what we found in UM, the high level of LAG3 correlated with worse survival in this disease [37]. Hoefsmit recently described that liver metastases from UM patients often contain LAG3-expressing lymphocytes [38].
One of the ligands for LAG3 is LSECtin, a member of the selectin family, which is highly expressed in liver tissue [39]. In one study, LSECtin was expressed on murine B16 melanoma cells: interaction between LSECtin and LAG3 led to inhibition of Interferon γ (IFNγ) secretion by CD8 T cells and reduced their cytotoxic activity, promoting tumour growth [40]. We found positive associations of the expression of LSECtin with the expression of LAG3 (p < 0.001), but no significant difference between D3 and M3 tumours.
Galectin-3 is a type of lectin with immune checkpoint inhibitory activity through its capacity to bind to LAG3 on CD8+ effector T cells. It can serve as a chemoattractant for macrophages and is reported to be highly expressed during inflammation [41]. One biological process in which this protein might be involved is the suppression of T cell-mediated lysis: Galectin-3 was shown to interact with LAG3 present on CD8 cells in pancreatic ductal adenocarcinoma. Depletion of Galectin-3 improved CD8 cytotoxicity [42]. In cutaneous melanocytic lesions, melanoma and metastases more often displayed nuclear and cytoplasmic Galectin-3 than naevi [43]. In accordance with what we observed, the expression of Galectin-3 was identified as a marker for a low overall survival of different cancers such as colorectal, ovarian, and non-small cell lung cancer, serving as an anti-apoptotic, proangiogenic and invasive agent [44]. It was reported that Galectin-3 promotes ocular inflammation and when knocked down, decreases angiogenesis signalling pathways in human endothelial cells [45]. From these studies and the association of the elevated expression of Galectin-3 and LAG3, we can assume that the interaction between Galectin-3/LAG3 may take place in UM and may be a cause for the blunted activity of CD8 cells.
A third set of LAG3 ligands is made up of the HLA class II antigens, which are expressed on tumour cells, antigen-presenting cells, and a subset of T cells. These heterodimer cell surface molecules consist of alpha and beta chains. The HLA antigens can present antigens to CD4 T cells through binding to their T cell receptors. HLA class II molecules consist of three isotypes: DR, DQ, and DP which differ slightly in structure [46,47]. Cutaneous melanoma cells express high levels of HLA class II, which were shown to inhibit T cell anti-tumoural activity through their LAG3 receptor [48]. In UM, HLA class II is expressed in primary UM and carries prognostic significance [6]. In 1988, Jager et al. reported that HLA class II is expressed in UM, although less than in HLA class I. Our prior study showed that HLA-DQ was associated with increased numbers of infiltrating TILs [49]. When we compared expression levels between D3 and M3 tumours in the 64-case Leiden cohort, most class II molecules were higher in high-risk M3 tumours. We confirmed that HLA class II expression was enhanced in M3 tumours by analysing the TCGA data and by testing a second Dutch cohort of fifteen UM using Fluidigm PCR. It was been reported that HLA-DR is the dominant isoform for antigen-restricted T cell stimulation with HLA-DQ contributing less in different diseases [50,51,52].
IFNγ is a strong inducer for HLA class II molecules in UM [53]; we suggest a positive feedback loop between the tumour cells HLA class II expression, and the infiltrate: genetically bad tumours with loss of one chromosome 3 and a mutation in the BAP1 gene upregulate surface LAG3 ligands (LSECtin, Galectin-3, and HLA class II) to attract T cells which express LAG3. High-risk M3 tumours not only contain more infiltrating lymphocytes and macrophages, but also express higher levels of immune checkpoint inhibitors: we show that LAG3 is co-expressed with other immune checkpoints (PD-1, CTLA-4, and IDO-1), suggesting that the combination of anti-checkpoint therapies might be more appropriate in UM than single anti-checkpoint antibodies, as others also find this appropriate in other diseases such as cutaneous melanoma [27].
5. Conclusions
Taken together, our data demonstrate elevated expression levels of not only LAG3 but also of its ligands in high-risk M3 tumours. Moreover, we indicate that a positive association is found between the expression of LAG3 and its ligands with other immune checkpoints and immune modulators. Experimental work in animals and clinical trials are indicated to validate the potential of using LAG3 and its ligands as targets for immunotherapy in UM.
Supplementary Materials
The following is available online at https://www.mdpi.com/article/10.3390/cancers13174445/s1, Figure S1: Comparison of gene expression of LAG3, CIITA, and HLA Class II in 80 UM from TCGA cohort (D3 (n = 37) vs. M3 (n = 43)), in relation to the tumor’s chromosome 3 status. A Mann–Whitney U test was applied. Horizontal bars indicate mean gene expression, Figure S2: Survival curves for LAG3, Galectin-3, HLA-DRA probe 1 and HLA-DPA in the Leiden D3 tumours (all split in two groups along the median), Figure S3: Survival curves for LAG3, Galectin-3, HLA-DRA probe1 and HLA-DPA in the Leiden M3 tumours (all split in two groups along the median), Table S1: Correlation between mRNA expression levels (determined by Illumina array) of LSECtin, Galectin-3, HLA Class II genes and infiltrate markers versus expression of LAG3 in: A. the Leiden cohort (n = 64), and B. the TCGA cohort (n = 80). R = two-tailed Spearman correlation coefficient.
Author Contributions
Conceptualisation, Z.S., M.J.J.; methodology, Z.S., W.G.M.K., R.M.V. and M.E.; formal analysis, Z.S.; data curation, A.P.A.W.; Writing—Original draft preparation, Z.S. and M.J.J.; Writing—Review and Editing, A.P.A.W., W.G.M.K., P.A.v.d.V., R.M.V., M.E., G.P.M.L. and M.J.J.; supervision, M.J.J.; funding acquisition, P.A.v.d.V. and M.J.J. All authors have read and agreed to the published version of the manuscript.
Funding
This research was funded by a grant to Z.S. from The Iranian Ministry of Science Research and Technology, Grant UL 2011-4991 from the Dutch Cancer Society (KWF), Stichting Leids Oogheelkundig Ondersteunings Fonds LOOF and a Horizon 2020 grant from the European Community, CURE UM, nr. 667787.
Institutional Review Board Statement
This project was approved by the METC of the LUMC (B14.003/SH/sh Approval Biobank OOG-2 “Oogtumoren (of een verdenking hierop)”. The research adhered to Dutch law and the tenets of the Declaration of Helsinki (World Medical Association of Declaration 2013; ethical principles for medical research involving human subjects).
Informed Consent Statement
Informed consent was obtained from all subjects involved in the study.
Data Availability Statement
Data from the Leiden cohort are partially accessible through GEO accession number GSE84976 (https://www.ncbi.nlm.nih.gov/geo/query/acc.cgi?acc=GSE84976, accessed date: 20 August 2021).
Conflicts of Interest
The authors declare no conflict of interest.
References
- Metzelaar-Blok, J.A.; Ter Huurne, J.A.; Hurks, H.M.; Keunen, J.E.; Jager, M.J.; Gruis, N. Characterization of melanocortin-1 receptor gene variants in uveal melanoma patients. Investig. Ophthalmol. Vis. Sci. 2001, 42, 1951–1954. [Google Scholar]
- Houtzagers, L.E.; Wierenga, A.P.A.; Ruys, A.A.M.; Luyten, G.P.M.; Jager, M.J. Iris colour and the risk of developing Uveal Melanoma. Int. J. Mol. Sci. 2020, 21, 7172. [Google Scholar] [CrossRef] [PubMed]
- Kujala, E.; Mäkitie, T.; Kivelä, T. Very long-term prognosis of patients with malignant uveal melanoma. Investig. Ophthalmol. Vis. Sci. 2003, 44, 4651–4660. [Google Scholar] [CrossRef] [PubMed] [Green Version]
- Roelofsen, C.D.; Wierenga, A.P.; van Duinen, S.; Verdijk, R.M.; Bleeker, J.; Marinkovic, M.; Luyten, G.P.; Jager, M.J. Five decades of enucleations for uveal melanoma in one center: More tumours with high risk factors, no improvement in survival over time. Ocul. Oncol. Pathol. 2020, 7, 133–141. [Google Scholar] [CrossRef] [PubMed]
- Blom, D.J.; Luyten, G.P.; Mooy, C.; Kerkvliet, S.; Zwinderman, A.H.; Jager, M.J. Human leukocyte antigen class I expression. Marker of poor prognosis in uveal melanoma. Investig. Ophthalmol. Vis. Sci. 1997, 38, 1865–1872. [Google Scholar]
- Ericsson, C.; Seregard, S.; Bartolazzi, A.; Levitskaya, E.; Ferrone, S.; Kiessling, R.; Larsson, O. Association of HLA class I and class II antigen expression and mortality in uveal melanoma. Investig. Ophthalmol. Vis. Sci. 2001, 42, 2153–2156. [Google Scholar]
- Maat, W.; Ly, L.V.; Jordanova, E.S.; De Wolff-Rouendaal, D.; Schalij-Delfos, N.E.; Jager, M.J. Monosomy of chromosome 3 and an inflammatory phenotype occur together in uveal melanoma. Investig. Ophthalmol. Vis. Sci. 2008, 49, 505–510. [Google Scholar] [CrossRef]
- Bronkhorst, I.H.G.; Vu, T.H.K.; Jordanova, E.S.; Luyten, G.P.M.; van der Burg, S.H.; Jager, M.J. Different subsets of tumour-infiltrating lymphocytes correlate with macrophage influx and monosomy 3 in uveal melanoma. Investig. Ophthalmol. Vis. Sci. 2012, 53, 5370–5378. [Google Scholar] [CrossRef] [Green Version]
- Robertson, A.G.; Shih, J.; Yau, C.; Gibb, E.A.; Oba, J.; Mungall, K.L.; Hess, J.M.; Uzunangelov, V.; Walter, V.; Danilova, L.; et al. Integrative analysis identifies four molecular and clinical subsets in Uveal Melanoma. Cancer Cell 2017, 32, 204–220. [Google Scholar] [CrossRef] [Green Version]
- Niederkorn, J.Y. Immune escape mechanisms of intraocular tumours. Prog. Retin. Eye Res. 2009, 28, 329–347. [Google Scholar] [CrossRef] [Green Version]
- Ly, L.V.; Baghat, A.; Versluis, M.; Jordanova, E.S.; Luyten, G.P.M.; Van Rooijen, N.; van Hall, T.; Van Der Velden, P.A.; Jager, M.J. In aged mice, outgrowth of intraocular melanoma depends on proangiogenic M2-type macrophages. J. Immunol. 2010, 185, 3481–3488. [Google Scholar] [CrossRef] [PubMed] [Green Version]
- De Lange, M.J.; Nell, R.; Lalai, R.N.; Versluis, M.; Jordanova, E.S.; Luyten, G.P.; Jager, M.J.; Van Der Burg, S.H.; Zoutman, W.H.; van Hall, T.; et al. Digital PCR-Based T-cell Quantification-Assisted deconvolution of the microenvironment reveals that activated macrophages drive tumour inflammation in Uveal Melanoma. Mol. Cancer Res. 2018, 16, 1902–1911. [Google Scholar] [CrossRef] [Green Version]
- Jager, M.J.; Shields, C.L.; Cebulla, C.M.; Abdel-Rahman, M.H.; Grossniklaus, H.E.; Stern, M.-H.; Carvajal, R.D.; Belfort, R.N.; Jia, R.; Shields, J.A.; et al. Uveal melanoma. Nat. Rev. Dis. Primers 2020, 6, 1–25. [Google Scholar] [CrossRef] [PubMed]
- Gezgin, G.; Dogrusöz, M.; Van Essen, T.H.; Kroes, W.G.M.; Luyten, G.P.M.; Van Der Velden, P.A.; Walter, V.; Verdijk, R.M.; van Hall, T.; Van Der Burg, S.H.; et al. Genetic evolution of uveal melanoma guides the development of an inflammatory microenvironment. Cancer Immunol. Immunother. 2017, 66, 903–912. [Google Scholar] [CrossRef] [Green Version]
- Figueiredo, C.R.; Kalirai, H.; Sacco, J.J.; Azevedo, R.A.; Duckworth, A.; Slupsky, J.R.; Coulson, J.M.; Coupland, S.E. Loss of BAP1 expression is associated with an immunosuppressive microenvironment in uveal melanoma, with implications for immunotherapy development. J. Pathol. 2020, 250, 420–439. [Google Scholar] [CrossRef] [Green Version]
- Ishida, Y.; Agata, Y.; Shibahara, K.; Honjo, T. Induced expression of PD-1, a novel member of the immunoglobulin gene superfamily, upon programmed cell death. EMBO J. 1992, 11, 3887–3895. [Google Scholar] [CrossRef]
- Wierenga, A.P.; Cao, J.; Luyten, G.P.; Jager, M.J. Immune checkpoint inhibitors in uveal and conjunctival melanoma. Int. Ophthalmol. Clin. 2019, 59, 53–63. [Google Scholar] [CrossRef]
- Triebel, F.; Jitsukawa, S.; Baixeras, E.; Roman-Roman, S.; Genevee, C.; Viegas-Pequignot, E.; Hercend, T. LAG-3, a novel lymphocyte activation gene closely related to CD4. J. Exp. Med. 1990, 171, 1393–1405. [Google Scholar] [CrossRef] [Green Version]
- Huard, B.; Mastrangeli, R.; Prigent, P.; Bruniquel, D.; Donini, S.; El-Tayar, N.; Triebel, F. Characterization of the major histocompatibility complex class II binding site on LAG-3 protein. Proc. Natl. Acad. Sci. USA 1997, 94, 5744–5749. [Google Scholar] [CrossRef] [Green Version]
- Maruhashi, T.; Okazaki, I.-M.; Sugiura, D.; Takahashi, S.; Maeda, T.K.; Shimizu, K.; Okazaki, T. LAG-3 inhibits the activation of CD4+ T cells that recognize stable pMHCII through its conformation-dependent recognition of pMHCII. Nat. Immunol. 2018, 19, 1415–1426. [Google Scholar] [CrossRef] [PubMed]
- Andrews, L.P.; Marciscano, A.E.; Drake, C.G.; Vignali, D.A.A. LAG3 (CD223) as a cancer immunotherapy target. Immunol. Rev. 2017, 276, 80–96. [Google Scholar] [CrossRef] [PubMed]
- Woo, S.-R.; Turnis, M.E.; Goldberg, M.V.; Bankoti, J.; Selby, M.; Nirschl, C.; Bettini, M.L.; Gravano, D.M.; Vogel, P.; Liu, C.L.; et al. Immune inhibitory molecules LAG-3 and PD-1 synergistically regulate T-cell function to promote tumoural immune escape. Cancer Res. 2012, 72, 917–927. [Google Scholar] [CrossRef] [Green Version]
- Durante, M.A.; Rodriguez, D.A.; Kurtenbach, S.; Kuznetsov, J.N.; Sanchez, M.I.; Decatur, C.L.; Snyder, H.; Feun, L.G.; Livingstone, A.S.; Harbour, J.W. Single-cell analysis reveals new evolutionary complexity in uveal melanoma. Nat. Commun. 2020, 11, 1–10. [Google Scholar] [CrossRef] [Green Version]
- Ascierto, P.; Ferrucci, P.; Stephens, R.; Del Vecchio, M.; Atkinson, V.; Schmidt, H.; Schachter, J.; Queirolo, P.; Long, G.; Di Giacomo, A.; et al. Phase II multicenter, single arm, open label study of nivolumab in combination with ipilimumab in untreated patients with metastatic uveal melanoma. Ann. Oncol. 2018, 29, viii443. [Google Scholar] [CrossRef]
- Rozeman, E.A.; Prevoo, W.; Meier, M.A.; Sikorska, K.; Van, T.M.; Van De Wiel, B.A.; Van Der Wal, J.E.; Mallo, H.A.; Grijpink-Ongering, L.G.; Broeks, A.; et al. Phase Ib/II trial testing combined radiofrequency ablation and ipilimumab in uveal melanoma (SECIRA-UM). Melanoma Res. 2020, 30, 252–260. [Google Scholar] [CrossRef] [PubMed]
- Duhoux, F.P.; Dirix, L.Y.; Huizing, M.T. Combination of paclitaxel and a LAG-3 fusion protein (eftilagimod alpha), as a first-line chemoimmunotherapy in patients with metastatic breast carcinoma (MBC): Final results from the run-in phase of a placebo-controlled randomized phase II. J. Clin. Oncol. 2018, 36, 1050. [Google Scholar] [CrossRef]
- Ascierto, P.A.; Melero, I.; Bhatia, S.; Bono, P.; Sanborn, R.E.; Lipson, E.J.; Callahan, M.K.; Gajewski, T.; Gomez-Roca, C.A.; Hodi, F.S.; et al. Initial efficacy of anti-lymphocyte activation gene-3 (anti–LAG-3; BMS-986016) in combination with nivolumab (nivo) in PTS with melanoma (MEL) previously treated with anti–PD-1/PD-L1 therapy. J. Clin. Oncol. 2017, 35, 9520. [Google Scholar] [CrossRef]
- Khan, S.; Carvajal, R.D. Dual Immunological Checkpoint Blockade for Uveal Melanoma. J. Clin. Oncol. 2021, 39, 586–599. [Google Scholar] [CrossRef] [PubMed]
- Versluis, M.; De Lange, M.J.; Van Pelt, S.I.; Ruivenkamp, C.A.L.; Kroes, W.G.M.; Cao, J.; Jager, M.J.; Luyten, G.P.M.; Van Der Velden, P.A. Digital PCR Validates 8q Dosage as Prognostic Tool in Uveal Melanoma. PLoS ONE 2015, 10, e0116371. [Google Scholar] [CrossRef] [PubMed] [Green Version]
- Van Essen, T.H.; Van Pelt, S.I.; Bronkhorst, I.H.G.; Versluis, M.; Némati, F.; Laurent, C.; Luyten, G.P.M.; Van Hall, T.; Elsen, P.J.V.D.; Van Der Velden, P.A.; et al. Upregulation of HLA Expression in Primary Uveal Melanoma by Infiltrating Leukocytes. PLoS ONE 2016, 11, e0164292. [Google Scholar] [CrossRef]
- Zoutman, W.H.; Nell, R.J.; Versluis, M.; van Steenderen, D.; Lalai, R.N.; Out-Luiting, J.J.; de Lange, M.J.; Vermeer, M.H.; Langerak, A.W.; van der Velden, P.A. Accurate quantification of T cells by measuring loss of germline T-cell receptor loci with generic single duplex droplet digital PCR assays. J. Mol. Diagn. 2017, 19, 236–243. [Google Scholar] [CrossRef] [PubMed] [Green Version]
- Wierenga, A.P.A.; Gezgin, G.; Van Beelen, E.; Eikmans, M.; Spruyt-Gerritse, M.; Brouwer, N.J.; Versluis, M.; Verdijk, R.M.; Van Duinen, S.G.; Marinkovic, M.; et al. Soluble HLA in the aqueous humour of uveal melanoma is associated with unfavourable tumour characteristics. Cancers 2019, 11, 1202. [Google Scholar] [CrossRef] [Green Version]
- Jochems, A.; Van Der Kooij, M.K.; Fiocco, M.; Schouwenburg, M.G.; Aarts, M.J.; Van Akkooi, A.C.; Berkmortel, F.W.V.D.; Blank, C.U.; Eertwegh, A.J.V.D.; Franken, M.G.; et al. Metastatic uveal melanoma: Treatment strategies and survival—Results from the Dutch melanoma treatment registry. Cancers 2019, 11, 1007. [Google Scholar] [CrossRef] [PubMed] [Green Version]
- Rodrigues, M.; De Koning, L.; Coupland, S.E.; Jochemsen, A.G.; Marais, R.; Stern, M.-H.; Valente, A.; Barnhill, R.; Cassoux, N.; Evans, A.; et al. So Close, yet so Far: Discrepancies between Uveal and Other Melanomas. A Position Paper from UM Cure 2020. Cancers 2019, 11, 1032. [Google Scholar] [CrossRef] [PubMed] [Green Version]
- Eggermont, A.M.; Sileni, V.C.; Grob, J.-J.; Dummer, R.; Wolchok, J.D.; Schmidt, H.; Hamid, O.; Robert, C.; Ascierto, P.A.; Richards, J.M.; et al. Prolonged survival in Stage III melanoma with ipilimumab adjuvant therapy. N. Engl. J. Med. 2016, 375, 1845–1855. [Google Scholar] [CrossRef] [PubMed] [Green Version]
- Souri, Z.; Wierenga, A.P.A.; Van Weeghel, C.; Van Der Velden, P.A.; Kroes, W.G.M.; Luyten, G.P.M.; Van Der Burg, S.H.; Jochemsen, A.G.; Jager, M.J. Loss of BAP1 is associated with upregulation of the NFKB pathway and increased HLA class I expression in uveal melanoma. Cancers 2019, 11, 1102. [Google Scholar] [CrossRef] [Green Version]
- Yang, Z.-Z.; Kim, H.J.; Villasboas, J.C.; Chen, Y.-P.; Price-Troska, T.; Jalali, S.; Wilson, M.; Novak, A.J.; Ansell, S.M. Expression of LAG-3 defines exhaustion of intratumoural PD-1+ T cells and correlates with poor outcome in follicular lymphoma. Oncotarget 2017, 8, 61425–61439. [Google Scholar] [CrossRef] [PubMed] [Green Version]
- Hoefsmit, E.P.; Rozeman, E.A.; Van, T.M.; Dimitriadis, P.; Krijgsman, O.; Conway, J.W.; da Silva, I.P.; Van der Wal, J.E.; Ketelaars, S.L.C.; Bresser, K.; et al. Comprehensive analysis of cutaneous and uveal melanoma liver metastases. J. Immunother. Cancer 2020, 8, e001501. [Google Scholar] [CrossRef]
- Liu, W.; Tang, L.; Zhang, G.; Wei, H.; Cui, Y.; Guo, L.; Gou, Z.; Chen, X.; Jiang, D.; Zhu, Y.; et al. Characterization of a novel C-type lectin-like gene, LSECtin: Demonstration of carbohydrate binding and expression in sinusoidal endothelial cells of liver and lymph node. J. Biol. Chem. 2004, 279, 18748–18758. [Google Scholar] [CrossRef] [Green Version]
- Xu, F.; Liu, J.; Liu, D.; Liu, B.; Wang, M.; Hu, Z.; Du, X.; Tang, L.; He, F. LSECtin expressed on melanoma cells promotes tumour progression by inhibiting antitumour T-cell responses. Cancer Res. 2014, 74, 3418–3428. [Google Scholar] [CrossRef] [Green Version]
- Flotte, T.J.; Springer, T.A.; Thorbecke, G.J. Dendritic cell and macrophage staining by monoclonal antibodies in tissue sections and epidermal sheets. Am. J. Pathol. 1983, 111, 111–112. [Google Scholar]
- Kouo, T.S.; Huang, L.; Pucsek, A.B.; Cao, M.; Solt, S.; Armstrong, T.D.; Jaffee, E.M. Galectin-3 shapes antitumour immune responses by suppressing CD8+ T cells via LAG-3 and inhibiting expansion of plasmacytoid dendritic cells. Cancer Immune Res. 2015, 3, 412–423. [Google Scholar] [CrossRef] [Green Version]
- Prieto, V.G.; Mourad-Zeidan, A.A.; Melnikova, V.; Johnson, M.M.; Lopez, A.; Diwan, A.H.; Lazar, A.; Shen, S.S.; Zhang, P.S.; Reed, J.A.; et al. Galectin-3 expression is associated with tumour progression and pattern of sun exposure in melanoma. Clin. Cancer Res. 2006, 12, 6709–6715. [Google Scholar] [CrossRef] [PubMed] [Green Version]
- Wang, Y.; Liu, S.; Tian, Y.; Wang, Y.; Zhang, Q.; Zhou, X.; Meng, X.; Song, N. Prognostic role of galectin-3 expression in patients with solid tumours: A meta-analysis of 36 eligible studies. Cancer Cell Internat. 2018, 18, 1–5. [Google Scholar] [CrossRef]
- Markowska, A.I.; Jefferies, K.C.; Panjwani, N. Galectin-3 protein modulates cell surface expression and activation of vascular endothelial growth factor receptor 2 in human endothelial cells. J. Biol. Chem. 2011, 34, 29913–29921. [Google Scholar] [CrossRef] [PubMed] [Green Version]
- Korman, A.J.; Boss, J.M.; Spies, T.; Sorrentino, R.; Okada, K.; Strominger, J.L. Genetic Complexity and Expression of Human Class II Histocompatibility Antigens. Immunol. Rev. 1985, 85, 45–86. [Google Scholar] [CrossRef]
- Trowsdale, J.; Young, J.A.T.; Kelly, A.R.; Austin, P.J.; Carson, S.; Meunter, H.; So, A.; Erlich, H.A.; Spielman, R.S.; Bodmer, J.; et al. Structure, sequence and polymorphism in the HLA-D region. Immunol. Rev. 1985, 85, 5–43. [Google Scholar] [CrossRef]
- Hemon, P.; Jean-Louis, F.; Ramgolam, K.; Brignone, C.; Viguier, M.; Bachelez, H.; Triebel, F.; Charron, D.; Aoudjit, F.; Al-Daccak, R.; et al. MHC Class II Engagement by Its Ligand LAG-3 (CD223) Contributes to Melanoma Resistance to Apoptosis. J. Immunol. 2011, 186, 5173–5183. [Google Scholar] [CrossRef] [Green Version]
- Jager, M.J.; van der Pol, J.P.; de Wolff-Rouendaal, D.; de Jong, P.T.; Ruiter, D.J. Decreased expression of HLA class II antigens on human uveal melanoma cells after in vivo X-ray irradiation. Am. J. Ophthalmol. 1988, 105, 78–86. [Google Scholar] [CrossRef] [Green Version]
- Karp, D.R.; Teletski, C.L.; Jaraquemada, D.; Maloy, W.L.; Coligan, J.E.; Long, E.O. Structural requirements for pairing of alpha and beta chains in HLA-DR and HLA-DP molecules. J. Exp. Med. 1990, 171, 615–628. [Google Scholar] [CrossRef] [PubMed] [Green Version]
- Ulvestad, E.; Williams, K.; Bø, L.; Trapp, B.; Antel, J.; Mørk, S. HLA class II molecules (HLA-DR,-DP,-DQ) on cells in the human CNS studied in situ and in vitro. Immunology 1994, 82, 535–541. [Google Scholar] [PubMed]
- Grifoni, A.; Moore, E.; Voic, H.; Sidney, J.; Phillips, E.; Jadi, R.; Mallal, S.; De Silva, A.D.; De Silva, A.M.; Peters, B.; et al. Characterization of magnitude and antigen specificity of HLA-DP, DQ, and DRB3/4/5 restricted DENV-specific CD4+ T cell responses. Front. Immunol. 2019, 10, 1568–1578. [Google Scholar] [CrossRef] [PubMed] [Green Version]
- De Waard-Siebinga, I.; Creyghton, W.M.; Kool, J.; Jager, M.J. Effects of interferon alfa and gamma on human uveal melanoma cells in vitro. Br. J. Ophthalmol. 1995, 79, 847–855. [Google Scholar] [CrossRef] [PubMed] [Green Version]

Publisher’s Note: MDPI stays neutral with regard to jurisdictional claims in published maps and institutional affiliations. |
© 2021 by the authors. Licensee MDPI, Basel, Switzerland. This article is an open access article distributed under the terms and conditions of the Creative Commons Attribution (CC BY) license (https://creativecommons.org/licenses/by/4.0/).