
PTEN and DNA Ploidy Status by Machine Learning in Prostate Cancer

 , , ,
, , ,
Abstract
:Simple Summary
Abstract
1. Introduction
2. Materials and Methods
2.1. Patients
2.2. Discovery Cohort and Test Subset
2.3. Validation Cohort
2.4. Immunohistochemistry, Scanning of Tissue Slides, and Manual PTEN Scoring
2.5. DNA Image Cytometry
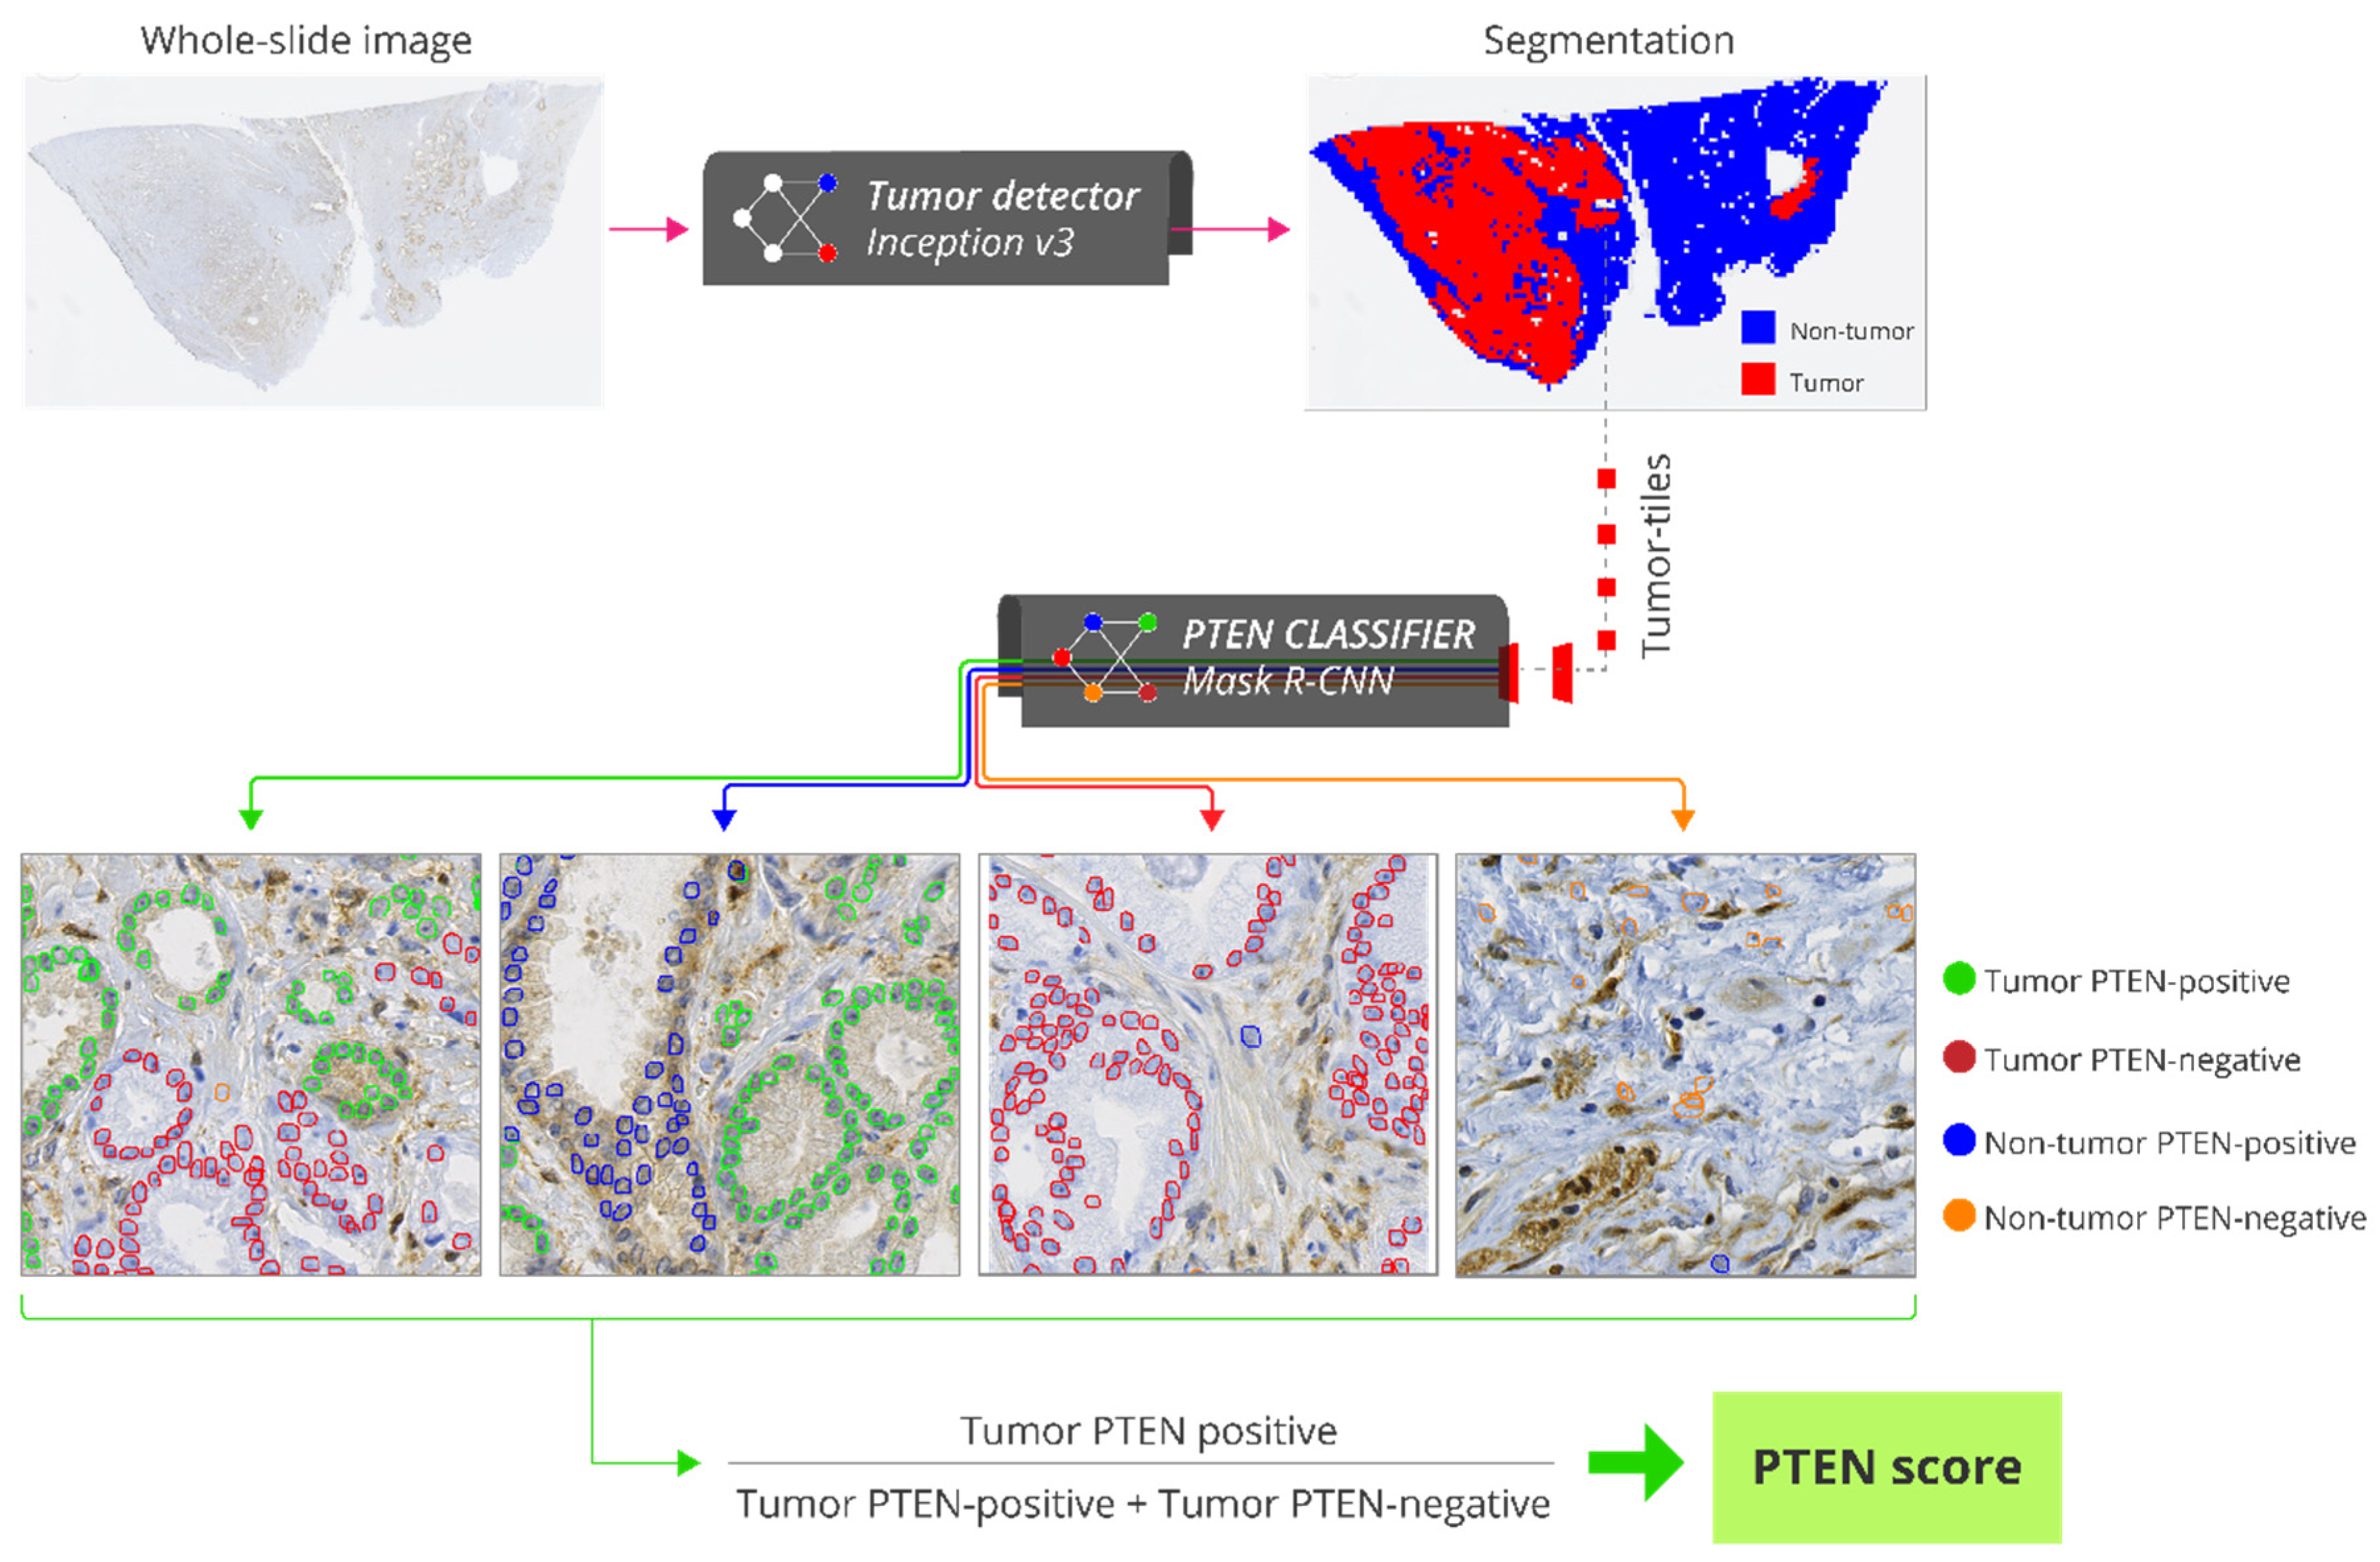
2.6. Automatic PTEN Scoring
2.7. Statistical Analyses
3. Results
3.1. Test Subset
3.2. Validation Cohort
4. Discussion
5. Conclusions
Supplementary Materials
Author Contributions
Funding
Institutional Review Board Statement
Informed Consent Statement
Data Availability Statement
Acknowledgments
Conflicts of Interest
References
- Topol, E.J. High-performance medicine: The convergence of human and artificial intelligence. Nat. Med. 2019, 25, 44–56. [Google Scholar] [CrossRef] [PubMed]
- Niazi, M.K.K.; Parwani, A.V.; Gurcan, M.N. Digital pathology and artificial intelligence. Lancet Oncol. 2019, 20, e253–e261. [Google Scholar] [CrossRef]
- Huang, S.; Yang, J.; Fong, S.; Zhao, Q. Artificial intelligence in cancer diagnosis and prognosis: Opportunities and challenges. Cancer Lett. 2020, 471, 61–71. [Google Scholar] [CrossRef]
- Bulten, W.; Pinckaers, H.; van Boven, H.; Vink, R.; de Bel, T.; van Ginneken, B.; van der Laak, J.; Hulsbergen-van de Kaa, C.; Litjens, G. Automated deep-learning system for Gleason grading of prostate cancer using biopsies: A diagnostic study. Lancet Oncol. 2020, 21, 233–241. [Google Scholar] [CrossRef] [Green Version]
- Ström, P.; Kartasalo, K.; Olsson, H.; Solorzano, L.; Delahunt, B.; Berney, D.M.; Bostwick, D.G.; Evans, A.J.; Grignon, D.J.; Humphrey, P.A.; et al. Artificial intelligence for diagnosis and grading of prostate cancer in biopsies: A population-based, diagnostic study. Lancet Oncol. 2020, 21, 222–232. [Google Scholar] [CrossRef]
- Valkonen, M.; Isola, J.; Ylinen, O.; Muhonen, V.; Saxlin, A.; Tolonen, T.; Nykter, M.; Ruusuvuori, P. Cytokeratin-Supervised Deep Learning for Automatic Recognition of Epithelial Cells in Breast Cancers Stained for ER, PR, and Ki-67. IEEE Trans. Med. Imaging 2020, 39, 534–542. [Google Scholar] [CrossRef] [PubMed]
- Liu, J.; Xu, B.; Zheng, C.; Gong, Y.; Garibaldi, J.; Soria, D.; Green, A.; Ellis, I.O.; Zou, W.; Qiu, G. An End-to-End Deep Learning Histochemical Scoring System for Breast Cancer TMA. IEEE Trans. Med. Imaging 2019, 38, 617–628. [Google Scholar] [CrossRef] [PubMed]
- Skrede, O.J.; De Raedt, S.; Kleppe, A.; Hveem, T.S.; Liestøl, K.; Maddison, J.; Askautrud, H.A.; Pradhan, M.; Nesheim, J.A.; Albregtsen, F.; et al. Deep learning for prediction of colorectal cancer outcome: A discovery and validation study. Lancet 2020, 395, 350–360. [Google Scholar] [CrossRef]
- Cooperberg, M.R.; Broering, J.M.; Carroll, P.R. Risk assessment for prostate cancer metastasis and mortality at the time of diagnosis. J. Natl. Cancer Inst. 2009, 101, 878–887. [Google Scholar] [CrossRef]
- Cooperberg, M.R.; Carroll, P.R.; Dall’Era, M.A.; Davies, B.J.; Davis, J.W.; Eggener, S.E.; Feng, F.Y.; Lin, D.W.; Morgan, T.M.; Morgans, A.K.; et al. The State of the Science on Prostate Cancer Biomarkers: The San Francisco Consensus Statement. Eur. Urol. 2019, 76, 268–272. [Google Scholar] [CrossRef]
- Eggener, S.E.; Rumble, R.B.; Armstrong, A.J.; Morgan, T.M.; Crispino, T.; Cornford, P.; van der Kwast, T.; Grignon, D.J.; Rai, A.J.; Agarwal, N.; et al. Molecular biomarkers in localized prostate cancer: ASCO guideline. J. Clin. Oncol. 2020, 38, 1474–1494. [Google Scholar] [CrossRef] [PubMed]
- McGranahan, N.; Burrell, R.A.; Endesfelder, D.; Novelli, M.R.; Swanton, C. Cancer chromosomal instability: Therapeutic and diagnostic challenges. EMBO Rep. 2012, 13, 528–538. [Google Scholar] [CrossRef] [PubMed] [Green Version]
- Burrell, R.A.; McGranahan, N.; Bartek, J.; Swanton, C. The causes and consequences of genetic heterogeneity in cancer evolution. Nature 2013, 501, 338–345. [Google Scholar] [CrossRef]
- Danielsen, H.E.; Pradhan, M.; Novelli, M. Revisiting tumour aneuploidy—The place of ploidy assessment in the molecular era. Nat. Rev. Clin. Oncol. 2016, 13, 291–304. [Google Scholar] [CrossRef] [PubMed]
- Jamaspishvili, T.; Berman, D.M.; Ross, A.E.; Scher, H.I.; Marzo, A.M.; De Squire, J.A.; Lotan, T.L. Clinical implications of PTEN loss in prostate cancer. Nat. Rev. Urol. 2018, 15, 222–234. [Google Scholar] [CrossRef]
- Lotan, T.L.; Heumann, A.; Rico, S.D.; Hicks, J.; Lecksell, K.; Koop, C.; Sauter, G.; Schlomm, T. PTEN loss detection in prostate cancer: Comparison of PTEN immunohistochemistry and PTEN FISH in a large retrospective prostatectomy cohort. Oncotarget 2017, 8, 65566–65576. [Google Scholar] [CrossRef] [Green Version]
- Harmon, S.; Patel, P.G.; Sanford, T.; Caven, I.; Iseman, R.; Vidotto, T.; Albuquerque, C.; Squire, J.; Masoudi, S.; Mehralivand, S.; et al. High throughput assessment of biomarkers in tissue microarrays using artificial intelligence: PTEN loss as a proof-of-principle in multi-center prostate cancer cohorts. Mod. Pathol. 2020, 34, 478–489. [Google Scholar] [CrossRef]
- Jamaspishvili, T.; Patel, P.G.; Niu, Y.; Vidotto, T.; Caven, I.; Livergant, R.; Fu, W.; Kawashima, A.; How, N.; Okello, J.B.; et al. Risk stratification of prostate cancer through quantitative assessment of PTEN loss (qPTEN). J. Natl. Cancer Inst. 2020, 11, 1098–1104. [Google Scholar] [CrossRef]
- Moons, K.G.M.; Altman, D.G.; Reitsma, J.B.; Ioannidis, J.P.A.; Macaskill, P.; Steyerberg, E.W.; Vickers, A.J.; Ransohoff, D.F.; Collins, G.S. Transparent reporting of a multivariable prediction model for individual prognosis or diagnosis (TRIPOD): Explanation and elaboration. Ann. Intern. Med. 2015, 162, W1–W73. [Google Scholar] [CrossRef] [Green Version]
- Epstein, J.I.; Allsbrook, W.C.; Amin, M.B.; Egevad, L.L. The 2005 International Society of Urological Pathology (ISUP) Consensus Conference on Gleason Grading of Prostatic Carcinoma. Am. J. Surg. Pathol. 2005, 29, 1228–1242. [Google Scholar] [CrossRef] [Green Version]
- Epstein, J.I. An Update of the Gleason Grading System. J. Urol. 2010, 183, 433–440. [Google Scholar] [CrossRef]
- Epstein, J.I.; Egevad, L.; Amin, M.B.; Delahunt, B.; Srigley, J.R.; Humphrey, P.A.; Committee, G. The 2014 International Society of Urological Pathology (ISUP) Consensus Conference on Gleason Grading of Prostatic Carcinoma: Definition of Grading Patterns and Proposal for a New Grading System. Am. J. Surg. Pathol. 2016, 40, 244–252. [Google Scholar] [CrossRef]
- Lotan, T.L.; Epstein, J.I. Gleason grading of prostatic adenocarcinoma with glomeruloid features on needle biopsy. Hum. Pathol. 2009, 40, 471–477. [Google Scholar] [CrossRef] [Green Version]
- Cyll, K.; Ersvær, E.; Vlatkovic, L.; Pradhan, M.; Kildal, W.; Avranden Kjær, M.; Kleppe, A.; Hveem, T.S.; Carlsen, B.; Gill, S.; et al. Tumour heterogeneity poses a significant challenge to cancer biomarker research. Br. J. Cancer 2017, 117, 367–375. [Google Scholar] [CrossRef] [PubMed] [Green Version]
- Ahearn, T.U.; Pettersson, A.; Ebot, E.M.; Gerke, T.; Graff, R.E.; Morais, C.L.; Hicks, J.L.; Wilson, K.M.; Rider, J.R.; Sesso, H.D.; et al. A Prospective Investigation of PTEN Loss and ERG Expression in Lethal Prostate Cancer. J. Natl. Cancer Inst. 2016, 108, djv34. [Google Scholar] [CrossRef] [PubMed] [Green Version]
- Cyll, K.; Callaghan, P.; Kildal, W.; Danielsen, H.E. Preparing for Image Based DNA Ploidy. 2015. Available online: https://www.youtube.com/watch?v=_24EkrYAwOc (accessed on 1 July 2021).
- Maddison, J. Digital Image Processing for Prognostic and Diagnostic Clinical Pathology. Ph.D. Thesis, University of Huddersfield, Huddersfield, UK, 2005. [Google Scholar]
- Vapnik, V.N. The Nature of Statistical. Learning Theory, 2nd ed.; Springer: New York, NY, USA, 1999. [Google Scholar]
- Szegedy, C.; Vanhoucke, V.; Ioffe, S.; Shlens, J.; Wojna, Z. Rethinking the Inception architecture for computer vision. In Proceedings of the 2016 IEEE Conference on Computer Vision and Pattern Recognition, Las Vegas, NV, USA, 27–30 June 2016. [Google Scholar]
- He, K.; Gkioxari, G.; Dollár, P.; Girshick, R. Mask R-CNN. IEEE Trans. Pattern Anal. Mach. Intell. 2020, 42, 386–397. [Google Scholar] [CrossRef] [PubMed]
- Henderson, P.; Ferrari, V. End-to-end training of object class detectors for mean average precision. In Asian Conference on Computer Vision; Springer: Berlin/Heidelberg, Germany, 2017; pp. 198–213. [Google Scholar]
- Sauerbrei, W.; Taube, S.E.; McShane, L.M.; Cavenagh, M.M.; Altman, D.G. Reporting Recommendations for Tumor Marker Prognostic Studies (REMARK): An abridged explanation and elaboration. J. Natl. Cancer Inst. 2018, 110, 803–811. [Google Scholar] [CrossRef]
- Kleppe, A.; Skrede, O.J.; De Raedt, S.; Liestøl, K.; Kerr, D.J.; Danielsen, H.E. Designing deep learning studies in cancer diagnostics. Nat. Rev. Cancer 2021, 21, 199–211. [Google Scholar] [CrossRef]
- Punt, C.J.; Buyse, M.; Köhne, C.H.; Hohenberger, P.; Labianca, R.; Schmoll, H.J.; Påhlman, L.; Sobrero, A.; Douillard, J.Y. Endpoints in adjuvant treatment trials: A systematic review of the literature in colon cancer and proposed definitions for future trials. J. Natl. Cancer Inst. 2007, 99, 998–1003. [Google Scholar] [CrossRef]
- Castelvecchi, D. The black box of AI. Nature 2016, 538, 20–23. [Google Scholar] [CrossRef] [Green Version]
- Adadi, A.; Berrada, M. Peeking Inside the Black-Box: A Survey on Explainable Artificial Intelligence (XAI). IEEE Access 2018, 6, 52138–52160. [Google Scholar] [CrossRef]
- Cuzick, J.; Yang, Z.H.; Fisher, G.; Tikishvili, E.; Stone, S.; Lanchbury, J.S.; Camacho, N.; Merson, S.; Brewer, D.; Cooper, C.S.; et al. Prognostic value of PTEN loss in men with conservatively managed localised prostate cancer. Br. J. Cancer 2013, 108, 2582–2589. [Google Scholar] [CrossRef] [Green Version]
- Léon, P.; Cancel-Tassin, G.; Drouin, S.; Audouin, M.; Varinot, J.; Comperat, E.; Cathelineau, X.; Rozet, F.; Vaessens, C.; Stone, S.; et al. Comparison of cell cycle progression score with two immunohistochemical markers (PTEN and Ki-67) for predicting outcome in prostate cancer after radical prostatectomy. World J. Urol. 2018, 36, 1495–1500. [Google Scholar] [CrossRef]
- De Bono, J.S.; De Giorgi, U.; Rodrigues, D.N.; Massard, C.; Bracarda, S.; Font, A.; Arija, J.A.A.; Shih, K.C.; Radavoi, G.D.; Xu, N.; et al. Randomized phase II study evaluating AKT blockade with ipatasertib, in combination with abiraterone, in patients with metastatic prostate cancer with and without PTEN loss. Clin. Cancer Res. 2019, 25, 928–936. [Google Scholar] [CrossRef] [Green Version]
- Boorjian, S.A.; Thompson, R.H.; Tollefson, M.K.; Rangel, L.J.; Bergstralh, E.J.; Blute, M.L.; Karnes, R.J. Long-term risk of clinical progression after biochemical recurrence following radical prostatectomy: The impact of time from surgery to recurrence. Eur. Urol. 2011, 59, 893–899. [Google Scholar] [CrossRef]
- Amling, C.L.; Bergstralh, E.J.; Blute, M.L.; Slezak, J.M. Defining prostate specific antigen progression after radical prostatectomy: What is the most appropriate cut point? J. Urol. 2001, 165, 1146–1151. [Google Scholar] [CrossRef]
- Toussi, A.; Stewart-Merrill, S.B.; Boorjian, S.A.; Psutka, S.P.; Houston Thompson, R.; Frank, I.; Tollefson, M.K.; Gettman, M.T.; Carlson, R.E.; Rangel, L.J.; et al. Standardizing the Definition of Biochemical Recurrence after Radical Prostatectomy-What Prostate Specific Antigen Cut Point Best Predicts a Durable Increase and Subsequent Systemic Progression? J. Urol. 2016, 195, 1754–1759. [Google Scholar] [CrossRef] [PubMed]
- Cornford, P.; Bergh, R.C.N.; van den Briers, E.; Broeck, T.; van den Gillessen, S.; Grivas, N.; Grummet, J.; Henry, A.M.; Kwast, T.H.; van der Oprea-Lager, D.E.; et al. EAU-EANM-ESTRO-ESUR-SIOG Guidelines on Prostate Cancer. Part II—2020 Update: Treatment of Relapsing and Metastatic Prostate Cancer. Eur. Urol. 2020, 9, 263–282. [Google Scholar] [CrossRef] [PubMed]
- Eggener, S.E.; Scardino, P.T.; Walsh, P.C.; Han, M.; Partin, A.W.; Trock, B.J.; Feng, Z.; Wood, D.P.; Eastham, J.A.; Yossepowitch, O.; et al. Predicting 15-year prostate cancer specific mortality after radical prostatectomy. J. Urol. 2011, 185, 869–875. [Google Scholar] [CrossRef] [Green Version]
- Bottke, D.; Golz, R.; Störkel, S.; Hinke, A.; Siegmann, A.; Hertle, L.; Miller, K.; Hinkelbein, W.; Wiegel, T. Phase 3 study of adjuvant radiotherapy versus wait and see in pT3 Prostate cancer: Impact of pathology review on Analysis. Eur. Urol. 2013, 64, 193–198. [Google Scholar] [CrossRef] [PubMed]
- Kuroiwa, K.; Shiraishi, T.; Ogawa, O.; Usami, M.; Hirao, Y.; Naito, S. Discrepancy Between Local and Central Pathological Review of Radical Prostatectomy Specimens. J. Urol. 2010, 183, 952–957. [Google Scholar] [CrossRef]
- Lennartz, M.; Minner, S.; Brasch, S.; Wittmann, H.; Paterna, L.; Angermeier, K.; Ozturk, E.; Shihada, R.; Ruge, M.; Kluth, M.; et al. The combination of DNA ploidy status and PTEN/6q15 deletions to provide strong and independent prognostic information in prostate cancer. Clin. Cancer Res. 2016, 22, 2802–2811. [Google Scholar] [CrossRef] [PubMed] [Green Version]
- D’Amico, A.V.; Whittington, R.; Malkowicz, S.B.; Schultz, D.; Schnall, M.; Tomaszewski, J.E.; Wein, A. A Multivariate Analysis of Clinical and Pathological Factors that Predict for Prostate Specific Antigen Failure after Radical Prostatectomy for Prostate Cancer. J. Urol. 1995, 154, 131–138. [Google Scholar] [CrossRef]
- Müntener, M.; Epstein, J.I.; Hernandez, D.J.; Gonzalgo, M.L.; Mangold, L.; Humphreys, E.; Walsh, P.C.; Partin, A.W.; Nielsen, M.E. Prognostic Significance of Gleason Score Discrepancies between Needle Biopsy and Radical Prostatectomy. Eur. Urol. 2008, 53, 767–776. [Google Scholar] [CrossRef] [PubMed]
- Van Leenders, G.J.L.H.; Kweldam, C.F.; Hollemans, E.; Kümmerlin, I.P.; Nieboer, D.; Verhoef, E.I.; Remmers, S.; Incrocci, L.; Bangma, C.H.; van der Kwast, T.; et al. Improved Prostate Cancer Biopsy Grading by Incorporation of Invasive Cribriform and Intraductal Carcinoma in the 2014 Grade Groups. Eur. Urol. 2020, 77, 191–198. [Google Scholar] [CrossRef] [Green Version]
- Böttcher, R.; Kweldam, C.F.; Livingstone, J.; Lalonde, E.; Yamaguchi, T.N.; Huang, V.; Yousif, F.; Fraser, M.; Bristow, R.G.; van der Kwast, T.; et al. Cribriform and intraductal prostate cancer are associated with increased genomic instability and distinct genomic alterations. BMC Cancer 2018, 18, 1–11. [Google Scholar] [CrossRef]
- Truong, M.; Frye, T.; Messing, E.; Miyamoto, H. Historical and contemporary perspectives on cribriform morphology in prostate cancer. Nat. Rev. Urol. 2018, 15, 475–482. [Google Scholar] [CrossRef]
- Kweldam, C.F.; Nieboer, D.; Algaba, F.; Amin, M.B.; Berney, D.M.; Billis, A.; Bostwick, D.G.; Bubendorf, L.; Cheng, L.; Comp, E.; et al. Gleason grade 4 prostate adenocarcinoma patterns: An interobserver agreement study among genitourinary pathologists. Histopathology 2016, 69, 441–449. [Google Scholar] [CrossRef] [Green Version]
- Iczkowski, K.A.; Egevad, L.; Ma, J.; Harding-Jackson, N.; Algaba, F.; Billis, A.; Camparo, P.; Cheng, L.; Clouston, D.; Comperat, E.M.; et al. Intraductal carcinoma of the prostate: Interobserver reproducibility survey of 39 urologic pathologists. Ann. Diagn. Pathol. 2014, 18, 333–342. [Google Scholar] [CrossRef]
- Weiss, K.; Khoshgoftaar, T.M.; Wang, D.D. A Survey of Transfer Learning; Springer: Berlin/Heidelberg, Germany, 2016. [Google Scholar]
- Chen, D.; Liu, S.; Kingsbury, P.; Sohn, S.; Storlie, C.B.; Habermann, E.B.; Naessens, J.M.; Larson, D.W.; Liu, H. Deep learning and alternative learning strategies for retrospective real-world clinical data. NPJ Digit. Med. 2019, 2, 1–5. [Google Scholar] [CrossRef] [Green Version]


| Characteristic | All | PTEN-High and Diploid | PTEN-Low or Non-Diploid | PTEN-Low and Non-Diploid | p Value * |
|---|---|---|---|---|---|
| Patients | 259 | 164 (63%) | 73 (28%) | 22 (8%) | |
| Age at surgery, years | 62 (59–66) | 61 (58–65) | 65 (60–69) | 64 (60–66) | 0.002 |
| Preoperative PSA, ng/mL | 8.3 (6.5–11.4) | 8.0 (6.4–11.0) | 9.0 (6.9–12.7) | 7.8 (6.4–10.0) | 0.18 |
| Missing | 1 (0%) | 0 | 1 (1%) | 0 | |
| Preoperative PSA | 0.44 | ||||
| ≤6 ng/mL | 54 (21%) | 37 (23%) | 12 (17%) | 5 (23%) | |
| >6 ng/mL and ≤10 ng/mL | 123 (47%) | 78 (48%) | 32 (44%) | 13 (59%) | |
| >10 ng/mL and ≤20 ng/mL | 73 (28%) | 45 (27%) | 25 (35%) | 3 (14%) | |
| >20 ng/mL | 8 (3%) | 4 (2%) | 3 (4%) | 1 (5%) | |
| Missing | 1 (0%) | 0 | 1 (0%) | 0 | |
| Gleason grade group † | <0.001 | ||||
| 1 (GS 6) | 3 (1%) | 1 (1%) | 2 (3%) | 0 | |
| 2 (GS 3 + 4) | 153 (59%) | 117 (71%) | 31 (42%) | 5 (23%) | |
| 3 (GS 4 + 3) | 54 (21%) | 31 (19%) | 19 (26%) | 4 (18%) | |
| 4 (GS 8) | 12 (5%) | 5 (3%) | 4 (6%) | 3 (14%) | |
| 5 (GS 9–10) | 37 (14%) | 10 (6%) | 17 (23%) | 10 (45%) | |
| Gleason grade group ‡ | <0.001 | ||||
| 1 (GS 6) | 77 (30%) | 64 (39%) | 12 (16%) | 1 (5%) | |
| 2 (GS 3 + 4) | 98 (38%) | 63 (39%) | 28 (38%) | 7 (32%) | |
| 3 (GS 4 + 3) | 54 (21%) | 26 (16%) | 20 (27%) | 8 (36%) | |
| 4 (GS 8) | 19 (7%) | 7 (4%) | 8 (11%) | 4 (18%) | |
| 5 (GS 9–10) | 10 (4%) | 3 (2%) | 5 (7%) | 2 (9%) | |
| Extraprostatic extension | <0.001 | ||||
| Absent | 166 (64%) | 125 (77%) | 37 (51%) | 4 (19%) | |
| Present | 89 (34%) | 37 (22%) | 35 (48%) | 17 (81%) | |
| Missing | 4 (2%) | 2 (1%) | 1 (1%) | 0 | |
| Surgical margins | 0.032 | ||||
| Negative | 165 (64%) | 113 (69%) | 38 (52%) | 14 (64%) | |
| Positive | 92 (36%) | 49 (30%) | 35 (48%) | 8 (36%) | |
| Missing | 2 (1%) | 2 (1%) | 0 | 0 | |
| Seminal vesicle invasion | <0.001 | ||||
| Absent | 228 (88%) | 157 (96%) | 60 (83%) | 11 (50%) | |
| Present | 30 (12%) | 7 (4%) | 12 (16%) | 11 (50%) | |
| Missing | 1 (0%) | 0 | 1 (1%) | 0 | |
| Lymph node involvement | 0.001 | ||||
| Absent | 252 (97%) | 164 (100%) | 68 (93%) | 20 (91%) | |
| Present | 7 (3%) | 0 | 5 (7%) | 2 (9%) | |
| CAPRA-S risk group † | <0.001 | ||||
| Low | 78 (30%) | 62 (38%) | 13 (18%) | 3 (14%) | |
| Intermediate | 113 (44%) | 79 (48%) | 29 (40%) | 5 (23%) | |
| High | 60 (23%) | 19 (12%) | 28 (38%) | 13 (62%) | |
| Missing | 8 (3%) | 4 (2%) | 3 (4%) | 1 (1%) | |
| CAPRA-S risk group ‡ | <0.001 | ||||
| Low | 100 (39%) | 77 (47%) | 18 (25%) | 5 (23%) | |
| Intermediate | 93 (36%) | 66 (40%) | 23 (32%) | 4 (18%) | |
| High | 58 (22%) | 17 (10%) | 29 (40%) | 12 (55%) | |
| Missing | 8 (3%) | 4 (2%) | 3 (4%) | 1 (5%) |
| Variable | Group | Univariable Analysis | Multivariable Analysis * | ||
|---|---|---|---|---|---|
| HR (95% CI) | p Value | HR (95% CI) | p Value | ||
| (A) Standard clinicopathologic parameters | |||||
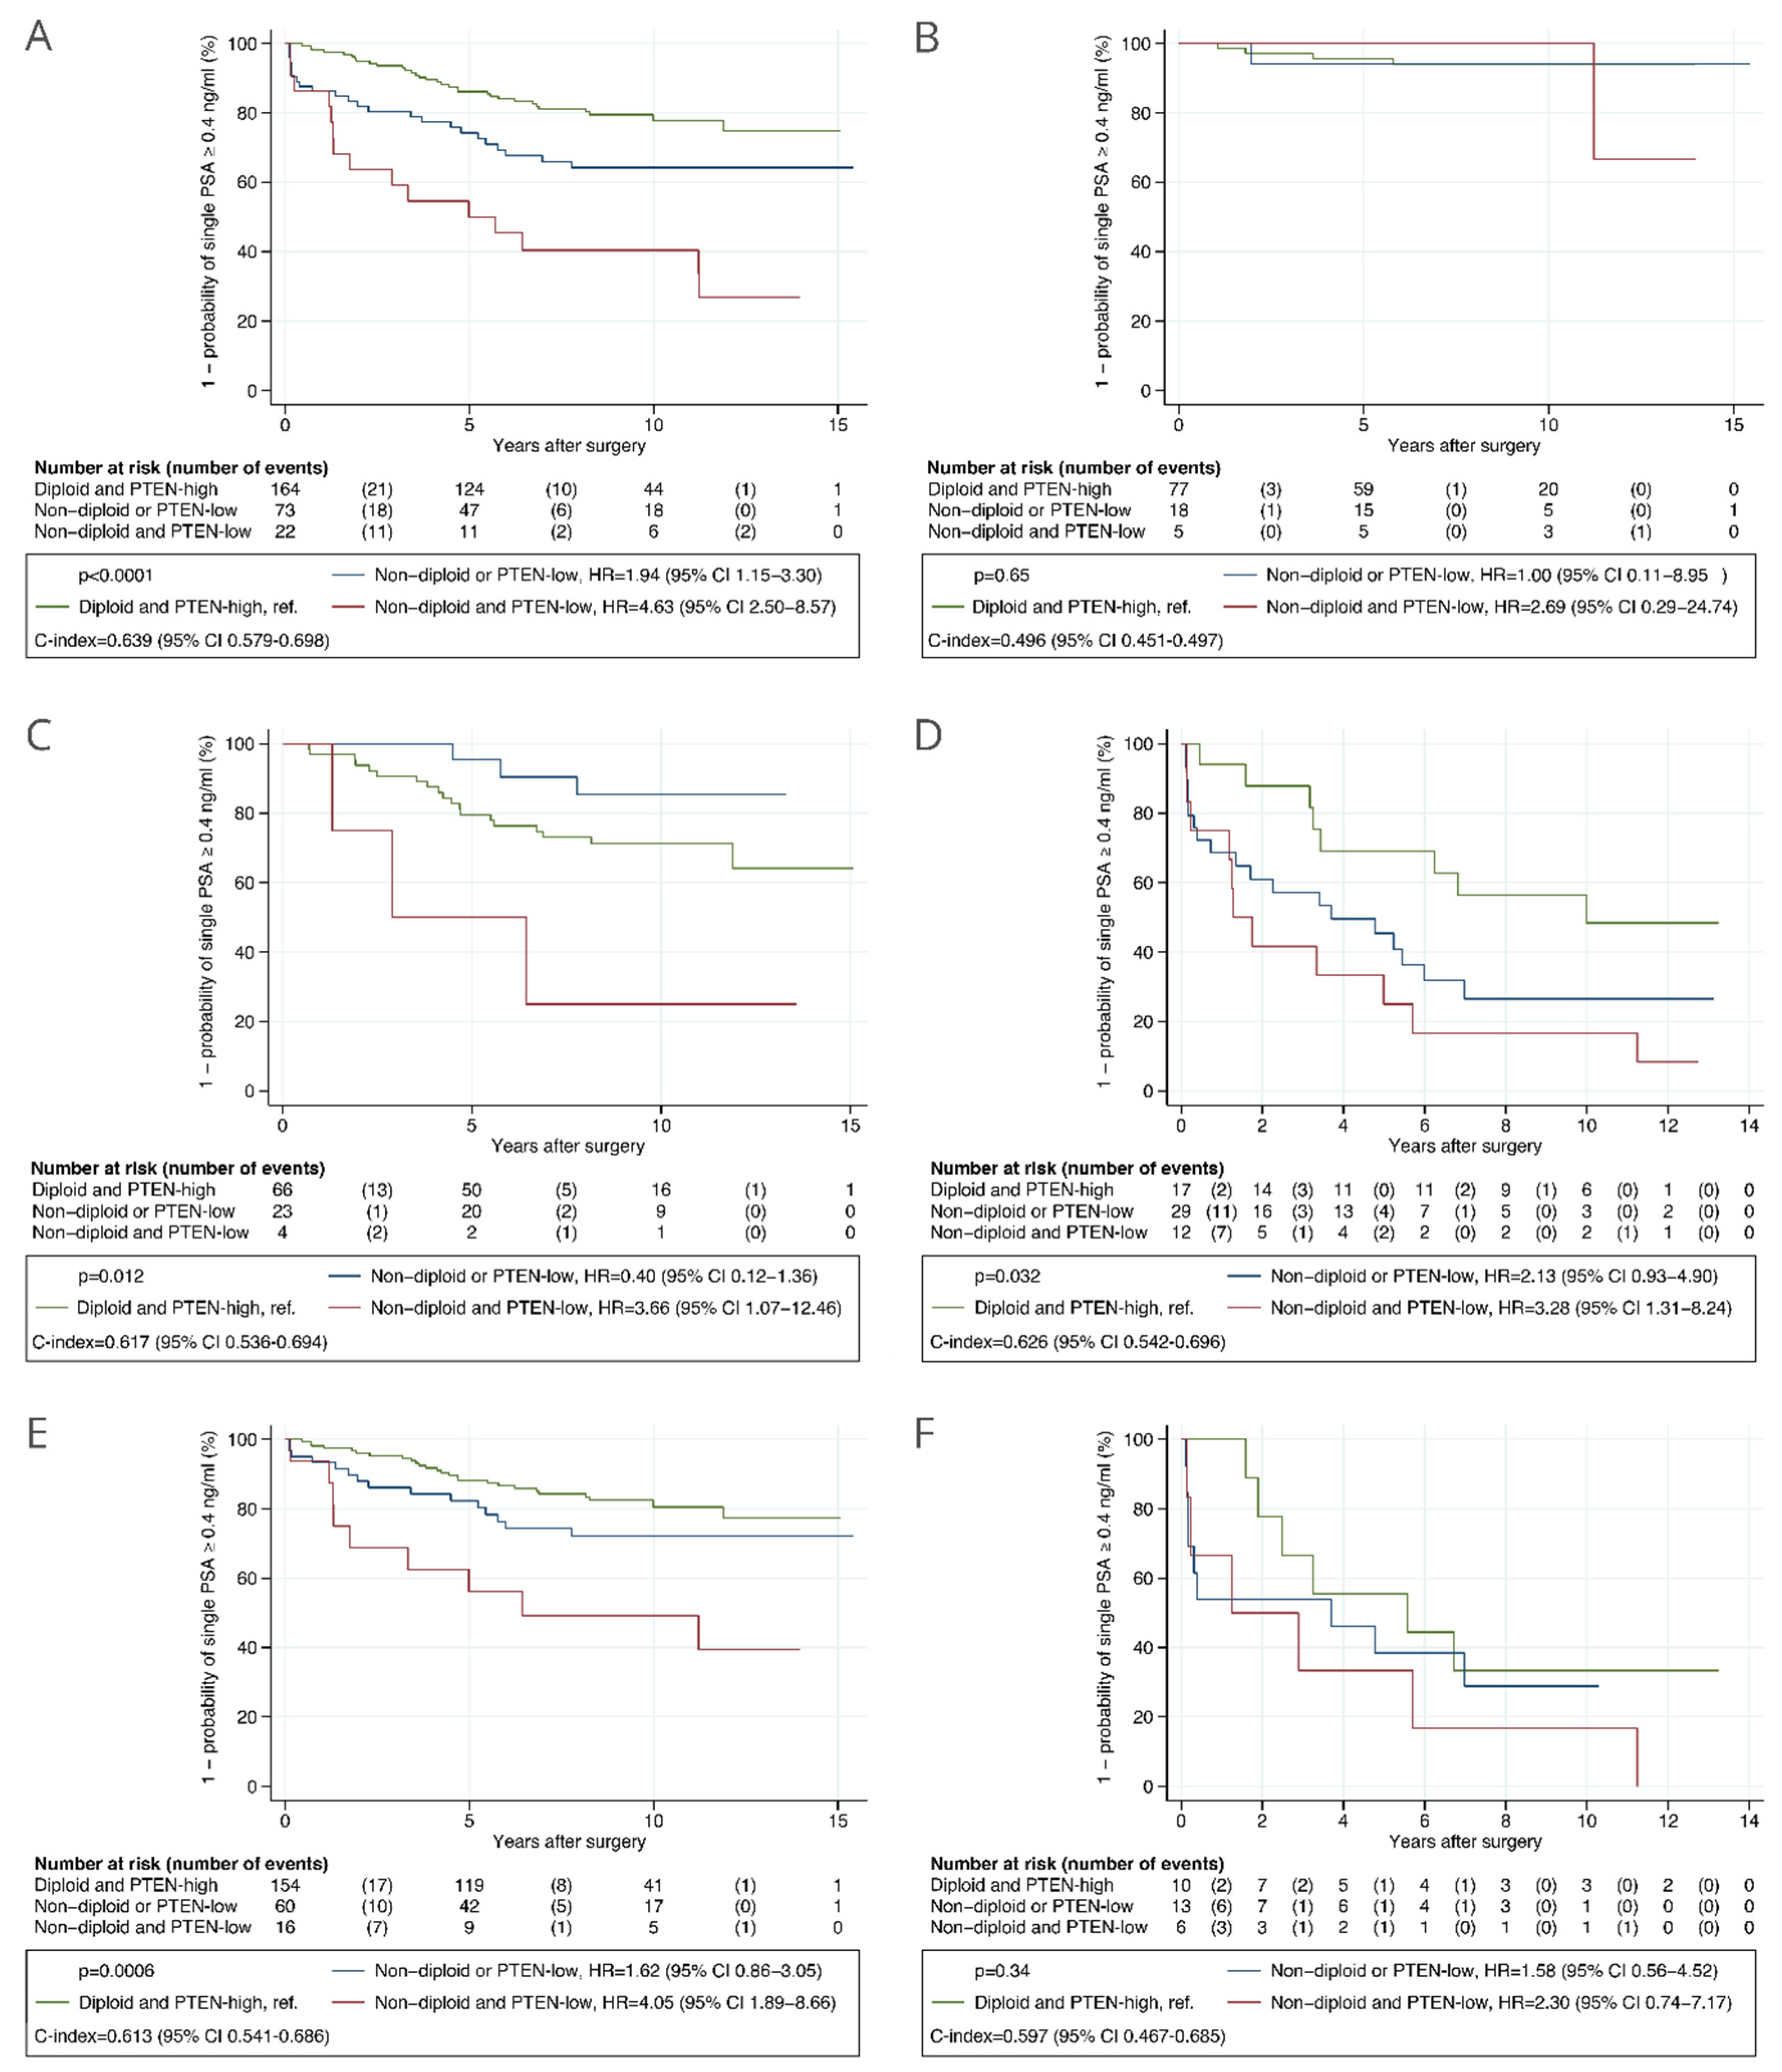
| Ploidy and PTEN status | <0.0001 | 0.017 | |||
| Diploid and PTEN-high | ref. | ref. | |||
| Non-diploid or PTEN-low | 1.94 (1.15–3.30) | 1.11 (0.62–1.99) | |||
| Non-diploid and PTEN-low | 4.63 (2.50–8.57) | 2.82 (1.34–5.94) | |||
| Age at surgery | 10-year increment | 1.51 (1.00–2.26) | 0.048 | 0.98 (0.94–1.03) | 0.51 |
| Preoperative PSA | log2(1 + ng/mL) increment | 2.39 (1.74–3.28) | <0.0001 | 2.44 (1.52–3.91) | <0.0001 |
| Gleason grade group | <0.0001 | 0.017 | |||
| 1 (GS 6) | ref. | ref. | |||
| 2 (GS 3 + 4) | 8.27 (2.52–27.17) | 3.97 (1.17–13.48) | |||
| 3 (GS 4 + 3) | 10.25 (3.02–34.79) | 3.86 (1.07–13.88) | |||
| 4 (GS 8) | 22.91 (6.38–82.24) | 6.51 (1.65–25.72) | |||
| 5 (GS 9–10) | 57.17 (15.64–208.92) | 10.08 (2.43–41.79) | |||
| Extracapsular extension | Present vs. Absent | 3.97 (2.45–6.44) | <0.0001 | 1.52 (0.84–2.75) | 0.17 |
| Surgical margins | Positive vs. Negative | 2.90 (1.80–4.67) | <0.0001 | 2.09 (1.21–3.59) | 0.008 |
| Seminal vesicle invasion | Present vs. Absent | 5.39 (3.22–9.02) | <0.0001 | 1.64 (0.88–3.06) | 0.12 |
| Lymph node involvement | Present vs. Absent | 6.25 (2.67–14.60) | <0.0001 | 2.33 (0.89–6.14) | 0.09 |
| (B) CAPRA-S risk groups | |||||
| Ploidy and PTEN status | <0.0001 | 0.011 | |||
| Diploid and PTEN-high | ref. | ref. | |||
| Non-diploid or PTEN-low | 1.94 (1.15–3.30) | 1.19 (0.68–2.07) | |||
| Non-diploid and PTEN-low | 4.63 (2.50–8.57) | 2.69 (1.39–5.21) | |||
| CAPRA-S risk group | |||||
| Low (score 0–2) | ref | <0.0001 | ref. | <0.0001 | |
| Intermediate (score 3–5) | 4.52 (1.85–11.01) | 4.63 (1.89–11.31) | |||
| High (score ≥ 6) | 17.44 (7.36–41.35) | 14.68 (6.07–35.52) | |||
Publisher’s Note: MDPI stays neutral with regard to jurisdictional claims in published maps and institutional affiliations. |
© 2021 by the authors. Licensee MDPI, Basel, Switzerland. This article is an open access article distributed under the terms and conditions of the Creative Commons Attribution (CC BY) license (https://creativecommons.org/licenses/by/4.0/).
Share and Cite
Cyll, K.; Kleppe, A.; Kalsnes, J.; Vlatkovic, L.; Pradhan, M.; Kildal, W.; Tobin, K.A.R.; Reine, T.M.; Wæhre, H.; Brennhovd, B.; et al. PTEN and DNA Ploidy Status by Machine Learning in Prostate Cancer. Cancers 2021, 13, 4291. https://doi.org/10.3390/cancers13174291
Cyll K, Kleppe A, Kalsnes J, Vlatkovic L, Pradhan M, Kildal W, Tobin KAR, Reine TM, Wæhre H, Brennhovd B, et al. PTEN and DNA Ploidy Status by Machine Learning in Prostate Cancer. Cancers. 2021; 13(17):4291. https://doi.org/10.3390/cancers13174291
Chicago/Turabian StyleCyll, Karolina, Andreas Kleppe, Joakim Kalsnes, Ljiljana Vlatkovic, Manohar Pradhan, Wanja Kildal, Kari Anne R. Tobin, Trine M. Reine, Håkon Wæhre, Bjørn Brennhovd, and et al. 2021. "PTEN and DNA Ploidy Status by Machine Learning in Prostate Cancer" Cancers 13, no. 17: 4291. https://doi.org/10.3390/cancers13174291
APA StyleCyll, K., Kleppe, A., Kalsnes, J., Vlatkovic, L., Pradhan, M., Kildal, W., Tobin, K. A. R., Reine, T. M., Wæhre, H., Brennhovd, B., Askautrud, H. A., Skaaheim Haug, E., Hveem, T. S., & Danielsen, H. E. (2021). PTEN and DNA Ploidy Status by Machine Learning in Prostate Cancer. Cancers, 13(17), 4291. https://doi.org/10.3390/cancers13174291