
Therapeutic Potential of EWSR1–FLI1 Inactivation by CRISPR/Cas9 in Ewing Sarcoma

 , ,
, ,  , , and
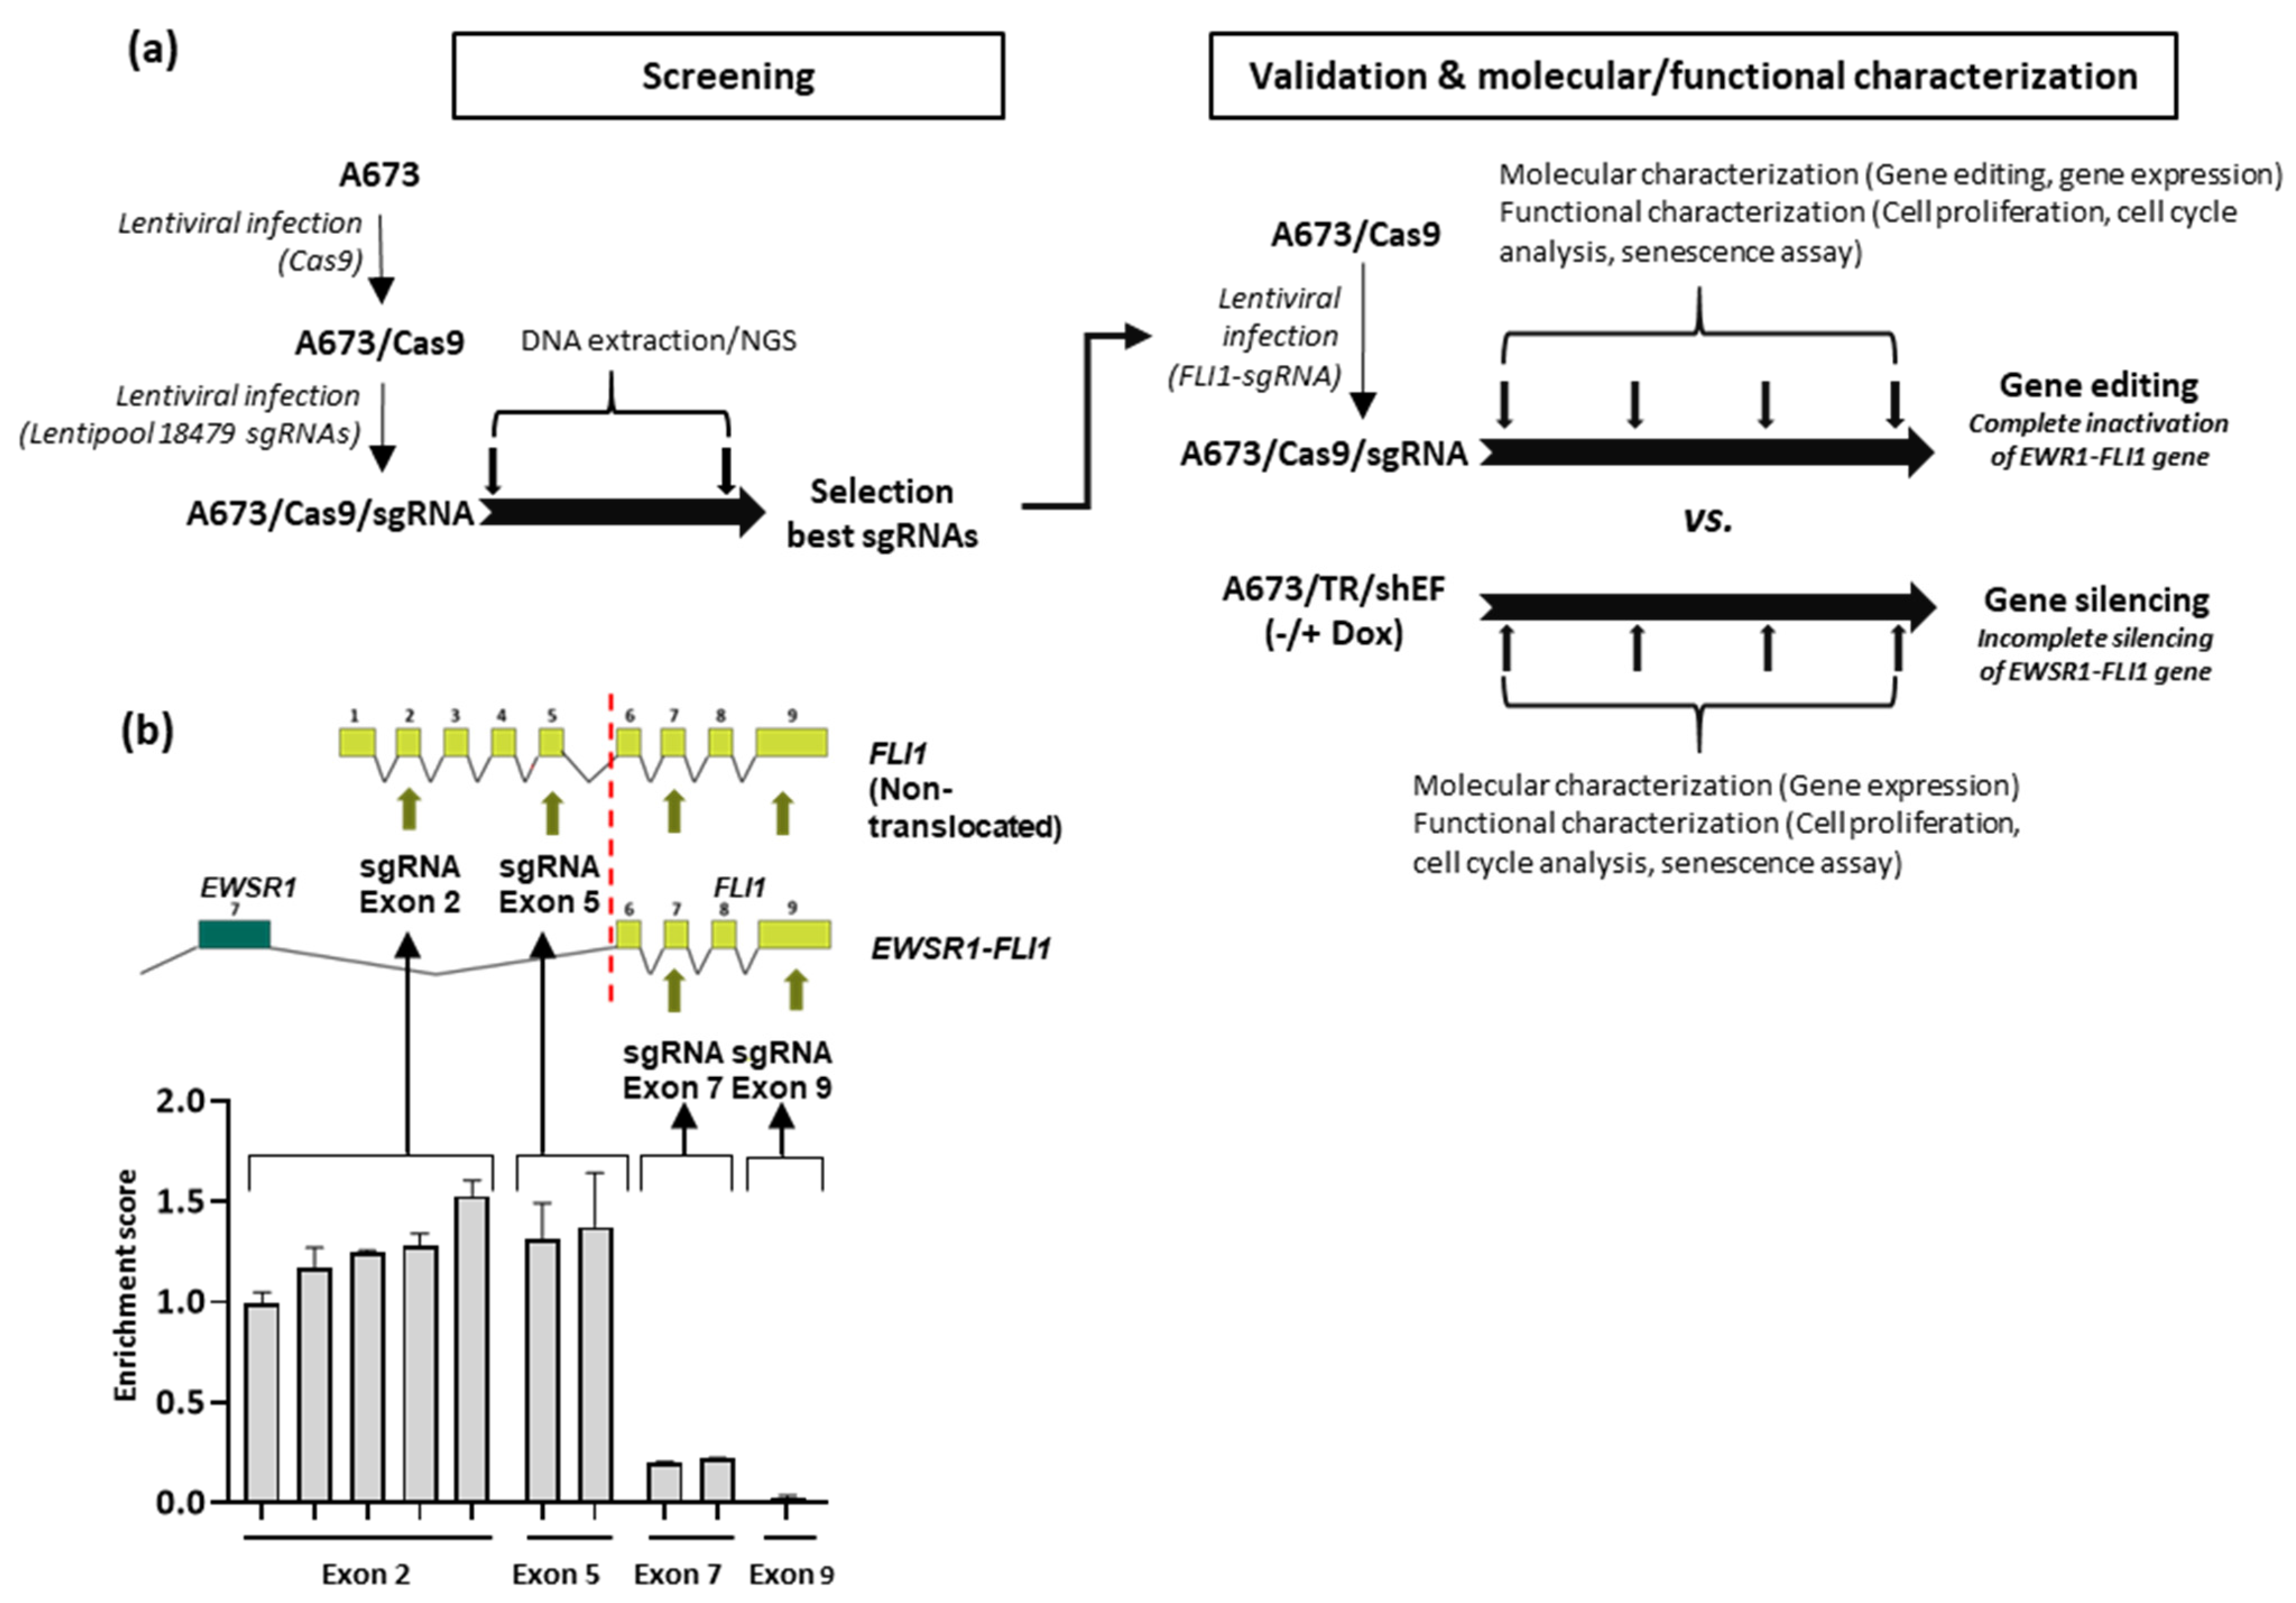
Abstract
:Simple Summary
Abstract
1. Introduction
2. Materials and Methods
2.1. Cell Lines
2.2. Establishment of A673 Cells Expressing Cas9 Protein and sgRNAs
2.3. Selection of the Best Guide RNA (sgRNA) to Target EWSR1–FLI1
2.4. Cell Proliferation Assay
2.5. DNA, RNA, and Protein Isolation
2.6. Confirmation of Gene Editing
2.7. Off-Target Analysis Using T7 Endonuclease I Assay
2.8. Reverse Transcription and Quantitative PCR (RT-qPCR)
2.9. Western Blot
2.10. Immunocytochemical–Immunofluorescence (ICC/IF) Studies
2.11. Cell Cycle Analysis by Flow Cytometry
2.12. Senescence Assay
3. Results
3.1. Selection of Guide RNAs Targeting EWSR1–FLI1
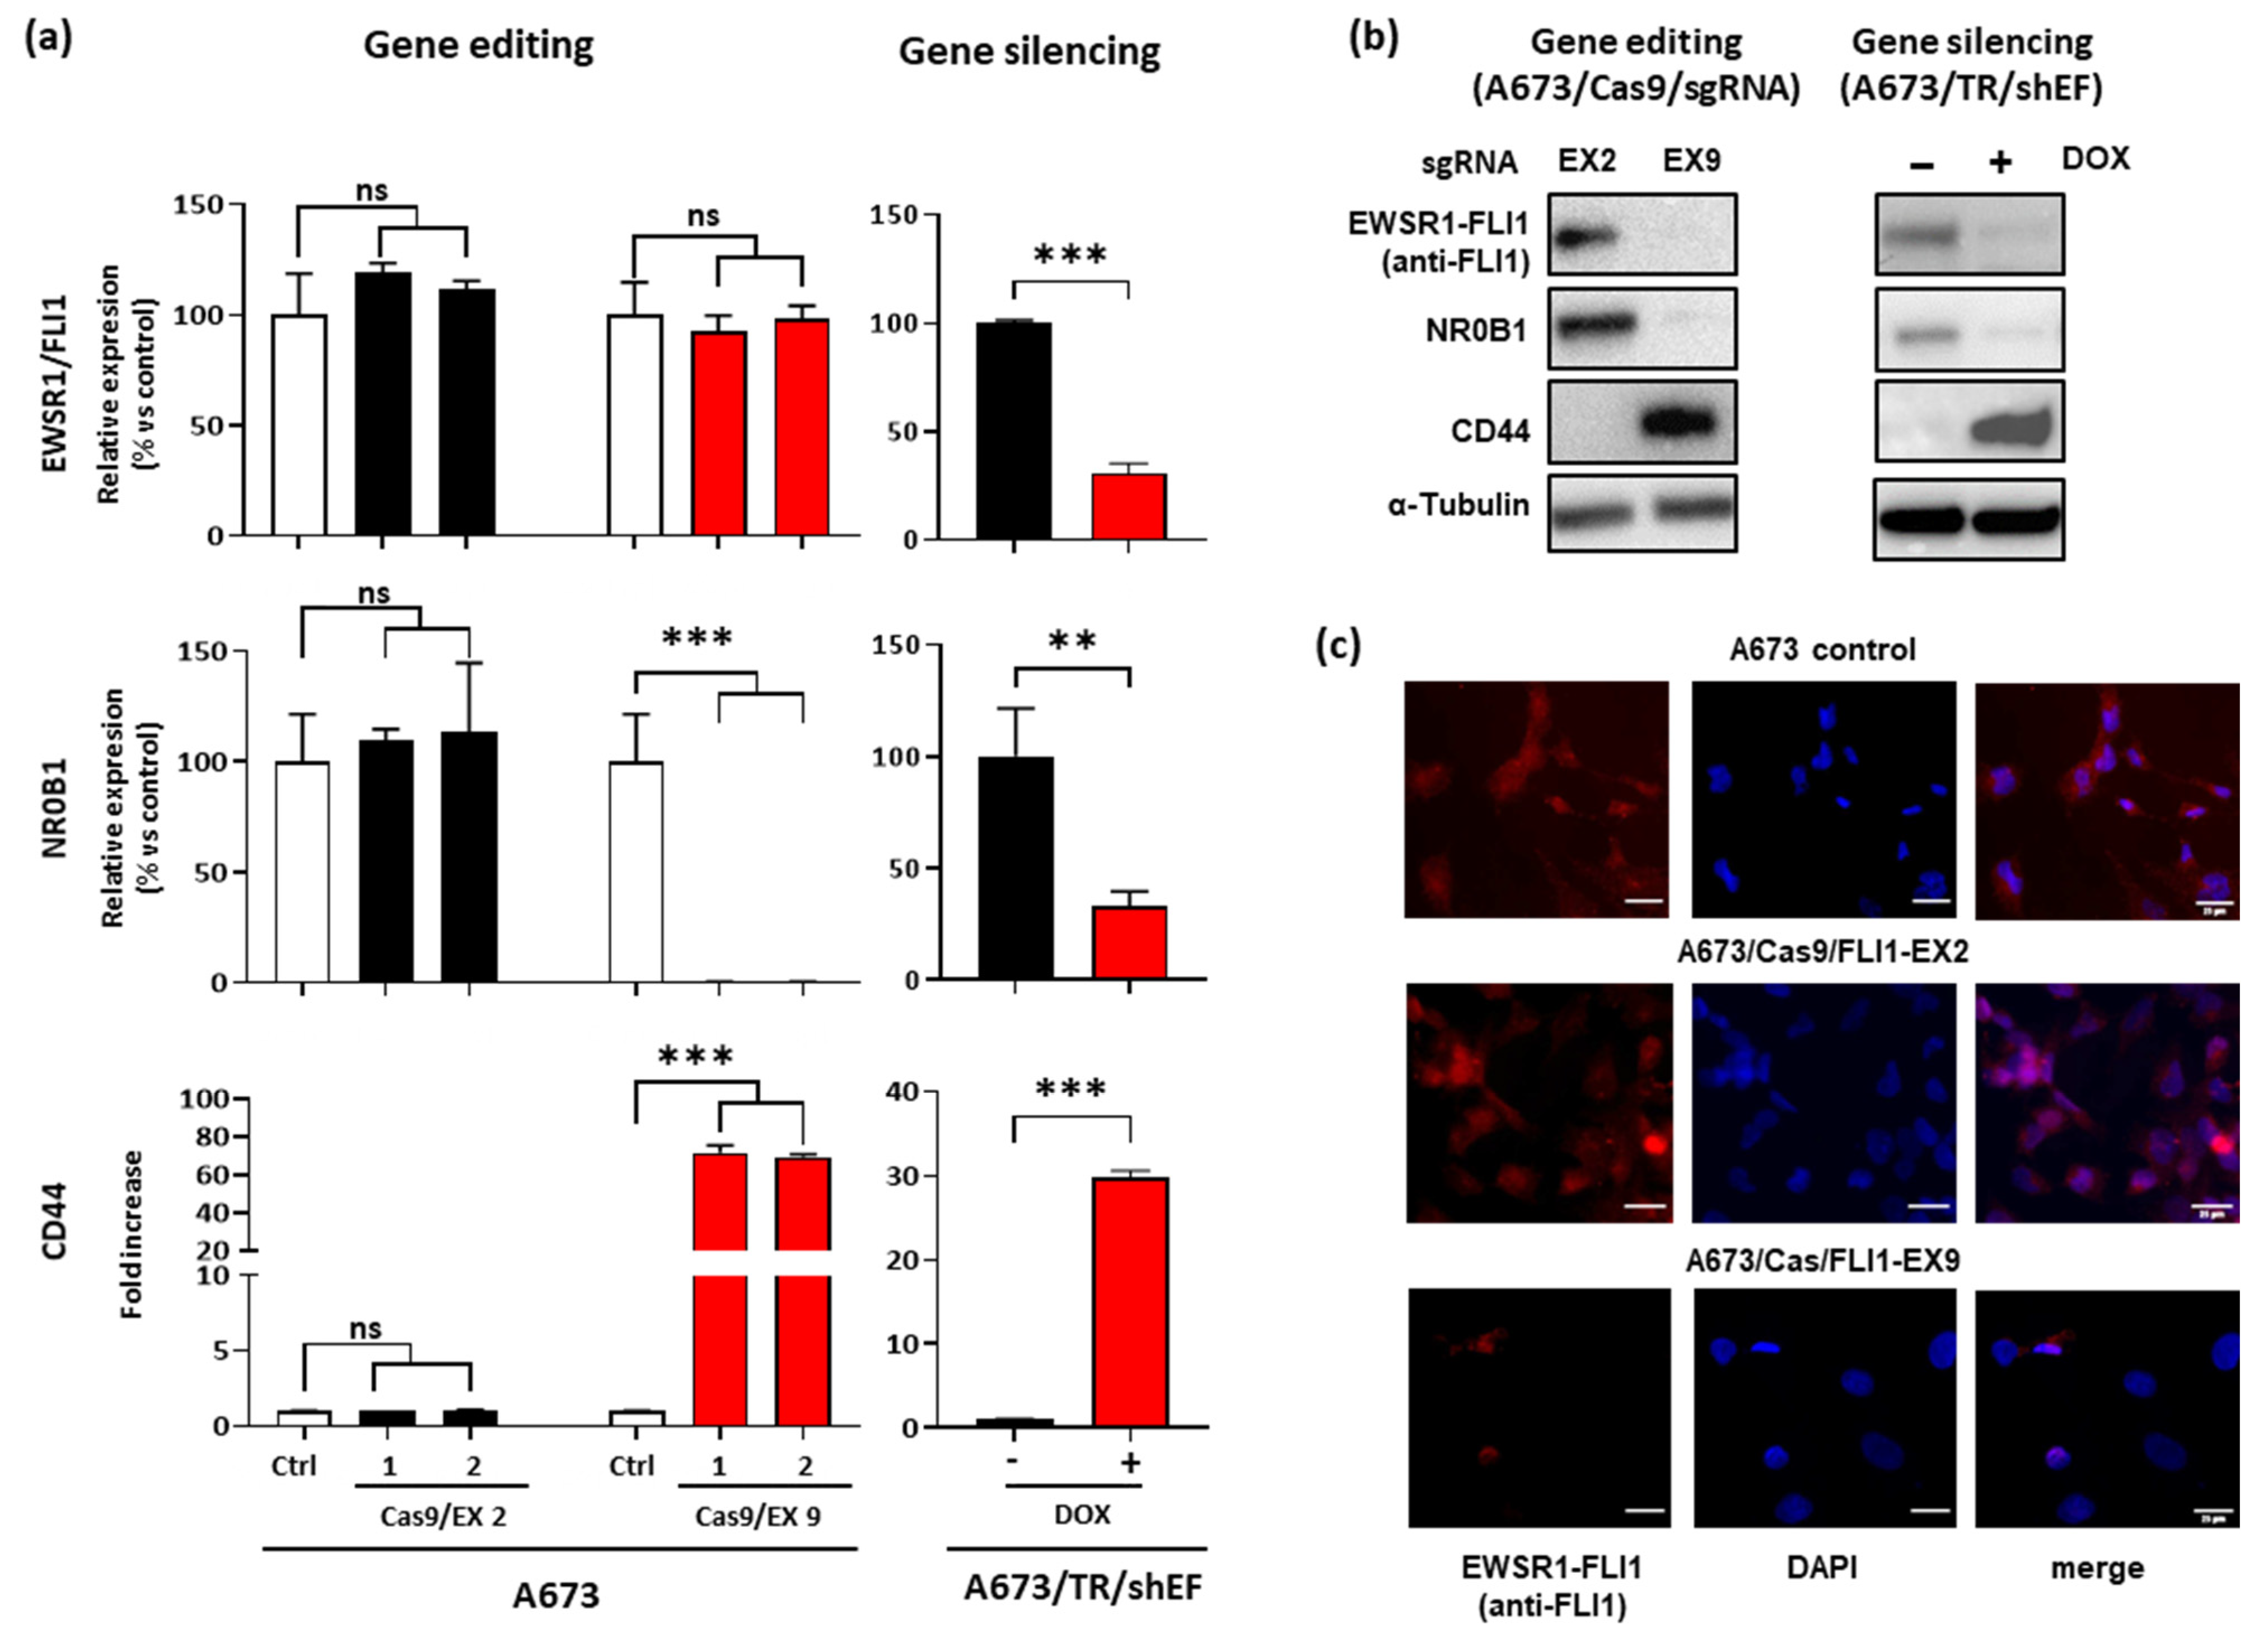
3.2. Effect of EWSR1–FLI1 Gene Editing on EWSR1–FLI1 Expression and EWSR1–FLI1 Targets
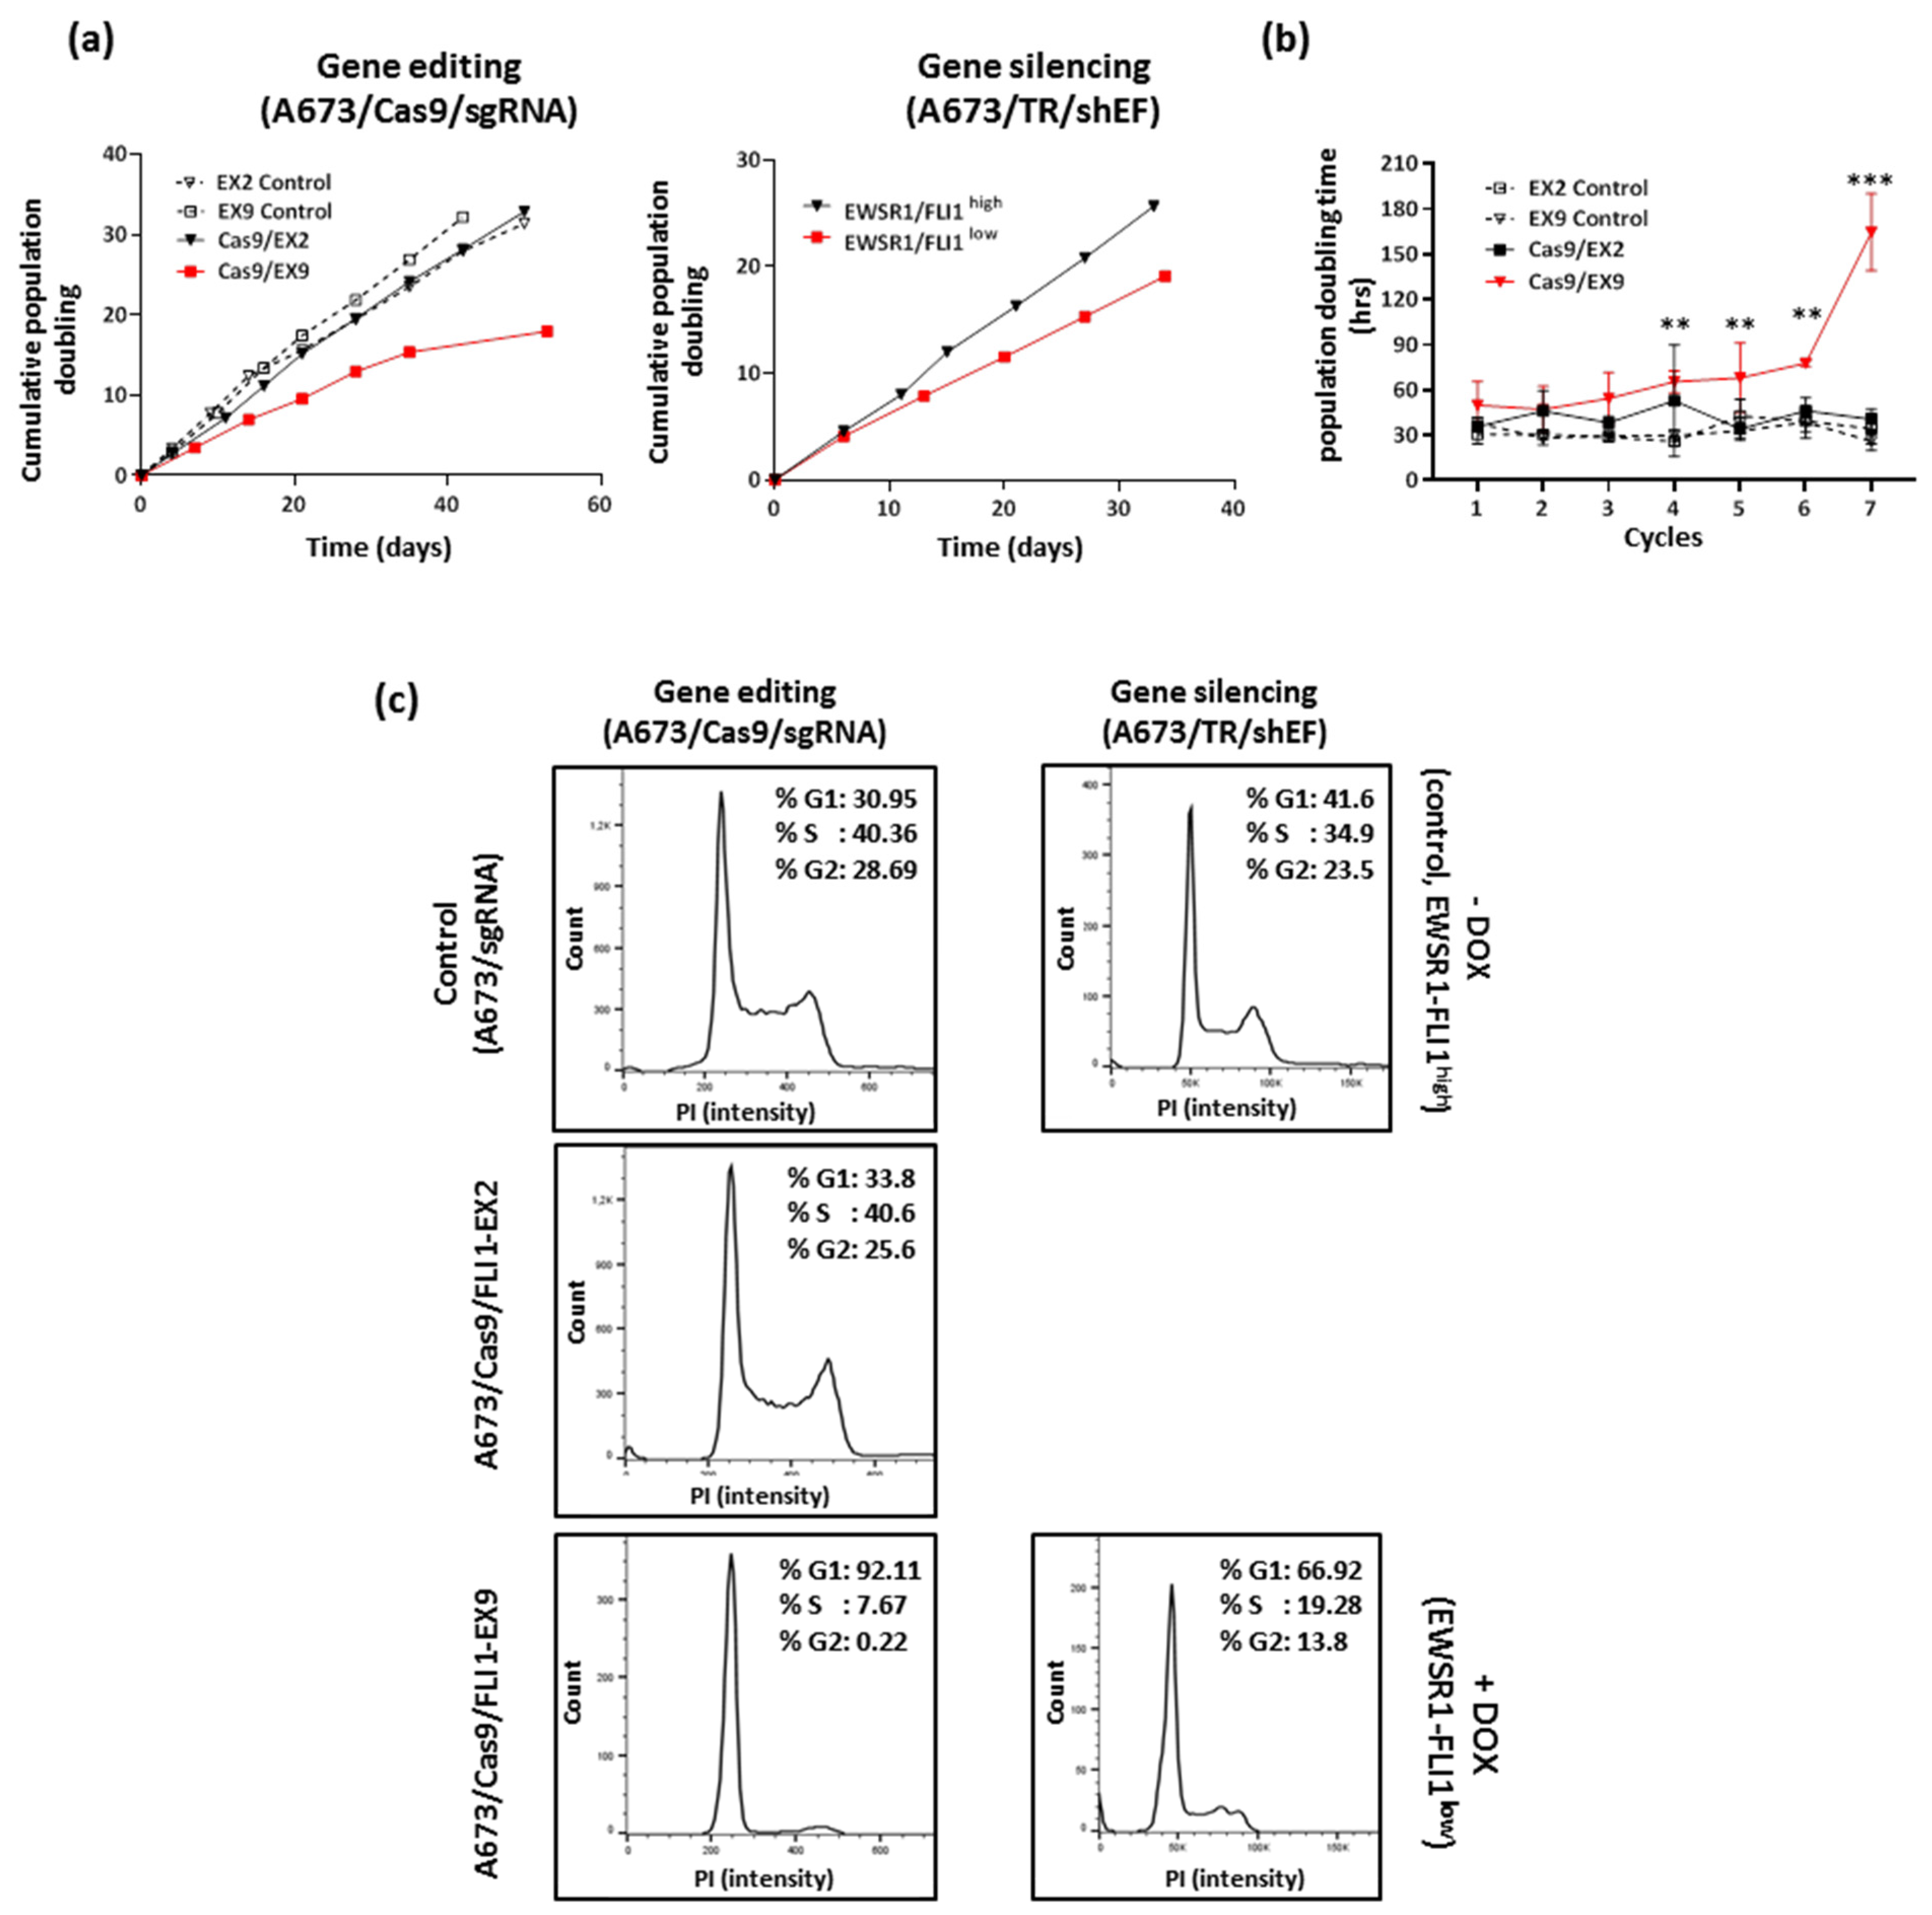
3.3. Effect of EWSR1–FLI1 Gene Inactivation on Cell Proliferation
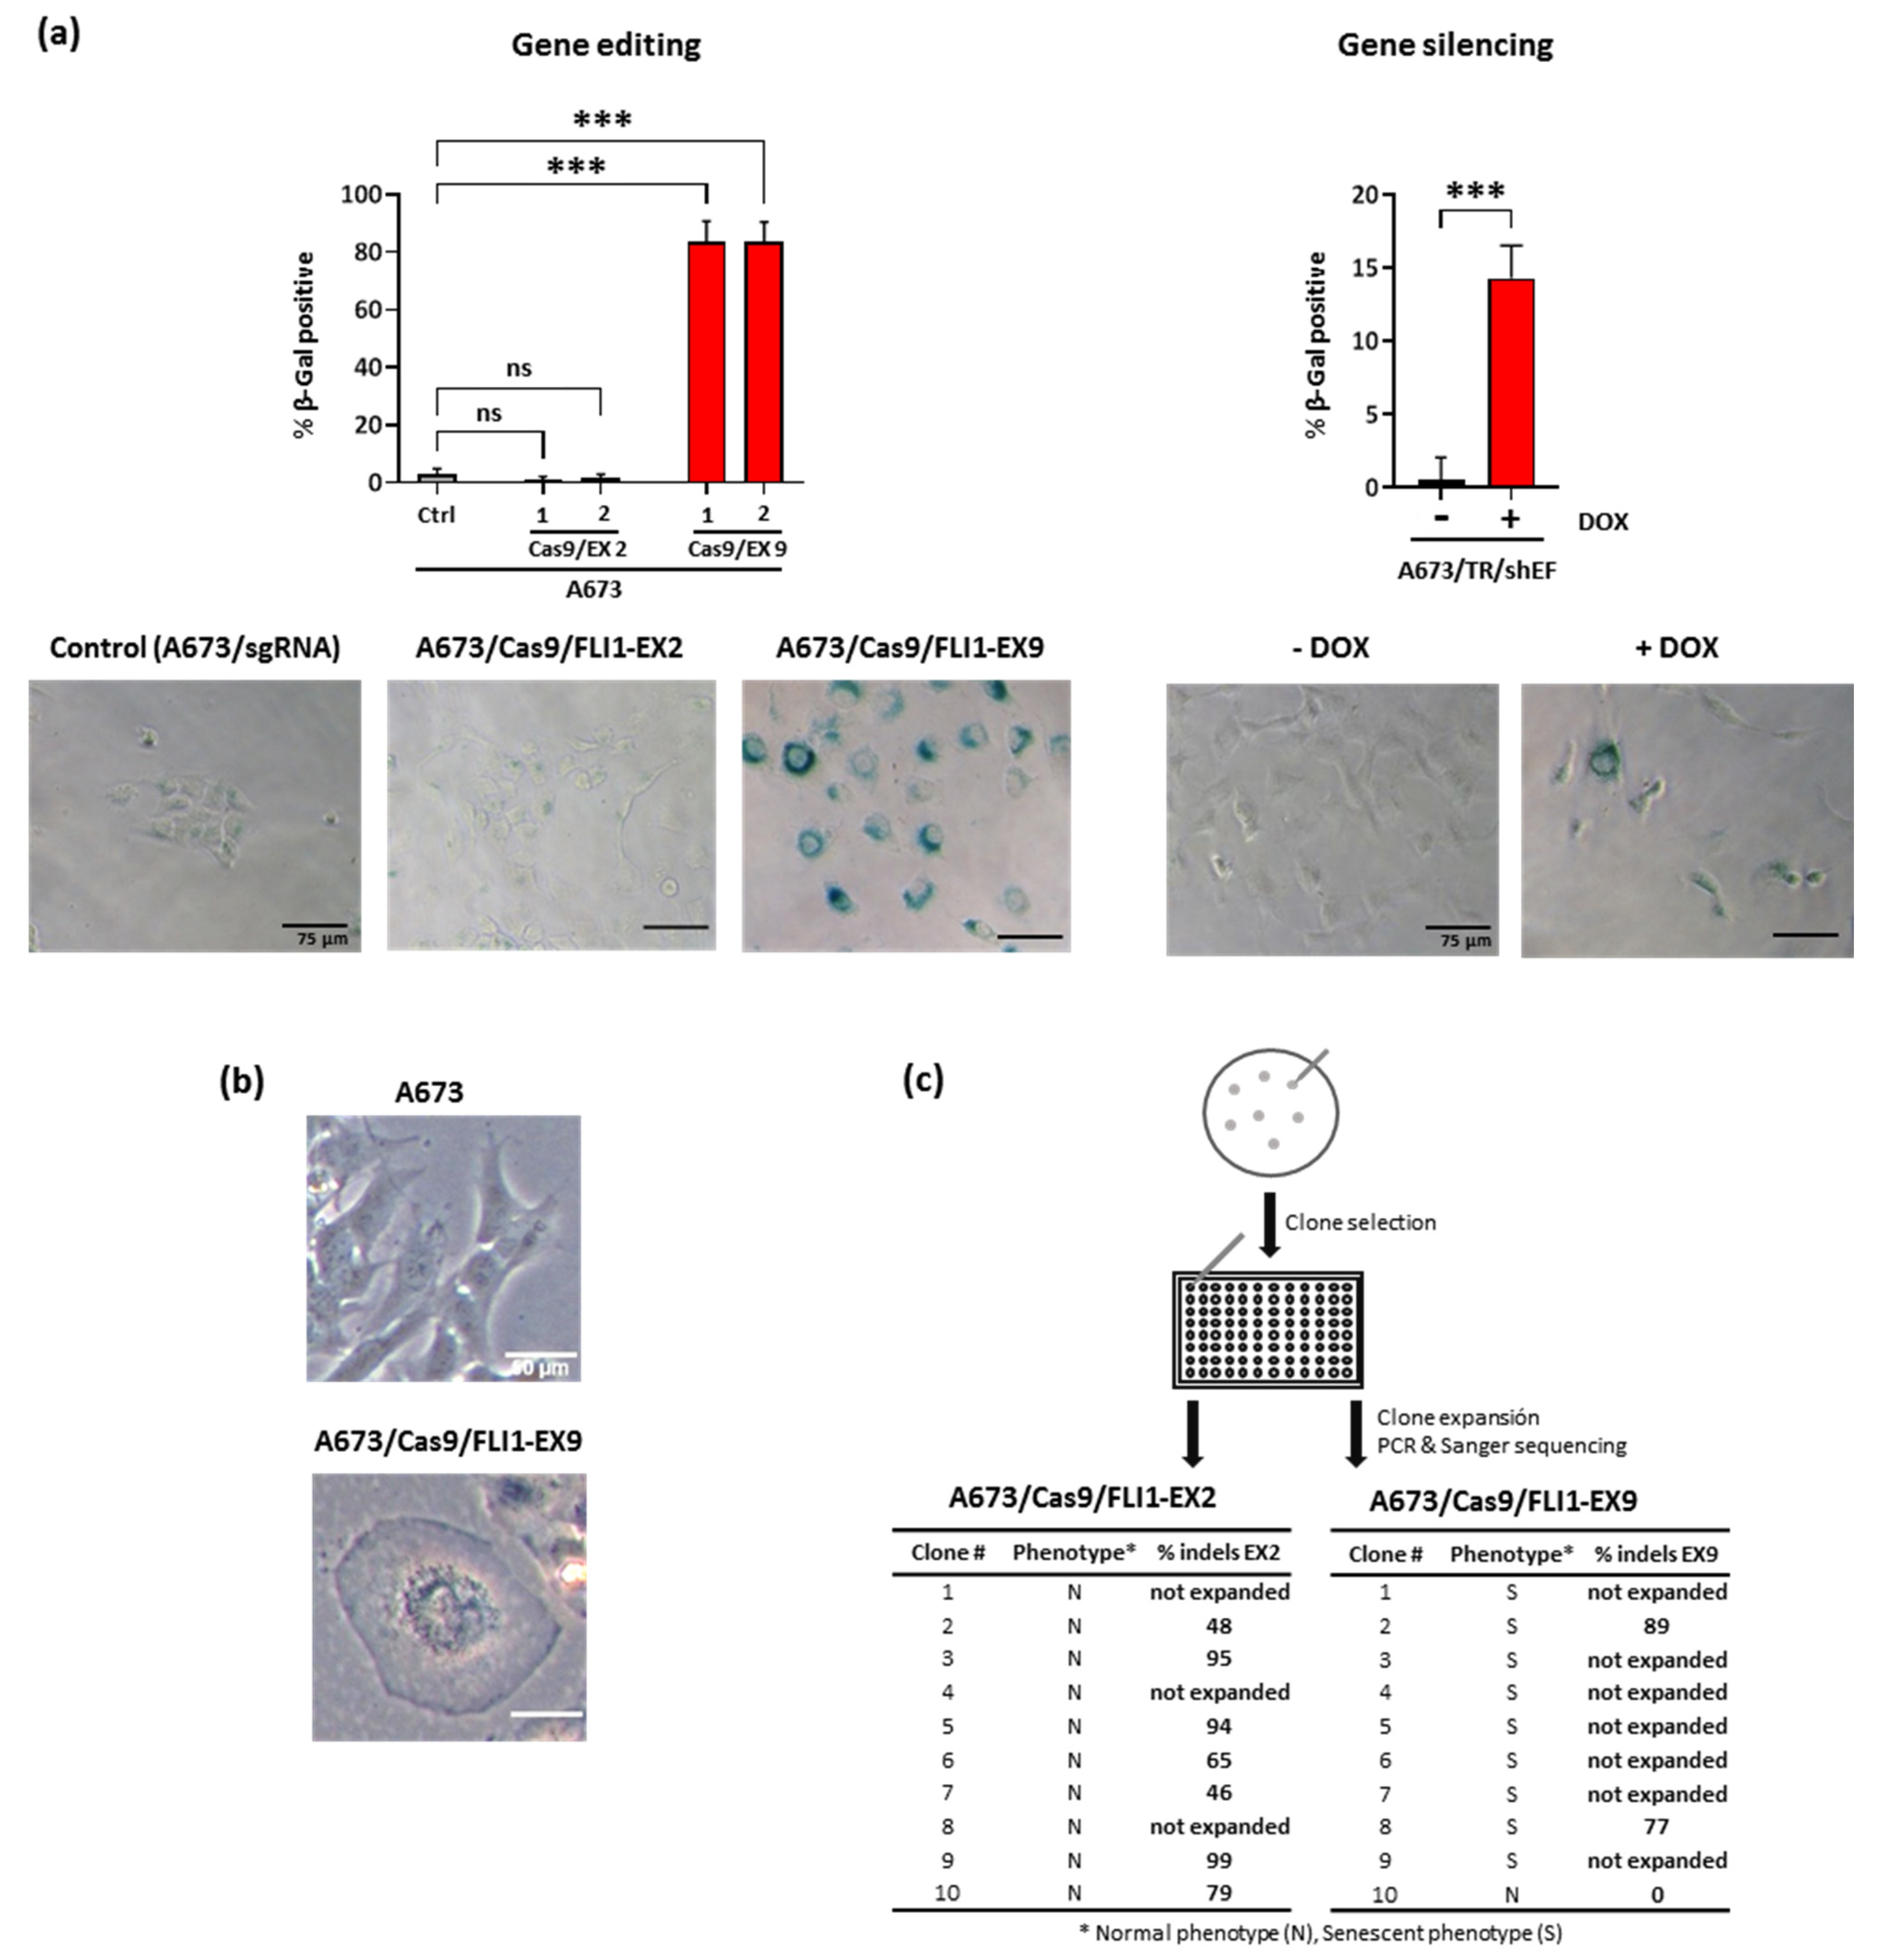
3.4. EWSR1–FLI1 Inactivation Produces Generalized Senescence
4. Discussion
Supplementary Materials
Author Contributions
Funding
Institutional Review Board Statement
Informed Consent Statement
Data Availability Statement
Acknowledgments
Conflicts of Interest
References
- Grunewald, T.G.P.; Cidre-Aranaz, F.; Surdez, D.; Tomazou, E.M.; de Alava, E.; Kovar, H.; Sorensen, P.H.; Delattre, O.; Dirksen, U. Ewing sarcoma. Nat. Rev. Dis. Primers 2018, 4, 5. [Google Scholar] [CrossRef]
- Kovar, H.; Amatruda, J.; Brunet, E.; Burdach, S.; Cidre-Aranaz, F.; de Alava, E.; Dirksen, U.; van der Ent, W.; Grohar, P.; Grunewald, T.G.; et al. The second European interdisciplinary Ewing sarcoma research summit—A joint effort to deconstructing the multiple layers of a complex disease. Oncotarget 2016, 7, 8613–8624. [Google Scholar] [CrossRef] [Green Version]
- Kovar, H.; Alonso, J.; Aman, P.; Aryee, D.N.; Ban, J.; Burchill, S.A.; Burdach, S.; De Alava, E.; Delattre, O.; Dirksen, U.; et al. The first European interdisciplinary ewing sarcoma research summit. Front. Oncol. 2012, 2, 54. [Google Scholar] [CrossRef] [Green Version]
- Bolling, T.; Braun-Munzinger, G.; Burdach, S.; Calaminus, G.; Craft, A.; Delattre, O.; Deley, M.C.; Dirksen, U.; Dockhorn-Dworniczak, B.; Dunst, J.; et al. Development of curative therapies for Ewing sarcomas by interdisciplinary cooperative groups in Europe. Klin. Padiatr. 2015, 227, 108–115. [Google Scholar] [CrossRef]
- Gaspar, N.; Hawkins, D.S.; Dirksen, U.; Lewis, I.J.; Ferrari, S.; Le Deley, M.C.; Kovar, H.; Grimer, R.; Whelan, J.; Claude, L.; et al. Ewing sarcoma: Current management and future approaches through collaboration. J. Clin. Oncol. 2015, 33, 3036–3046. [Google Scholar] [CrossRef]
- Delattre, O.; Zucman, J.; Plougastel, B.; Desmaze, C.; Melot, T.; Peter, M.; Kovar, H.; Joubert, I.; de Jong, P.; Rouleau, G.; et al. Gene fusion with an ETS DNA-binding domain caused by chromosome translocation in human tumours. Nature 1992, 359, 162–165. [Google Scholar] [CrossRef]
- Tirode, F.; Surdez, D.; Ma, X.; Parker, M.; Le Deley, M.C.; Bahrami, A.; Zhang, Z.; Lapouble, E.; Grossetete-Lalami, S.; Rusch, M.; et al. Genomic landscape of Ewing sarcoma defines an aggressive subtype with co-association of STAG2 and TP53 mutations. Cancer Discov. 2014, 4, 1342–1353. [Google Scholar] [CrossRef] [Green Version]
- Crompton, B.D.; Stewart, C.; Taylor-Weiner, A.; Alexe, G.; Kurek, K.C.; Calicchio, M.L.; Kiezun, A.; Carter, S.L.; Shukla, S.A.; Mehta, S.S.; et al. The genomic landscape of pediatric Ewing sarcoma. Cancer Discov. 2014, 4, 1326–1341. [Google Scholar] [CrossRef] [Green Version]
- Stoll, G.; Surdez, D.; Tirode, F.; Laud, K.; Barillot, E.; Zinovyev, A.; Delattre, O. Systems biology of Ewing sarcoma: A network model of EWS-FLI1 effect on proliferation and apoptosis. Nucleic Acids Res. 2013, 41, 8853–8871. [Google Scholar] [CrossRef] [PubMed] [Green Version]
- Tirode, F.; Laud-Duval, K.; Prieur, A.; Delorme, B.; Charbord, P.; Delattre, O. Mesenchymal stem cell features of Ewing tumors. Cancer Cell 2007, 11, 421–429. [Google Scholar] [CrossRef] [Green Version]
- Garcia-Aragoncillo, E.; Carrillo, J.; Lalli, E.; Agra, N.; Gomez-Lopez, G.; Pestana, A.; Alonso, J. DAX1, a direct target of EWS/FLI1 oncoprotein, is a principal regulator of cell-cycle progression in Ewing’s tumor cells. Oncogene 2008, 27, 6034–6043. [Google Scholar] [CrossRef] [Green Version]
- Carrillo, J.; Garcia-Aragoncillo, E.; Azorin, D.; Agra, N.; Sastre, A.; Gonzalez-Mediero, I.; Garcia-Miguel, P.; Pestana, A.; Gallego, S.; Segura, D.; et al. Cholecystokinin down-regulation by RNA interference impairs Ewing tumor growth. Clin. Cancer Res. 2007, 13, 2429–2440. [Google Scholar] [CrossRef] [PubMed] [Green Version]
- Wiles, E.T.; Lui-Sargent, B.; Bell, R.; Lessnick, S.L. BCL11B is up-regulated by EWS/FLI and contributes to the transformed phenotype in Ewing sarcoma. PLoS ONE 2013, 8, e59369. [Google Scholar] [CrossRef] [Green Version]
- Sainz-Jaspeado, M.; Lagares-Tena, L.; Lasheras, J.; Navid, F.; Rodriguez-Galindo, C.; Mateo-Lozano, S.; Notario, V.; Sanjuan, X.; Garcia Del Muro, X.; Fabra, A.; et al. Caveolin-1 modulates the ability of Ewing’s sarcoma to metastasize. Mol. Cancer Res. MCR 2010, 8, 1489–1500. [Google Scholar] [CrossRef] [Green Version]
- Ordonez, J.L.; Osuna, D.; Herrero, D.; de Alava, E.; Madoz-Gurpide, J. Advances in Ewing’s sarcoma research: Where are we now and what lies ahead? Cancer Res. 2009, 69, 7140–7150. [Google Scholar] [CrossRef] [Green Version]
- Richter, G.H.; Plehm, S.; Fasan, A.; Rossler, S.; Unland, R.; Bennani-Baiti, I.M.; Hotfilder, M.; Lowel, D.; von Luettichau, I.; Mossbrugger, I.; et al. EZH2 is a mediator of EWS/FLI1 driven tumor growth and metastasis blocking endothelial and neuro-ectodermal differentiation. Proc. Natl. Acad. Sci. USA 2009, 106, 5324–5329. [Google Scholar] [CrossRef] [Green Version]
- Sheffield, N.C.; Pierron, G.; Klughammer, J.; Datlinger, P.; Schonegger, A.; Schuster, M.; Hadler, J.; Surdez, D.; Guillemot, D.; Lapouble, E.; et al. DNA methylation heterogeneity defines a disease spectrum in Ewing sarcoma. Nat. Med. 2017, 23, 386–395. [Google Scholar] [CrossRef] [PubMed]
- Tomazou, E.M.; Sheffield, N.C.; Schmidl, C.; Schuster, M.; Schonegger, A.; Datlinger, P.; Kubicek, S.; Bock, C.; Kovar, H. Epigenome mapping reveals distinct modes of gene regulation and widespread enhancer reprogramming by the oncogenic fusion protein EWS-FLI1. Cell Rep. 2015, 10, 1082–1095. [Google Scholar] [CrossRef] [Green Version]
- Kovar, H. Blocking the road, stopping the engine or killing the driver? Advances in targeting EWS/FLI-1 fusion in Ewing sarcoma as novel therapy. Expert Opin. Ther. Targets 2014, 18, 1315–1328. [Google Scholar] [CrossRef]
- Mojica, F.J.M.; Montoliu, L. On the origin of CRISPR-Cas technology: From prokaryotes to mammals. Trends Microbiol. 2016, 24, 811–820. [Google Scholar] [CrossRef]
- Lander, E.S. The heroes of CRISPR. Cell 2016, 164, 18–28. [Google Scholar] [CrossRef] [Green Version]
- Xiao-Jie, L.; Hui-Ying, X.; Zun-Ping, K.; Jin-Lian, C.; Li-Juan, J. CRISPR-Cas9: A new and promising player in gene therapy. J. Med Genet. 2015, 52, 289–296. [Google Scholar] [CrossRef] [PubMed] [Green Version]
- Jiang, F.; Doudna, J.A. CRISPR-Cas9 structures and mechanisms. Annu. Rev. Biophys. 2017, 46, 505–529. [Google Scholar] [CrossRef] [PubMed] [Green Version]
- Anders, C.; Niewoehner, O.; Duerst, A.; Jinek, M. Structural basis of PAM-dependent target DNA recognition by the Cas9 endonuclease. Nature 2014, 513, 569–573. [Google Scholar] [CrossRef] [PubMed]
- Fu, B.X.; St Onge, R.P.; Fire, A.Z.; Smith, J.D. Distinct patterns of Cas9 mismatch tolerance in vitro and in vivo. Nucleic Acids Res. 2016, 44, 5365–5377. [Google Scholar] [CrossRef] [Green Version]
- Behan, F.M.; Iorio, F.; Picco, G.; Goncalves, E.; Beaver, C.M.; Migliardi, G.; Santos, R.; Rao, Y.; Sassi, F.; Pinnelli, M.; et al. Prioritization of cancer therapeutic targets using CRISPR-Cas9 screens. Nature 2019, 568, 511–516. [Google Scholar] [CrossRef] [PubMed]
- Doench, J.G. Am I ready for CRISPR? A user’s guide to genetic screens. Nat. Rev. Genet. 2018, 19, 67–80. [Google Scholar] [CrossRef]
- Weber, J.; Braun, C.J.; Saur, D.; Rad, R. In vivo functional screening for systems-level integrative cancer genomics. Nat. Rev. Cancer 2020, 20, 573–593. [Google Scholar] [CrossRef]
- Zarei, A.; Razban, V.; Hosseini, S.E.; Tabei, S.M.B. Creating cell and animal models of human disease by genome editing using CRISPR/Cas9. J. Gene Med. 2019, 21, e3082. [Google Scholar] [CrossRef]
- Kennedy, E.M.; Kornepati, A.V.; Goldstein, M.; Bogerd, H.P.; Poling, B.C.; Whisnant, A.W.; Kastan, M.B.; Cullen, B.R. Inactivation of the human papillomavirus E6 or E7 gene in cervical carcinoma cells by using a bacterial CRISPR/Cas RNA-guided endonuclease. J. Virol. 2014, 88, 11965–11972. [Google Scholar] [CrossRef] [Green Version]
- Jubair, L.; Lam, A.K.; Fallaha, S.; McMillan, N.A.J. CRISPR/Cas9-loaded stealth liposomes effectively cleared established HPV16-driven tumours in syngeneic mice. PLoS ONE 2021, 16, e0223288. [Google Scholar] [CrossRef] [PubMed]
- Afgan, E.; Baker, D.; Batut, B.; van den Beek, M.; Bouvier, D.; Cech, M.; Chilton, J.; Clements, D.; Coraor, N.; Gruning, B.A.; et al. The Galaxy platform for accessible, reproducible and collaborative biomedical analyses: 2018 update. Nucleic Acids Res. 2018, 46, W537–W544. [Google Scholar] [CrossRef] [PubMed] [Green Version]
- Quintana-Bustamante, O.; Fananas-Baquero, S.; Morin, M.; Fernandez, S.; Fernandez, V.; Bueren, J.A.; Moreno-Pelayo, M.A.; Segovia, J.C. Highly precise gene editing correction of a Pyruvate Kinase deficiency-causing mutation in patient-derived lymphoblastic cells using single stranded oligodeoxinucleotides. In Proceedings of the ESGCT 27th Annual Congress, Barcelona, Spain, 22–25 October 2019; p. A180. [Google Scholar]
- Fananas-Baquero, S.; Quintana-Bustamante, O.; Morin, M.; Fernandez, S.; Fernandez, V.; Bueren, J.A.; Moreno-Pelayo, M.A.; Segovia, J.C. Highly precise single-stranded template repair of a Pyruvate Kinase Deficiency-causing mutation in patient-derived lymphoblastic cell line. In Proceedings of the 23rd Annual Meeting of the American Society for Gene and Cell Therapy, Boston, MA, USA, 12–15 May 2020; p. 363. [Google Scholar]
- Oliveros, J.C.; Franch, M.; Tabas-Madrid, D.; San-Leon, D.; Montoliu, L.; Cubas, P.; Pazos, F. Breaking-Cas-interactive design of guide RNAs for CRISPR-Cas experiments for ENSEMBL genomes. Nucleic Acids Res. 2016, 44, W267–W271. [Google Scholar] [CrossRef] [Green Version]
- Schindelin, J.; Arganda-Carreras, I.; Frise, E.; Kaynig, V.; Longair, M.; Pietzsch, T.; Preibisch, S.; Rueden, C.; Saalfeld, S.; Schmid, B.; et al. Fiji: An open-source platform for biological-image analysis. Nat. Methods 2012, 9, 676–682. [Google Scholar] [CrossRef] [Green Version]
- Mendiola, M.; Carrillo, J.; Garcia, E.; Lalli, E.; Hernandez, T.; de Alava, E.; Tirode, F.; Delattre, O.; Garcia-Miguel, P.; Lopez-Barea, F.; et al. The orphan nuclear receptor DAX1 is up-regulated by the EWS/FLI1 oncoprotein and is highly expressed in Ewing tumors. Int. J. Cancer 2006, 118, 1381–1389. [Google Scholar] [CrossRef]
- Tamai, K.T.; Monaco, L.; Alastalo, T.P.; Lalli, E.; Parvinen, M.; Sassone-Corsi, P. Hormonal and developmental regulation of DAX-1 expression in Sertoli cells. Mol. Endocrinol. 1996, 10, 1561–1569. [Google Scholar] [CrossRef] [Green Version]
- Hancock, J.D.; Lessnick, S.L. A transcriptional profiling meta-analysis reveals a core EWS-FLI gene expression signature. Cell Cycle 2008, 7, 250–256. [Google Scholar] [CrossRef] [Green Version]
- Xiao, Y.; Zhang, Y.; Xiao, F. Comparison of several commonly used detection indicators of cell senescence. Drug Chem. Toxicol. 2020, 43, 213–218. [Google Scholar] [CrossRef]
- Tancredi, R.; Zambelli, A.; DaPrada, G.A.; Fregoni, V.; Pavesi, L.; Riccardi, A.; Burdach, S.; Grohar, P.J.; D’Incalci, M. Targeting the EWS-FLI1 transcription factor in Ewing sarcoma. Cancer Chemother. Pharmacol. 2015, 75, 1317–1320. [Google Scholar] [CrossRef]
- Harlow, M.L.; Maloney, N.; Roland, J.; Guillen Navarro, M.J.; Easton, M.K.; Kitchen-Goosen, S.M.; Boguslawski, E.A.; Madaj, Z.B.; Johnson, B.K.; Bowman, M.J.; et al. Lurbinectedin inactivates the Ewing sarcoma oncoprotein EWS-FLI1 by redistributing it within the nucleus. Cancer Res. 2016, 76, 6657–6668. [Google Scholar] [CrossRef] [PubMed] [Green Version]
- Grohar, P.J.; Woldemichael, G.M.; Griffin, L.B.; Mendoza, A.; Chen, Q.-R.; Yeung, C.; Currier, D.G.; Davis, S.; Khanna, C.; Khan, J.; et al. Identification of an inhibitor of the EWS-FLI1 oncogenic transcription factor by high-throughput screening. J. Natl. Cancer Inst. 2011, 103, 962–978. [Google Scholar] [CrossRef] [Green Version]
- Osgood, C.L.; Maloney, N.; Kidd, C.G.; Kitchen-Goosen, S.; Segars, L.; Gebregiorgis, M.; Woldemichael, G.M.; He, M.; Sankar, S.; Lessnick, S.L.; et al. Identification of mithramycin analogues with improved targeting of the EWS-FLI1 transcription factor. Clin. Cancer Res. 2016, 22, 4105–4118. [Google Scholar] [CrossRef] [Green Version]
- Barber-Rotenberg, J.S.; Selvanathan, S.P.; Kong, Y.; Erkizan, H.V.; Snyder, T.M.; Hong, S.P.; Kobs, C.L.; South, N.L.; Summer, S.; Monroe, P.J.; et al. Single enantiomer of YK-4-279 demonstrates specificity in targeting the oncogene EWS-FLI1. Oncotarget 2012, 3, 172–182. [Google Scholar] [CrossRef] [Green Version]
- Erkizan, H.V.; Kong, Y.; Merchant, M.; Schlottmann, S.; Barber-Rotenberg, J.S.; Yuan, L.; Abaan, O.D.; Chou, T.H.; Dakshanamurthy, S.; Brown, M.L.; et al. A small molecule blocking oncogenic protein EWS-FLI1 interaction with RNA helicase A inhibits growth of Ewing’s sarcoma. Nat. Med. 2009, 15, 750–756. [Google Scholar] [CrossRef] [Green Version]
- Grohar, P.J.; Glod, J.; Peer, C.J.; Sissung, T.M.; Arnaldez, F.I.; Long, L.; Figg, W.D.; Whitcomb, P.; Helman, L.J.; Widemann, B.C. A phase I/II trial and pharmacokinetic study of mithramycin in children and adults with refractory Ewing sarcoma and EWS-FLI1 fusion transcript. Cancer Chemother. Pharmacol. 2017, 80, 645–652. [Google Scholar] [CrossRef]
- Uren, A.; Toretsky, J.A. Ewing’s sarcoma oncoprotein EWS-FLI1: The perfect target without a therapeutic agent. Future Oncol. 2005, 1, 521–528. [Google Scholar] [CrossRef] [PubMed]
- Singh, P.; Kumar, V.; Gupta, S.K.; Kumari, G.; Verma, M. Combating TKI resistance in CML by inhibiting the PI3K/Akt/mTOR pathway in combination with TKIs: A review. Med Oncol. 2021, 38, 10. [Google Scholar] [CrossRef]
- Yaghmaie, M.; Yeung, C.C. Molecular mechanisms of resistance to tyrosine kinase inhibitors. Curr. Hematol. Malig. Rep. 2019, 14, 395–404. [Google Scholar] [CrossRef]
- Zhan, T.; Rindtorff, N.; Betge, J.; Ebert, M.P.; Boutros, M. CRISPR/Cas9 for cancer research and therapy. Semin. Cancer Biol. 2019, 55, 106–119. [Google Scholar] [CrossRef]
- Shi, X.; Zheng, Y.; Jiang, L.; Zhou, B.; Yang, W.; Li, L.; Ding, L.; Huang, M.; Gery, S.; Lin, D.C.; et al. EWS-FLI1 regulates and cooperates with core regulatory circuitry in Ewing sarcoma. Nucleic Acids Res. 2020. [Google Scholar] [CrossRef]
- Aynaud, M.M.; Mirabeau, O.; Gruel, N.; Grossetete, S.; Boeva, V.; Durand, S.; Surdez, D.; Saulnier, O.; Zaidi, S.; Gribkova, S.; et al. Transcriptional programs define intratumoral heterogeneity of Ewing sarcoma at single-cell resolution. Cell Rep. 2020, 30, 1767–1779.e6. [Google Scholar] [CrossRef] [Green Version]
- Childs, B.G.; Baker, D.J.; Kirkland, J.L.; Campisi, J.; van Deursen, J.M. Senescence and apoptosis: Dueling or complementary cell fates? EMBO Rep. 2014, 15, 1139–1153. [Google Scholar] [CrossRef] [Green Version]
- Kumari, R.; Jat, P. Mechanisms of cellular senescence: Cell cycle arrest and senescence associated secretory phenotype. Front. Cell Dev. Biol. 2021, 9, 645593. [Google Scholar] [CrossRef]
- Cristofalo, V.J. SA beta Gal staining: Biomarker or delusion. Exp. Gerontol. 2005, 40, 836–838. [Google Scholar] [CrossRef] [PubMed]
- Severino, J.; Allen, R.G.; Balin, S.; Balin, A.; Cristofalo, V.J. Is beta-galactosidase staining a marker of senescence in vitro and in vivo? Exp. Cell Res. 2000, 257, 162–171. [Google Scholar] [CrossRef] [PubMed]
- Wang, D.; Lu, P.; Liu, Y.; Chen, L.; Zhang, R.; Sui, W.; Dumitru, A.G.; Chen, X.; Wen, F.; Ouyang, H.W.; et al. Isolation of live premature senescent cells using FUCCI technology. Sci. Rep. 2016, 6, 30705. [Google Scholar] [CrossRef] [PubMed] [Green Version]
- Yang, N.C.; Hu, M.L. The limitations and validities of senescence associated-beta-galactosidase activity as an aging marker for human foreskin fibroblast Hs68 cells. Exp. Gerontol. 2005, 40, 813–819. [Google Scholar] [CrossRef] [PubMed]
- Peng, R.; Lin, G.; Li, J. Potential pitfalls of CRISPR/Cas9-mediated genome editing. FEBS J. 2016, 283, 1218–1231. [Google Scholar] [CrossRef] [Green Version]
- Torres-Perez, R.; Garcia-Martin, J.A.; Montoliu, L.; Oliveros, J.C.; Pazos, F. WeReview: CRISPR tools—Live repository of computational tools for assisting CRISPR/Cas experiments. Bioengineering 2019, 6. [Google Scholar] [CrossRef] [Green Version]
- Li, C.; Zhou, S.; Li, Y.; Li, G.; Ding, Y.; Li, L.; Liu, J.; Qu, L.; Sonstegard, T.; Huang, X.; et al. Trio-based deep sequencing reveals a low incidence of off-target mutations in the offspring of genetically edited goats. Front. Genet. 2018, 9, 449. [Google Scholar] [CrossRef] [Green Version]
- Iyer, V.; Boroviak, K.; Thomas, M.; Doe, B.; Riva, L.; Ryder, E.; Adams, D.J. No unexpected CRISPR-Cas9 off-target activity revealed by trio sequencing of gene-edited mice. PLoS Genet. 2018, 14, e1007503. [Google Scholar] [CrossRef]
- Franzetti, G.A.; Laud-Duval, K.; van der Ent, W.; Brisac, A.; Irondelle, M.; Aubert, S.; Dirksen, U.; Bouvier, C.; de Pinieux, G.; Snaar-Jagalska, E.; et al. Cell-to-cell heterogeneity of EWSR1-FLI1 activity determines proliferation/migration choices in Ewing sarcoma cells. Oncogene 2017. [Google Scholar] [CrossRef] [Green Version]
- Munoz-Espin, D.; Serrano, M. Cellular senescence: From physiology to pathology. Nat. Rev. Mol. Cell Biol. 2014, 15, 482–496. [Google Scholar] [CrossRef]
- Hernandez-Segura, A.; Nehme, J.; Demaria, M. Hallmarks of cellular senescence. Trends Cell Biol. 2018, 28, 436–453. [Google Scholar] [CrossRef]
- Kuilman, T.; Peeper, D.S. Senescence-messaging secretome: SMS-ing cellular stress. Nat. Rev. Cancer 2009, 9, 81–94. [Google Scholar] [CrossRef]
- Li, Y.; Luo, H.; Liu, T.; Zacksenhaus, E.; Ben-David, Y. The ets transcription factor Fli-1 in development, cancer and disease. Oncogene 2015, 34, 2022–2031. [Google Scholar] [CrossRef] [Green Version]
- Yip, B.H. Recent advances in CRISPR/Cas9 delivery strategies. Biomolecules 2020, 10, 839. [Google Scholar] [CrossRef]
- Wei, T.; Cheng, Q.; Min, Y.L.; Olson, E.N.; Siegwart, D.J. Systemic nanoparticle delivery of CRISPR-Cas9 ribonucleoproteins for effective tissue specific genome editing. Nat. Commun. 2020, 11, 3232. [Google Scholar] [CrossRef]
- Glass, Z.; Lee, M.; Li, Y.; Xu, Q. Engineering the delivery system for CRISPR-based genome editing. Trends Biotechnol. 2018, 36, 173–185. [Google Scholar] [CrossRef]
- Song, X.; Liu, C.; Wang, N.; Huang, H.; He, S.; Gong, C.; Wei, Y. Delivery of CRISPR/Cas systems for cancer gene therapy and immunotherapy. Adv. Drug Deliv. Rev. 2020. [Google Scholar] [CrossRef]


Publisher’s Note: MDPI stays neutral with regard to jurisdictional claims in published maps and institutional affiliations. |
© 2021 by the authors. Licensee MDPI, Basel, Switzerland. This article is an open access article distributed under the terms and conditions of the Creative Commons Attribution (CC BY) license (https://creativecommons.org/licenses/by/4.0/).
Share and Cite
Cervera, S.T.; Rodríguez-Martín, C.; Fernández-Tabanera, E.; Melero-Fernández de Mera, R.M.; Morin, M.; Fernández-Peñalver, S.; Iranzo-Martínez, M.; Amhih-Cardenas, J.; García-García, L.; González-González, L.; et al. Therapeutic Potential of EWSR1–FLI1 Inactivation by CRISPR/Cas9 in Ewing Sarcoma. Cancers 2021, 13, 3783. https://doi.org/10.3390/cancers13153783
Cervera ST, Rodríguez-Martín C, Fernández-Tabanera E, Melero-Fernández de Mera RM, Morin M, Fernández-Peñalver S, Iranzo-Martínez M, Amhih-Cardenas J, García-García L, González-González L, et al. Therapeutic Potential of EWSR1–FLI1 Inactivation by CRISPR/Cas9 in Ewing Sarcoma. Cancers. 2021; 13(15):3783. https://doi.org/10.3390/cancers13153783
Chicago/Turabian StyleCervera, Saint T., Carlos Rodríguez-Martín, Enrique Fernández-Tabanera, Raquel M. Melero-Fernández de Mera, Matias Morin, Sergio Fernández-Peñalver, Maria Iranzo-Martínez, Jorge Amhih-Cardenas, Laura García-García, Laura González-González, and et al. 2021. "Therapeutic Potential of EWSR1–FLI1 Inactivation by CRISPR/Cas9 in Ewing Sarcoma" Cancers 13, no. 15: 3783. https://doi.org/10.3390/cancers13153783
APA StyleCervera, S. T., Rodríguez-Martín, C., Fernández-Tabanera, E., Melero-Fernández de Mera, R. M., Morin, M., Fernández-Peñalver, S., Iranzo-Martínez, M., Amhih-Cardenas, J., García-García, L., González-González, L., Moreno-Pelayo, M. A., & Alonso, J. (2021). Therapeutic Potential of EWSR1–FLI1 Inactivation by CRISPR/Cas9 in Ewing Sarcoma. Cancers, 13(15), 3783. https://doi.org/10.3390/cancers13153783