Article

Impact of Race and Socioeconomics Disparities on Survival in Young-Onset Colorectal Adenocarcinoma—A SEER Registry Analysis

1
Department of Internal Medicine, The Wright Center for Graduate Medical Education, 501 S. Washington Avenue, Scranton, PA 18505, USA
2
Division of Digestive Diseases, University of Mississippi Medical Center, 2500 North State Street, Jackson, MS 39216, USA
3
Division of Gastroenterology and Hepatology, University of Texas Medical Branch, Galveston, TX 77555, USA
4
Department of Gastroenterology and Hepatology, The University of Arkansas for Medical Sciences, Little Rock, AR 72205, USA
5
Department of Internal Medicine, Texas Tech University Health Science Center El Paso, 2000B Transmountain Road, El Paso, TX 79911, USA
*
Author to whom correspondence should be addressed.
Equal author contribution.
Cancers 2021, 13(13), 3262; https://doi.org/10.3390/cancers13133262
Submission received: 25 May 2021 / Revised: 16 June 2021 / Accepted: 18 June 2021 / Published: 29 June 2021
(This article belongs to the Special Issue Recent Advances in Colorectal Cancer Diagnostics and Treatments)

Abstract

:

Simple Summary

The results of this study show the effects of socio-economic determinants, such as higher income levels, high school education, private insurance, and married marital status, have favorable survival in patients with young-onset colorectal cancer (YoCRC). Moreover, most of the positive social factors are often interrelated. The inclusion of these factors could further prognosticate and help with healthcare resource allocation for successful interventions through public health measures. Colorectal cancer awareness, knowledge, and even utilization of medical services would differ with the education and health literacy.

Abstract

Introduction: We aimed to assess the impact of socio-economic determinants of health (SEDH) on survival disparities within and between the ethnic groups of young-onset (<50 years age) colorectal adenocarcinoma patients. Patients and Methods: Surveillance, epidemiology, and end results (SEER) registry was used to identify colorectal adenocarcinoma patients aged between 25–49 years from 2012 and 2016. Survival analysis was performed using the Kaplan–Meir method. Cox proportional hazards model was used to determine the hazard effect of SEDH. American community survey (ACS) data 2012–2016 were used to analyze the impact of high school education, immigration status, poverty, household income, employment, marital status, and insurance type. Results: A total of 17,145 young-onset colorectal adenocarcinoma patients were studied. Hispanic (H) = 2874, Non-Hispanic American Indian/Alaskan Native (NHAIAN) = 164, Non-Hispanic Asian Pacific Islander (NHAPI) = 1676, Non-Hispanic black (NHB) = 2305, Non-Hispanic white (NHW) = 10,126. Overall cancer-specific survival was, at 5 years, 69 m. NHB (65.58 m) and NHAIAN (65.67 m) experienced worse survival compared with NHW (70.11 m), NHAPI (68.7), and H (68.31). High school education conferred improved cancer-specific survival significantly with NHAPI, NHB, and NHW but not with H and NHAIAN. Poverty lowered and high school education improved cancer-specific survival (CSS) in NHB, NHW, and NHAPI. Unemployment was associated with lowered CSS in H and NAPI. Lower income below the median negatively impacted survival among H, NHAPI NHB, and NHW. Recent immigration within the last 12 months lowered CSS survival in NHW. Commercial health insurance compared with government insurance conferred improved CSS in all groups. Conclusions: Survival disparities were found among all races with young-onset colorectal adenocarcinoma. The pattern of SEDH influencing survival was unique to each race. Overall higher income levels, high school education, private insurance, and marital status appeared to be independent factors conferring favorable survival found on multivariate analysis.

1. Introduction

Colorectal cancer (CRC) is the third most commonly diagnosed cancer and the third leading cause of cancer deaths in both men and women in the United States, with an estimated 147,950 people diagnosed and 53,200 deaths in 2020 [1]. From 1975 to 2017, the overall CRC incidence and mortality trend have decreased by more than 30% and 50%, respectively [2]. However, this trend was mainly seen in screen-eligible populations above 50 years of age [3]. In marked contrast, the incidence of young-onset colorectal cancer (YoCRC), traditionally defined by diagnosis under age 50, has increased by 26% from 8.5 per 100,000 in 1992 to 10.7 per 100,000 in 2013 [2,4,5]. Further, it has been estimated that by the year 2030, 10% of CRC would likely develop in people under the age of 50 years [6,7]. Among the strategies agreed upon for improving cancer survival in CRC, health awareness and education of low socioeconomic groups have been suggested [8]. Equitable distribution of healthcare is a desirable trait of any developed society. In the U.S, glaring and wide-ranging disparities exist in colorectal cancer survival [9]. The interpretation of this association needs to be cautiously performed as affluence may provide health care affordability but by itself may not guarantee better health outcomes unless it is also associated with better health literacy. There is a growing body of literature that ethnicity is a major determinant in colorectal cancer treatment outcomes and several other factors [10,11]. Given the complexity of multiple factors driving health care disparities, any attempt to mitigate and remediate them is doomed to fail without a pivotal understanding of the interplay between various racial and socioeconomic determinants (SEDH) impacting availability and access to care. With the rising incidence of YoCRC, there are compelling recommendations to lower the age of screening to 45 [12,13].
The influence of these factors on mortality within each racial/ethnic group has not been studied in YoCRC. Resource allocation for successful interventions through public health measures requires a better understanding of the impact of SEDH on YoCRC survival within each vulnerable racial/ethnic group of a diverse population. Outcome disparities exist for CRC between African Americans and Caucasians and can be attributed to the socioeconomic status [14,15]. Another key determinant is high school education, which has been shown to increase the odds of CRC screening by 2.47 times when compared with those without high school education [16,17]. Hence, our study aimed to determine the effects of multiple SEDH on survival between different racial/ethnic groups with YoCRC.

2. Materials and Methods

2.1. Study Design

This is a retrospective cohort study of Surveillance Epidemiology and End Results Program-American Census Survey (SEER-ACS) data. Since it is a de-identified dataset, the study was exempted for a review/approval by the institutional review board of the Wright Center for Graduate Medical Education (IRB reference—1698777-1).

2.2. Data Source

The SEER database contains comprehensive patient outcome data, including mortality from 18 population-based cancer registries covering approximately a third of the U.S. population [18]. Data extraction was through a case listing session initiated through SEER*Stat software version 8.3.8 (® NCI) run on the combined SEER 18 incidence registries to obtain demographic, tumor characteristics, and survival data on histologically proven (adenocarcinoma) YoCRC patients [19]. The ACS data integrated into the SEER database were used concomitantly and are updated every 4 years [20].

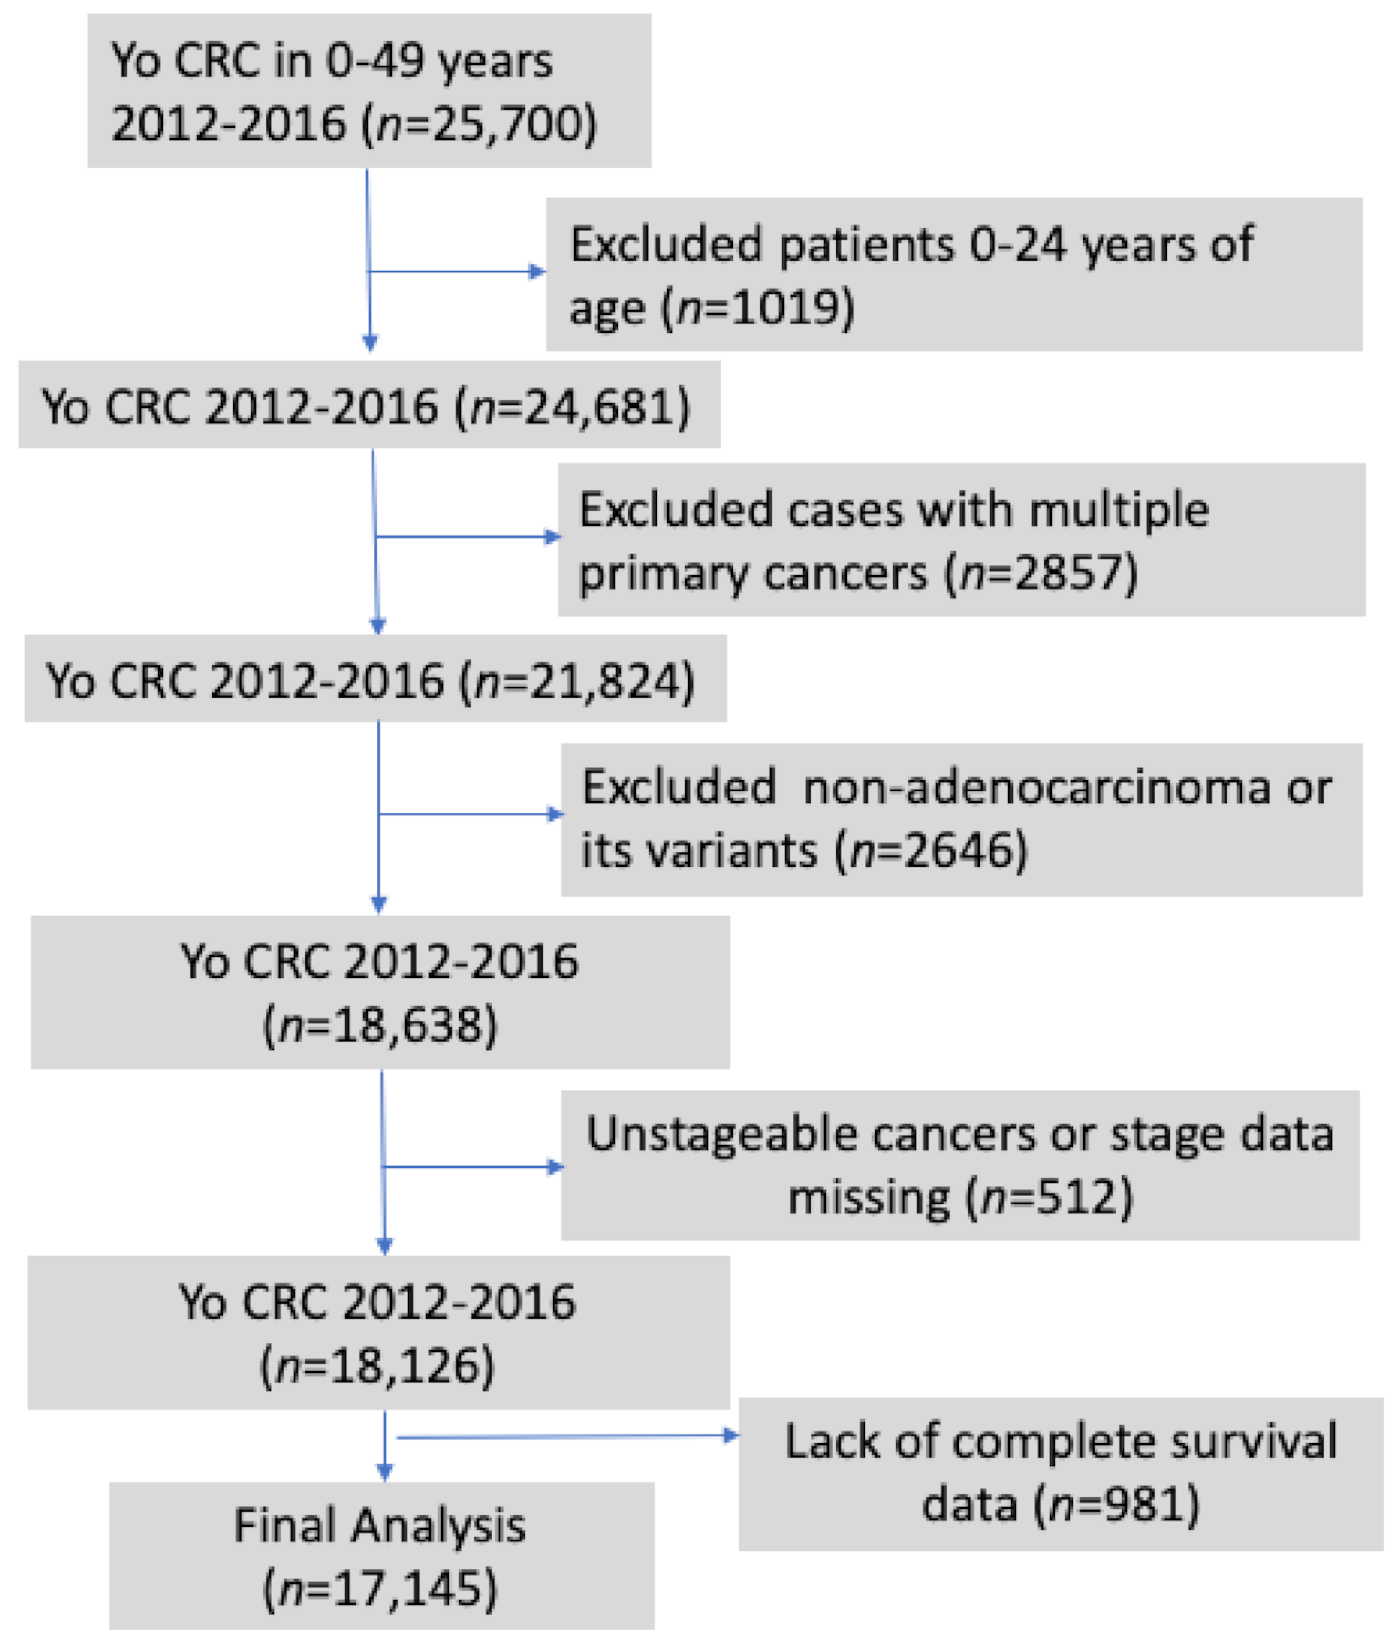
2.3. Patient Selection

We limited our analysis to include patients diagnosed during the years 2012–2016 to overlap with a single period of census survey. The rationale behind this is that SEDH (socioeconomic determinants of health) data accrued from ACS occurs in fixed time periods, and we used SEER data from 2012–2016 as the congruent matched dataset to ACS 2012–2016 for meaningful, accurate analysis within a SEDH unchanged fixed time frame. Another reason to choose the dataset from 2012–2016 was based on American Joint Committee on Cancer (AJCC) staging. SEER data prior to 2012 used a different AJCC stage edition VI with less delineation of sub-stages, whereas 2012–2016 used AJCC stage system VII, which has more substage differentiation. In this study, we defined YoCRC as cancers of the colon and rectum diagnosed in individuals 25 to 49 years old at the time of diagnosis. The race/ethnicity was classified as Hispanic (H), Non-Hispanic American Indian/Alaskan Native (NHAIAN), Non-Hispanic Asian Pacific Islander (NHAPI), Non-Hispanic black (NHB). We excluded patients with histopathologic subtypes other than adenocarcinoma (such as neuroendocrine, squamous cell, sarcoma etc.), patients with multiple primaries, un-stageable cancers (AJCC-TNM) and patients with incomplete survival data. Patients were followed up for a minimum duration of 5 years.

2.4. Socioeconomic Determinants of Health (SEDH)

An area-based measure of seven SEDH parameters available in SEER was used in concurrence with the survival data. [https://seer.cancer.gov/seerstat/variables/countyattribs/static.html#12-16. Accessed in 3 March 2021]. The SEDH data were assessed whether above or below the 50th centile [19]. The parameters defined by the county attribute table of the ACS-census bureau were marital status, employment status, poverty (as defined by ACS based on the U.S. census 2012–2016), immigration status (immigrated to the U.S. within the last 12 months), high school education (completed), insurance status (private vs. Medicaid), and household income (median income as defined by U.S. census 2012–2016) [19].

2.5. Statistical Analysis
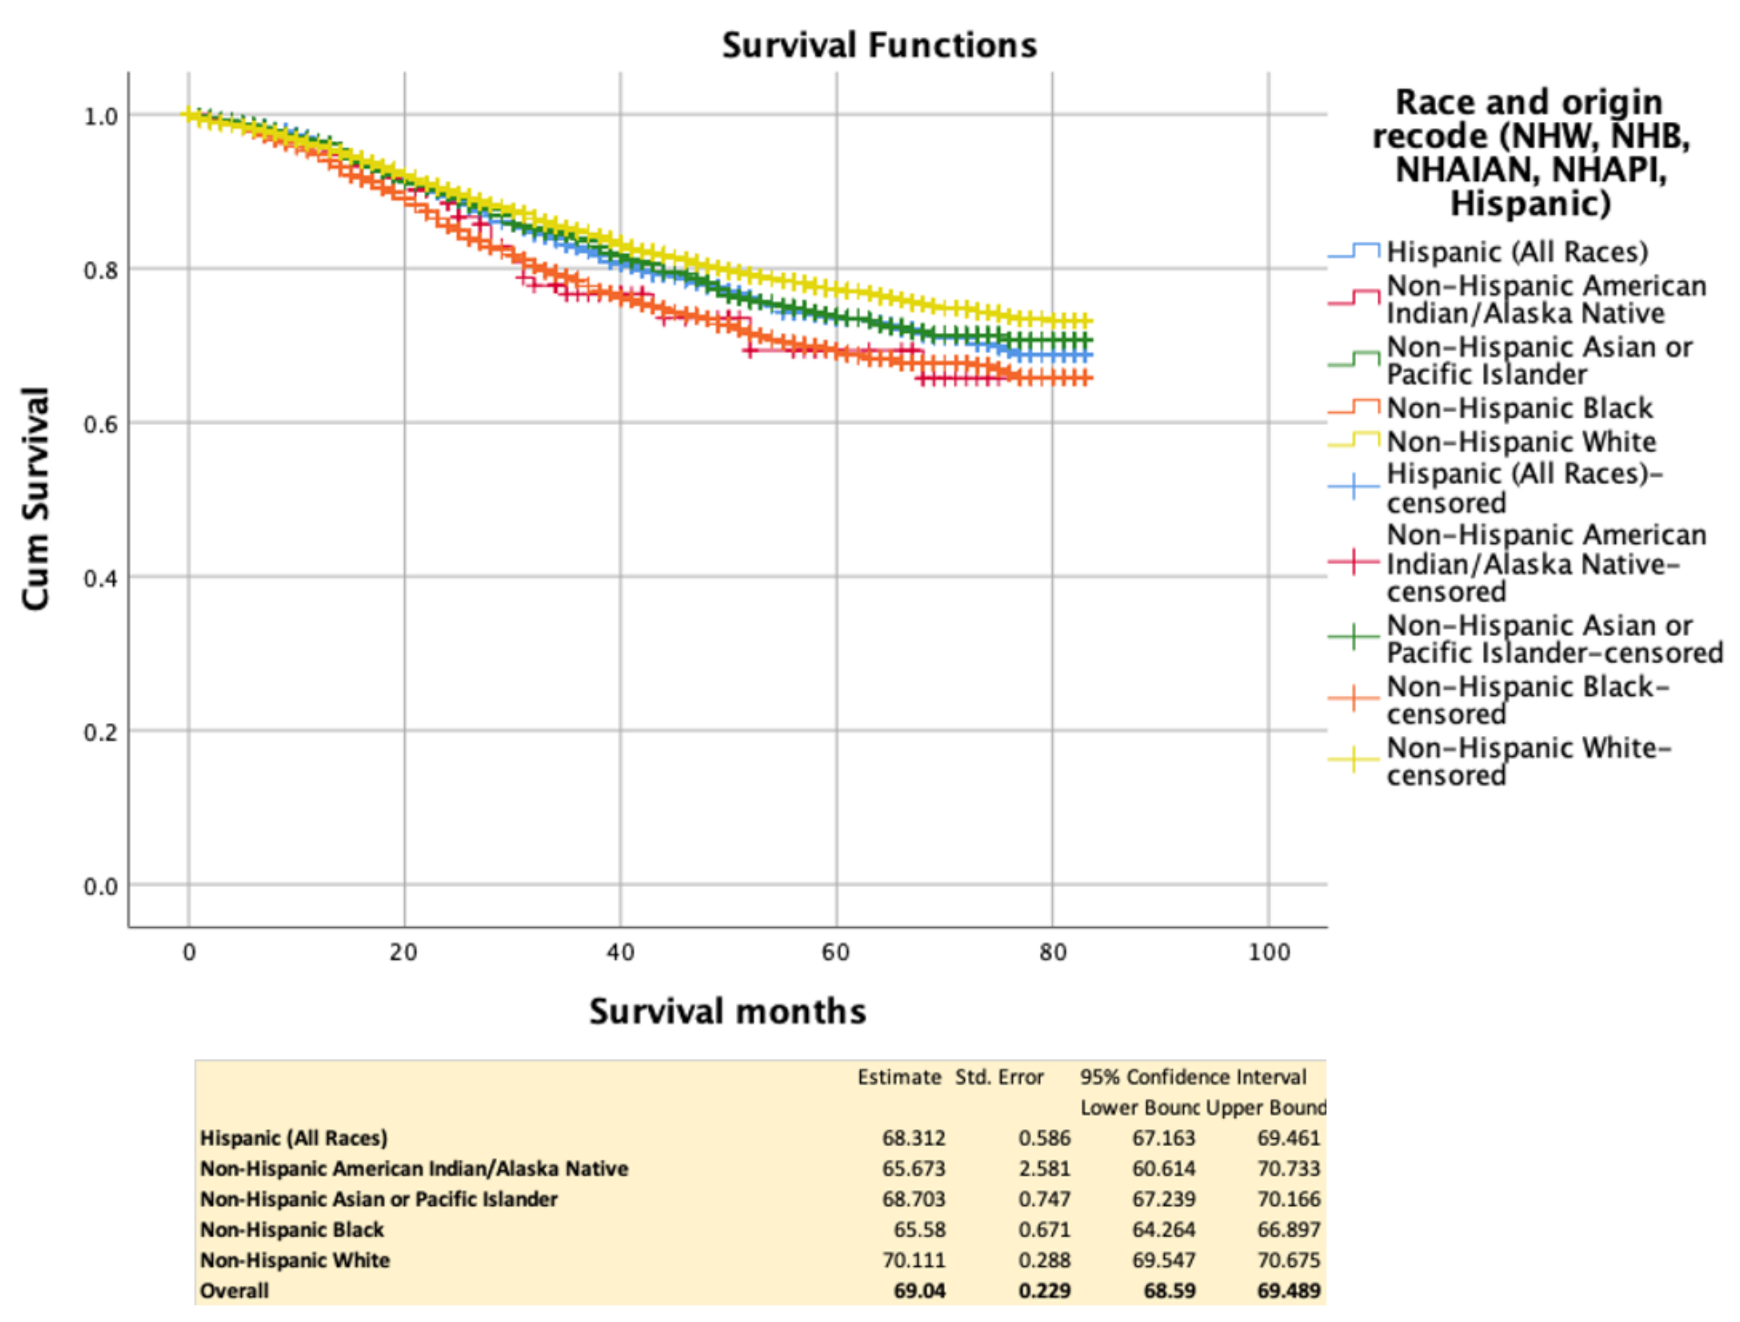
The demographic and tumor characteristics stratified by race/ethnicity were compared by chi-square test for categorical variables and t-test for continuous variables. Median survival (months) was calculated using the Kaplan–Meier analysis. The 5-year survival was analyzed using Log-rank tests and Cox proportional hazards models. Survival time was determined from the date of diagnosis to the last date of follow-up or until the date of death that was cancer-specific as made available through SEER. Hazard ratios (H.R.s) and 95% C.I.s were estimated for univariate and multivariate analysis, using the Cox proportional hazard model. Cancer-specific survival was evaluated for all patients stratified by race/ethnicity and combined as univariate analysis for each SEDH. Cox proportional hazards assumption in the multivariate models were also tested by adding an interaction term with race and follow-up time to the final models. This interaction term was not significant for the overall model or for the models stratified multiple SEDH. All data were analyzed using SPSS v27 for Macintosh (® IBM). As per the data user agreement with SEER, any cell value <11 was censored to prevent re-identification of the rare events.

3. Results

A total of 17,145 young-onset colorectal adenocarcinoma patients were studied (Figure 1). A summary of demographic and clinicopathologic characteristics of cancer patients included in the study is outlined in Table 1. The mean age of the cohort is 42.82 (+/−5.61 S.D.), with 51.9% males. In terms of race and origin, 59.1% were NHW, 16.8% were H, 13.4% were NHB, 9.8% were NHAPI, and 1% were NHAIAN.
Overall and race-specific survival Overall cancer-specific survival was, at 5 years, 69 m. NHB (65.58 m) and NHAIAN (65.67 m) experienced worse survival when compared with NHW (70.11 m), NHAPI (68.7 m), and H (68.31 m). This is illustrated in Figure 2. A summary of race-specific survival controlled for each SEDH is summarized in Table 2.

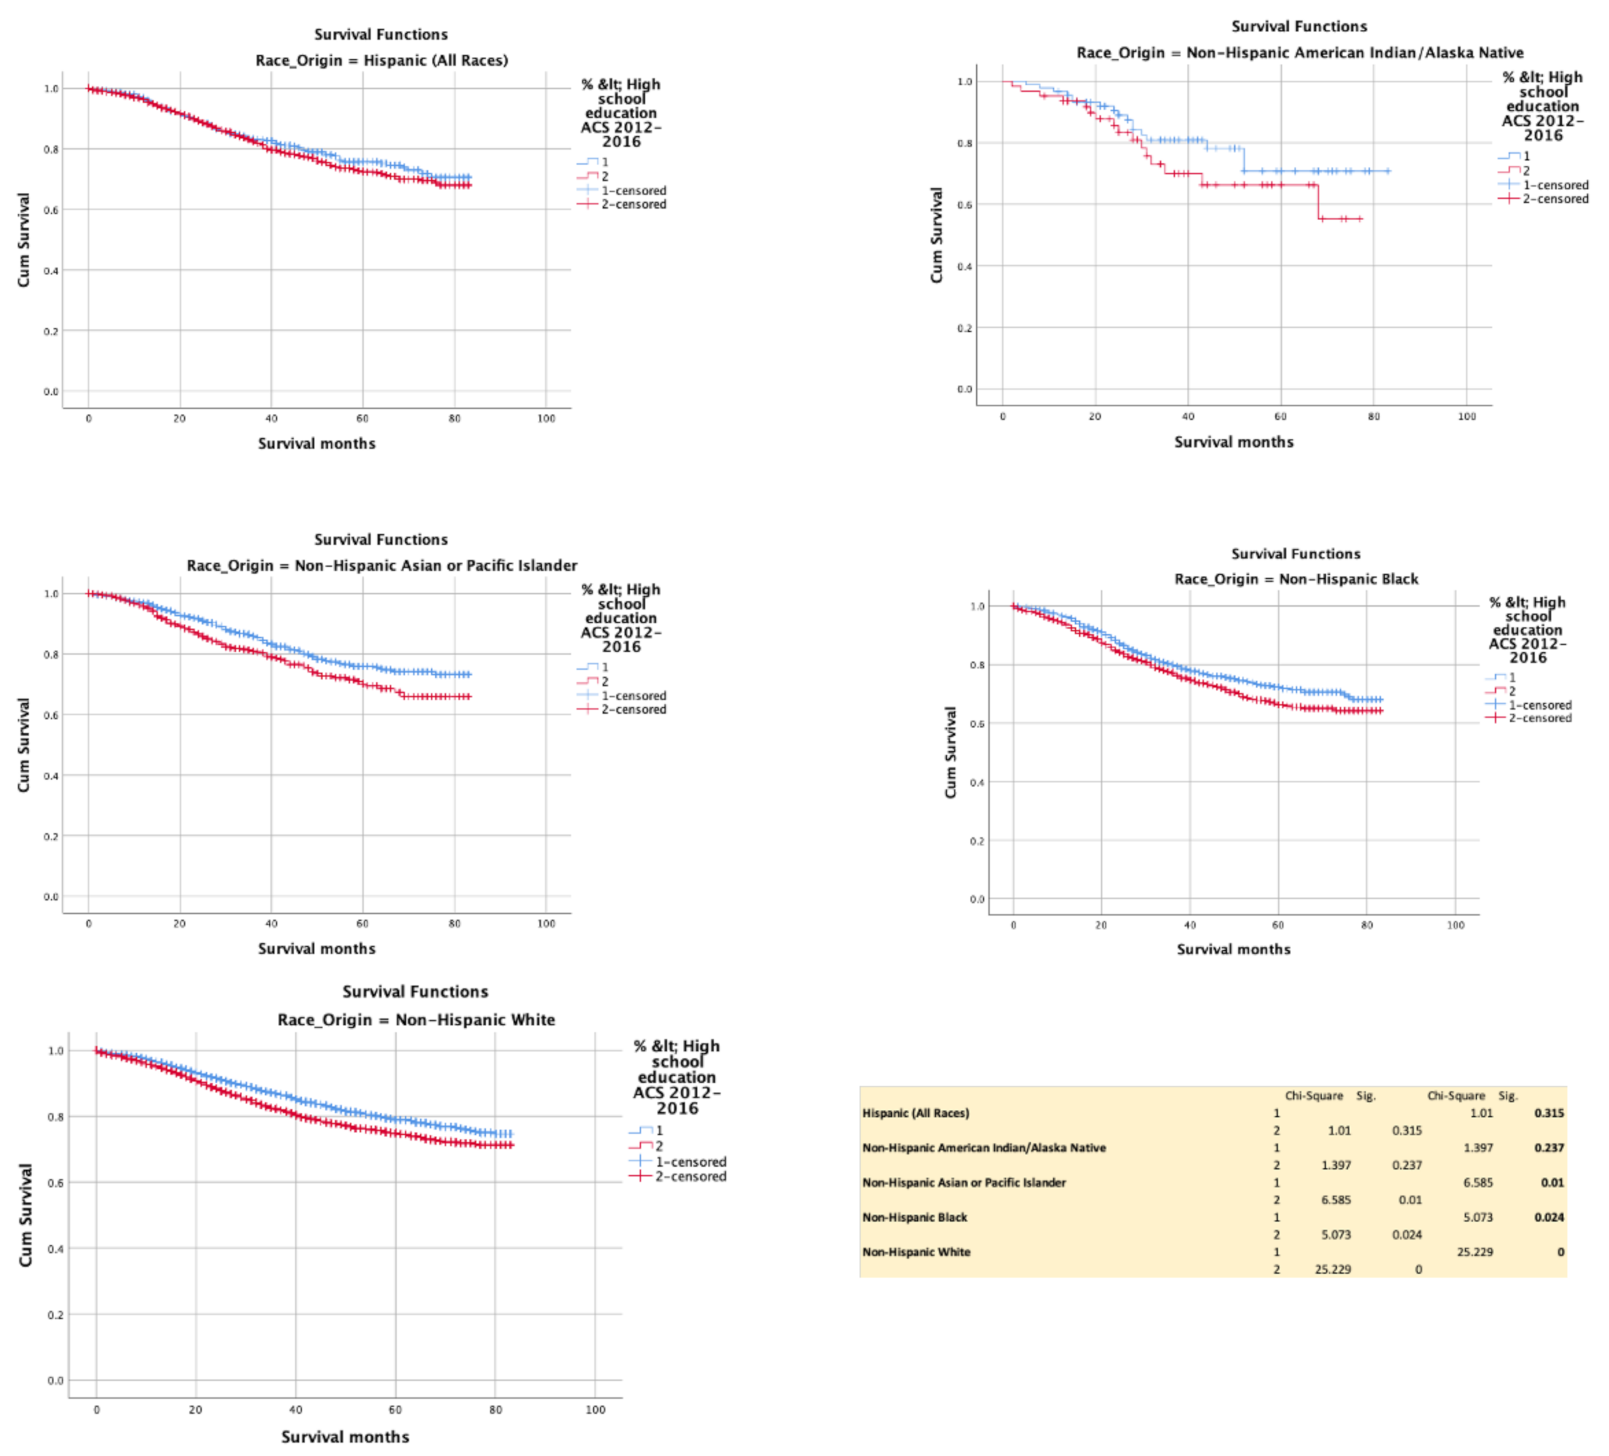
3.1. Completion of High School Education (above vs. below 50th Centile)

Completion of high school education was associated with improved cancer-specific survival significantly with NHAPI (p = 0.010), NHB (p = 0.024), and NHW (p < 0.0001). The effect size of improved HR was 0.795 (0.738–0.857). However, no difference was noted with H (p = 0.315) and NHAIAN (p = 0.237) (Figure 3).

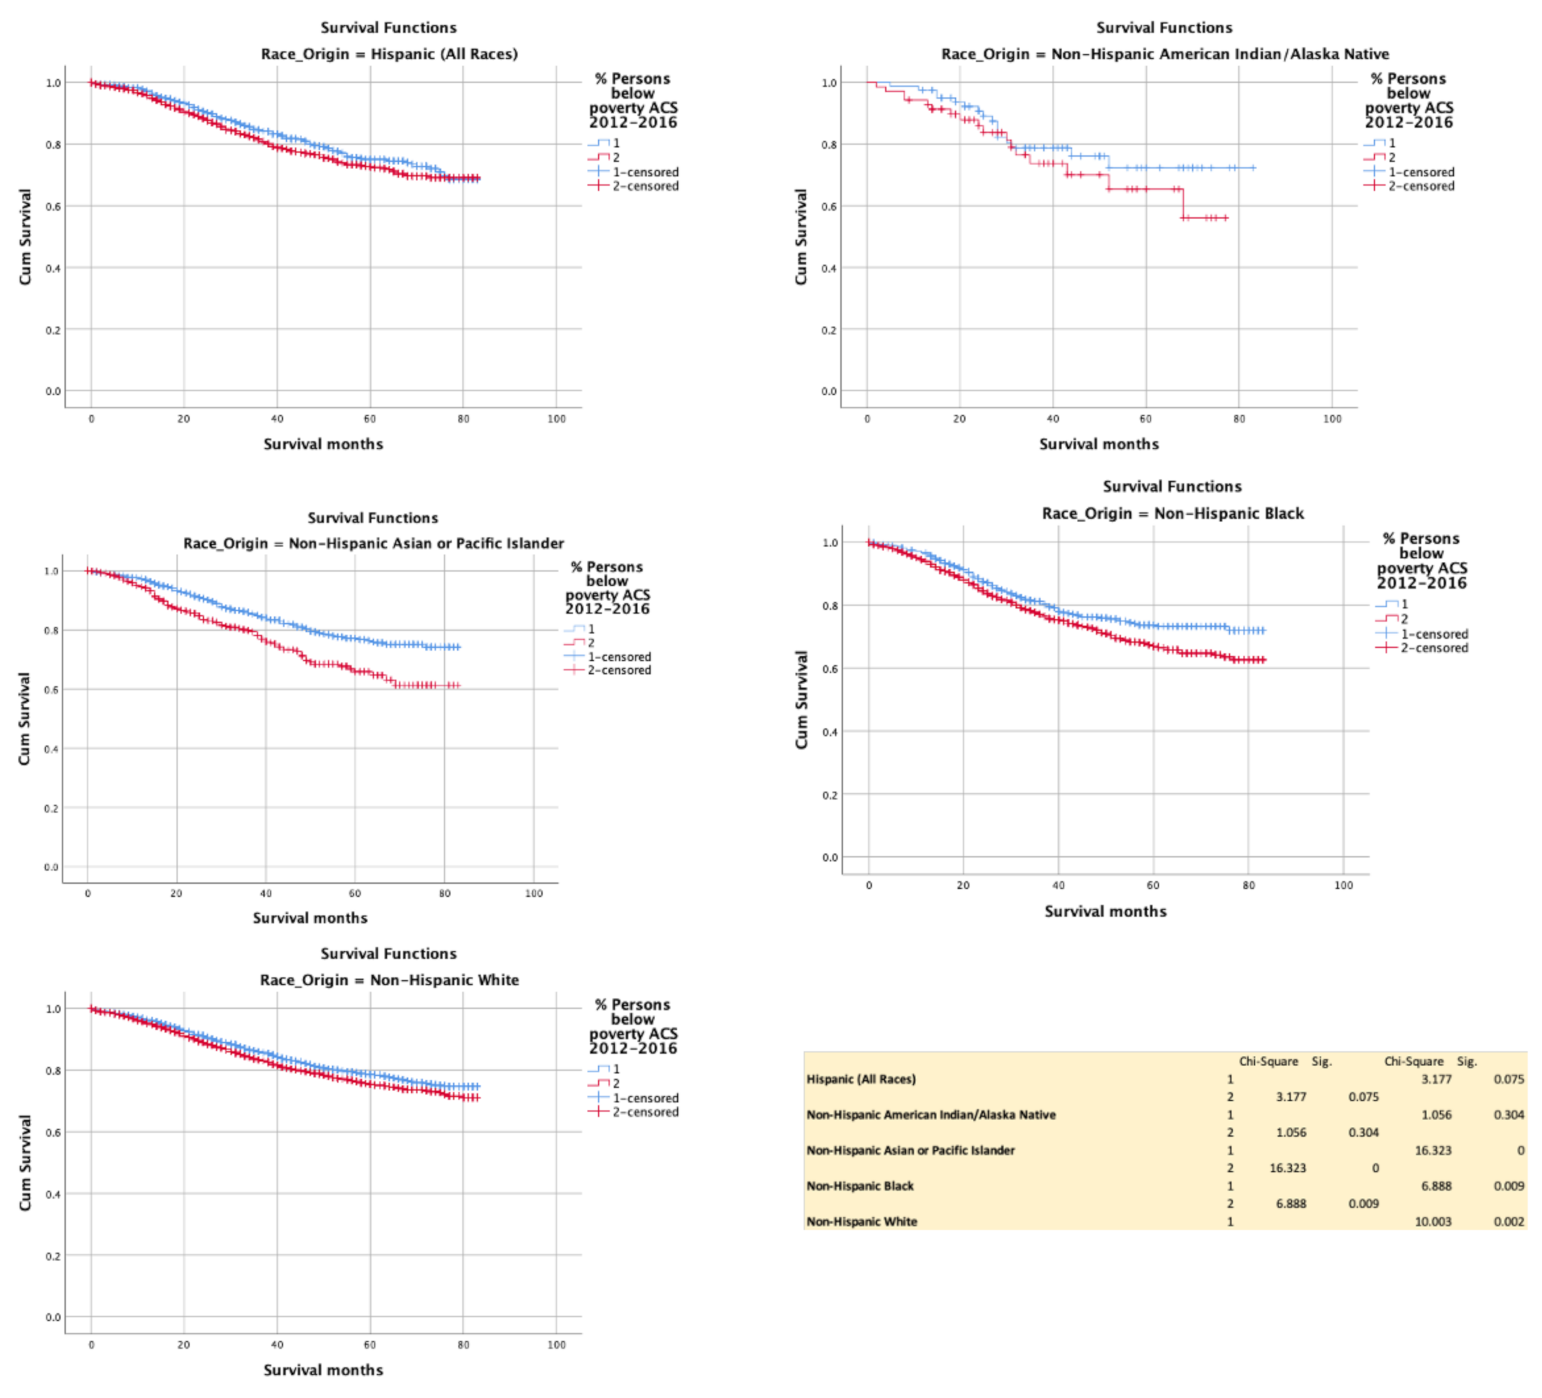
3.2. Poverty (above vs. below 50th Centile)

Poverty adversely impacted cancer specific survival in NHB (p = 0.009), NHW (p = 0.315) and NHAPI (p = 0.002). The effect size of improved HR was 0.811 (0.753–0.875). However, no difference was noted with H (p = 0.075) and NHAIAN (p = 0.304) (Figure 4).

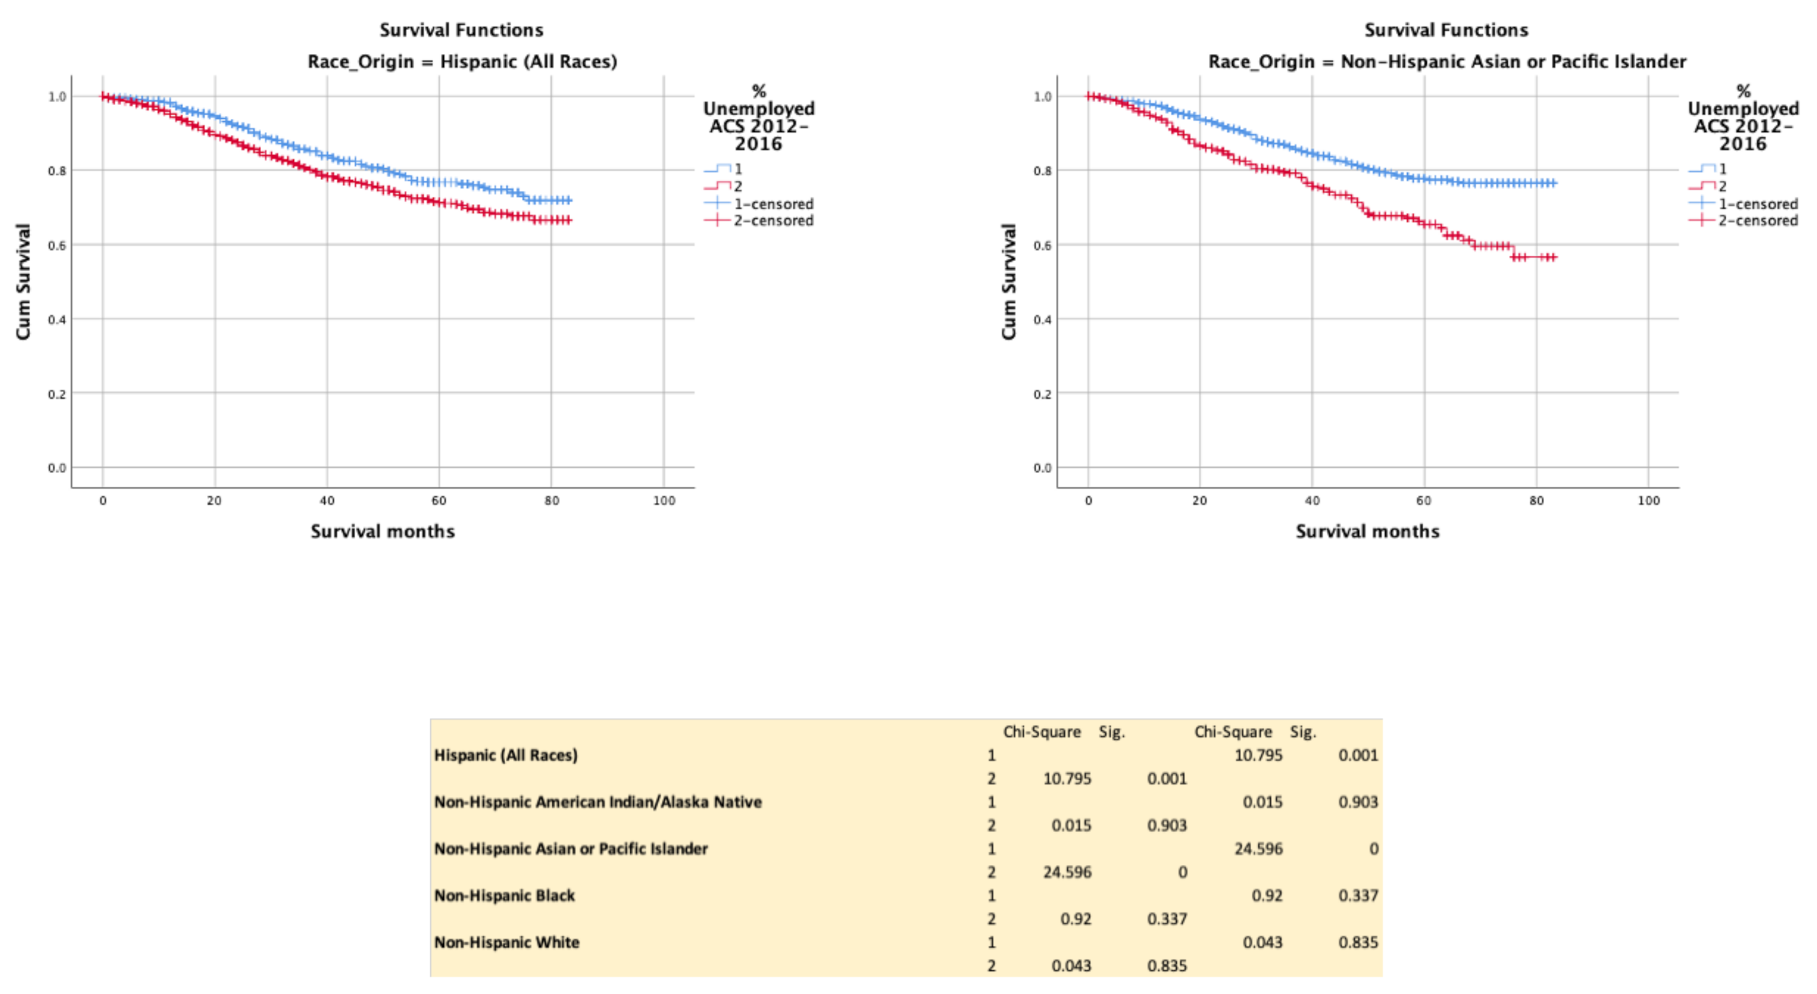
3.3. Employment Status (above vs. below 50th Centile)

Unemployment negatively influenced survival in H (p = 0.001) and NHAPI (p < 0.0001), but not with NHAIN (p = 0.903), NHB (p = 0.337) or NHW (p = 0.835) (Figure 5).

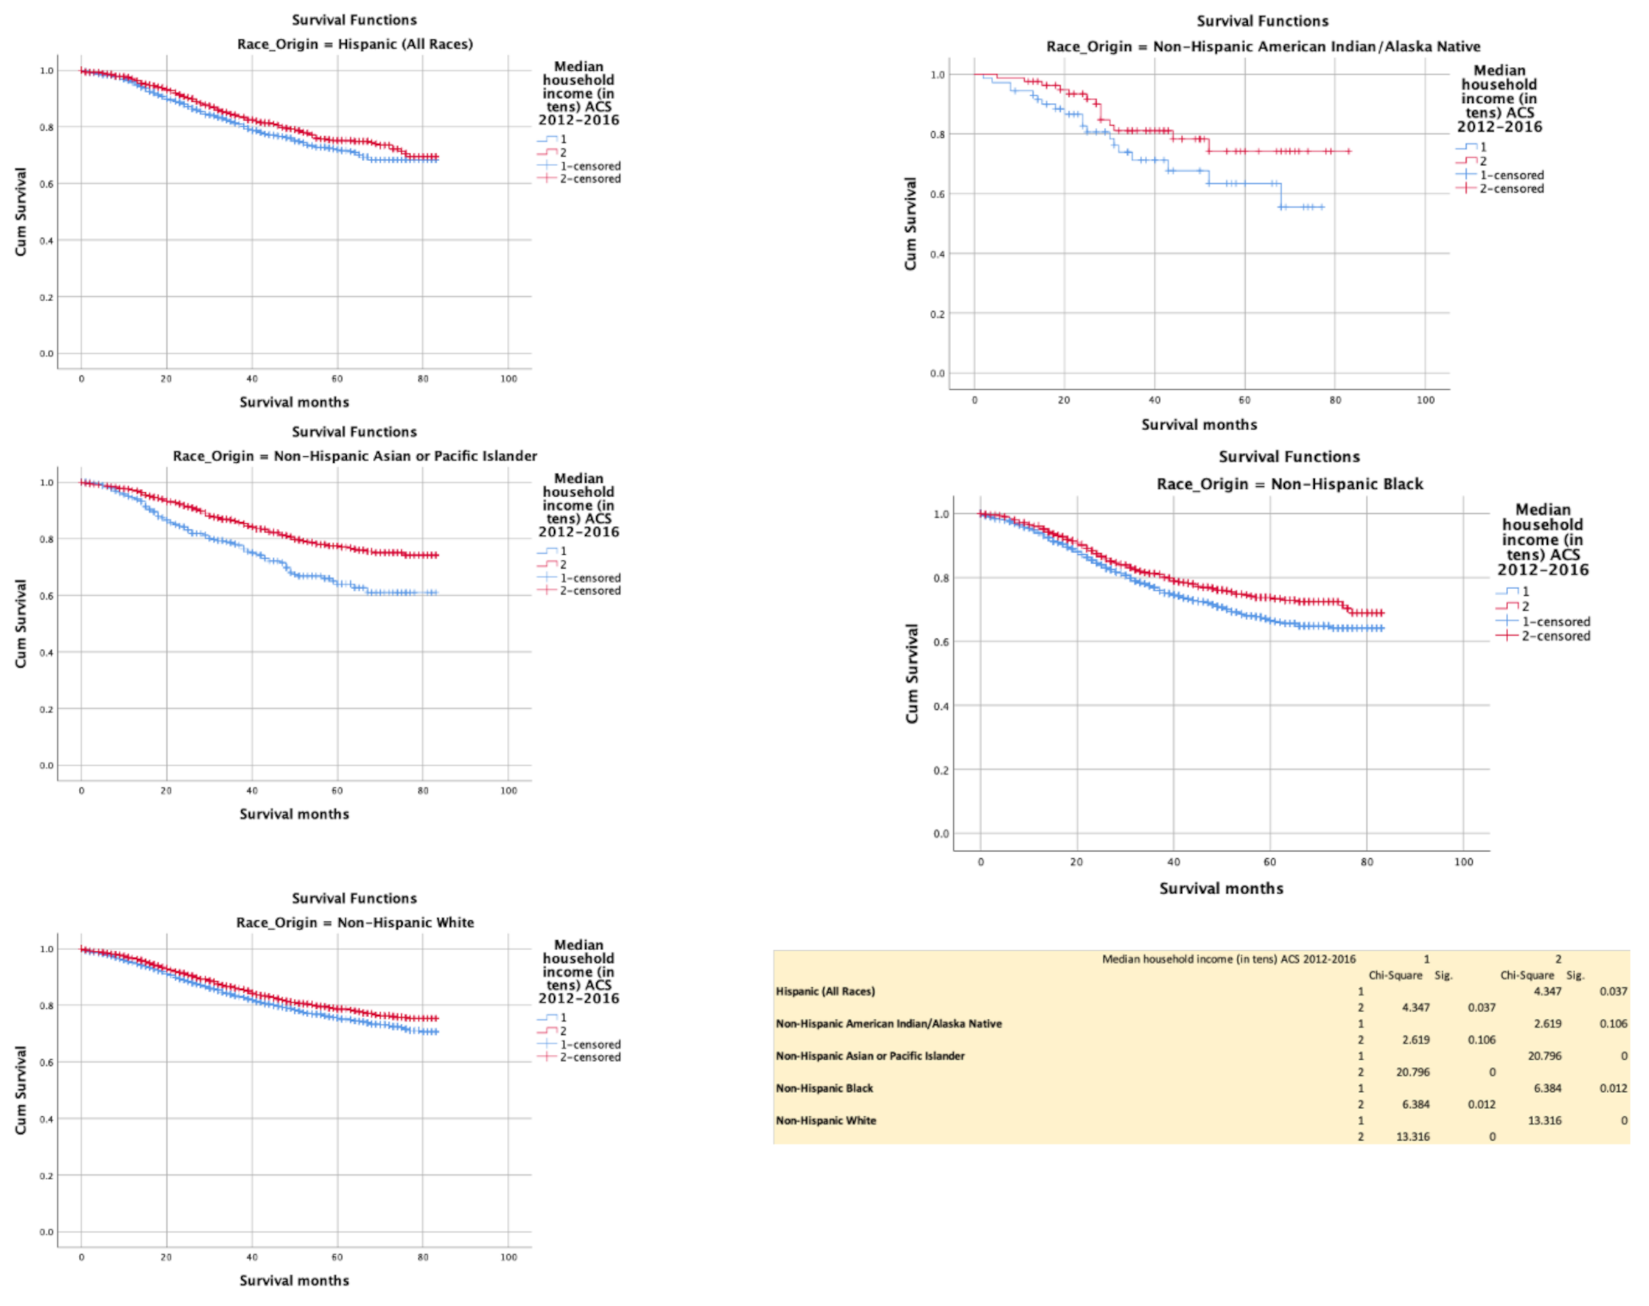
3.4. Household Income with Reference to the Median (above vs. below 50th Centile

Household income below median negatively impacted survival among NHAPI (p < 0.0001), NHB (p = 0.012), NHW (p < 0.0001), but not NHAIN (p = 0.106)) (Figure 6).

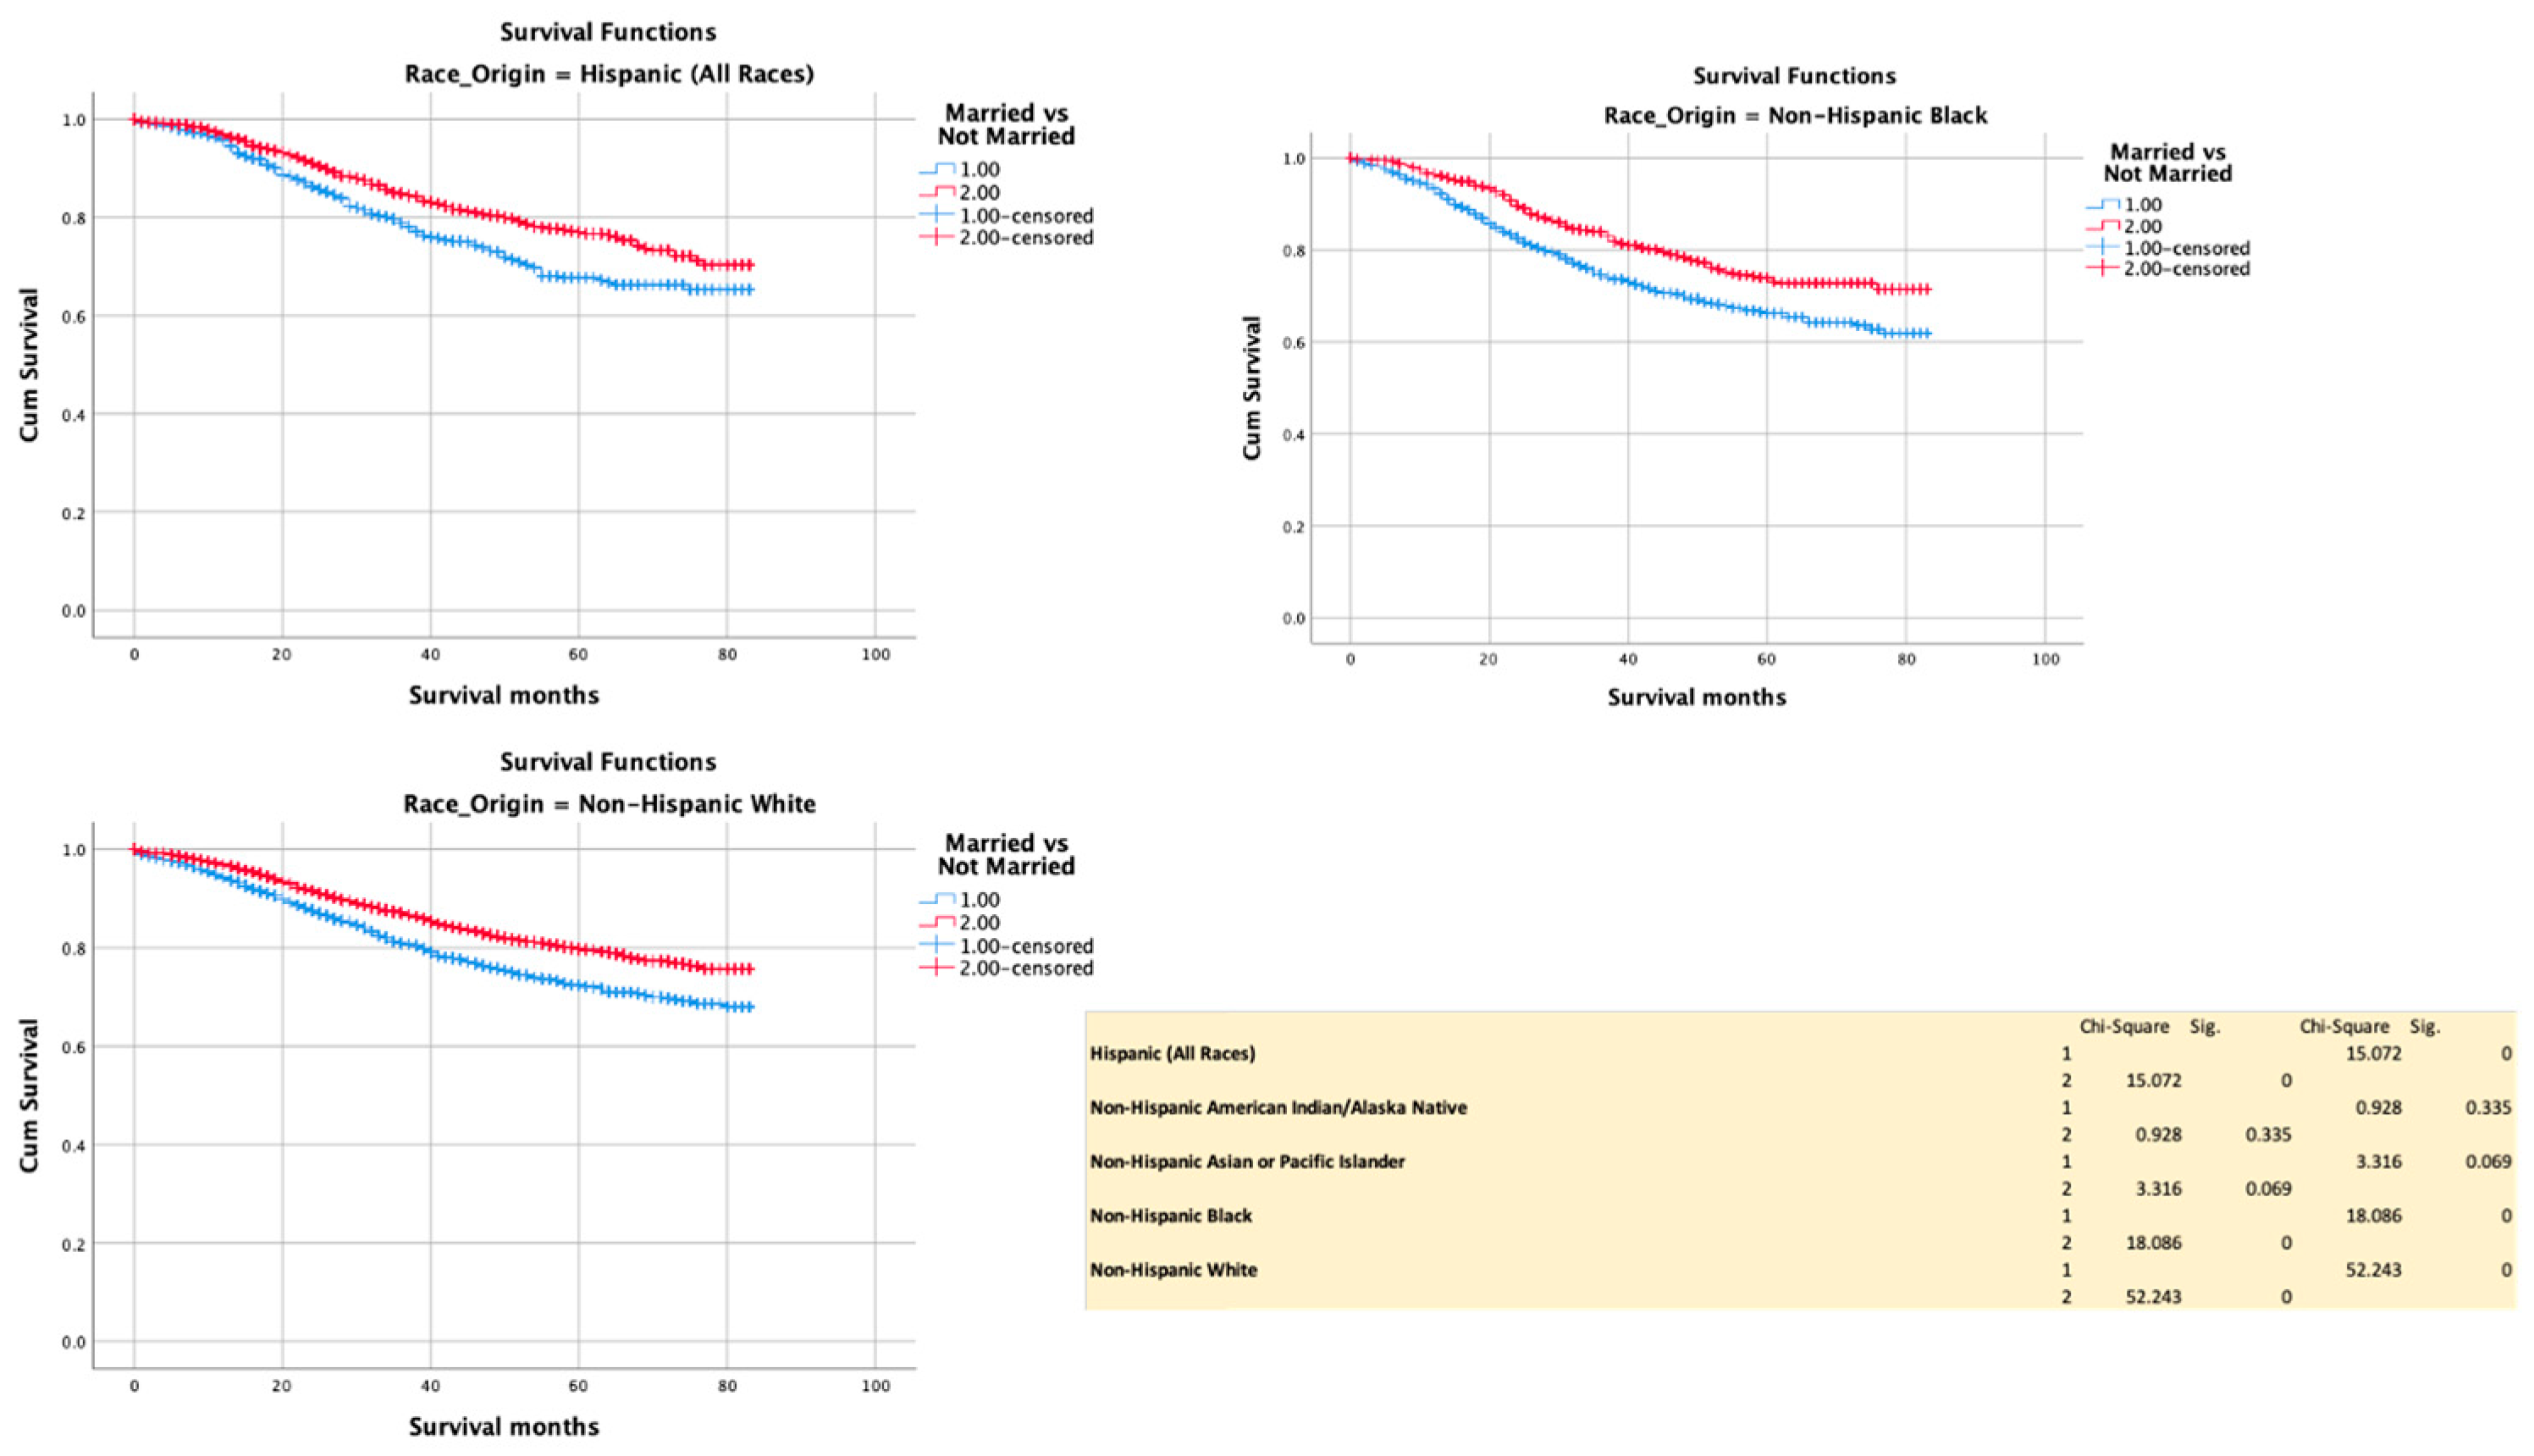
3.5. Marital (Married) Status (above vs. below 50th Centile)

Being married conferred a survival advantage in H (p < 0.0001), NHB (p = < 0.0001) and NHW (p = 0.0001) but not in NHAIN (p = 0.335) or NHAPI (p = 0.069) (Figure 7).

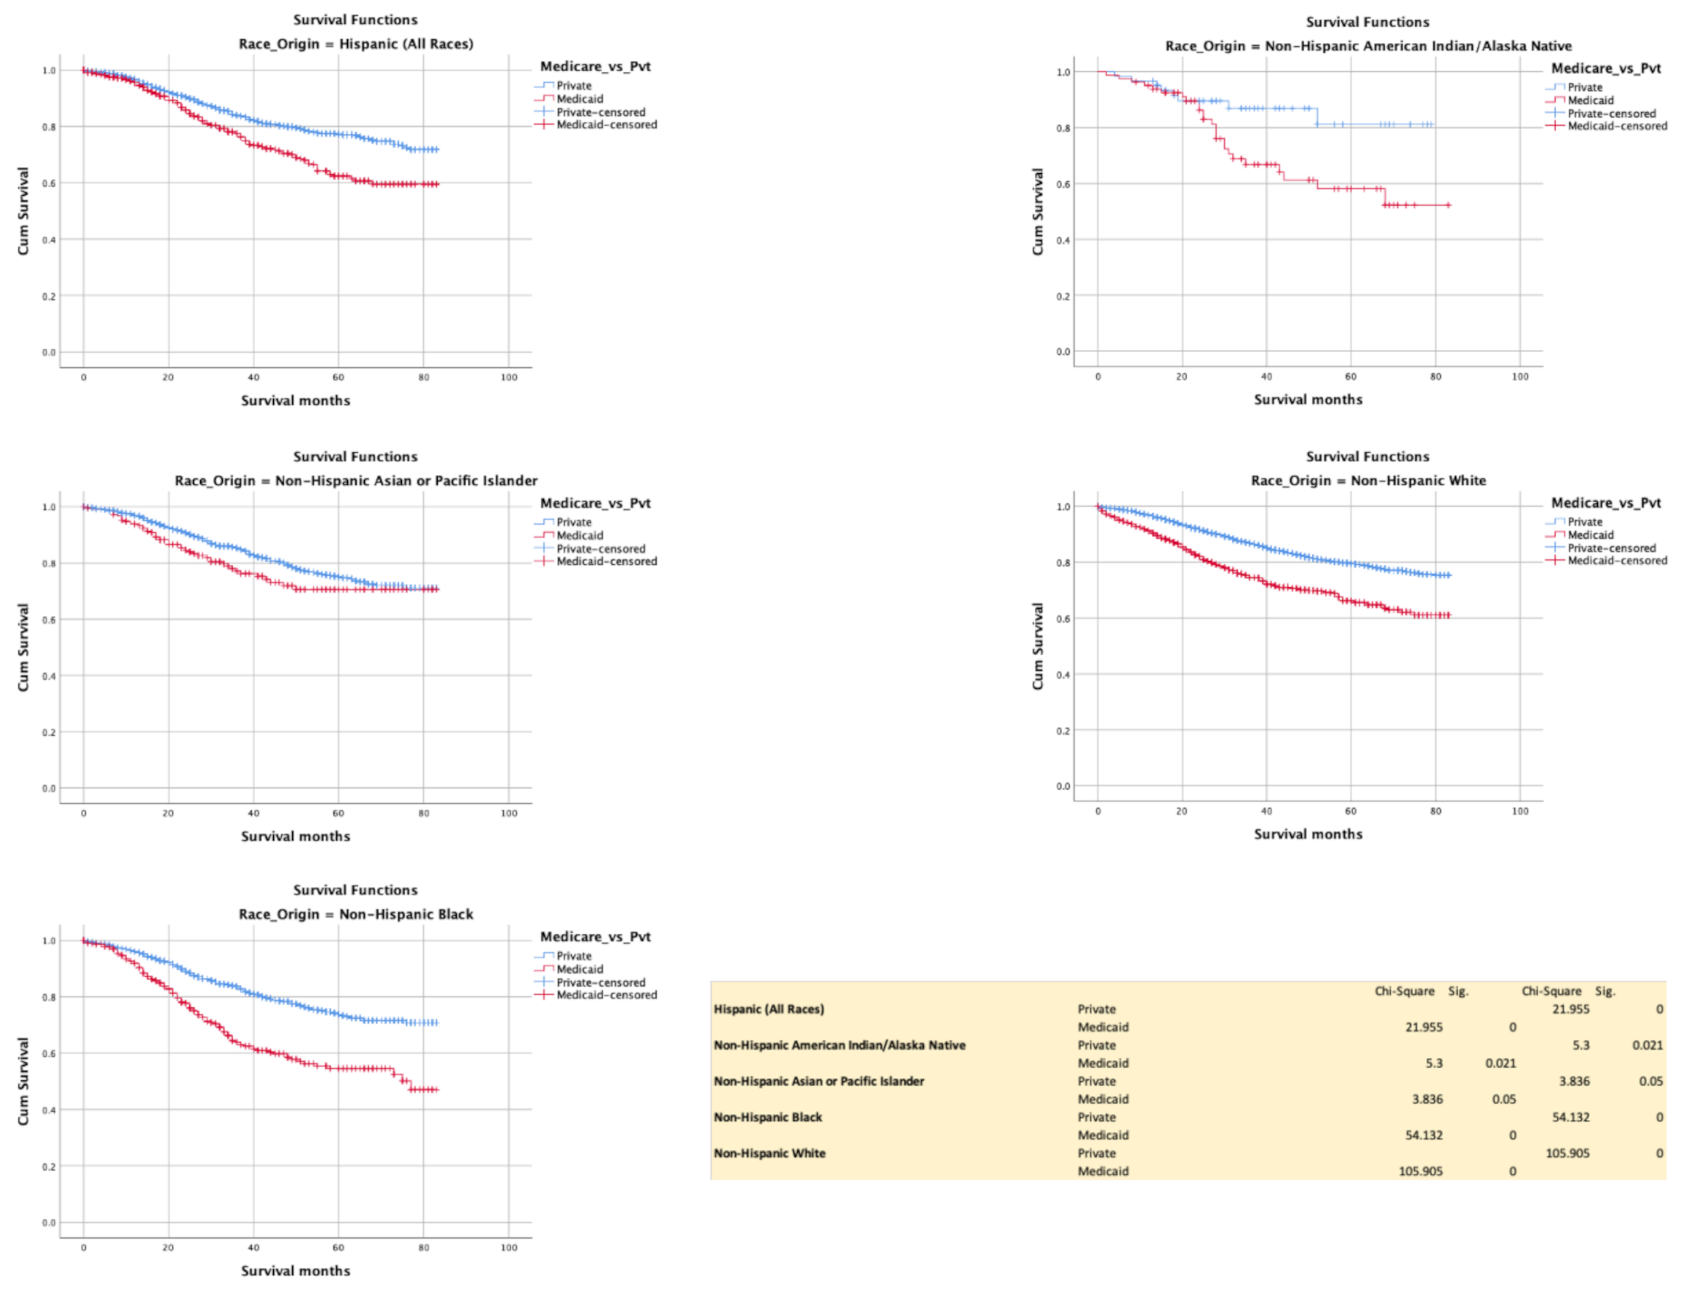
3.6. Insurance (Commercial vs. Medicaid)

Commercially insured patients had better survival compared with Medicaid in all races, H (p = < 0.0001), NHB (p < 0.0001), NHW (p < 0.0001), NHAIN (p = 0.021), and NHAPI (p = 0.05) (Figure 8).

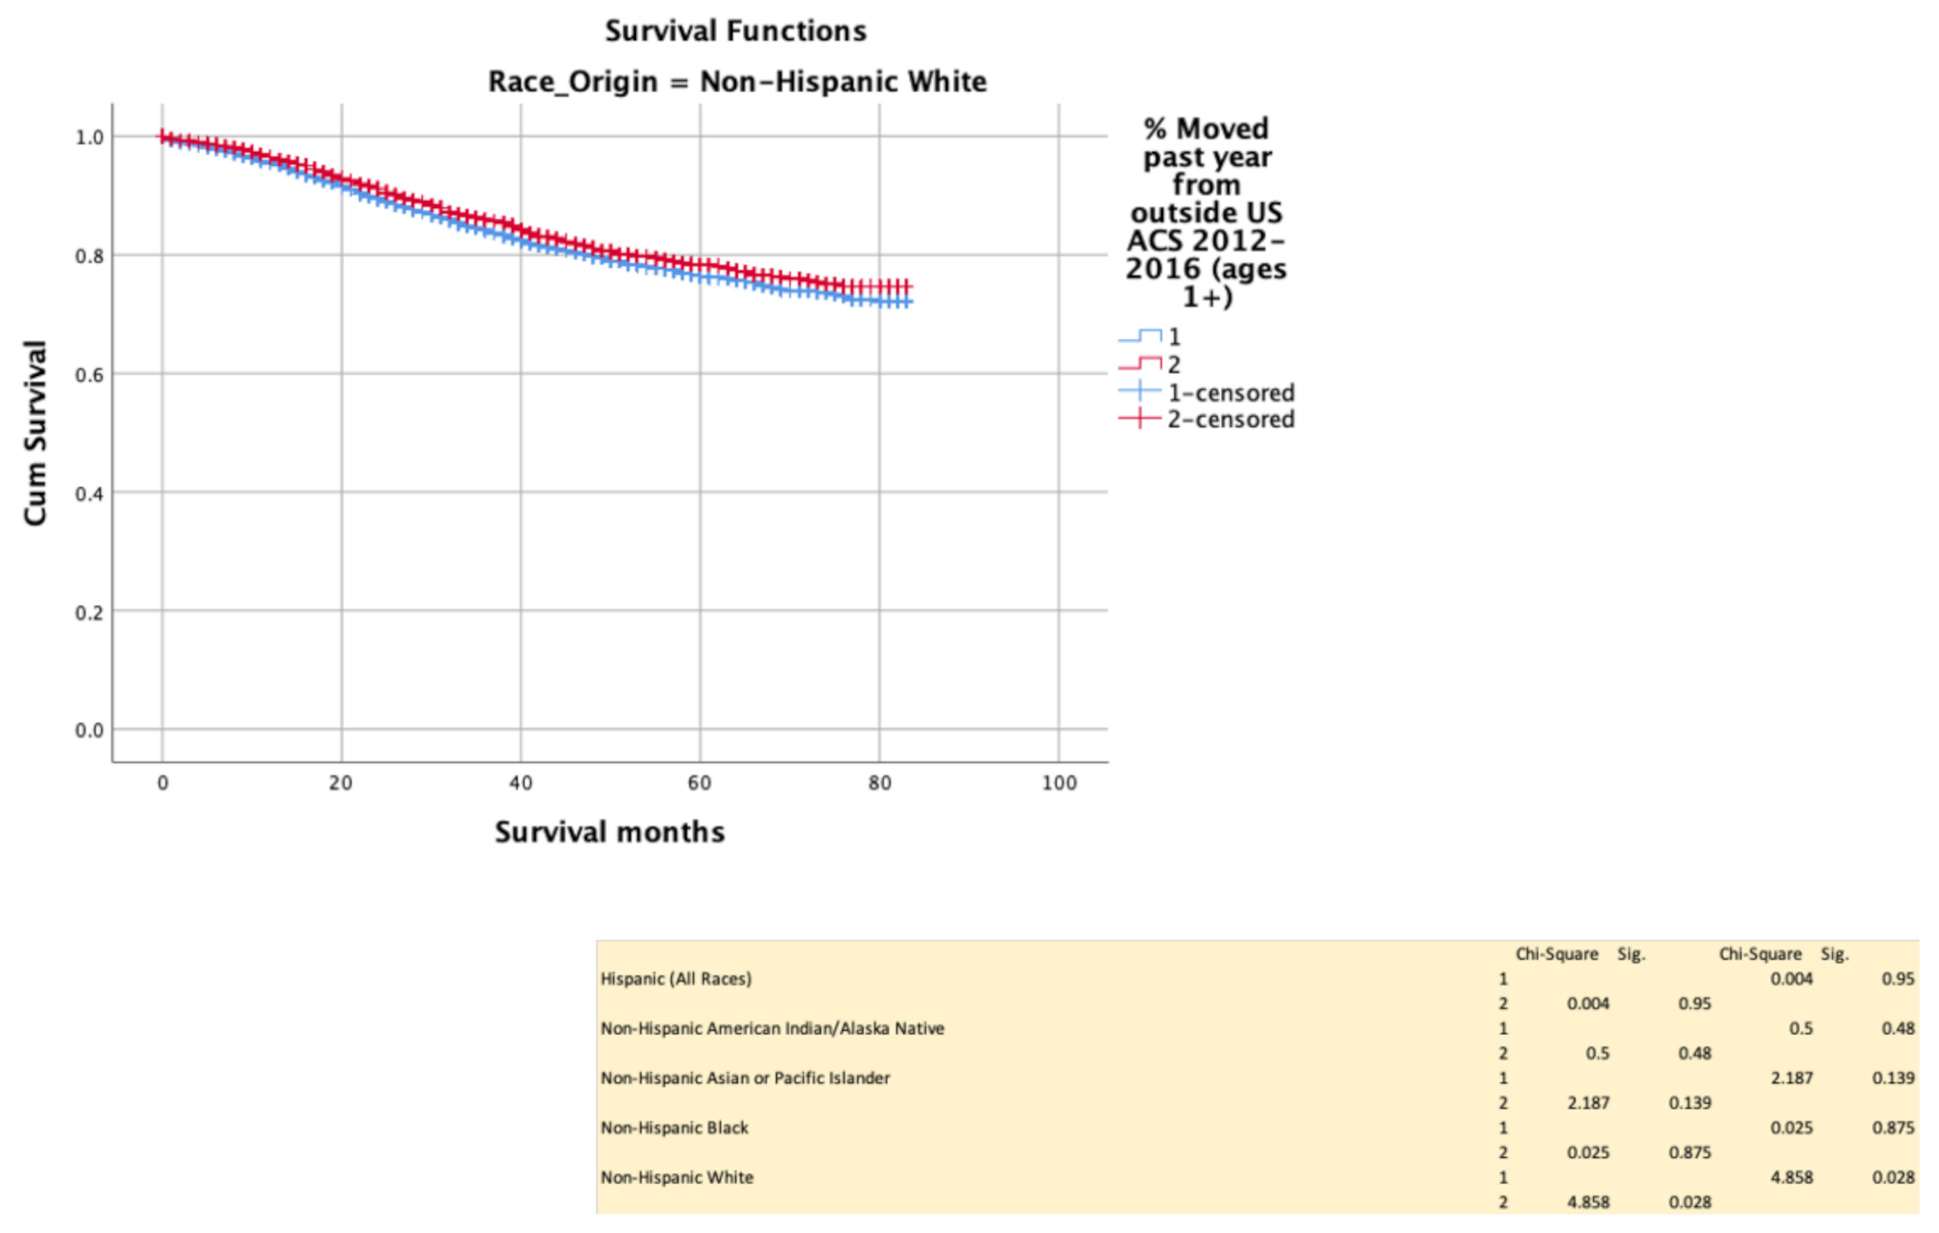
3.7. Recent Immigration to the U.S. (above vs. below 50th Centile)

Recent immigrant status conferred a survival disadvantage among NHW (p = 0.028), but not in other ethnic groups (Figure 9).
Overall Univariate and Multivariate model of survival controlling for SEDH interactions.
A result of the univariate and multivariate analyses performed is outlined in Table 3. Based on univariate analysis, each of the SEDH variables had a significant impact on the survival outcome. However, when all these factors were modeled in the multivariate analysis, the following factors were independent predictors of superior survival: poverty status, completion of high school education (HR 0.88, 95% CI 0.79–0.97), private insurance (HR 0.60, 95% CI 0.54–0.66), and married marital status (HR 1.31, 95% CI 1.20–1.42).

4. Discussion

Our analysis of outcomes for 17,145 individuals with YoCRC identified significantly worse 5-year survival for NHB among all races. The SEDH factors that predicted decreased survival include lower income levels, a lack of high school education, Medicare insurance, and unmarried status. Our analysis of the data obtained from the SEER cancer registries is unique, as we have for the first time focused and incorporated most of the socioeconomic determinants of health in determining cancer survival in YoCRC.
One of the key findings in our study of YoCRC patients is that the NHB race had worse 5-year survival rates when compared with other races. Based on previous studies, the reasons for these lower survival rates could be related to the lower rate of CRC screening, lower socioeconomic status, and less access to high caliber cancer treatment modalities, which could all result in missed lesions, late diagnosis, delay in the staging of the disease [21]. Previous studies on racial disparity in the survival of CRC, including YoCRC, have demonstrated poorer survival outcomes for NHB when compared with NHW [9,22,23]. Better awareness and screening guidelines and strategies suggested by multiple societies have led to an increase in CRC incidence across all racial groups. At 12.7 per 100,000 persons, the NHB individuals have the highest overall incidence of YoCRC [24,25]. Studies have indicated it is less likely that the NHB population will receive a follow-up colonoscopy, or even a high-quality colonoscopy, contributing to worse outcomes when compared with other ethnicities [26,27].
In our study, the household income below the median had a negative impact on the survival among NHAPI, NHB, and NHW, but not in NHAIN. In addition, our data indicated that the YoCRC patients in the poverty category had adversely affected the survival in NHB, NHAPI, and NHW, but not in H and NHAIAN. As per the 2018 U.S. census bureau, the median USA annual family income was higher in NHW (USD 70,642) when compared with NHB (USD 41,361). Household income in larger families may contribute to reduced affordability to seek access to health care and accompanying costs. As per the 2018 U.S. Census Bureau, an estimated 21% of NHB and 8% of NHW live under the poverty line [28]. It was demonstrated that employment and lower socioeconomic status positively correlate with exposure to CRC risk factors [29]. Lack of financial resources is a major barrier to CRC screening in adults over 50 years [30]. However, the average risk of YoCRC is currently not within screening guidelines, except for high-risk features, such as a strong family history or long-standing inflammatory bowel disease. It is quite possible that lack of affordability may be a significant factor in the underutilization of specialist gastroenterology services or other specialist cancer services within this population. Another possible reason could be that patients with low socio-economic status have poorly balanced diet, uncontrolled diabetes, and are at high risk of alcoholism and tobacco abuse, which are associated with inflammation and could be a trigger for abnormal immune response and CRC. Unfortunately SEER does not provide patient-specific information about these data. A SEER registry study by Scally et al. showed all CRC in adults over 18 years of age, spatial social polarization, quantified in relation to racialized economic segregation, increases the odds of late diagnosis of colorectal cancer for persons residing in the least compared with most privileged counties [31].
Married patients may have potentially greater financial resources and social support, especially if the spouse is employed, and are believed to have better CRC survival when compared with single or divorced patients. In our study, being married conferred a survival advantage in H, NHB, and NHW but not in NHAIN or NHAPI. In a comparative study from the SEER database, Wang et al. demonstrated marriage to be associated with lower mortality for married patients in the patients diagnosed with CRC after adjusting for age, race, cancer stage, and surgery [32]. In that study, married individuals were more likely to have an early stage of CRC diagnosis and therefore more likely to engage in CRC treatment when compared with single or divorced patients. In the CRC survivorship care guidelines issued by the American Cancer Society, there has been an increased emphasis on social support [33]. This is essentially required to help facilitate care decisions and accompany patients to appointments, chemotherapy, or hospital stay and for emotional and psychological support.
Our analysis revealed recent immigrant status to confer a survival disadvantage only amongst NHW, but not in other ethnic groups. As per the National Health Interview Survey from 2018, CRC screening was low amongst individuals with lesser than high school education (at 52%), uninsured (at 30%), and recent immigrants (<10 years, at 26%) [34]. For YoCRC adenocarcinomas, we report a better survival advantage with patients covered by private insurance over Medicaid. Myerson et al. demonstrated that universal affordability to health care over 65 years of age has a favorable impact on cancer detection and survival outcomes compared with no insurance [35]. A study from the national cancer database concluded that universal insurance coverage accounted for a 47% relative decrease in survival disparity in NHB compared with NHW with CRC [35,36]. However, no previous study has looked at health insurance and survival outcomes in YoCRC in the U.S. A study from Thailand by Surachai et al. showed that universal health coverage was associated with poor survival in colorectal cancer [37]. Similarly, we also note a survival advantage among patients with private insurance in the U.S., possibly related to better access to high-quality treatment centers and specialists when compared with Medicaid. This may perhaps indicate better access to state-of-the-art, cutting-edge treatments to those who have private insurances compared with Medicaid.
Despite a declining trend of overall CRC incidence and mortality in the U.S., NHB patients continue to experience a higher CRC mortality burden than NHW patients [38,39]. Mental-health risk and sociodemographic factors may also serve as barriers to CRC symptom screening among homeless black and white individuals, reflective of primary care underutilization [40].
In contrast to CRC over 50 years, YoCRC has not been traditionally detected through screening modalities but through symptomatic presentation to primary care, emergency rooms, or specialist services. Wu et al. demonstrated worse overall survival for YoCRC patients for NHB patients compared with NHW patients [22]. In our study, we also show cancer-specific survival being poor for NHB compared with NHWs. We hypothesize that the racial disparities in survival observed in our study are unlikely to be the effect of screening disparity but instead on prompt symptom recognition and utilization of health care. Hence, socioeconomic determinants such as health awareness, health literacy, affordability based on health insurance, immigration status and marital status, access to and utilization of health care services may heavily influence survival in YoCRC.
Our study has a few limitations. SEER cancer registry data do not include detailed information about chemotherapy regimens, the number of cycles, or radiotherapy treatments, making it impossible to determine which subjects received adjuvants chemotherapy or radiation therapy. Incomplete and underreported data in SEER is also a limitation; however, we excluded entries with incomplete data. Moreover, the SEER insurance variable does not subdivide those with private insurance (managed care, health maintenance organization, or preferred provider organization), and the differences between these subsets could not be analyzed. SEER registries also lack data on age or ethnicity matched controls, co-morbidities, environmental history, family history, tumor genotype (microsatellite instability), which are linked with treatment and outcomes for YoCRC. Despite these limitations, our study has important implications for resource allocation for eliminating barriers determining unfavorable outcomes for YoCRC. We also analyzed the socioeconomic status for different age groups and there was no statistically significant difference for all age ranges between those patients either above or below the 50th centile for poverty, clarifying the lack of relationship between age and socioeconomic status. A robust program of equal access to high-quality, well-coordinated cancer care, greater social support, and comprehensive interventions is required but may not be sufficient unless specific socioeconomic barriers that are unique to each group are effectively overcome to improve cancer-specific survival disparities between different racial groups and within each racial group based on socioeconomic determinant risk stratification.
An important and proven cost-effective interventional strategy would be to deploy a patient navigation program which refers to support and guidance offered to patients who come into contact with the health system with a presumptive diagnosis of cancer, either through screening or symptoms to ensure timely coordination and access to complex cancer therapies and to identify and remove socioeconomic barriers to care [41]. Patient navigation was originally conceived to address health disparities and patients’ risk for delays and loss to follow-up care among racial and ethnic minority and lower-income populations [42]. Such navigational interventions have been perceived by several groups of socially and economically disadvantaged individuals as beneficial and satisfactory, leading to better adherence to cancer treatments [41].
We anticipate our study will generate widespread interest among multidisciplinary teams to risk-stratify patients and facilitate efforts to address barriers in SEDH to achieve favorable cancer-specific survival outcomes.

5. Conclusions

This study showed the effects of SEDH, such as higher income levels, high school education, private insurance, and married marital status, have favorable survival in YoCRC patients. Some of these SEDH are also directly and indirectly related to the patients’ ethnicity. Most of the positive social factors are often interrelated. The presence of these factors should ultimately result in timely diagnosis and better CRC survival prognosis. CRC awareness, knowledge, and even utilization of medical services would differ with the education and health literacy. Further studies are recommended to assess the impact on cancer survival in YoCRC with specific targeted interventions to remove socioeconomic barriers among YoCRC patients.

Author Contributions

Conceptualization, M.M.A. and H.G.; methodology, M.M.A.; software, M.M.A.; validation, M.M.A. and N.J.S.; formal analysis, M.M.A.; writing—original draft preparation, M.M.A., H.G. and M.G.; writing—review and editing, K.P., N.J., A.P. and B.T.; supervision, H.G. All authors have read and agreed to the published version of the manuscript.

Funding

This research received no external funding.

Institutional Review Board Statement

The study was approved as an exemption by the Institutional Review Board of The Wright Center for Graduate Medical Education (Study 16987771-S) and was classified as non-direct human subject research.

Informed Consent Statement

The data accrued was anonymized at source by NCI, therefore no consent was deemed necessary.

Data Availability Statement

American Community Survey datasets were accessed https://www.census.gov/data/developers/data-sets/acs-5year.2012.html (accessed on 3 March 2021).

Conflicts of Interest

The authors declare no conflict of interest.

References

  1. American Cancer Society. Colorectal Cancer Facts & Figures 2020–2022. Atlanta; American Cancer Society: Atlanta, GA, USA, 2020. [Google Scholar]
  2. Surveillance, Epidemiology, and End Results (SEER) Program Cancer Statistics Review 1975–2017. Available online: www.seer.cancer.gov (accessed on 3 March 2021).
  3. Murphy, C.C.; Sandler, R.S.; Sanoff, H.K.; Yang, Y.C.; Lund, J.L.; Baron, J.A. Decrease in incidence of colorectal cancer among individuals 50 years or older after recommendations for population-based screening. Clin. Gastroenterol. Hepatol. 2017, 15, 903–909.e906. [Google Scholar] [CrossRef] [PubMed] [Green Version]
  4. Goyal, H.; Desai, R.; Aloysius, M.M.; Jecmenica, M.; Enders, G.H.; Bansal, P. Young-onset colorectal cancer: Thospitalization trends and gender disparities in the United States 2010–2014. Int. J. Colorectal. Dis. 2019, 34, 1611–1615. [Google Scholar] [CrossRef] [PubMed]
  5. Siegel, R.L.; Jemal, A.; Ward, E.M. Increase in incidence of colorectal cancer among young men and women in the United States. Cancer Epidemiol. Prev. Biomark. 2009, 18, 1695–1698. [Google Scholar] [CrossRef] [PubMed] [Green Version]
  6. Bailey, C.E.; Hu, C.Y.; You, Y.N.; Bednarski, B.K.; Rodriguez-Bigas, M.A.; Skibber, J.M.; Cantor, S.B.; Chang, G.J. Increasing disparities in the age-related incidences of colon and rectal cancers in the United States, 1975–2010. JAMA Surg. 2015, 150, 17–22. [Google Scholar] [CrossRef] [PubMed]
  7. Siegel, R.L.; Torre, L.A.; Soerjomataram, I.; Hayes, R.B.; Bray, F.; Weber, T.K.; Jemal, A. Global patterns and trends in colorectal cancer incidence in young adults. Gut 2019, 68, 2179–2185. [Google Scholar] [CrossRef] [Green Version]
  8. Ellis, L.; Canchola, A.J.; Spiegel, D.; Ladabaum, U.; Haile, R.; Gomez, S.L. Racial and Ethnic Disparities in Cancer Survival: The Contribution of Tumor, Sociodemographic, Institutional, and Neighborhood Characteristics. J. Clin. Oncol. 2018, 36, 25–33. [Google Scholar] [CrossRef]
  9. Holowatyj, A.N.; Ruterbusch, J.J.; Rozek, L.S.; Cote, M.L.; Stoffel, E.M. Racial/Ethnic Disparities in Survival Among Patients With Young-Onset Colorectal Cancer. J. Clin. Oncol. 2016, 34, 2148–2156. [Google Scholar] [CrossRef]
  10. Warren Andersen, S.; Blot, W.J.; Lipworth, L.; Steinwandel, M.; Murff, H.J.; Zheng, W. Association of Race and Socioeconomic Status With Colorectal Cancer Screening, Colorectal Cancer Risk, and Mortality in Southern US Adults. JAMA Netw. Open. 2019, 2, e1917995. [Google Scholar] [CrossRef]
  11. Saldana-Ruiz, N.; Clouston, S.A.; Rubin, M.S.; Colen, C.G.; Link, B.G. Fundamental causes of colorectal cancer mortality in the United States: Understanding the importance of socioeconomic status in creating inequality in mortality. Am. J. Public Health 2013, 103, 99–104. [Google Scholar] [CrossRef]
  12. Provenzale, D.; Ness, R.M.; Llor, X.; Weiss, J.M.; Abbadessa, B.; Cooper, G.; Early, D.S.; Friedman, M.; Giardiello, F.M.; Glaser, K.; et al. NCCN Guidelines Insights: Colorectal Cancer Screening, Version 2.2020. J. Natl. Compr. Canc. Netw. 2020, 18, 1312–1320. [Google Scholar] [CrossRef]
  13. Mannucci, A.; Zuppardo, R.A.; Rosati, R.; Leo, M.D.; Perea, J.; Cavestro, G.M. Colorectal cancer screening from 45 years of age: Thesis, antithesis and synthesis. World J. Gastroenterol. 2019, 25, 2565–2580. [Google Scholar] [CrossRef]
  14. Marcella, S.; Miller, J.E. Racial differences in colorectal cancer mortality. The importance of stage and socioeconomic status. J. Clin. Epidemiol. 2001, 54, 359–366. [Google Scholar] [CrossRef]
  15. Le, H.; Ziogas, A.; Lipkin, S.M.; Zell, J.A. Effects of socioeconomic status and treatment disparities in colorectal cancer survival. Cancer Epidemiol. Biomark. Prev. 2008, 17, 1950–1962. [Google Scholar] [CrossRef] [Green Version]
  16. Patel, K.; Hargreaves, M.; Liu, J.; Kenerson, D.; Neal, R.; Takizala, Z.; Beard, K.; Pinkerton, H.; Burress, M.; Blot, B. Factors influencing colorectal cancer screening in low-income African Americans in Tennessee. J. Community Health 2012, 37, 673–679. [Google Scholar] [CrossRef]
  17. Patel, A.; Gantz, O.; Zagadailov, P.; Merchant, A.M. The role of socioeconomic disparity in colorectal cancer stage at presentation. Updates Surg. 2019, 71, 523–531. [Google Scholar] [CrossRef]
  18. Hayat, M.J.; Howlader, N.; Reichman, M.E.; Edwards, B.K. Cancer statistics, trends, and multiple primary cancer analyses from the Surveillance, Epidemiology, and End Results (SEER) Program. Oncologist 2007, 12, 20–37. [Google Scholar] [CrossRef] [Green Version]
  19. National Cancer Institute: Surveillance, Epidemiology, and End Results Program. Available online: http://www.seer.cancer.gov (accessed on 3 March 2021).
  20. American Community Survey (ACS). Available online: https://www.census.gov/programs-surveys/acs. (accessed on 13 February 2021).
  21. Soneji, S.; Iyer, S.S.; Armstrong, K.; Asch, D.A. Racial disparities in stage-specific colorectal cancer mortality: 1960–2005. Am. J. Public Health 2010, 100, 1912–1916. [Google Scholar] [CrossRef]
  22. Wu, J.; Ye, J.; Wu, W.; Fang, D.; Wang, K.; Yang, L.; Jiang, X.; Wang, Q.; Li, L. Racial disparities in young-onset patients with colorectal, breast and testicular cancer. J. Cancer 2019, 10, 5388–5396. [Google Scholar] [CrossRef]
  23. Akinyemiju, T.; Sakhuja, S.; Waterbor, J.; Pisu, M.; Altekruse, S.F. Racial/ethnic disparities in de novo metastases sites and survival outcomes for patients with primary breast, colorectal, and prostate cancer. Cancer Med. 2018, 7, 1183–1193. [Google Scholar] [CrossRef]
  24. Murphy, C.C.; Lund, J.L.; Sandler, R.S. Young-Onset Colorectal Cancer: Earlier Diagnoses or Increasing Disease Burden? Gastroenterology 2017, 152, 1809–1812.e1803. [Google Scholar] [CrossRef] [Green Version]
  25. Siegel, R.L.; Fedewa, S.A.; Anderson, W.F.; Miller, K.D.; Ma, J.; Rosenberg, P.S.; Jemal, A. Colorectal Cancer Incidence Patterns in the United States, 1974–2013. J. Natl Cancer Inst. 2017, 109. [Google Scholar] [CrossRef] [Green Version]
  26. Fedewa, S.A.; Flanders, W.D.; Ward, K.C.; Lin, C.C.; Jemal, A.; Goding Sauer, A.; Doubeni, C.A.; Goodman, M. Racial and Ethnic Disparities in Interval Colorectal Cancer Incidence: A Population-Based Cohort Study. Ann. Intern. Med. 2017, 166, 857–866. [Google Scholar] [CrossRef]
  27. Laiyemo, A.O.; Doubeni, C.; Pinsky, P.F.; Doria-Rose, V.P.; Bresalier, R.; Lamerato, L.E.; Crawford, E.D.; Kvale, P.; Fouad, M.; Hickey, T.; et al. Race and colorectal cancer disparities: Health-care utilization vs. different cancer susceptibilities. J. Natl. Cancer Inst. 2010, 102, 538–546. [Google Scholar] [CrossRef] [Green Version]
  28. Semega, J.; Kollar, M.; Shrider, E.; Creamer, J. Income and Poverty in the United States. U.S. Census Bur. Current Popul. Rep. 2020, 60–270. [Google Scholar]
  29. Doubeni, C.A.; Major, J.M.; Laiyemo, A.O.; Schootman, M.; Zauber, A.G.; Hollenbeck, A.R.; Sinha, R.; Allison, J. Contribution of behavioral risk factors and obesity to socioeconomic differences in colorectal cancer incidence. J. Natl. Cancer Inst. 2012, 104, 1353–1362. [Google Scholar] [CrossRef] [Green Version]
  30. Perisetti, A.; Khan, H.; George, N.E.; Yendala, R.; Rafiq, A.; Blakely, S.; Rasmussen, D.; Villalpando, N.; Goyal, H. Colorectal cancer screening use among insured adults: Is out-of-pocket cost a barrier to routine screening? World J. Gastrointest Pharmacol. Ther. 2018, 9, 31–38. [Google Scholar] [CrossRef]
  31. Scally, B.J.; Krieger, N.; Chen, J.T. Racialized economic segregation and stage at diagnosis of colorectal cancer in the United States. Cancer Causes Control 2018, 29, 527–537. [Google Scholar] [CrossRef]
  32. Wang, L.; Wilson, S.E.; Stewart, D.B.; Hollenbeak, C.S. Marital status and colon cancer outcomes in US Surveillance, Epidemiology and End Results registries: Does marriage affect cancer survival by gender and stage? Cancer Epidemiol. 2011, 35, 417–422. [Google Scholar] [CrossRef] [PubMed]
  33. El-Shami, K.; Oeffinger, K.C.; Erb, N.L.; Willis, A.; Bretsch, J.K.; Pratt-Chapman, M.L.; Cannady, R.S.; Wong, S.L.; Rose, J.; Barbour, A.L.; et al. American Cancer Society Colorectal Cancer Survivorship Care Guidelines. CA Cancer J. Clin. 2015, 65, 428–455. [Google Scholar] [CrossRef] [PubMed]
  34. Cancer Facts & Figures 2020. Available online: https://www.cancer.org/research/cancer-facts-statistics/all-cancer-facts-figures/cancer-facts-figures-2020.html (accessed on 14 February 2021).
  35. Myerson, R.M.; Tucker-Seeley, R.D.; Goldman, D.P.; Lakdawalla, D.N. Does Medicare Coverage Improve Cancer Detection and Mortality Outcomes? J. Policy Anal. Manage. 2020, 39, 577–604. [Google Scholar] [CrossRef] [PubMed] [Green Version]
  36. Sineshaw, H.M.; Ng, K.; Flanders, W.D.; Brawley, O.W.; Jemal, A. Factors That Contribute to Differences in Survival of Black vs. White Patients With Colorectal Cancer. Gastroenterology 2018, 154, 906–915.e907. [Google Scholar] [CrossRef] [Green Version]
  37. Phimha, S.; Promthet, S.; Suwanrungruang, K.; Chindaprasirt, J.; Bouphan, P.; Santong, C.; Vatanasapt, P. Health Insurance and Colorectal Cancer Survival in Khon Kaen, Thailand. Asian Pac. J. Cancer Prev. 2019, 20, 1797–1802. [Google Scholar] [CrossRef] [Green Version]
  38. Wallace, K.; Sterba, K.R.; Gore, E.; Lewin, D.N.; Ford, M.E.; Thomas, M.B.; Alberg, A.J. Prognostic factors in relation to racial disparity in advanced colorectal cancer survival. Clin. Colorectal. Cancer 2013, 12, 287–293. [Google Scholar] [CrossRef] [Green Version]
  39. Kupfer, S.S.; Carr, R.M.; Carethers, J.M. Reducing colorectal cancer risk among African Americans. Gastroenterology 2015, 149, 1302–1304. [Google Scholar] [CrossRef] [Green Version]
  40. Rogers, C.R.; Robinson, C.D.; Arroyo, C.; Obidike, O.J.; Sewali, B.; Okuyemi, K.S. Colorectal Cancer Screening Uptake’s Association With Psychosocial and Sociodemographic Factors Among Homeless Blacks and Whites. Health Educ. Behav. 2017, 44, 928–936. [Google Scholar] [CrossRef] [Green Version]
  41. Jean-Pierre, P.; Cheng, Y.; Wells, K.J.; Freund, K.M.; Snyder, F.R.; Fiscella, K.; Holden, A.E.; Paskett, E.D.; Dudley, D.J.; Simon, M.A.; et al. Satisfaction with cancer care among underserved racial-ethnic minorities and lower-income patients receiving patient navigation. Cancer 2016, 122, 1060–1067. [Google Scholar] [CrossRef] [Green Version]
  42. Jean-Pierre, P.; Hendren, S.; Fiscella, K.; Loader, S.; Rousseau, S.; Schwartzbauer, B.; Sanders, M.; Carroll, J.; Epstein, R. Understanding the processes of patient navigation to reduce disparities in cancer care: Perspectives of trained navigators from the field. J. Cancer Educ. 2011, 26, 111–120. [Google Scholar] [CrossRef] [Green Version]
Figure 1. Systematic method used to extract patient information for the study from SEER database.
Cancers 13 03262 g001
Figure 2. Kaplan–Meir cancer-specific survival between racial groups.
Cancers 13 03262 g002
Figure 3. Kaplan–Meir survival curves showing the impact of high school education.
Cancers 13 03262 g003
Figure 4. Kaplan–Meir survival curves showing the impact of poverty status.
Cancers 13 03262 g004
Figure 5. Kaplan–Meir survival curves showing the impact of employment status.
Cancers 13 03262 g005
Figure 6. Kaplan–Meir survival curves showing the impact of household income.
Cancers 13 03262 g006
Figure 7. Kaplan–Meir survival curves showing the impact of marital status.
Cancers 13 03262 g007
Figure 8. Kaplan–Meir survival curves showing the impact of insurance status.
Cancers 13 03262 g008
Figure 9. Kaplan–Meir survival curves showing the impact of immigration status.
Cancers 13 03262 g009
Table 1. A summary of demographic and clinicopathologic characteristics of YoCRC patients included in the study.
HispanicNon-Hispanic American IndianNon-Hispanic Asian Pacific IslanderNon-Hispanic BlackNon-Hispanic WhiteTotal
n = 2874n = 164n = 1676n = 2305n =10,126n = 17,145
Age Range25–29 years12775261292539
30–34 years2881 41131417171273
35–39 years4872821729412872313
40–44 years7554046459527024556
45–49 years121775830121451288464
SexFemale137177846120147548249
Male150387830110453728896
Primary SiteAppendix9583757304501
Ascending Colon263151213458031547
Cecum25291153489221646
Colon NOS231795595
Descending18281261795261021
Hepatic Flexure7355264209403
Overlapping301112467133
Rectosigmoid2741919015911181760
Rectum6684245735328074327
Sigmoid7514543753425694336
Splenic Flexure6924265226404
Transverse Colon194981168520972
HistologyAdenocarcinoma, NOS192311912241554683911,659
Adenocarcinoma In adenomatous polyp198111051869941494
Tubular Adenocarcinoma100146
Serrated Adenocarcinoma000011
Adenocarcinoma in adenomatous polyposis coli110341735
Adenocarcinoma in multiple Adenomatous polyps302229
Adenocarcinoma in villous adenoma7912554213372
Villous Adenocarcinoma101226
Adenocarcinoma in tubulovillous adenoma2671715424810391725
Clear cell Adenocarcinoma, NOS100023
Cystadenocarcinoma, NOS100012
Mucinous cystadenocarcinoma, NOS2012813
Mucinous adenocarcinoma308111171907881414
Mucin- producing adenocarcinoma27162252108
Signet ring cell carcinoma5143740161293
GradeWell differentiated; Grade I279141111576981259
Moderately differentiated; Grade II190111011261592688411,613
Poorly differentiated; Grade Ill4202328731614522498
Undifferentiated; anaplastic; Grade IV7943873338532
MucinousNon-Mucinous256615315592115933815,731
Mucinous308111171907881414
AJCC-7 TNM09624877293516
I4693027638519173077
IIA5894234142919223323
IIB7012849212360
IIC8442750192357
IIIA109756112452736
IIIB6842742652424094070
IIIC281151612028901549
IVA2842016125910581782
IVB184141 432047021247
IVC24291479128
ProcedureColectomy or proctocolectomy resection in continuity6102727150265
Colectomy, NOS; Proctectomy, NOS1117112252
Cryosurgery000011
Electrocautery fulguration (hot forceps)200024
Endoscopic polypectomy4213236144255
Excisional biopsy162914104145
Hemicolectomy or subtotal colectomy8444742991727695006
Hemicolectomy or subtotal colectomy (and resection)81840100233462
Local tumor destruction, NOS101103
Local tumor excision, electrocautery112453557
Local tumor excision, laser ablation100012
Local tumor excision, laser excision100001
Local tumor excision, NOS131483258
Partial colectomy (segmental resection)13697889086951458351
Polypectomy, NOS5624863246415
Surgical polypectomy61171631
Total colectomy209121071226791129
Total colectomy (& resection of a contiguous organ)111685278
Total colectomy with ileorectal reconstruction000123
Total colectomy with ileostomy, NOS101046
Total colectomy with Pouch100012
Total proctocolectomy (& resection of a contiguous organ)30151019
Total proctocolectomy with ileostomy (NOS)1102610
Total proctocolectomy with ileostomy & Pouch3000710
Total proctocolectomy, NOS3602829184277
Unknown if surgery performed; death certificate ON26381756110
Wedge resection (segmental resection) & resection6843363225393
Table 2. A summary of race specific survival controlled for each SEDH.
HispanicNon-Hispanic AmericanNon-Hispanic Asian or Pacific IslanderNon-Hispanic BlackNon-Hispanic White
Indian/Alaskan
Native
Marital Status
(Unmarried vs. Married)
Cancers 13 03262 i001 Cancers 13 03262 i002 Cancers 13 03262 i003 Cancers 13 03262 i004 Cancers 13 03262 i005
Immigration
(Above vs. Below 50th centile)
Cancers 13 03262 i006 Cancers 13 03262 i007 Cancers 13 03262 i008 Cancers 13 03262 i009 Cancers 13 03262 i010
Employment Status
(Above vs. Below 50th centile)
Cancers 13 03262 i011 Cancers 13 03262 i012 Cancers 13 03262 i013 Cancers 13 03262 i014 Cancers 13 03262 i015
Poverty
(Above vs. Below 50th centile)
Cancers 13 03262 i016 Cancers 13 03262 i017 Cancers 13 03262 i018 Cancers 13 03262 i019 Cancers 13 03262 i020
High School Education
(Above vs. Below 50th centile)
Cancers 13 03262 i021 Cancers 13 03262 i022 Cancers 13 03262 i023 Cancers 13 03262 i024 Cancers 13 03262 i025
Insurance
(Medicaid vs. Commercial)
Cancers 13 03262 i026 Cancers 13 03262 i027 Cancers 13 03262 i028 Cancers 13 03262 i029 Cancers 13 03262 i030
Household Income
(Above vs. Below 50th centile)
Cancers 13 03262 i031 Cancers 13 03262 i032 Cancers 13 03262 i033 Cancers 13 03262 i034 Cancers 13 03262 i035
Red-adverse, Green-favorable, Blue-neutral.
Table 3. Univariate and multivariate results controlling for SEDH interactions.
Univariate AnalysisMultivariate Analysis
Socioeconomic DeterminantHRCIpSocioeconomic DeterminantHRCIp
Immigration1.0811.002–1.1650.043Immigration1.0110.927–1.1020.808
Employment Status0.890.826–0.960.002Unemployment1.0060.91–1.1120.809
Poverty0.8110.753–0.8750.001Poverty0.8870.787–0.9990.049
High School Education0.7950.738–0.857<0.0001High School Education0.8750.791–0.9670.009
Insurance (Commercial vs. Medicaid)0.540.494–0.592<0.0001Insurance (Commercial vs. Medicaid)0.5970.542–0.659<0.0001
Unmarried vs. Married1.4361.331–1.55<0.0001Unmarried vs. Married1.3051.201–1.419<0.0001
Household Income1.261.169–1.3570.001Household Income1.1360.994–1.12980.062
Publisher’s Note: MDPI stays neutral with regard to jurisdictional claims in published maps and institutional affiliations.

