Article

Integrative cBioPortal Analysis Revealed Molecular Mechanisms That Regulate EGFR-PI3K-AKT-mTOR Pathway in Diffuse Gliomas of the Brain

1
Laboratory of Neurooncology, Croatian Institute for Brain Research, School of Medicine, University of Zagreb, 10000 Zagreb, Croatia
2
Department of Biology, School of Medicine, University of Zagreb, 10000 Zagreb, Croatia
*
Authors to whom correspondence should be addressed.
Cancers 2021, 13(13), 3247; https://doi.org/10.3390/cancers13133247
Submission received: 28 May 2021 / Revised: 24 June 2021 / Accepted: 25 June 2021 / Published: 29 June 2021
(This article belongs to the Special Issue Multi-Omics Approaches in Oncology)

Abstract

:

Simple Summary

The current classification of central nervous system tumors has incorporated molecular changes that have clarified biological behavior and categorized gliomas into different types and malignancy grades. The most malignant type—glioblastoma, represents one of the most therapeutically challenging tumors, with a median survival of only 12–14 months despite trimodal therapy. In our integrative large-scale study, we used genomics, transcriptomics, epigenomics, and proteomics to investigate and make sense of the molecular changes that activate or inhibit the EGFR-PI3K-AKT-mTOR signaling pathway. Different pathohistological types of diffuse brain gliomas harbored distinct changes. A better understanding of signaling pathway regulation helps to the discovery of new targets for glioma therapies. Our results have potential for diagnostics improvement and tailored therapies.

Abstract

Diffuse gliomas are a heterogeneous group of tumors with aggressive biological behavior and a lack of effective treatment methods. Despite new molecular findings, the differences between pathohistological types still require better understanding. In this in silico analysis, we investigated AKT1, AKT2, AKT3, CHUK, GSK3β, EGFR, PTEN, and PIK3AP1 as participants of EGFR-PI3K-AKT-mTOR signaling using data from the publicly available cBioPortal platform. Integrative large-scale analyses investigated changes in copy number aberrations (CNA), methylation, mRNA transcription and protein expression within 751 samples of diffuse astrocytomas, anaplastic astrocytomas and glioblastomas. The study showed a significant percentage of CNA in PTEN (76%), PIK3AP1 and CHUK (75% each), EGFR (74%), AKT2 (39%), AKT1 (32%), AKT3 (19%) and GSK3β (18%) in the total sample. Comprehensive statistical analyses show how genomics and epigenomics affect the expression of examined genes differently across various pathohistological types and grades, suggesting that genes AKT3, CHUK and PTEN behave like tumor suppressors, while AKT1, AKT2, EGFR, and PIK3AP1 show oncogenic behavior and are involved in enhanced activity of the EGFR-PI3K-AKT-mTOR signaling pathway. Our findings contribute to the knowledge of the molecular differences between pathohistological types and ultimately offer the possibility of new treatment targets and personalized therapies in patients with diffuse gliomas.

1. Introduction

Gliomas are a heterogeneous group of central nervous system tumors that still lack efficient treatment methods regardless of medical progress [1]. Despite multimodal treatment, consisting of surgical procedures, radiotherapy, and chemotherapy, the median survival for glioblastoma patients is only 12–14 months [2,3]. Recent studies of the molecular profile of gliomas show the complex dynamics of tumor progression and explain the evolution of mutations of this biologically aggressive group of tumors [4]. Recent findings in neurooncology have led to changes in the WHO (World Health Organization) classification from 2016 of tumors of the central nervous system, which incorporated both phenotypic and molecular parameters in the division of glial tumors. The latest classification groups all diffuse gliomas, whether astrocytic or not, into one category [5] based on mitotic activity, diffuse growth pattern, and the mutational status of the IDH1 and IDH2 genes, together with several other molecular signatures. New classification improved the prognosis of diffuse glioma. For example, patients with grade III gliomas carrying a 1p/19q co-deletion have a better prognosis than IDH wild-type grade II glioma [5]. Our present investigation focuses on a detailed analysis of the genetic and protein changes, but also epigenetic and transcriptional levels that aggregate complex regulatory mechanisms which could offer potential molecular prognostic and therapeutic targets. The new classification groups tumors that share the same prognostic markers and potentially allows for common treatment of molecularly similar entities [5]. Despite new knowledge that has united diffuse gliomas, the molecular differences between individual pathohistological types and grades are still insufficiently explained [6]. One of the reasons why we focused our interest on EGFR-PI3K-AKT-mTOR signaling pathway is that our previous investigation, using Array Comparative Genomic Hybridization (aCGH) and bioinformatics utilizing a Bioconductor package, Genomic Identification of Significant Targets in Cancer (GISTIC) 2.0.23 and DAVID software, identified main actors of the PI3K-AKT pathway activated in human astrocytomas and suggested that DNA copy number alterations play important roles in its etiology and progression [7]. Furthermore, the AKT signaling pathway mediates cell regulation, cell proliferation, cell cycle, and carbohydrate metabolism by further phosphorylation of GSK3β (glycogen synthase kinase 3 beta), Bad (bcl-2 bound death promoter), caspase-9, NF-κB (nuclear factor κB), mTOR (target molecule of rapamycin in mammals) and p21 protein [8,9,10,11,12,13]. Since recent studies have revealed the essential role of EGFR-PI3K-AKT-mTOR signaling in human tumors [14], we were interested in the molecular characteristics of this pathway across the three pathohistological types and grades of diffuse brain gliomas. Additionally, we focused on CHUK and PIK3AP1 genes, which are important for regulating the PI3K-AKT-mTOR pathway. Recent studies showed an essential role of CHUK protein product (IKK) in glioma tumorigenesis [15], while PIK3AP1 acts as a negative regulator of toll-like receptor-induced inflammation. The roles of both CHUK and PIK3AP1 in various tumors are still insufficiently investigated [16,17]. Although several studies have indicated the important role of the PI3K-AKT-mTOR pathway in brain tumors, our study aim to provide a unique and comprehensive analysis of multi-omics data that may reveal a novel molecular background of diffuse brain gliomas. In addition, PIK3AP1 and CHUK genes have not been investigated so far. Furthermore, specific molecules within this signaling pathway have been untested at the epigenetic and transcriptional levels. A need for a better understanding of the function and mechanisms of PI3K-AKT-mTOR signal transduction may eventually provide advanced diagnostic and treatment options for primary brain neoplasms [9,18]. This study aims to understand the significance of the EGFR-PI3K-AKT-mTOR signaling pathway and reveal differences between AKT1, AKT2, AKT3, CHUK, GSK3β, EGFR, PTEN, and PIK3AP1 roles within different grades and types of diffuse brain gliomas.

2. Materials and Methods

2.1. cBioPortal Database and Bioinformatics Methods

Integrative analysis of diffuse brain gliomas was performed using cBioPortal (https://www.cbioportal.org/, accessed on 16 April 2021)—a publicly available database for tumor genomics and transcriptomics [19]. This database enables large-scale data processing, statistical analysis, and graphical review of tumor changes from gene to protein level [20]. We based our study on data generated by the TCGA research network (The Cancer Genome Atlas, https://www.cancer.gov/tcga, accessed on 16 April 2021), containing a total of more than 400 terabytes of raw data for 33 different tumor types requiring analysis [21]. Using the cBioPortal database, we created a virtual study using a combination of data provided by two previous large-scale studies: Brain Lower Grade Glioma (TCGA Firehose Legacy) and Glioblastoma Multiforme (TCGA Firehose Legacy). The samples from original individual publications [22,23,24,25,26,27,28] of TCGA data are a subset of our Firehose Legacy dataset from which the data were collected within cBioPortal. All TCGA Firehose Legacy data are publicly available at https://gdac.broadinstitute.org/ (accessed on 16 April 2021) and are updated every three months to contain the most complete and accurate data. We selected samples that held data for the following parameters: sex and age of the patient at diagnosis, a patient without multiple samples, a patient with complete genetic analysis, selected pathohistological types and grades of diffuse gliomas (diffuse astrocytoma (DA, grade II), anaplastic astrocytoma (AA, grade III), glioblastoma multiforme (GBM, grade IV)). In the created virtual study using the OQL programming language (Onco Query Language), genes were queried and the parameters selected for the analysis were as follows: changes in the number of copies of selected genes (CNA—copy number alteration), transcription levels (mRNA), methylation patterns and protein expression levels. Analysis of CNA was profiled on 751 samples, of which 62 DA, 129 AA and 560 GBM. mRNA expression data were available for 62 DA, 129 AA, and 140 GBM. To compare protein expression for each pathohistological grade, cBioPortal contained protein expression data for 348 gliomas, of which 46 DA, 99 AA, and 213 GBM. Protein expression data were lacking for the CHUK and PIK3AP1 proteins in all three types of gliomas examined. To compare the methylation of the relevant genes between individual pathohistological type and grade, 62 DA, 129 AA, and 123 GBM had data available for the analysis. Methylation data for the AKT2 gene were missing for two AA. However, methylation data for the PIK3AP1 gene were not available for the GBM group. All cBioPortal data have the same clinical criteria and equally processed and normalized data, enabling comparative analysis of samples between different studies. After creating the virtual study, CNA, methylation data, mRNA expression, and protein expression of selected genes were downloaded and examined like a classical study. Graphs of CNA were made in Excel 2016 (Microsoft), while graphs of methylation and mRNA expression were made using the software package IBM SPSS Statistics 23.0 (SPSS, Chicago, IL, USA). Data downloaded from a publicly available cBioPortal database does not require ethical approval. All patients whose samples were used in this analysis signed informed consent. Our virtual study, created on 16 April 2021, has data for download available at https://www.cbioportal.org/study?id=609e74e2e4b015b63e9eb2d6 (Supplementary Materials). The current version of the publicly available cBioPortal uses hg19/GRCh37 as a reference to the human genome.

2.2. Data Processing

A protocol for processing and normalizing TCGA data was based on a study by Hoadley et al. [22], and additional documentation is publicly available on the Broad Institute Firehose website (https://gdac.broadinstitute.org/ accessed on 16 April 2021).
RNA and DNA were obtained from tumor and adjoining normal tissue specimens using an adjustment of the DNA/RNA AllPrep kit (QIAGEN). Pathologists systematically reviewed samples to verify the histopathologic diagnosis and any irregularity in histology, applying the criteria of the most up-to-date edition of the WHO Classification of Tumors relevant to each tumor type. Any non-concordant diagnoses amongst the pathologists were re-reviewed, and a decision was achieved after examination [22].
Copy-number data were generated on Affymetrix SNP 6.0 arrays using regular protocols from the Genome Analysis Platform of the Broad Institute [22]. CNA are continuous values of the number of copies of a gene obtained as the difference between the number of copies of a tumor gene and the reference. Normalized continuous CNA values were processed within cBioPortal using the Genomic Identification of Significant Targets in Cancer (GISTIC 2.0) algorithm [29], and continuous values lower than −2.0 were listed as homozygous deletions (HOMDEL), while values between −2.0 and −1.0 were listed as hemizygous deletions (HETLOSS). In contrast, values between 1.0 and 2.0 were declared amplifications (GAIN), and more than 2.0 multiple amplifications (AMP). In addition, samples whose continuous CNA value was between −1.0 and 1.0 were declared diploid samples (DIPLOID), meaning they have no changes in the number of gene copies. Since the results obtained by the GISTIC 2.0 algorithm correlate well with the actual amplifications and deletions of one or more alleles, in this paper we used the following terminology: homozygous deletions (loss of both alleles), hemizygous deletions (loss of one allele), diploid samples (samples with two alleles—without CNA), amplifications (existence of 3 copies of alleles) and multiple amplifications (existence of 4 or more copies of alleles).
To obtain mRNA expression levels, next-generation sequencing from RNASeq V2 RSEM (RNA-seq by Experimentation Maximization) dataset was downloaded [30]. RSEM determines the total RNA transcript [20]. The expression data assigned from Illumina were batch-corrected to correct platform variations between the GAII and HiSeq Illumina sequencers. Additional corrections were made for various sequencing centers (British Columbia Cancer Agency and The University of North Carolina) [22]. More precisely, the RNASeq V2 data in cBioPortal matches the rsem.genes.normalized_results file from TCGA. cBioPortal mRNA expression data are calculated as relative expression of a specific gene in a tumor sample to the gene’s expression distribution in a reference (all samples that are diploid for the gene in question) population of samples [20].
Illumina Infinium DNA methylation arrays were applied to collect DNA methylation profiles of three tumor types and histologically normal tumor-adjacent tissue. All our samples were profiled on the same methylation array (HumanMethylation450 (HM450) Infinium array) [31]. The HM450 array relies on a chemical reaction that converts methylated cytosine to thymine by treatment with sodium bisulfite. Each CpG site targets Infinium I (one probe corresponds to the methylated version and the other corresponds to the non-methylated version of the analogous CpG site) and Infinium II probes (one probe for target CpG loci and differently labeled nucleotides to determine methylation status). Due to the variation in intensity (and β-values) displayed by Infinium I and Infinium II probes, a quantile normalization of the data was made to produce a similar distribution of β-values between Infinium I and II probes [32]. The level of methylation at the associated CpG site is measured as a beta value indicating the ratio between the intensity of the methylated series and the total intensity of the series, which falls between 0 (weakest methylation) and 1 (strongest methylation) [22]. Normalization of data was done using different internal controls that are present on the HumanMethylation450 BeadChip. Using the HM450 probe sequence information implemented in the manufacturer’s manifest, the probes were re-mapped using the reference genome. These coordinates were then used to link transcripts to GENCODE v22, the associated CpG island, and the distance of the CpG site from each of these traits. Illumina annotates CpG positions on the chip relative to RefSeq gene traits. RefSeq genes are covered across gene regions (promoter region, 5′UTR, first exon, gene body, 3′UTR) and extended to CpG island regions. [32]. Methylation data were not additionally processed or normalized within the cBioPortal.
Protein expression data were assessed using the reverse-phase protein array (RPPA) platform that provided expression levels for proteins and phosphoproteins. During the data normalization process, expression data (RPPA) for protein were batch effects-corrected and median-centered in both directions [22]. RPPA (reverse-phase protein array) applies panels of high-specificity antibodies to determine total protein expression in biological and clinical research. The method allows well-defined and sensitive quantification of a significant number of samples. Within cBioPortal, the protein data were additionally processed and normalized with the calculation of the z-scores and converted on the log scale [20].

2.3. Statistical Analysis

All samples were statistically analyzed according to the following variables: pathohistological diagnosis, sex, age, CNA type, mRNA expression, methylation level, and protein expression for each gene (AKT1, AKT2, AKT3, CHUK, GSK3β, EGFR, PTEN and PIK3AP1). Statistical analysis of the obtained data was performed in the software package IBM SPSS Statistics 23.0 (SPSS, Chicago, IL, USA), with a significance level of p < 0.05. Continuous data values were used for the analysis of the CNA, while values obtained by the GISTIC algorithm were used for the graphical representation. For all other parameters (mRNA, methylation, protein expression), normalized continuous values were used for graphical presentation and statistical analysis. The normality of the distribution of individual parameters within the groups was tested using the Kolmogorov–Smirnov and Shapiro–Wilk test of normality (a low significant value (p < 0.05) indicates that the distribution differs significantly from the average). Depending on the results of those tests parametric or nonparametric statistical tests were used accordingly. The Kruskal–Wallis test tested differences in measured values of CNA, mRNA, methylation, and protein expression between the three pathohistological types of gliomas. The Mann–Whitney test was employed to compare individual groups. The Kruskal–Wallis and Mann–Whitney tests were also used to compare the age of patients in individual grades of diffuse gliomas. Correlations between CNA and mRNA expression, methylation and mRNA expression, and protein and mRNA expression were tested by the Spearman’s test.

3. Results

3.1. Demographic Data of Examined Diffuse Brain Gliomas

Diffuse glioma samples were collected from 446 males and 305 females. The examined patients’ age ranged from 10 to 89 years, while the median age at the time of diagnosis was 55 years. The median age for men was 56 years, and for women 54 years. Our study included 751 samples of diffuse brain gliomas of various grades of malignancy, of which 62 were diffuse astrocytomas (DA), 129 anaplastic astrocytomas (AA), and 560 glioblastomas multiforme (GBM) (Table 1).
The Kruskal–Wallis test showed a statistically significant difference in the age of the disease onset within the different pathohistological types of diffuse gliomas (p < 0.001). Using the Mann–Whitney test, we confirmed significant difference between the median age and pathohistological type of brain glioma (Table 1).

3.2. Changes in the Copy Number (CNA) of Examined Genes

In silico analysis included the following genes: AKT1, AKT2, AKT3, CHUK, GSK3β, EGFR, PTEN, and PIK3AP1. Analysis of CNA in a total sample of diffuse brain gliomas showed that the highest total number of CNA was confined to the GBM group, while the lowest CNA of all tested genes was found in the DA group. This result shows the accumulation of gene aberrations during glioma progression and is consistent with the biological behavior of the most aggressive type—GBM. Further analysis showed that GBM harbored the highest number of CNA in genes CHUK (88%), EGFR (89%), PIK3AP1 (89%), and PTEN (89%). Lower grade gliomas, the AA group, harbored the highest number of CNA in genes PTEN (50%), PIK3AP1 (49%), and CHUK (49%), while the DA group carried the highest number of CNA in genes AKT1 (15%), AKT2 (11%), and GSK3β (11%). We found that aberrations in the lowest malignancy type (DA) affects AKT1, AKT2 and GSK3β genes with a similar frequency, while a different set of genes (CHUK, EGFR, PIK3AP1, and PTEN) were highly affected in GBM (Table 2). This suggests that the AKT1, AKT2, and GSK3β genes may be involved in the early stages of diffuse glioma formation, while changes in the CHUK, EGFR, PIK3AP1 and PTEN genes accumulate during progression. The Kruskal–Wallis test revealed a significant difference in the relative continuous number of CNA between individual pathohistological types for genes AKT2 (p < 0.001), AKT3 (p < 0.001), CHUK (p < 0.001), EGFR (p < 0.001), PIK3AP1 (p < 0.001) and PTEN (p < 0.001). A detailed analysis between individual pathohistological types was performed by the Mann–Whitney test and is presented in the following subheadings.

3.3. CNA of AKT1, AKT2 and AKT3—the Core of the Signaling Pathway

Hemizygous deletions (loss of one allele) were the most common CNA found for the AKT1 gene, comprising 26% of total samples. Hemizygous deletions were found in 151 (27%) glioblastomas and were significantly more frequent than amplifications (the existence of three copies of alleles). The AA and DA groups harbored 26% and 15% of hemizygous deletions, respectively. Amplifications were found in 6% of GBM and 2% of AA. Significant differences between pathohistological types were not established, although it was evident that the number of AKT1 deletions were more frequent in GBM. Contrary to AKT1, the analysis of the AKT2 gene revealed that the most common CNAs in the total sample were amplifications (26%). They were found in 33% of GBM and 10% of AA, while DA did not harbor amplifications. Hemizygous deletions of AKT2 were distributed to 10% of GBM, 20% of AA and 6% of DA. The results of the Mann–Whitney test showed a statistically significant difference in pathohistological types (Table 2). These results show that GBM was significantly more affected by the amplification of AKT2 compared to AA and DA. Analysis of the AKT3 gene revealed behavior similar to that of AKT2, showing that amplification was again the most commonly found CNA, adding up to 13% of the total sample, of which 15% were associated with GBM, 10% with AA and 2% with DA. Other CNAs for all three genes were recorded in traces. The Mann–Whitney test showed significant differences in the continuous value of the AKT3 gene CNA between DA and GBM (p < 0.001) and between AA and GBM (p < 0.001). These results confirm a significantly higher prevalence of amplification in grade IV. The distribution of CNA for AKT1, AKT2 and AKT3 within each pathohistological type and grade is shown in Table 2.

3.4. CNA of CHUK, GSK3β and PTEN—Regulators of PI3K-AKT-mTOR Pathway

Analysis of CHUK showed that in the total sample examined, hemizygous deletions were the most common CNA of this gene with 557 cases (74%). They were distributed to 491 samples (88%) of GBM, 47% of AA and 8% of DA. The Mann–Whitney test showed significant differences in the continuous value of the CNA of the CHUK gene between pathohistological types (Table 2). CHUK was significantly more affected by deletions at higher grades. Contrary to this finding, changes in GSK3β were not frequent. A total of 135 samples (18%) had CNA (Table 2), of which the most common were amplifications, found in a total of 65 (9%) samples. These changes affected 59 (11%) GBM. However, hemizygous deletions of this gene were also present in 64 (9%) cases of the total sample. The glioblastoma group harbored 53 (9%) hemizygous deletions, while the DA group showed homozygous deletions (loss of both alleles) in 5% of samples and no other CNAs were recorded. The result of CNA analysis of the PTEN gene demonstrated that hemizygous deletions were the most common aberration, occurring in a total of 506 (67%) samples. These changes were distributed to 79% of GBM, 46% of AA and 8% of DA. Homozygous deletions were also present in 10% of GBM, 4% of AA and 0% of DA. All other CNAs were recorded in traces. The Mann–Whitney test showed a significant difference in the continuous value of the CNA between pathohistological types. These results confirmed that PTEN suffered significant deletions at higher grades. CHUK, GSK3β and PTEN distribution of CNA within each pathohistological type and grade are shown in Table 2.

3.5. CNA of EGFR and PIK3AP1—Activators of PI3K-AKT-mTOR Pathway

The EGFR gene was frequently affected by CNA—altogether in 554 (74%) glioma samples. Amplification was the most common CNA, and was found in 275 patients (37%) out of our total sample. Amplifications were distributed to 44% of GBM, 22% of AA and 5% of DA. Multiple amplifications (four or more copies of alleles) were also common in a total of 272 (36%) samples, of which 247 cases (44%) were in GBM, while 19% of AA and 2% of DA showed this aberration. The Mann–Whitney test showed a significant difference in the continuous values of the CNA of the EGFR gene between pathohistological types (Table 2). These results indicate that amplifications and multiple amplifications of this gene progressively increased and were significantly more associated with higher grades, mainly grade IV. Analysis of the PIK3AP1 gene revealed that hemizygous deletions were very common in the examined sample, with 88% altered in GMB, 47% in AA and 8% in DA. Hemizygous deletions were found in a total of 556 (74%) samples. The Mann–Whitney test showed a significant difference in the continuous value of the CNA between pathohistological types. The higher grades, GBM in particular, were more strongly affected by CNA, this time with deletions of this gene. EGFR and PIK3AP1 distribution of CNA within each pathohistological type are shown in Table 2.

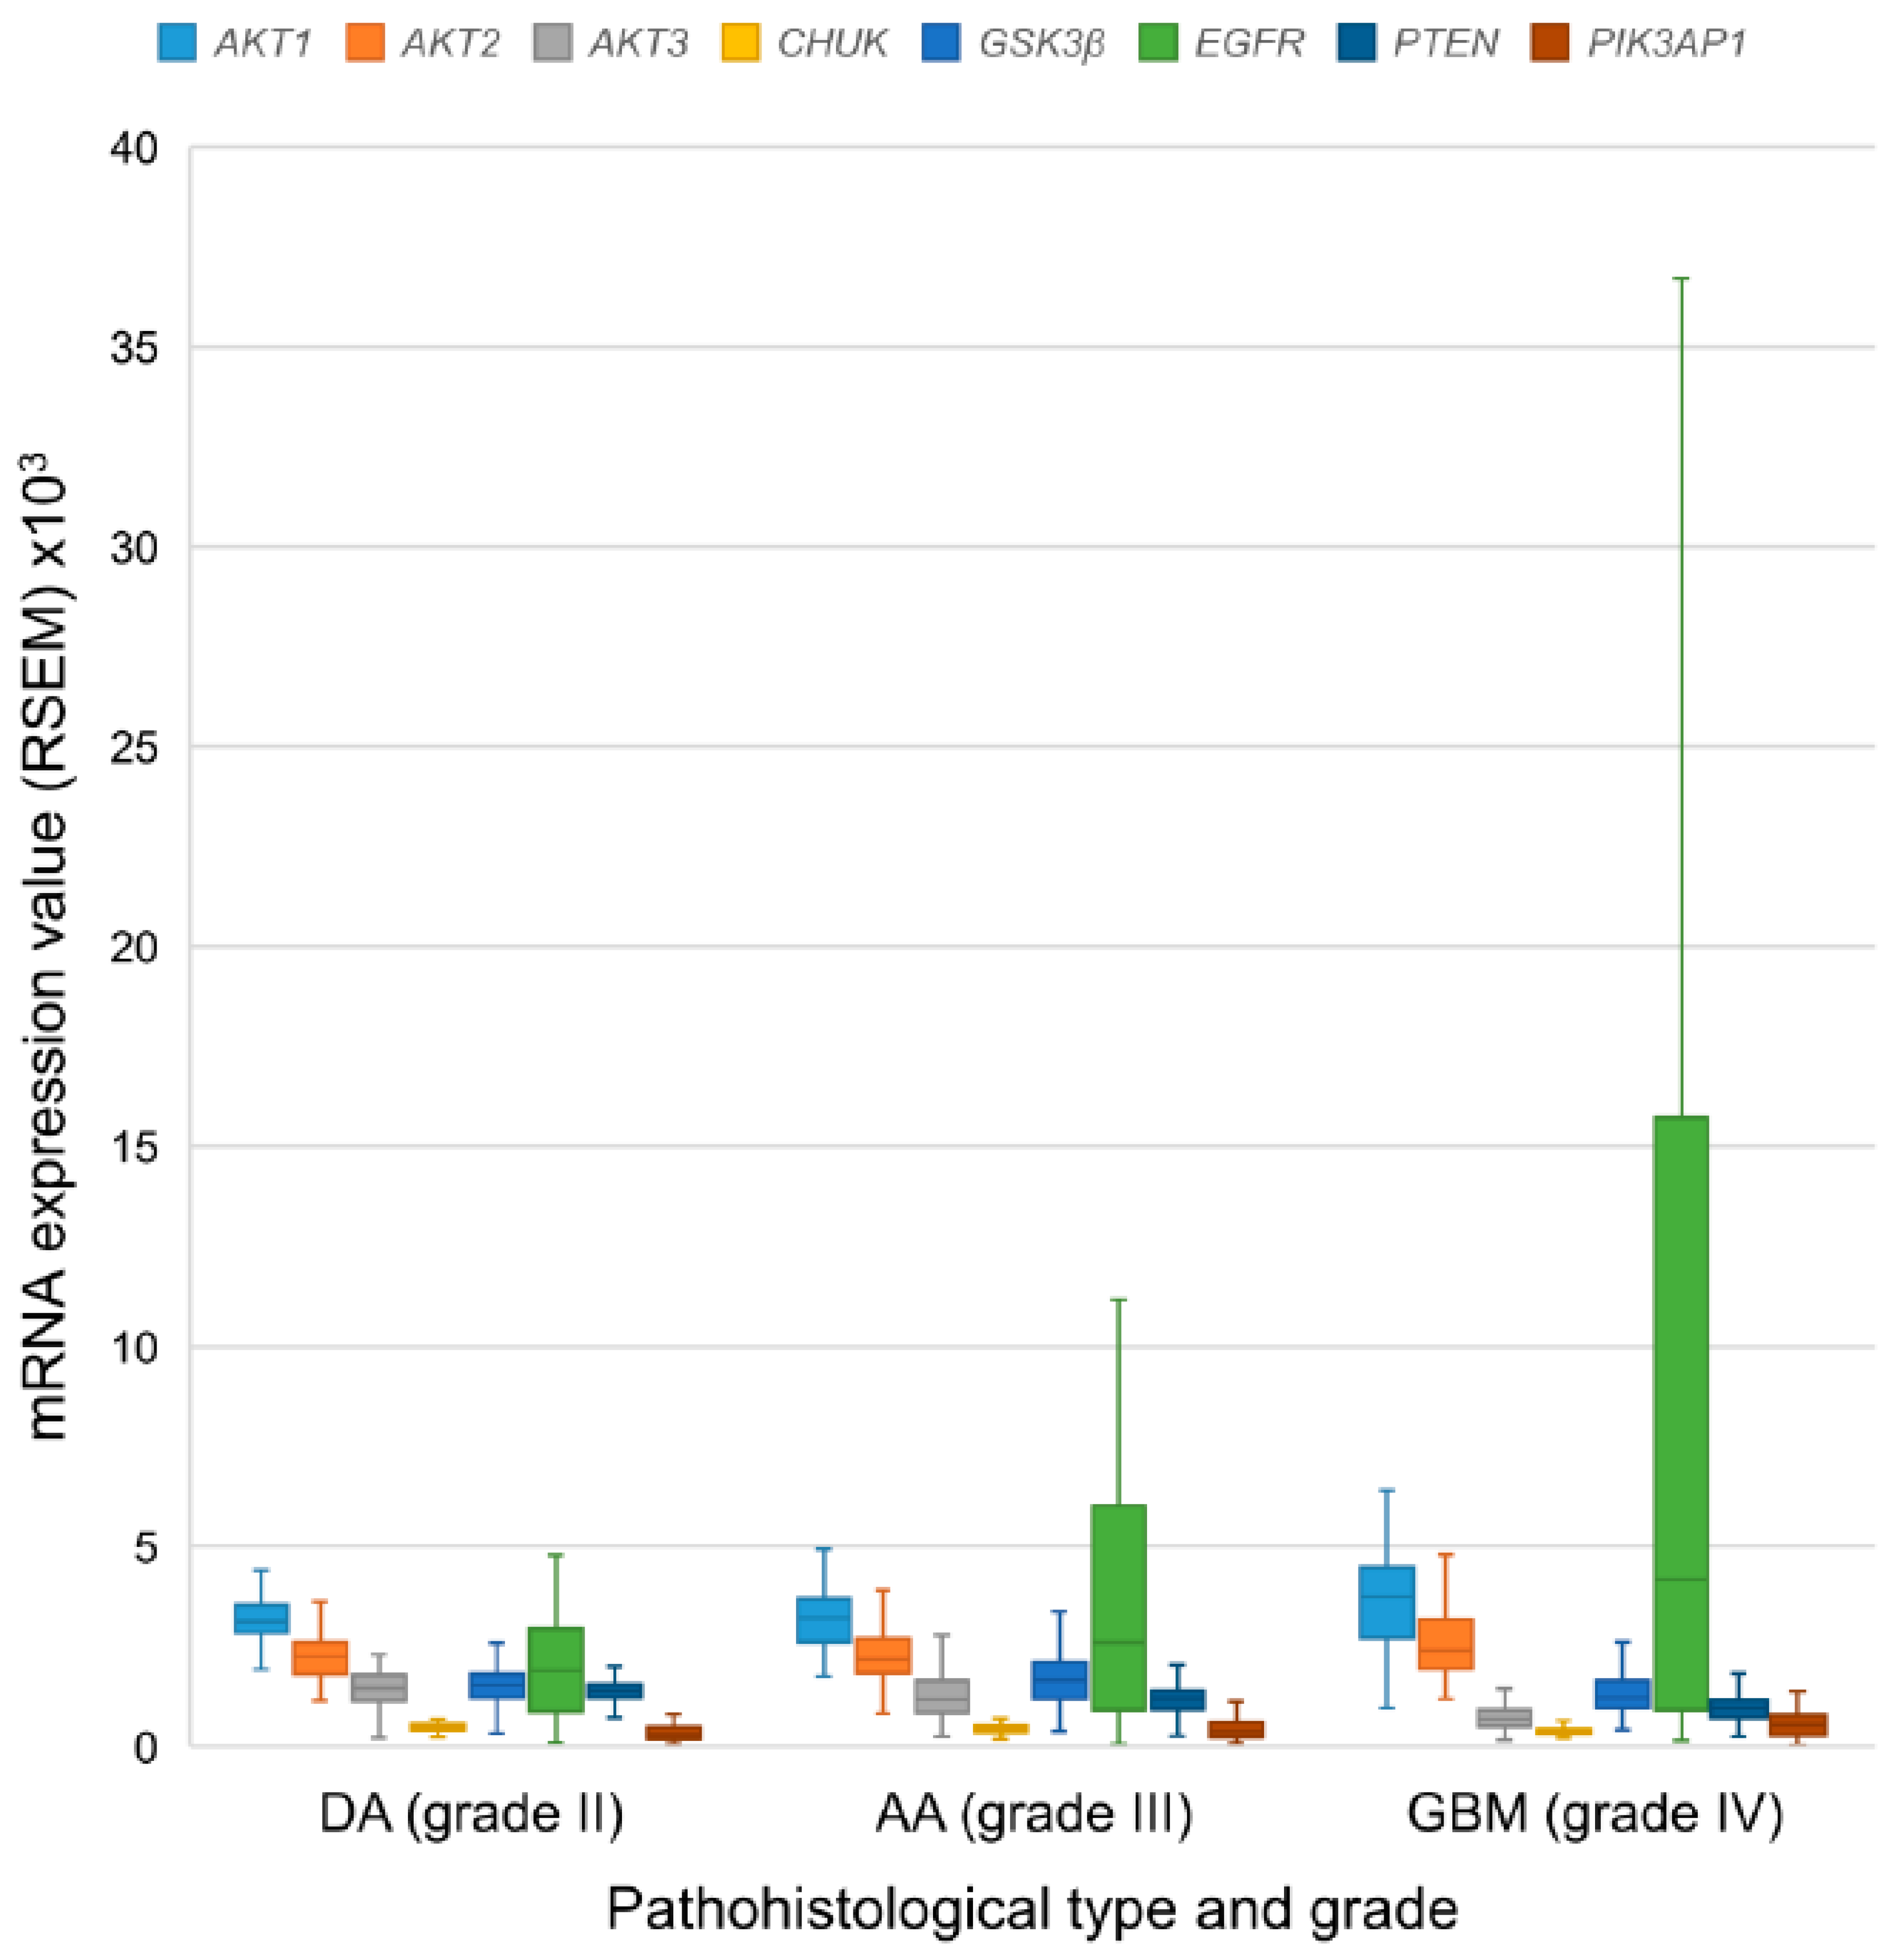
3.6. mRNA Expression Levels of the EGFR-PI3K-AKT-mTOR Pathway Participants

AKT1 gene transcripts showed the highest level of mRNA expression in DA, while in AA and GBM the highest mRNA expression was associated with the EGFR gene. PIK3AP1 showed the lowest mRNA expression in DA, while in AA and GBM the lowest levels were associated with CHUK gene. Table 3 and Figure 1 show the mRNA expression levels for each gene. There was significant difference in mRNA expression of all examined genes between individual pathohistological types (Kruskal–Wallis test p < 0.001 for AKT1, AKT3, CHUK, GSK3β, PTEN, and PIK3AP1; p = 0.025 for AKT2; p = 0.003 for EGFR). The Mann–Whitney test showed that there were significantly lower transcript levels of AKT3 (p = 0.019), CHUK (p = 0.008), and PTEN (p < 0.001) genes in AA compared to DA, and a significantly higher level of the EGFR (p = 0.020) and PIK3AP1 (p = 0.047) genes in AA compared to DA.
Further analysis using the Mann–Whitney test showed significantly higher mRNA expression of the AKT1 (p = 0.002), AKT2 (p = 0.030), EGFR (p = 0.001) and PIK3AP1 (p < 0.001) genes, and significantly lower mRNA expression of the AKT3 (p) < 0.001), CHUK (p < 0.001), GSK3β (p = 0.001) and PTEN (p < 0.001) genes in GBM versus DA. Additionally, the test showed significantly higher mRNA expression of genes AKT1 (p < 0.001), AKT2 (p = 0.018), and PIK3AP1 (p = 0.013), and significantly lower expression of the AKT3, CHUK, GSK3β, and PTEN genes (p < 0.001) in GBM compared to AA. The results of mRNA expression levels were compatible with CNA findings. Table 3 and Figure 1 show the mean mRNA expression values for the examined genes.

3.7. Protein Expression Levels of the Examined Genes

To compare protein expression between pathohistological grades, cBioPortal protein expression data for 348 gliomas were available and downloaded. Results showed that in comparison with other proteins EGFR had the highest mean value of expression in all three grades and types. The lowest means were attributed to PTEN protein in AA, while DA and GBM showed the lowest means of GSK3β protein in comparison with other proteins (Table 4). AKT1, AKT2, AKT3, GSK3β, and EGFR expression values were higher in GBM and AA compared to DA (Table 4). Although EGFR expression values were higher and PTEN lower in AA than in DA, this difference was not significant, probably due to the relatively small number of DA samples. Additionally, no significant difference was found in EGFR protein expression between DA and GBM, although the mean of EGFR expression in GBM was higher.

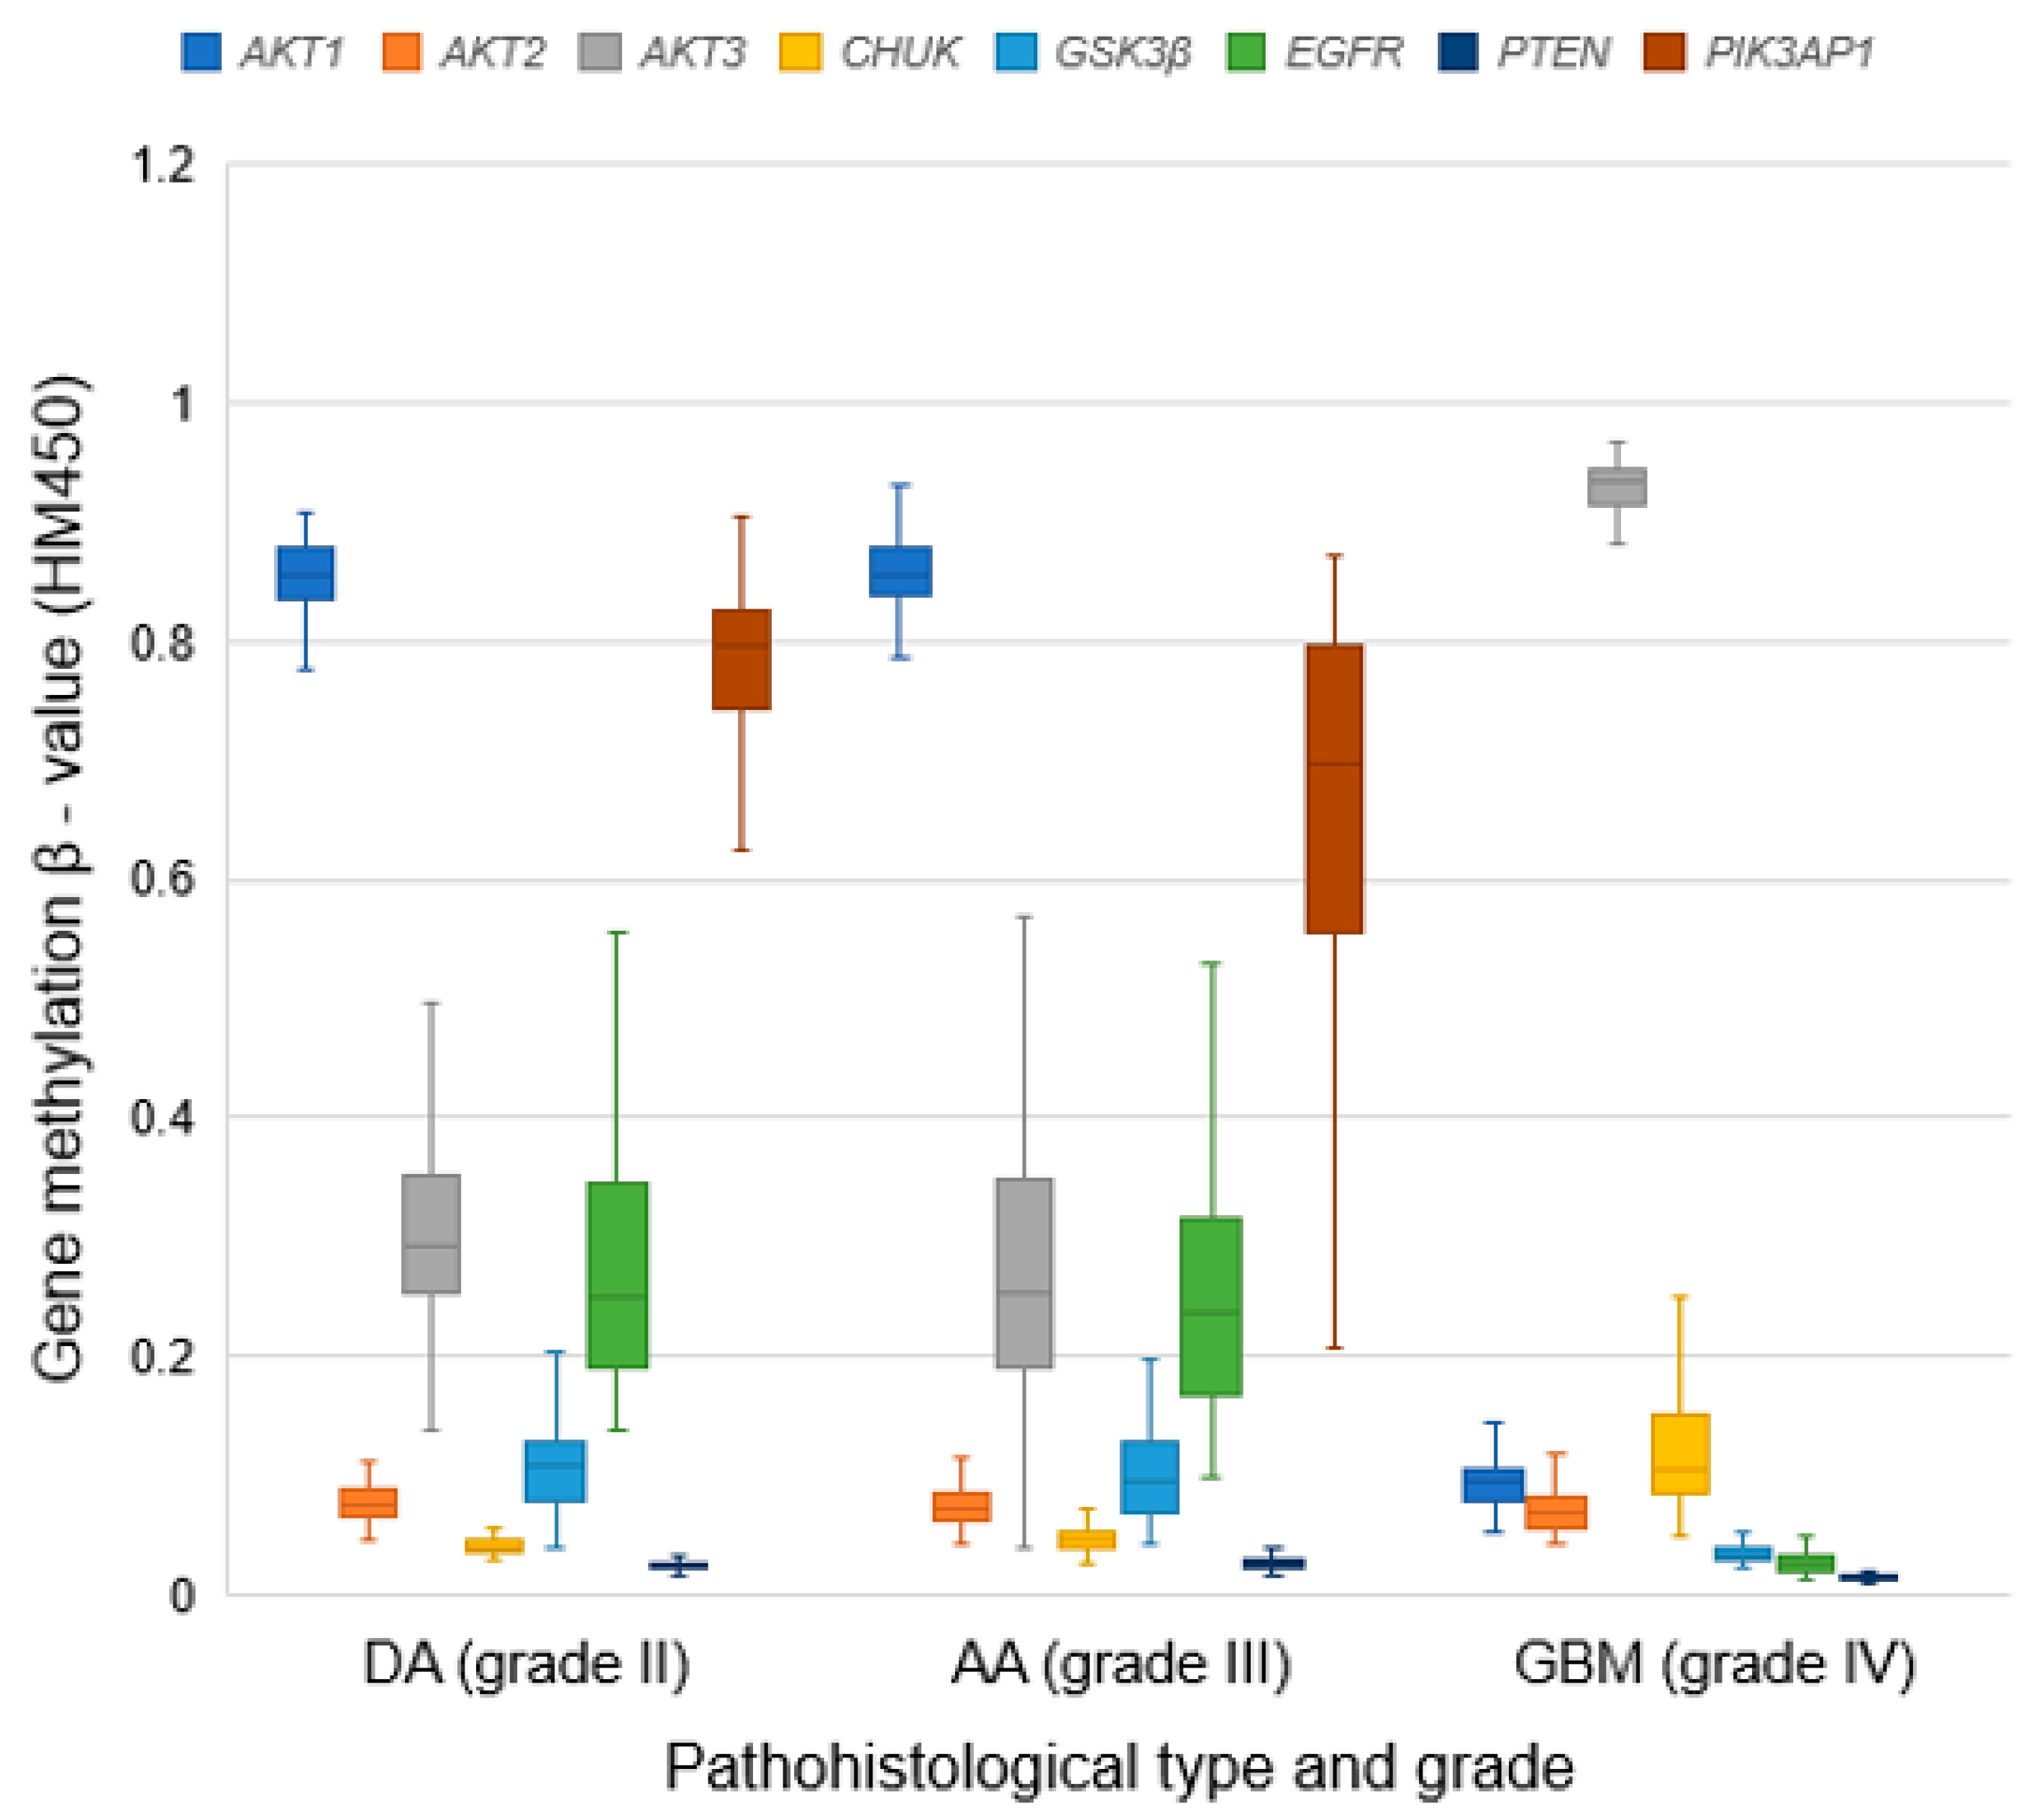
3.8. Methylation Patterns of Examined Genes

The mean methylation values for the examined genes are shown in Table 5 and Figure 2. The methylation values of the AKT3 gene were the highest in GBM, while AKT1 showed the highest values in DA and AA. In the total sample, PTEN had the lowest methylation values across all grades, while the AKT3 gene showed the highest levels of methylation (Figure 2). The Kruskal–Wallis test confirmed a significant difference in methylation of all examined genes between glioma types (p < 0.001 for AKT1, AKT3, CHUK, GSK3β, EGFR, PTEN, PIK3AP1; p = 0.032 for AKT2). Using the Mann–Whitney test, we found that methylations of the AKT3 (p = 0.015) and PIK3AP1 (p < 0.001) genes were significantly higher in DA in comparison with AA, while those of the CHUK (p < 0.001) and PTEN (p = 0.008) genes were significantly higher in AA compared to DA. Further analysis confirmed significantly higher methylation of the AKT1 (p < 0.001), AKT2 (p = 0.047), GSK3β (p < 0.001), PTEN (p < 0.001) and EGFR (p < 0.001) genes in AA compared to GBM. Contrary to that, the AKT3 (p < 0.001) and CHUK (p < 0.001) genes had significantly higher methylation in GBM compared to AA. Methylation of the AKT1, GSK3β, EGFR, PTEN (p < 0.001), and AKT2 (p = 0.018) genes was significantly lower in GBM, while the AKT3 and CHUK (p < 0.001) genes were significantly more methylated in GBM versus DA. These results suggest a potentially significant role of methylation in regulating AKT1, AKT3, CHUK, EGFR, and PIK3AP1 gene expression.

3.9. Correlation between CNA and mRNA Expression Across Glioma Types

Spearman’s test showed a significant positive correlation between mRNA expression and continuous CNA values in AA and GBM for the AKT1, AKT2, CHUK, EGFR, and PTEN genes (p < 0.001). The EGFR and PTEN genes showed a positive correlation between CNA and mRNA expression in DA (p < 0.05), and the GSK3β and PIK3AP1 genes showed a significant positive correlation in GBM (p < 0.001). It is important to note that, in general, the strength of the correlation between CNA and mRNA expression also increased with the increasing grade (Table 6). These findings suggest that at higher grades, the biological aggressiveness of tumors is more dependent on CNA. Furthermore, deletions were positively correlated to lower mRNA transcript levels, while genes predominantly showing amplifications had significantly more transcripts of the amplified genes.

3.10. Correlation between Mezthylation and mRNA Expression Across Glioma Types

Spearman’s test established a significant negative correlation between methylation and mRNA expression of the GSK3β, EGFR, and PIK3AP1 genes in DA (p < 0.05), the AKT1 (p < 0.05), AKT2, AKT3, GSK3β, EGFR, and PTEN (p < 0.001) genes in AA and the EGFR and PTEN genes in GBM (p < 0.05). Furthermore, by comparing Spearman’s correlation coefficient (r) (Table 6), methylation in lower grades showed a stronger negative correlation with mRNA expression than the correlation between mRNA and CNA. In DA, five genes (AKT1, AKT3, GSK3β, EGFR, and PIK3AP1) showed a stronger correlation, in AA three genes (AKT3, GSK3β, and EGFR), while in GBM, only AKT3 showed a stronger correlation between mRNA and methylation in comparison to CNA. However, in GBM, the AKT1, AKT2, GSK3β, EGFR, PIK3AP1, CHUK, and PTEN genes showed a stronger correlation of mRNA expression with CNA compared to mRNA and methylation (Table 6). These findings suggest that in higher-grade gliomas, CNAs were more responsible for mRNA expression, while at lower grades, methylation plays a critical role in the expression of the examined proteins. All tested genes showed this pattern of regulation except AKT3.

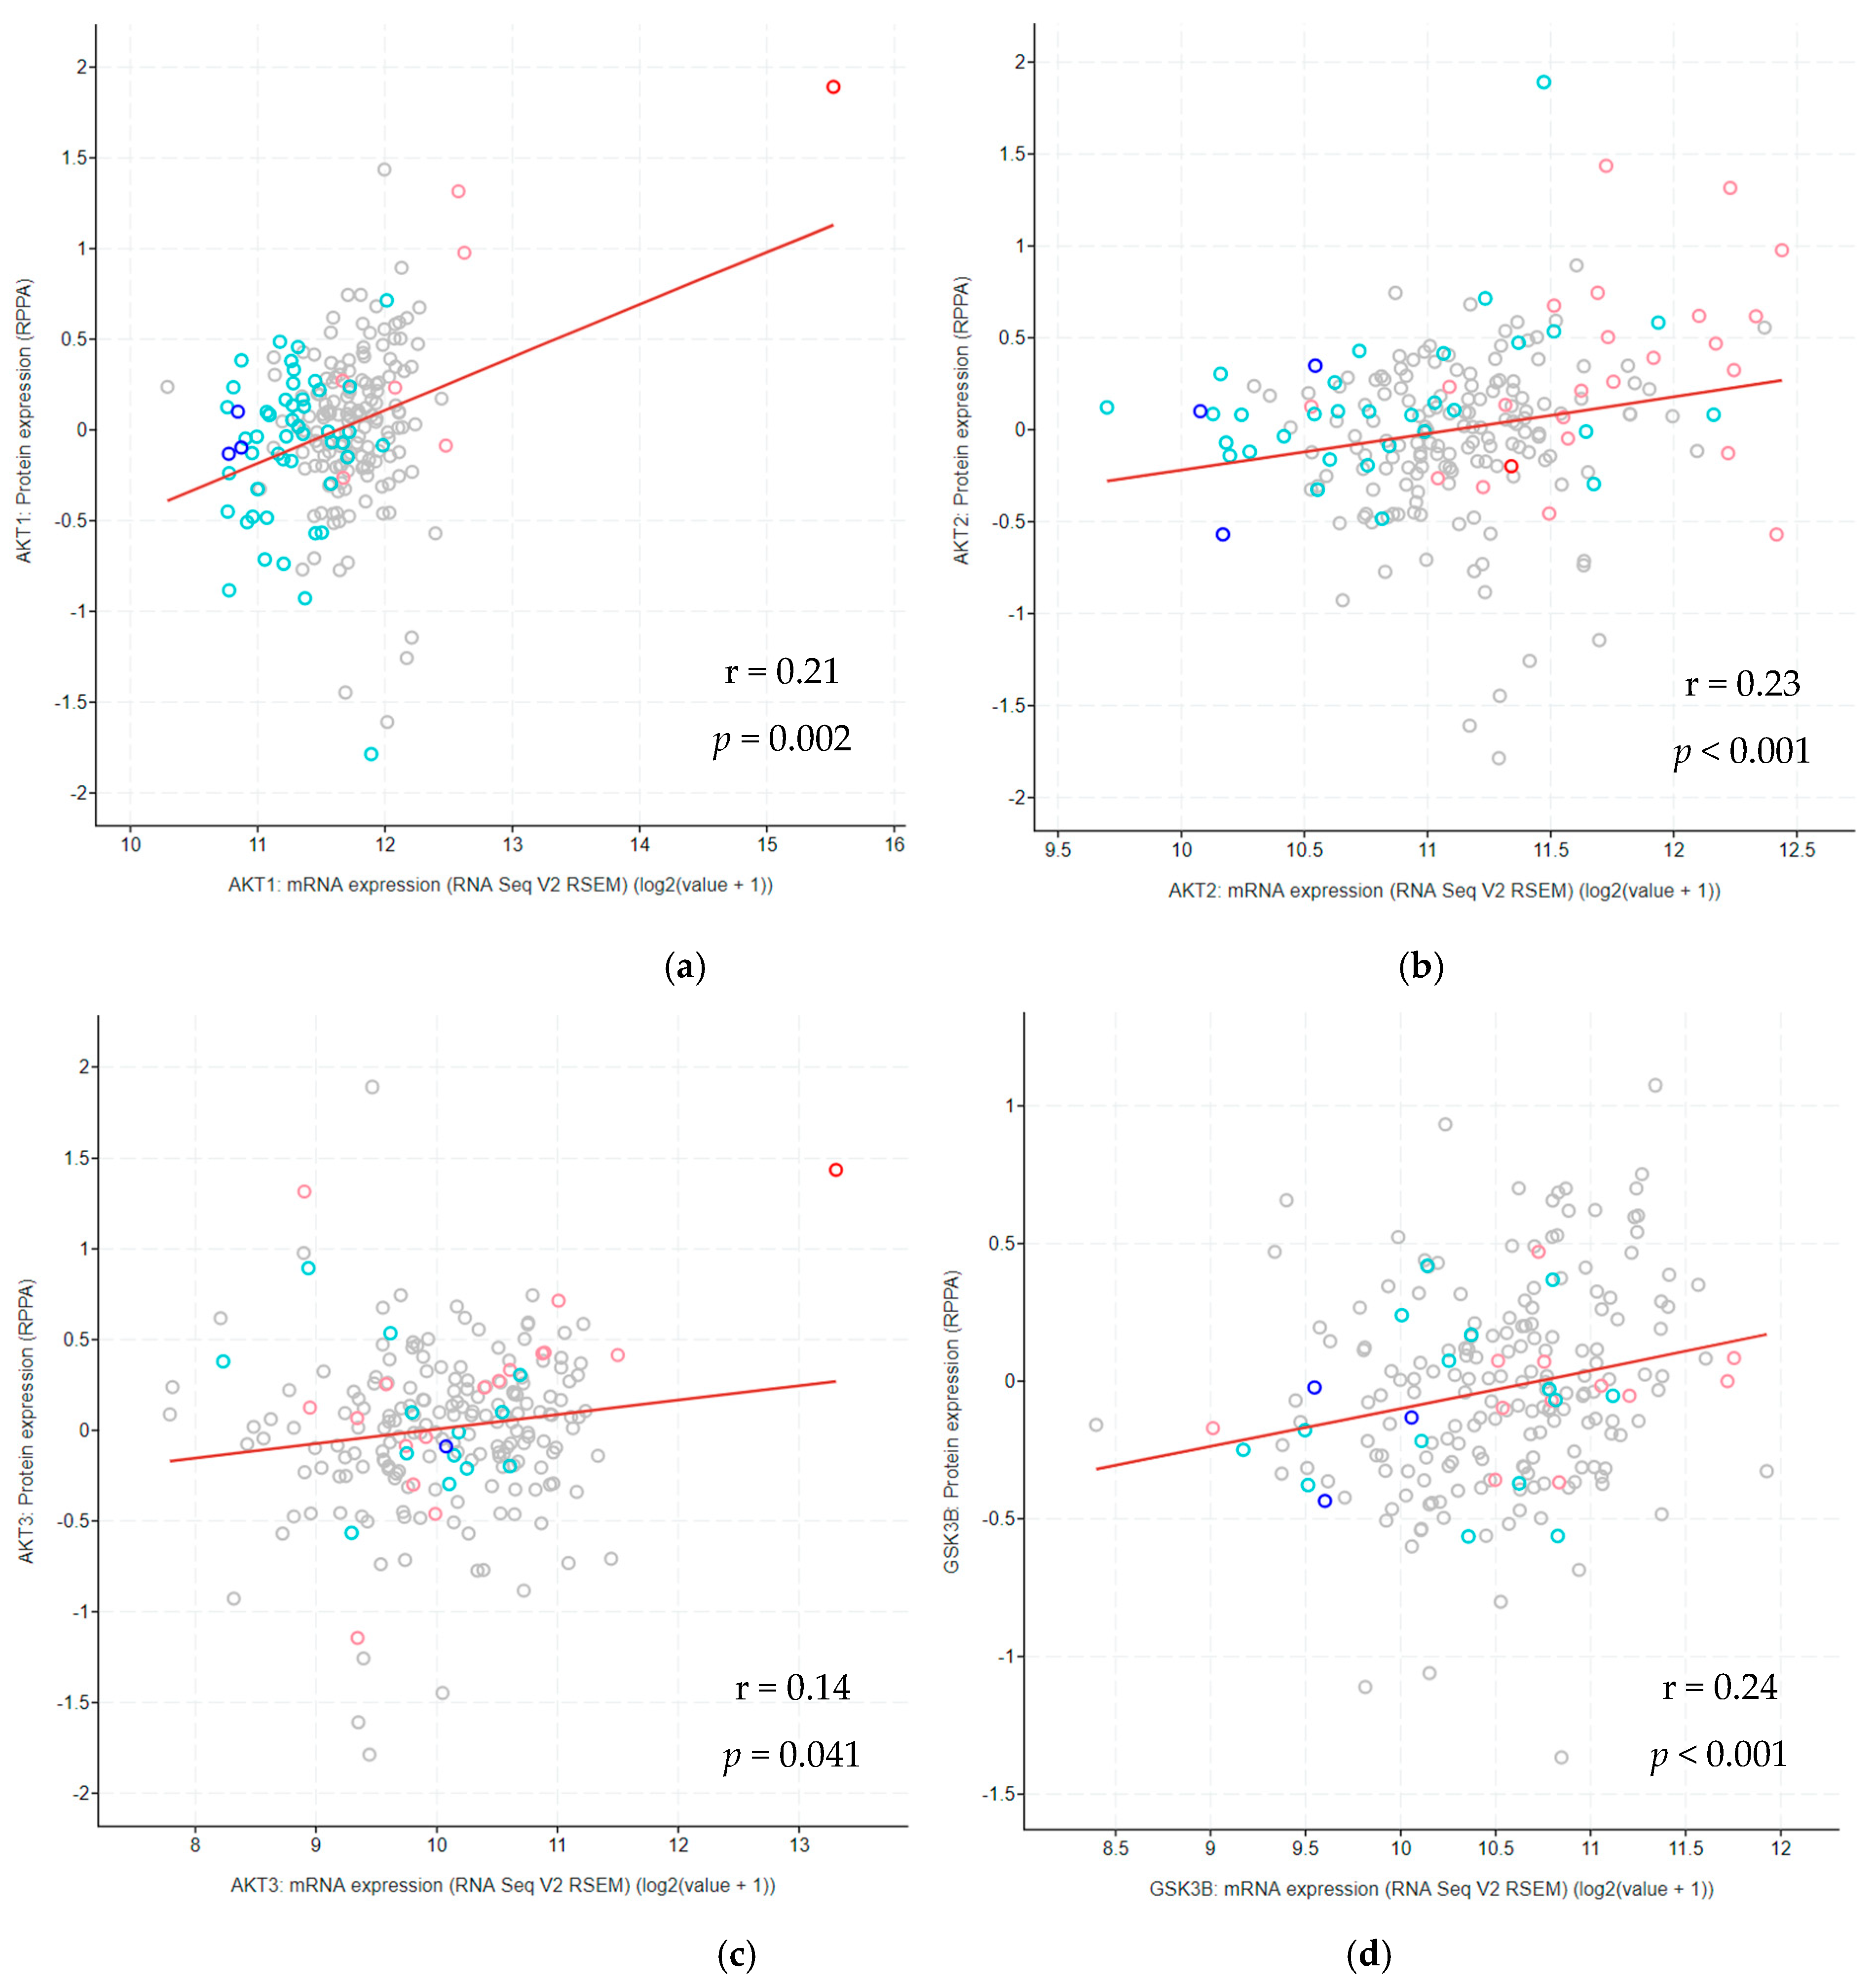
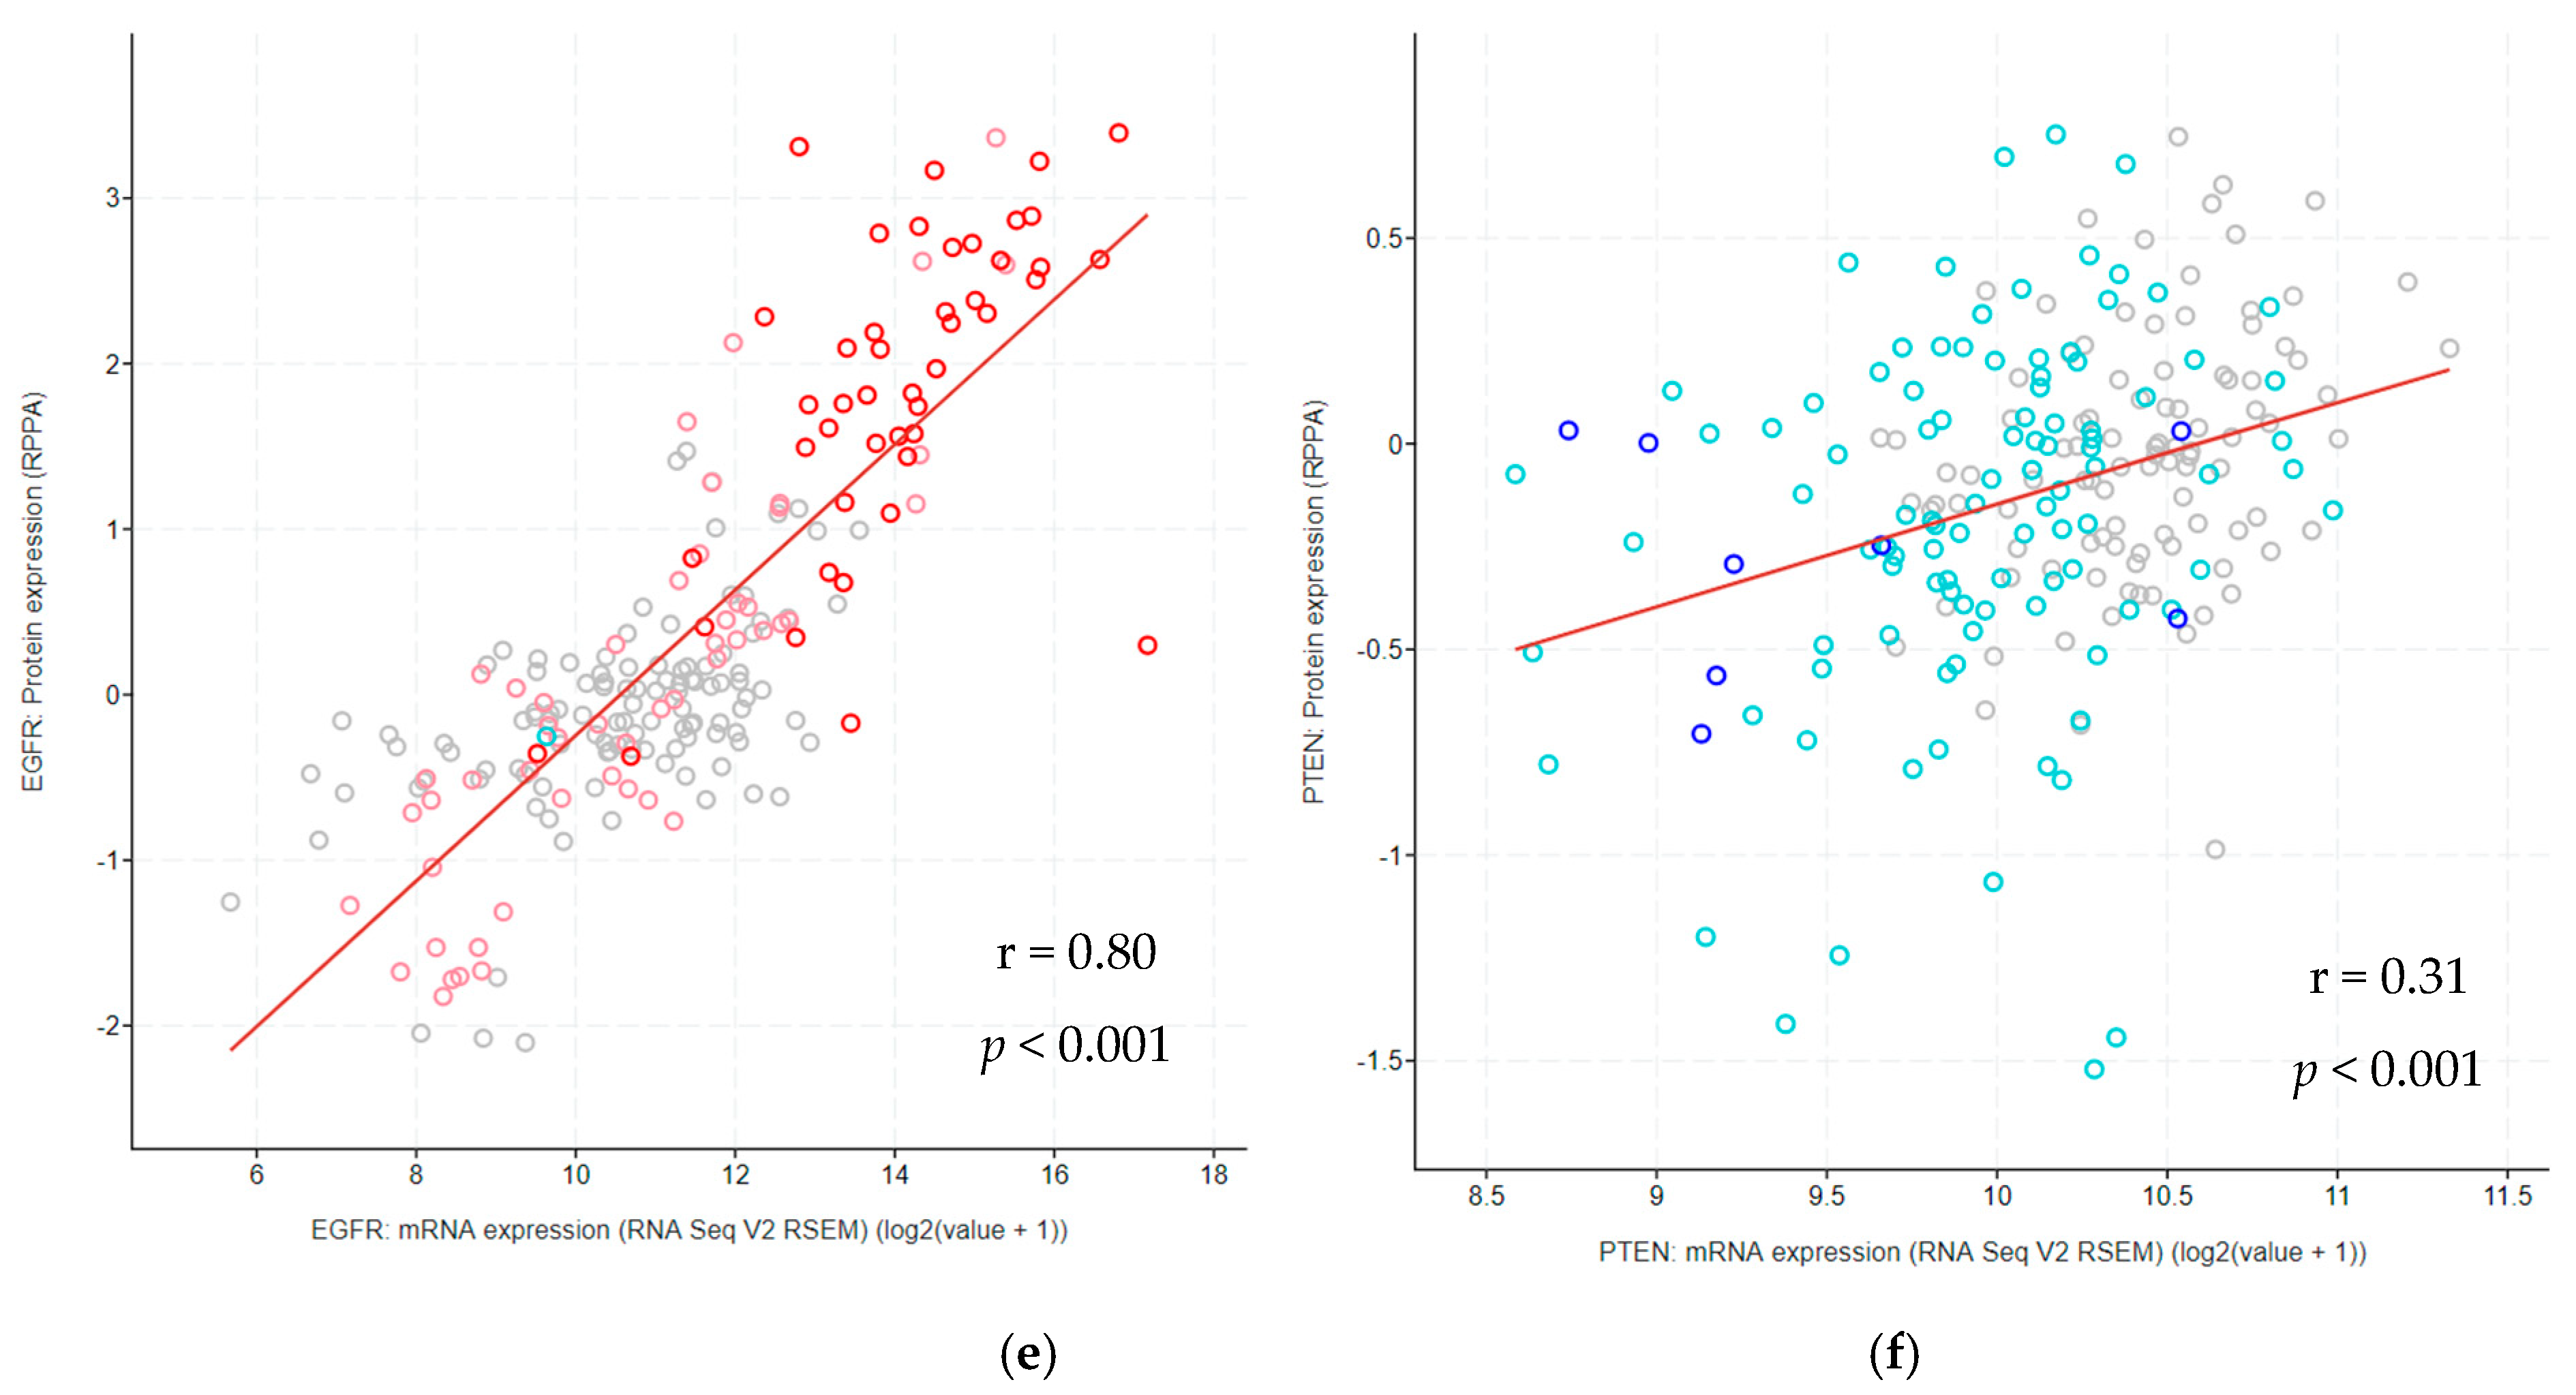
3.11. Correlation between Protein and mRNA Expression Levels Across Glioma Types

Generally, the levels of mRNA expression were accompanied by protein upregulation. Spearman’s test showed a significant positive correlation between mRNA and protein expression for genes EGFR (p < 0.001) and PTEN (p < 0.001) in DA, AKT1, AKT2, and GSK3β (p < 0.05), and EGFR and PTEN (p < 0.001) in AA, and AKT2 (p = 0.031), GSK3β (p = 0.025) and EGFR (p < 0.001) in GBM (Table 6). As shown in Table 6, the EGFR gene’s mRNA expression showed the strongest correlation with its protein expression in all three pathohistological types of gliomas. Moreover, looking at our total sample, all examined proteins had a statistically significant correlation with mRNA transcription (Figure 3).

4. Discussion

This integrative in silico study demonstrated the frequency of gene changes and their association with transcriptional, epigenetic, and protein expression levels for AKT1, AKT2, AKT3, CHUK, GSK3β, EGFR, PTEN, and PIK3AP1 genes in different types and grades of diffuse brain gliomas. Our investigation on 751 gliomas showed genetic changes of PTEN in 76%, PIK3AP1 and CHUK in 75%, and EGFR in 74% of the total samples. These results show a very high association level of these genes with the complex regulation of the PI3K-AKT-mTOR pathway. Other tested genes were less frequently altered—AKT2 in 39% of samples, AKT1 in 32% of samples, AKT3 in 19% of samples, while GSK3β showed the lowest frequency of 18% of total samples. The frequency of genetic changes varied between grades, and far more CNA were attributed to GBM when compared to lower grades. When focusing on the most severe grade, a collective frequency for genetic changes of genes EGFR, PIK3AP1, and PTEN amount to 89%, while CHUK was changed in 88% and AKT2 in 43% of GBM samples. Such a high frequency of changes at the genetic level indicates the important role of the AKT pathway in the tumorigenesis of brain gliomas [33]. Our results also showed differences in the roles of individual genes during early and late events of diffuse glioma evolution. Data on CNA show that genes AKT2, AKT3, CHUK, EGFR, PIK3AP1, and PTEN show an increase in copy number alterations with the increased glioma grade. Statistical analysis showed a significant difference in the continuous CNA number of AKT2, AKT3, CHUK, EGFR, PIK3AP1, and PTEN within different grades of diffuse gliomas (Kruskal–Wallis, p < 0.001). Such data suggest that these genes have a role in the progression of higher glioma grades and biological aggression. However, AKT1 and GSK3β genes did not show differences in the continuous number of CNAs between grades (p > 0.05), which might indicate that AKT1 and GSK3β play roles in the initiation of diffuse glioma formation.
The medical significance of protein kinase B (AKT) and its associated signaling pathways is evidenced by numerous studies confirming AKT activation in various types of cancer, including kidney cancer [34], papillary thyroid cancer [35], nasopharyngeal cancer [36], squamous cell carcinoma of the esophagus [37], lung cancer [38], and advanced breast cancer [39]. The genes encoding these kinases showed differences in genetic, epigenetic and the expression status of different isoforms: AKT1, AKT2, and AKT3. The present investigation showed that the AKT1 gene was changed in 15% of DA, 30% of AA and 34% of GBM, while AKT2 was changed in 11% of DA, 33% of AA and 43% of GBM. In contrast, AKT3 showed CNA in only 2% of DA, 19% of AA, and 22% of GBM. Hemizygous deletions were the most common CNA found in the AKT1 gene (26%), while amplifications were the most common CNA for AKT3 (13%) and AKT2 genes (26%). Our further results on methylation patterns show reduced methylation of the AKT1 and AKT2 genes in GBM compared to lower grades (p < 0.05), while the AKT3 gene was methylated significantly higher in GBM (p < 0.001). These data tell us about the important role of methylation that complements genetic changes and contributes to high AKT1, AKT2 expression and decreased AKT3 expression. It is speculated that decreased AKT3 expression improves cell dedifferentiation and tumor progression [40,41]. A significant decrease in methylation was observed for the oncogene AKT1 (p < 0.001) in grade IV in comparison with grades II and III. This was accompanied by a significant increase in its mRNA expression in grade IV (p = 0.002, grade II; p < 0.001, grade III). The results of reduced methylation that enabled enhanced mRNA expression, which were significantly associated with grade IV, suggest an important oncogenic role of the AKT1 gene. Amplifications of the AKT2 gene in 33% of GBM samples with a significant reduction in methylation in grade IV relative to AA (p = 0.047) and DA (p = 0.018) resulted in a significant increase of mRNA expression within GBM in comparison with DA (p = 0.030) and AA (p = 0.018). Protein expression was also significantly positively correlated with increased mRNA expression (p = 0.031) due to frequent amplifications and decreased methylation. This may suggest enhanced activity of the AKT2 oncogene, similar to AKT1 in grade IV and its association with the biological aggressiveness of diffuse gliomas. On the other hand, AKT3 showed a different picture; it significantly increased methylation within the GBM group when compared with lower grades (p < 0.001), which was accompanied by significantly lower mRNA expression in grade IV (p < 0.001). The decrease in AKT3 gene transcription suggests its action as a tumor suppressor. Data reported in another study [2] state that approximately 70% of GBM shows enhanced activation of one of the protein kinase B (AKT) isoforms, which coincides with our results. Western blot analysis of different AKT isoforms showed that in 5/5 samples, AKT2 was active/phosphorylated, and its mRNA expression was positively correlated with grades, while AKT1 and AKT3 were active in 3/5 samples [41]. The same study hypothesized that decreased AKT3 expression leads to the dedifferentiation of cells that acquire stem-like properties and are responsible for GBM progression [41]. Recent research has confirmed this hypothesis by showing that elevated AKT3 expression may delay glioblastoma progression [2,42]. Our results confirm reported investigations and show that AKT1 and AKT2 act as promoters of glioma tumorigenesis, while AKT3 shows a tumor-suppressor role.
The findings on the CHUK gene showed a high proportion of CNA, of which 8% were in grade II (DA), 49% in AA, and 88% in GBM. Despite the lack of literature data on the behavior of CHUK in gliomas, studies on nasopharyngeal carcinomas show decreased staining of CHUK protein in undifferentiated nasopharyngeal cancers in comparison with differentiated ones [43]. Elevated mRNA levels were associated with longer survival in the same study. Such observations are in line with our results in which the largest number of hemizygous deletions of CHUK were found in the grade with the worst prognosis (88% of GBM). DA, which has a better prognosis, had significantly higher expression levels of CHUK mRNA in comparison to AA (p = 0.008) and GBM (p < 0.001). A high percentage of hemizygous deletions (74% of the total sample) of the CHUK gene and increased methylation, which was significantly higher in GBM compared to lower grades (p < 0.001), could explain lower mRNA expression in GBM (p < 0.001) and significantly lower mRNA expression in AA compared to DA (p = 0.008). The results suggest that deletions and increased methylation of this tumor suppressor play a role in diffuse glioma progression.
GSK3β harbored CNA in 11% of DA, 10% of AA, and 21% of GBM. Although our results showed a relatively low proportion of CNA, previous research on human glioma cell culture showed that GSK3β inactivation by point mutations and phosphorylation existed in 67% of glioma samples [44]. These results indicate that GSK3β in tumorigenesis is largely regulated by activation/inactivation via a phosphorylation mechanism and, to a lesser extent, by CNA. In the same study [44], Zhao et al. showed that the increased expression of the active form of GSK3β prevents angiogenesis and tumor growth. Our results show reduced mRNA expression in GBM relative to DA (p = 0.001) and AA (p < 0.001). Hemizygous deletions and amplifications of the GSK3β gene were each found in 9% of samples. Despite significantly lower gene methylation within GBM in comparison with DA and AA (p < 0.001), the integrative analysis showed a decrease in mRNA expression within GBM compared to DA (p = 0.001) and AA (p < 0.001). Based on these results, we conclude that the mRNA expression of GSK3β in GBM is not affected by gene methylation.
The proportion of CNA of the EGFR gene differed significantly between the three pathohistological types. DA had CNA in only 8% of samples, and 41% in AA, while GBM showed a double proportion of CNA (89%) compared to grade III. In our study, 43.6% of GBM showed amplifications and 44.1% had multiple amplifications. Other studies are in concordance with our results and indicate a high frequency of EGFR gene amplification in 57.4% of glioblastomas [45]. Other reports with 45% of glioblastomas having EGFR gene amplification are also consistent with our data [2]. We also showed essential changes at the epigenetic level of the EGFR gene, and significantly reduced methylation of the EGFR gene in GBM compared to DA and AA (p < 0.001). Elevated mRNA expression in GBM was also demonstrated relative to DA (p < 0.001), and protein expression was positively correlated with mRNA expression at all three grades (p < 0.001). Amplification and multiple amplification of EGFR in 37% and 36% of samples, respectively, as well as significantly reduced methylation of this oncogene in GBM (p < 0.001), is accompanied by its increased mRNA expression (p < 0.001). Additionally, a significant increase in mRNA expression in AA in comparison with DA (Mann–Whitney, p < 0.02) was established. This result shows the important role of EGFR in the activation of the PI3K-AKT-mTOR pathway and its involvement in the progression of diffuse gliomas.
Our next candidate, the tumor suppressor PTEN, showed changes in 8% of DA, 50% of AA, and 89% of GBM. Although the other studies show that about 36% [2] and 34.3% [45] of GBM show homozygous deletions, our analysis found only 10% of samples with homozygous deletions, while hemizygous deletions were found in 79% of GBM. Consistent with our results are the outcomes of immunohistochemical analysis of GBM that showed significantly lower expression of PTEN (p < 0.05) in tumor tissue compared to the surrounding healthy brain tissue [46]. In addition to decreased methylation of the PTEN gene in GBM relative to lower grades, CNA within the GBM group was also strongly positively correlated with mRNA expression (p < 0.001), and samples with homozygous deletions showed the lowest mRNA expression values.
The PIK3AP1 gene, coding for TLR (toll-like receptor) adapter protein that links the AKT-mTOR signaling pathway via the PI3K kinase (phosphoinositide 3-kinase) [47], was hit by CNA in 8% of DA, 49% of AA, and 89% of GBM samples. Although the role of this protein in brain gliomas is still insufficiently investigated, recent research performed on cell culture of macrophages and B lymphocytes shows hyperphosphorylation of the PIK3AP1 protein, which enables the activation of PI3K-AKT signaling [48]. Significantly higher mRNA expression in GBM was confirmed compared to DA (p < 0.001) and AA (p = 0.013), suggesting a possible role in PI3K pathway signal transduction in higher grades. Our results show that AA has significantly reduced methylation of PIK3AP1 compared to DA (p < 0.001), and we can assume that reduced methylation in GBM might affect the enhanced expression, although data on PIK3AP1 methylation in GBM were not available.
Our previous studies on primary brain tumors revealed the importance of the molecular profile in tumorigenesis and progression of intracranial tumors [49], as well as the recognizable molecular behavior of astrocytomas of different grades [50]. Such results suggest the importance of upgrading diagnostic and prognostic classification that allows understanding the behavior of tumor cells that have adapted to survive in a highly competitive brain environment. Due to the complexity of PI3K-AKT-mTOR signaling regulation, further research is needed to fully understand this pathway and its role in gliomas.

5. Conclusions

Our in silico analysis shows distinct roles of EGFR-PI3K-AKT-mTOR pathway participants in the tumorigenesis of diffuse brain gliomas. The results of this integrative cBioPortal analysis suggest that genes AKT3, CHUK and PTEN behave like tumor suppressors, while AKT1, AKT2, EGFR, and PIK3AP1 show oncogenic behavior and are involved in enhanced activity of the EGFR-PI3K-AKT-mTOR signaling pathway. On the other hand, GSK3β showed inconsistent behavior, with increased mRNA and protein expression in AA and decreased mRNA expression in GBM, followed by reduced protein expression. Our findings contribute to molecular knowledge of the differences between pathohistological types and grades of diffuse brain gliomas. We have demonstrated that CNAs are specifically associated with a decrease or increase in transcript levels. Furthermore, methylation profiles were consistent with the type of observed genetic changes as well as with protein levels. Additionally, we specified changes associated with higher grades that contribute to progression, as well as those that are constantly appearing across grades and can be characterized as early events. Our results have the potential for improvement in diagnostics and tailored therapies.

Supplementary Materials

Virtual study data are available online at https://www.cbioportal.org/study?id=609e74e2e4b015b63e9eb2d6.

Author Contributions

Conceptualization, P.B. and N.P.-Š.; methodology, A.B., A.K. and N.P.-Š.; software, P.B.; validation, A.B. and A.K.; formal analysis, P.B., A.B. and A.K.; investigation, P.B. and N.P.-Š.; data curation, P.B., A.B. and A.K.; writing—original draft preparation, P.B.; writing—review and editing, A.B., A.K. and N.P.-Š.; visualization, P.B.; supervision, N.P.-Š.; project administration, N.P.-Š.; funding acquisition, N.P.-Š. All authors have read and agreed to the published version of the manuscript.

Funding

This research was funded by the Scientific Centre of Excellence for Basic, Clinical and Translational Neuroscience (project “Experimental and clinical research of hypoxic-ischemic damage in perinatal and adult brain”; GA KK01.1.1.01.0007 funded by the European Union through the European Regional Development Fund).

Institutional Review Board Statement

Data downloaded from a publicly available cBioPortal database does not require ethical approval.

Informed Consent Statement

All patients whose samples were used in this analysis signed informed consent.

Data Availability Statement

Data supporting reported results are contained within the article. The data presented in this study are available on request from the corresponding author. Generated cBioPortal virtual study data are available online at https://www.cbioportal.org/study?id=609e74e2e4b015b63e9eb2d6.

Conflicts of Interest

The authors declare no conflict of interest. The funders had no role in the design of the study; in the collection, analyses, or interpretation of data; in the writing of the manuscript, or in the decision to publish the results.

References

  1. Maimaiti, A.; Jiang, L.; Wang, X.; Shi, X.; Pei, Y.; Hao, Y.; Paerhati, H.; Zibibula, Y.; Abudujielili, A.; Kasimu, M. Identification and validation of an individualized prognostic signature of lower-grade glioma based on nine immune related long non-coding RNA. Clin. Neurol. Neurosurg. 2021, 201, 106464. [Google Scholar] [CrossRef]
  2. Xia, X.; Li, X.; Li, F.; Wu, X.; Zhang, M.; Zhou, H.; Huang, N.; Yang, X.; Xiao, F.; Liu, D.; et al. A novel tumor suppressor protein encoded by circular AKT3 RNA inhibits glioblastoma tumorigenicity by competing with active phosphoinositide-dependent Kinase-1. Mol. Cancer 2019, 18, 131. [Google Scholar] [CrossRef] [Green Version]
  3. Wolin, I.A.; Heinrich, I.A.; Nascimento, A.P.M.; Welter, P.G.; Sosa, L.D.V.; De Paul, A.L.; Zanotto-Filho, A.; Nedel, C.B.; Lima, L.D.; Osterne, V.J.S.; et al. ConBr lectin modulates MAPKs and Akt pathways and triggers autophagic glioma cell death by a mechanism dependent upon caspase-8 activation. Biochimie 2021, 180, 186–204. [Google Scholar] [CrossRef]
  4. Barthel, F.P.; The GLASS Consortium; Johnson, K.C.; Varn, F.S.; Moskalik, A.D.; Tanner, G.; Kocakavuk, E.; Anderson, K.J.; Abiola, O.; Aldape, K.; et al. Longitudinal molecular trajectories of diffuse glioma in adults. Nature 2019, 576, 112–120. [Google Scholar] [CrossRef]
  5. Louis, D.N.; von Deimling, A.; Cavenee, W.K. Diffuse astrocytic and oligodendroglial tumours—Introduction. In WHO Classification of Tumours of the Central Nervous System, 4th ed.; Louis, D.N., Ohgaki, H., Wiestler, O.D., Cavenee, W.K., Eds.; The International Agency for Research on Cancer: Lyon, France, 2016; pp. 15–17. [Google Scholar]
  6. Lasica, A.B.; Jaunmuktane, Z.; Fersht, N.; Kirkman, M.A.; Dixon, L.; Hoskote, C.; Brandner, S.; Samandouras, G. Genomic Prognosticators and Extent of Resection in Molecularly Subtyped World Health Organization Grade II and III Gliomas–A Single-Institution, Nine-Year Data. World Neurosurg. 2021, 15. [Google Scholar] [CrossRef]
  7. Pećina-Šlaus, N.; Kafka, A.; Jerčić, K.G.; Logara, M.; Bukovac, A.; Bakarić, R.; Borovečki, F. Comparable Genomic Copy Number Aberrations Differ across Astrocytoma Malignancy Grades. Int. J. Mol. Sci. 2019, 20, 1251. [Google Scholar] [CrossRef] [PubMed] [Green Version]
  8. Gao, C.; Yuan, X.; Jiang, Z.; Gan, D.; Ding, L.; Sun, Y.; Zhou, J.; Xu, L.; Liu, Y.; Wang, G. Regulation of AKT phosphorylation by GSK3β and PTEN to control chemoresistance in breast cancer. Breast Cancer Res. Treat. 2019, 176, 291–301. [Google Scholar] [CrossRef]
  9. Xu, F.; Na, L.; Li, Y.; Chen, L. Roles of the PI3K/AKT/mTOR signalling pathways in neurodegenerative diseases and tumours. Cell Biosci. 2020, 10, 54. [Google Scholar] [CrossRef] [PubMed] [Green Version]
  10. Jiang, Y.; Liu, J.; Hong, W.; Fei, X.; Liu, R. Arctigenin Inhibits Glioblastoma Proliferation through the AKT/mTOR Pathway and Induces Autophagy. BioMed Res. Int. 2020, 2020, 1–13. [Google Scholar] [CrossRef]
  11. Liu, Y.; Liu, S.; Wu, C.; Huang, W.; Xu, B.; Lian, S.; Wang, L.; Yue, S.; Chen, N.; Zhu, Z. PD-1-Mediated PI3K/Akt/mTOR, Caspase 9/Caspase 3 and ERK Pathways Are Involved in Regulating the Apoptosis and Proliferation of CD4+ and CD8+ T Cells During BVDV Infection in vitro. Front. Immunol. 2020, 11, 467. [Google Scholar] [CrossRef]
  12. Xu, Y.; Jiang, Y.; Wang, Y.; Zhao, Z.; Li, T. LINC00473 rescues human bone marrow mesenchymal stem cells from apoptosis induced by dexamethasone through the PEBP1-mediated Akt/Bad/Bcl-2 signaling pathway. Int. J. Mol. Med. 2020, 47, 171–182. [Google Scholar] [CrossRef] [PubMed]
  13. Zhang, X.; Kan, H.; Liu, Y.; Ding, W. Plumbagin induces Ishikawa cell cycle arrest, autophagy, and apoptosis via the PI3K/Akt signaling pathway in endometrial cancer. Food Chem. Toxicol. 2021, 148, 111957. [Google Scholar] [CrossRef]
  14. Marquard, F.E.; Jücker, M. PI3K/AKT/mTOR signaling as a molecular target in head and neck cancer. Biochem. Pharmacol. 2020, 172, 113729. [Google Scholar] [CrossRef]
  15. Wang, H.; Chen, Z.; Wang, S.; Gao, X.; Qian, M.; Qiu, W.; Zhang, Z.; Zhang, S.; Qi, W.; Sun, X.; et al. TGFβ1-induced beta-site APP-cleaving enzyme 2 upregulation promotes tumorigenesis through the NF-κB signalling pathway in human gliomas. Mol. Oncol. 2020, 14, 407–425. [Google Scholar] [CrossRef]
  16. Luo, L.; Lucas, R.M.; Liu, L.; Stow, J. Signalling, sorting and scaffolding adaptors for Toll-like receptors. J. Cell Sci. 2020, 133, 239194. [Google Scholar] [CrossRef] [PubMed]
  17. Lovšin, E.; Kovač, J.; Tesovnik, T.; Toplak, N.; Perko, D.; Rozmarič, T.; Debeljak, M.; Avčin, T. PIK3AP1 and SPON2 Genes Are Differentially Methylated in Patients With Periodic Fever, Aphthous Stomatitis, Pharyngitis, and Adenitis (PFAPA) Syndrome. Front. Immunol. 2020, 11, 1322. [Google Scholar] [CrossRef]
  18. Shahcheraghi, S.H.; Tchokonte-Nana, V.; Lotfi, M.; Lotfi, M.; Ghorbani, A.; Sadeghnia, H.R. Wnt/beta-catenin and PI3K/Akt/mTOR Signaling Pathways in Glioblastoma: Two Main Targets for Drug Design: A Review. Curr. Pharm. Des. 2020, 26, 1729–1741. [Google Scholar] [CrossRef] [PubMed]
  19. Cerami, E.; Gao, J.; Dogrusoz, U.; Gross, B.E.; Sumer, S.O.; Aksoy, B.A.; Jacobsen, A.; Byrne, C.J.; Heuer, M.L.; Larsson, E.; et al. The cBio Cancer Genomics Portal: An Open Platform for Exploring Multidimensional Cancer Genomics Data. Cancer Discov. 2012, 2, 401–404. [Google Scholar] [CrossRef] [Green Version]
  20. Gao, J.; Aksoy, B.A.; Dogrusoz, U.; Dresdner, G.; Gross, B.; Sumer, S.O.; Sun, Y.; Jacobsen, A.; Sinha, R.; Larsson, E.; et al. Integrative analysis of complex cancer genomics and clinical profiles using the cBioPortal. Sci Signal. 2013, 6, pl1. [Google Scholar] [CrossRef] [Green Version]
  21. Ellrott, K.; Bailey, M.H.; Saksena, G.; Covington, K.R.; Kandoth, C.; Stewart, C.; Hess, J.; Ma, S.; Chiotti, K.E.; McLellan, M.; et al. Scalable Open Science Approach for Mutation Calling of Tumor Exomes Using Multiple Genomic Pipelines. Cell Syst. 2018, 6, 271–281.e7. [Google Scholar] [CrossRef] [PubMed] [Green Version]
  22. Hoadley, K.A.; Yau, C.; Hinoue, T.; Wolf, D.M.; Lazar, A.; Drill, E.; Shen, R.; Taylor, A.M.; Cherniack, A.D.; Thorsson, V.; et al. Cell-of-Origin Patterns Dominate the Molecular Classification of 10,000 Tumors from 33 Types of Cancer. Cell 2018, 173, 291–304.e6. [Google Scholar] [CrossRef] [Green Version]
  23. Taylor, A.M.; Shih, J.; Ha, G.; Gao, G.F.; Zhang, X.; Berger, A.C.; Schumacher, S.E.; Wang, C.; Hu, H.; Liu, J.; et al. Genomic and Functional Approaches to Understanding Cancer Aneuploidy. Cancer Cell 2018, 33, 676–689.e3. [Google Scholar] [CrossRef] [Green Version]
  24. Liu, J.; Lichtenberg, T.; Hoadley, K.A.; Poisson, L.M.; Lazar, A.; Cherniack, A.D.; Kovatich, A.J.; Benz, C.C.; Levine, D.A.; Lee, A.V.; et al. An Integrated TCGA Pan-Cancer Clinical Data Resource to Drive High-Quality Survival Outcome Analytics. Cell 2018, 173, 400–416.e11. [Google Scholar] [CrossRef] [Green Version]
  25. Sanchez-Vega, F.; Mina, M.; Armenia, J.; Chatila, W.K.; Luna, A.; La, K.C.; Dimitriadoy, S.; Liu, D.L.; Kantheti, H.S.; Saghafinia, S.; et al. Oncogenic Signaling Pathways in The Cancer Genome Atlas. Cell 2018, 173, 321–337.e10. [Google Scholar] [CrossRef] [Green Version]
  26. Gao, Q.; Liang, W.-W.; Foltz, S.M.; Mutharasu, G.; Jayasinghe, R.G.; Cao, S.; Liao, W.-W.; Reynolds, S.M.; Wyczalkowski, M.; Yao, L.; et al. Driver Fusions and Their Implications in the Development and Treatment of Human Cancers. Cell Rep. 2018, 23, 227–238.e3. [Google Scholar] [CrossRef] [Green Version]
  27. Bhandari, V.; Hoey, C.; Liu, L.Y.; LaLonde, E.; Ray, J.; Livingstone, J.; Lesurf, R.; Shiah, Y.-J.; Vujcic, T.; Huang, X.; et al. Molecular landmarks of tumor hypoxia across cancer types. Nat. Genet. 2019, 51, 308–318. [Google Scholar] [CrossRef] [PubMed]
  28. Poore, G.D.; Kopylova, E.; Zhu, Q.; Carpenter, C.; Fraraccio, S.; Wandro, S.; Kosciolek, T.; Janssen, S.; Metcalf, J.; Song, S.J.; et al. Microbiome analyses of blood and tissues suggest cancer diagnostic approach. Nature 2020, 579, 567–574. [Google Scholar] [CrossRef] [PubMed]
  29. Mermel, C.H.; Schumacher, S.E.; Hill, B.; Meyerson, M.L.; Beroukhim, R.; Getz, G. GISTIC2.0 facilitates sensitive and confident localization of the targets of focal somatic copy-number alteration in human cancers. Genome Biol. 2011, 12, R41. [Google Scholar] [CrossRef] [PubMed] [Green Version]
  30. Li, B.; Dewey, C.N. RSEM: Accurate transcript quantification from RNA-Seq data with or without a reference genome. BMC Bioinform. 2011, 12, 323. [Google Scholar] [CrossRef] [PubMed] [Green Version]
  31. Wang, L.; Zhao, J.; Li, Y.; Wang, Z.; Kang, S. Genome-wide analysis of DNA methylation in endometriosis using Illumina Human Methylation 450 K BeadChips. Mol. Reprod. Dev. 2019, 86, 491–501. [Google Scholar] [CrossRef] [PubMed]
  32. Ma, X.; Wang, Y.-W.; Zhang, M.Q.; Gazdar, A.F. DNA methylation data analysis and its application to cancer research. Epigenomics 2013, 5, 301–316. [Google Scholar] [CrossRef] [Green Version]
  33. Mu, M.; Niu, W.; Zhang, X.; Hu, S.; Niu, C. LncRNA BCYRN1 inhibits glioma tumorigenesis by competitively binding with miR-619-5p to regulate CUEDC2 expression and the PTEN/AKT/p21 pathway. Oncogene 2020, 39, 6879–6892. [Google Scholar] [CrossRef] [PubMed]
  34. Guo, H.; German, P.; Bai, S.; Barnes, S.; Guo, W.; Qi, X.; Lou, H.; Liang, J.; Jonasch, E.; Mills, G.B.; et al. The PI3K/AKT Pathway and Renal Cell Carcinoma. J. Genet. Genom. 2015, 42, 343–353. [Google Scholar] [CrossRef] [Green Version]
  35. Minna, E.; Romeo, P.; Dugo, M.; De Cecco, L.; Todoerti, K.; Pilotti, S.; Perrone, F.; Seregni, E.; Agnelli, L.; Neri, A.; et al. miR-451a is underexpressed and targets AKT/mTOR pathway in papillary thyroid carcinoma. Oncotarget 2016, 7, 12731–12747. [Google Scholar] [CrossRef] [PubMed]
  36. Qin, L.; Li, X.; Lin, Z.; Li, H.; Mo, Y.; Su, F.; Mo, W.; Yang, Z. EBV-LMP1 regulating AKT/mTOR signaling pathway and WWOX in nasopharyngeal carcinoma. Int. J. Clin. Exp. Pathol 2017, 10, 8619–8625. [Google Scholar] [PubMed]
  37. Song, M.; Liu, X.; Liu, K.; Zhao, R.; Huang, H.; Shi, Y.; Zhang, M.; Zhou, S.; Xie, H.; Chen, H.; et al. Targeting AKT with Oridonin Inhibits Growth of Esophageal Squamous Cell Carcinoma In Vitro and Patient-Derived Xenografts In Vivo. Mol. Cancer Ther. 2018, 17, 1540–1553. [Google Scholar] [CrossRef] [Green Version]
  38. Chen, G.; Park, D.; Magis, A.T.; Behera, M.; Ramalingam, S.S.; Owonikoko, T.K.; Sica, G.L.; Ye, K.; Zhang, C.; Chen, Z.; et al. Mcl-1 Interacts with Akt to Promote Lung Cancer Progression. Cancer Res. 2019, 79, 6126–6138. [Google Scholar] [CrossRef] [PubMed] [Green Version]
  39. Xing, Y.; Lin, N.U.; Maurer, M.A.; Chen, H.; Mahvash, A.; Sahin, A.; Akcakanat, A.; Li, Y.; Abramson, V.; Litton, J.; et al. Phase II trial of AKT inhibitor MK-2206 in patients with advanced breast cancer who have tumors with PIK3CA or AKT mutations, and/or PTEN loss/PTEN mutation. Breast Cancer Res. 2019, 21, 1–12. [Google Scholar] [CrossRef] [Green Version]
  40. Majewska, E.; Szeliga, M. AKT/GSK3β Signaling in Glioblastoma. Neurochem. Res. 2017, 42, 918–924. [Google Scholar] [CrossRef] [Green Version]
  41. Joy, A.; Kapoor, M.; Georges, J.; Butler, L.; Chang, Y.; Li, C.; Crouch, A.; Smirnov, I.; Nakada, M.; Hepler, J.; et al. The role of AKT isoforms in glioblastoma: AKT3 delays tumor progression. J. Neuro-Oncology 2016, 130, 43–52. [Google Scholar] [CrossRef] [Green Version]
  42. Paul-Samojedny, M.; Suchanek, R.; Borkowska, P.; Pudełko, A.; Owczarek, A.; Kowalczyk, M.; Machnik, G.; Fila-Daniłow, A.; Kowalski, J. Knockdown of AKT3 (PKBγ) and PI3KCA suppresses cell viability and proliferation and induces the apoptosis of glioblastoma multiforme T98G cells. Biomed. Res. Int. 2014, 2014, 768181. [Google Scholar] [CrossRef] [Green Version]
  43. Xiao, D.; Jia, J.; Shi, Y.; Fu, C.; Chen, L.; Jiang, Y.; Zhou, L.; Liu, S.; Tao, Y. Opposed expression of IKKα: Loss in keratinizing carcinomas and gain in non-keratinizing carcinomas. Oncotarget 2015, 6, 25499–25505. [Google Scholar] [CrossRef] [PubMed] [Green Version]
  44. Zhao, P.; Li, Q.; Shi, Z.; Li, C.; Wang, L.; Liu, X.; Jiang, C.; Qian, X.; You, Y.; Liu, N.; et al. GSK-3β regulates tumor growth and angiogenesis in human glioma cells. Oncotarget 2015, 6, 31901–31915. [Google Scholar] [CrossRef] [PubMed] [Green Version]
  45. An, Z.; Aksoy, O.; Zheng, T.; Fan, Q.-W.; Weiss, W.A. Epidermal growth factor receptor and EGFRvIII in glioblastoma: Signaling pathways and targeted therapies. Oncogene 2018, 37, 1561–1575. [Google Scholar] [CrossRef] [PubMed]
  46. Li, Y.; Ji, F.; Jiang, Y.; Zhao, T.; Xu, C. Correlation analysis of expressions of PTEN and p53 with the value obtained by magnetic resonance spectroscopy and apparent diffusion coefficient in the tumor and the tumor-adjacent area in magnetic resonance imaging for glioblastoma. J. BUON Off. J. Balk. Union Oncol. 2018, 23, 391–397. [Google Scholar]
  47. Yang, Q.; Jiang, W.; Hou, P. Emerging role of PI3K/AKT in tumor-related epigenetic regulation. Semin. Cancer Biol. 2019, 59, 112–124. [Google Scholar] [CrossRef] [PubMed]
  48. Lauenstein, J.U.; Udgata, A.; Bartram, A.; De Sutter, D.; Fisher, D.I.; Halabi, S.; Eyckerman, S.; Gay, N.J. Phosphorylation of the multifunctional signal transducer B-cell adaptor protein (BCAP) promotes recruitment of multiple SH2/SH3 proteins including GRB2. J. Biol. Chem. 2019, 294, 19852–19861. [Google Scholar] [CrossRef] [Green Version]
  49. Bukovac, A.; Kafka, A.; Raguž, M.; Brlek, P.; Dragičević, K.; Müller, D.; Pećina-Šlaus, N. Are We Benign? What Can Wnt Signaling Pathway and Epithelial to Mesenchymal Transition Tell Us about Intracranial Meningioma Progression. Cancers 2021, 13, 1633. [Google Scholar] [CrossRef] [PubMed]
  50. Kafka, A.; Bačić, M.; Tomas, D.; Žarković, K.; Bukovac, A.; Njirić, N.; Mrak, G.; Krsnik, Ž.; Pećina-Šlaus, N. Different behaviour of DVL1, DVL2, DVL3 in astrocytoma malignancy grades and their association to TCF1 and LEF1 upregulation. J. Cell. Mol. Med. 2018, 23, 641–655. [Google Scholar] [CrossRef]
Figure 1. Distribution of mRNA expression obtained by the RSEM method of the examined genes according to the pathohistological type and grade of diffuse gliomas. DA—diffuse astrocytoma; AA—anaplastic astrocytoma; GBM—glioblastoma multiforme.
Cancers 13 03247 g001
Figure 2. Distribution of gene methylation β-values (HM450) within each pathohistological type and grade of glioma. DA—diffuse astrocytoma; AA—anaplastic astrocytoma; GBM—glioblastoma multiforme.
Cancers 13 03247 g002
Figure 3. Correlation of mRNA transcription with protein expression of all diffuse gliomas samples together. The protein expression dependency on mRNA transcription has been shown for the proteins AKT1 (a), AKT2 (b), AKT3 (c), GSK3β (d), EGFR (e) and PTEN (f). Additionally, the figure shows CNA: blue dots—homozygous deletions, turquoise dots—hemizygous deletions, pink dots—amplification, red dots—multiple amplification, gray dots—samples without CNA. Samples with amplifications show increased mRNA expression, while samples with deletions show decreased transcription. Red lines represent regression lines. r—Spearman’s correlation coefficient.
Cancers 13 03247 g003aCancers 13 03247 g003b
Table 1. Age and sex of patients according to pathohistological type and grade of diffuse gliomas.
PHT and GradeAge/YearsSex
MedianIQRMF
DA (grade II)34.5 *,***123626
AA (grade III)44.0 *,**217059
GBM (grade IV)59.0 **,***18340220
Total55.022446305
PHT—pathohistological type; DA—diffuse astrocytoma; AA—anaplastic astrocytoma; GBM—glioblastoma multiforme; M—male; F—female; IQR—interquartile range; *—DA vs. AA (p < 0.001); **—AA vs. GBM (p < 0.001); ***—DA vs. GBM (p < 0.001).
Table 2. Percentages of samples with CNA within each pathohistological type of diffuse gliomas.
GENEPHTNCNA/%
HOMDELHETLOSSDIPLOIDGAINAMP
AKT1DA 620158500
AA 1292267020
GBM 5600276661
AKT2 **,***DA 62368902
AA 12922067101
GBM 56001057331
AKT3 **,***DA 62009820
AA 1291781101
GBM 5600478152
CHUK *,**,***DA 62089200
AA 1291475110
GBM 5600881200
GSK3βDA 62558920
AA 129069040
GBM 5600979110
EGFR *,**,***DA 62029252
AA 12901592219
GBM 56001114444
PTEN *,**,***DA 62089200
AA 1294645000
GBM 56010791100
PIK3AP1 *,**,***DA 62089200
AA 1292475101
GBM 5601881100
DA—diffuse astrocytoma; AA—anaplastic astrocytoma; GBM—glioblastoma multiforme; PHT—pathohistological type; HOMDEL—homozygous deletion; HETLOSS—hemizygous deletion; D—diploid; GAIN—amplification; AMP—multiple amplification; N—number of samples; *—DA vs. AA (p < 0.001); **—AA vs. GBM (p < 0.001); ***—DA vs. GBM (p < 0.001).
Table 3. mRNA expression (RSEM) values of the examined genes within each pathohistological type and grade of glioma.
PHTNmRNA
Expression
GENE
AKT1AKT2AKT3CHUKGSK3βEGFRPTENPIK3AP1
DA
grade II
62M3123.58 *2245.96 *1450.79 *501.64 *1530.27 *1901.81 *1403.18 *311.42 *
IQR712.24785.86632.17140.73594.582082.12337.54289.02
AA
grade III
129M3213.98 *2179.75 *1174.06 *442.53 *1659.60 *2612.05 *1212.54 *364.66 *
IQR1076.78853.40796.81147.41905.055112.99464.74362.59
GBM
grade IV
140M3737.21 *2394.95 *693.48 *383.62*1215.72 *4179.58 *952.07*536.57 *
IQR1778.331223.51414.06128.15693.8214,797.33448.76517.91
PHT—pathohistological type; DA—diffuse astrocytoma; AA—anaplastic astrocytoma; GBM—glioblastoma multiforme; N—number of samples; M—median; IQR—interquartile range; *—p < 0.05.
Table 4. Values of protein expression (RPPA) of the examined genes within each pathohistological type and grade of glioma.
PHTNProtein
Expression
PROTEIN
AKT1/AKT2/AKT3GSK3βEGFRPTEN
DA
grade II
46M−0.024−0.1600.042−0.055
IQR0.3880.5310.4680.467
AA
grade III
99M0.082−0.0510.023−0.162
IQR0.4320.4351.2760.421
GBM
grade IV
213M0.0730.0004−0.1160.018
IQR0.6050.4992.6910.456
PHT—pathohistological type; DA—diffuse astrocytoma; AA—anaplastic astrocytoma; GBM—glioblastoma multiforme; N—number of samples; M—median; IQR—interquartile range.
Table 5. Methylation β-values (HM450) of the examined genes within each pathohistological type and grade of diffuse gliomas.
PHTNMethylationGENE
AKT1AKT2AKT3CHUKGSK3βEGFRPTENPIK3AP1
DA
grade II
62M0.856 *0.075 *0.294 *0.040 *0.108 *0.250 *0.025 *0.796 *
IQR0.0440.0240.0990.0100.0490.1550.0050.083
AA
grade III
129M0.856 *0.073 *0.252 *0.045 *0.095 *0.235 *0.026 *0.707 *
IQR0.0390.0220.1540.0130.0600.1470.0060.238
GBM
grade IV
123M0.096 *0.068 *0.934 *0.105 *0.032 *0.025 *0.014 *-
IQR0.0270.0240.0290.0670.0100.0120.003-
PHT—pathohistological type; DA—diffuse astrocytoma; AA—anaplastic astrocytoma; GBM—glioblastoma multiforme; N—number of samples; HM450—Human Methylation 450 Infinium array; M—median; IQR—interquartile range; *—p < 0.05.
Table 6. Correlation of CNA, methylation and protein expression with mRNA expression in three pathohistological types of glioma.
PHTGENECNA vs. mRNA ExpressionMethylation vs. mRNA ExpressionProtein Expression vs. mRNA Expression
rrr
DA
grade II
AKT10.10−0.150.10
AKT20.21−0.100.12
AKT3−0.06−0.220.27
CHUK0.22−0.16-
GSK3β0.17−0.29 *0.16
EGFR0.25 *−0.32 *0.55 **
PTEN0.28 *−0.020.46 *
PIK3AP10.11−0.28 *-
AA
grade III
AKT10.50 **−0.26 *0.32 *
AKT20.49 **−0.42 **0.29 *
AKT3−0.03−0.45 **0.01
CHUK0.69 **−0.45 **-
GSK3β0.15−0.36 **0.23 *
EGFR0.48 **−0.49 **0.73 **
PTEN0.59 **−0.32 **0.37 **
PIK3AP10.14−0.12-
GBM
grade IV
AKT10.61 **−0.060.24
AKT20.47 **−0.300.27 *
AKT30.050.34 *0.15
CHUK0.56 **0.05-
GSK3β0.30 **0.090.28 *
EGFR0.79 **−0.44 *0.89 **
PTEN0.56 **−0.40 **0.19
PIK3AP10.49 **--
PHT—pathohistological type; DA—diffuse astrocytoma; AA—anaplastic astrocytoma; GBM—glioblastoma multiforme; r—Spearman’s correlation coefficient; *—p < 0.05; **—p < 0.001.
Publisher’s Note: MDPI stays neutral with regard to jurisdictional claims in published maps and institutional affiliations.

