
A Comprehensive Bioinformatics Analysis of Notch Pathways in Bladder Cancer


Simple Summary
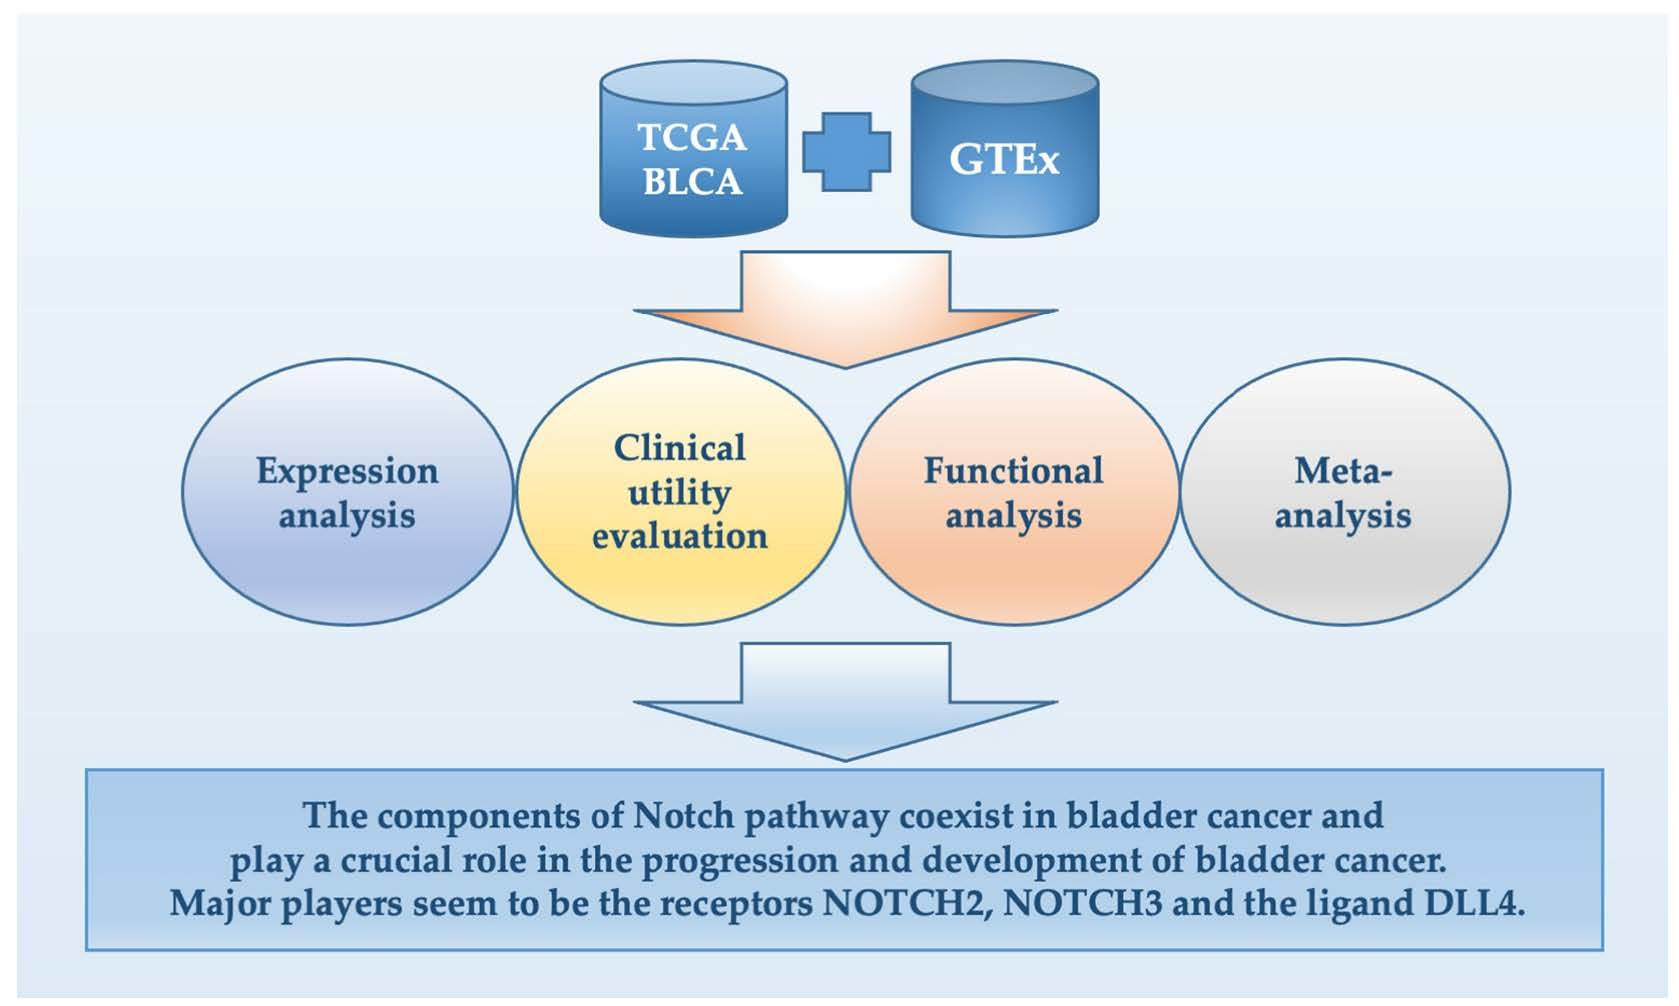
Abstract

1. Introduction
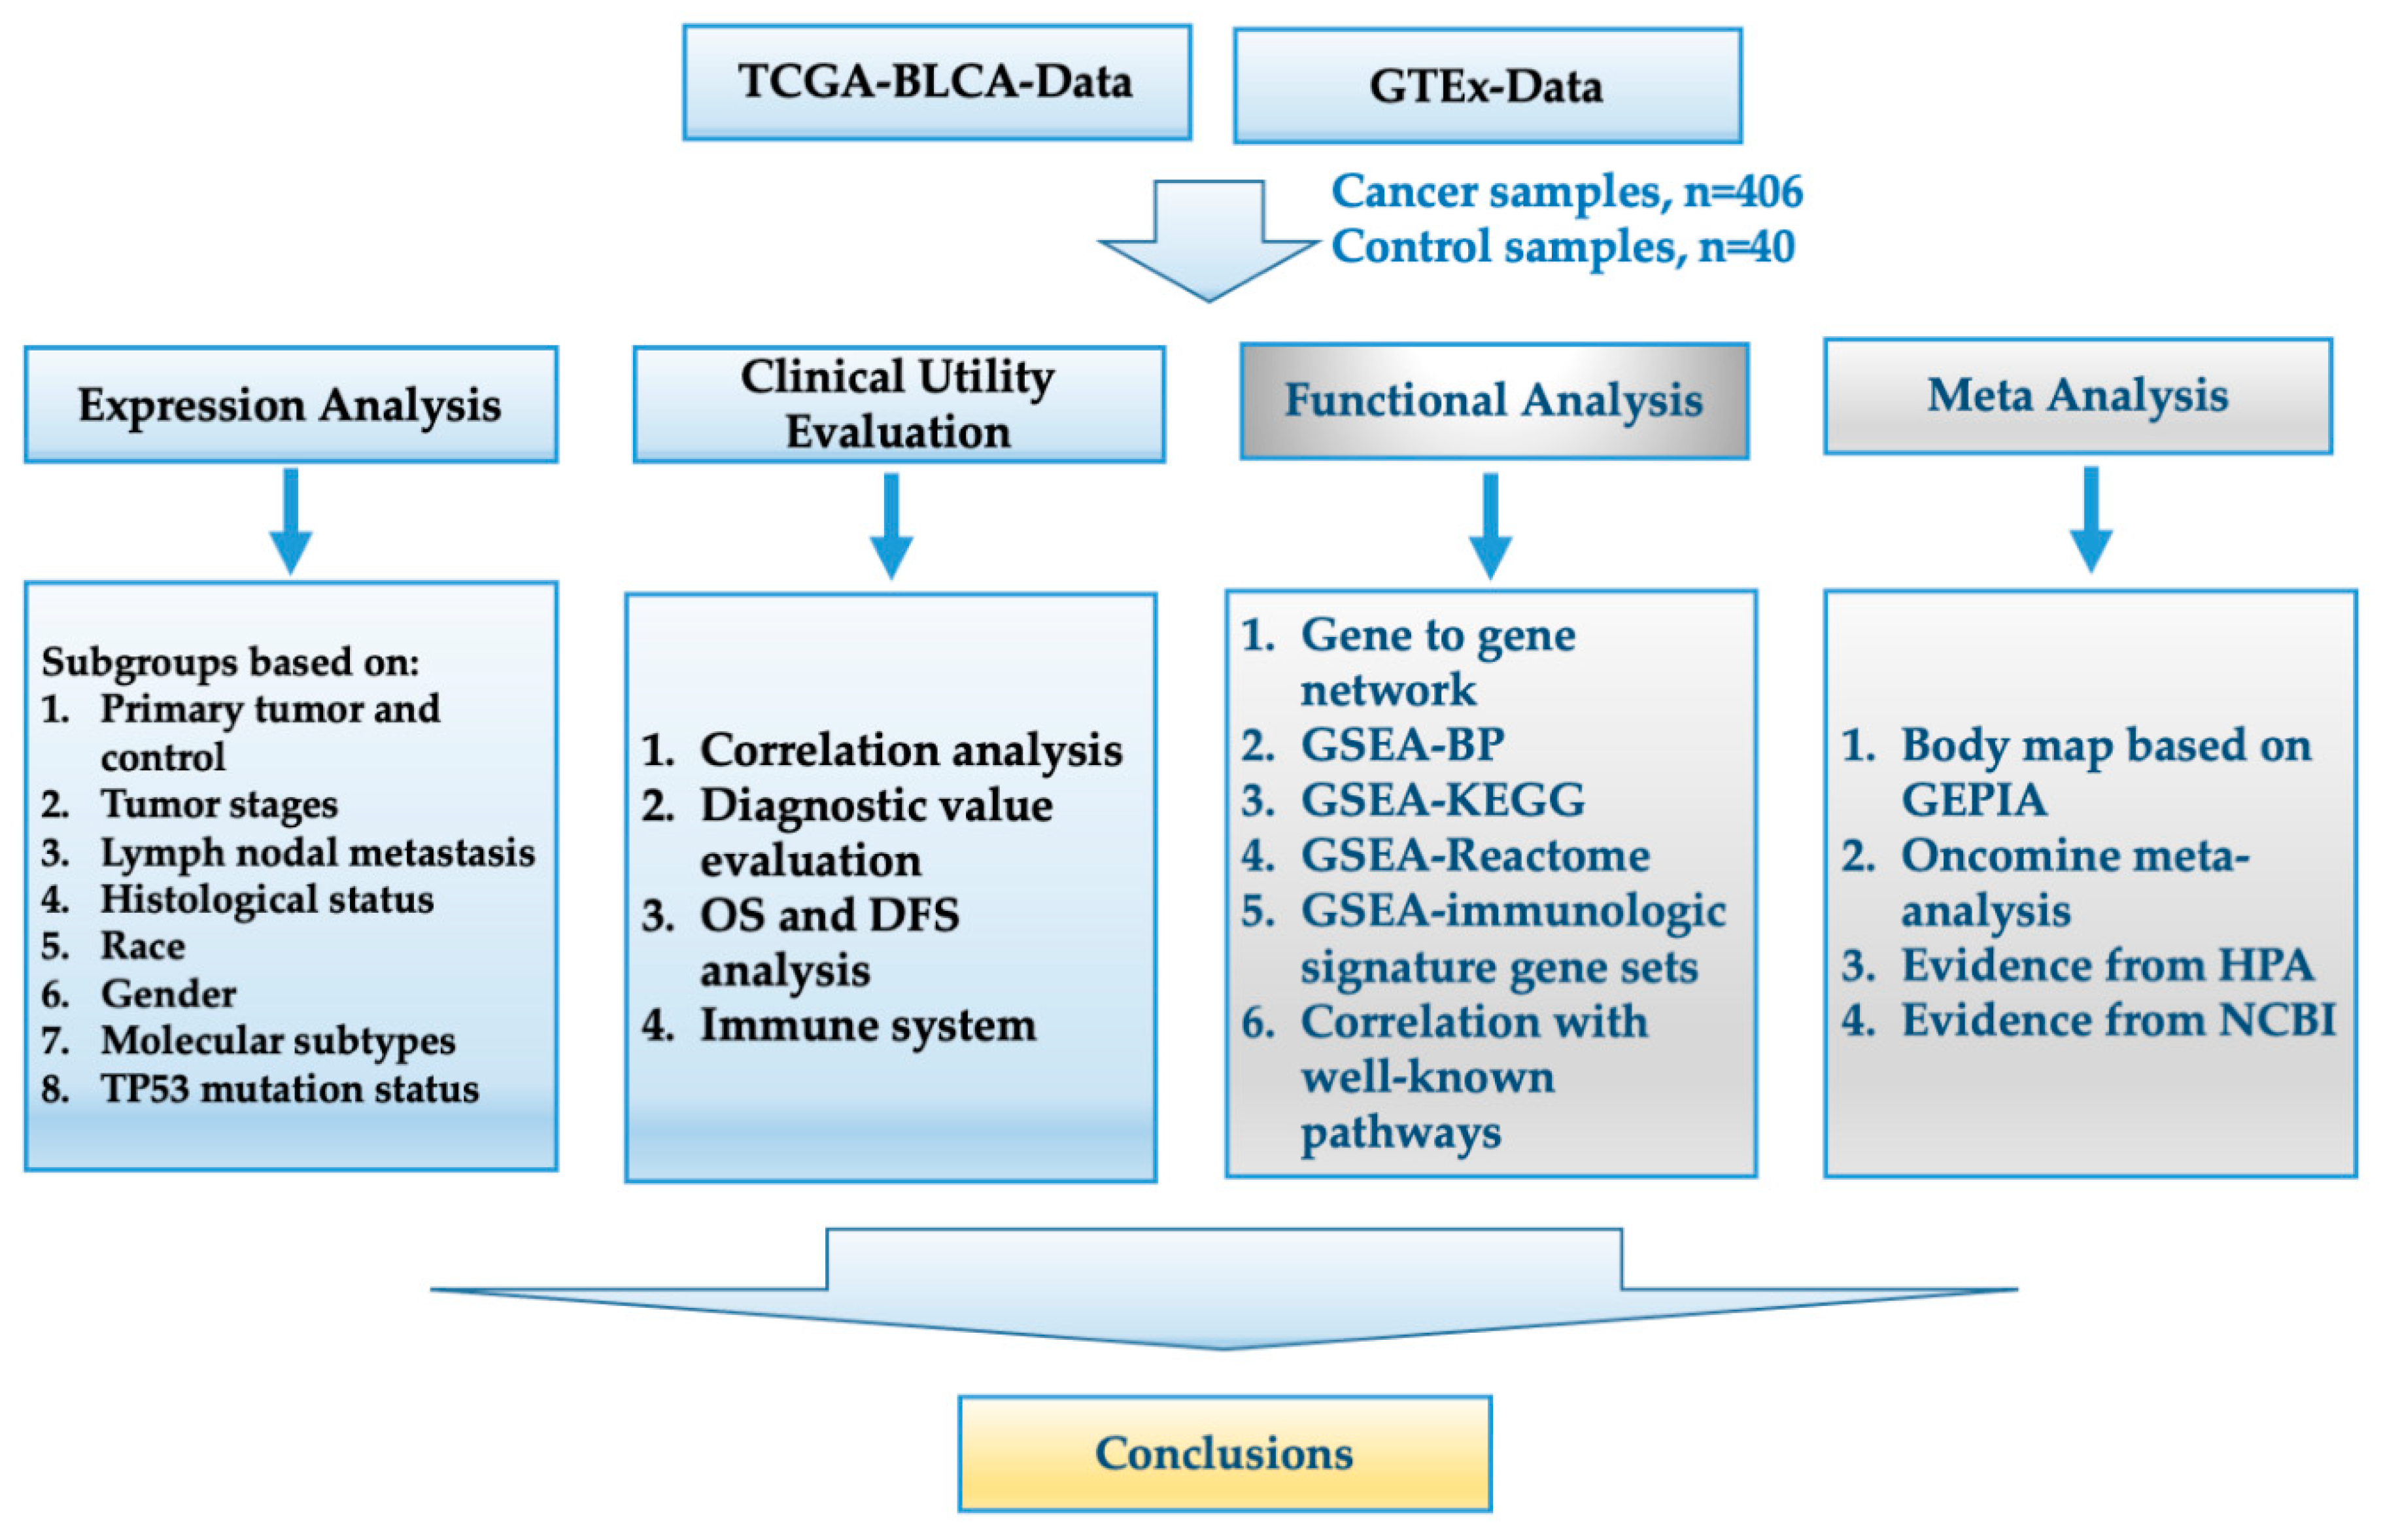
2. Materials and Methods
2.1. Acquisition of Data
2.2. Analysis of Expression Levels in Different Subgroups
2.3. Correlation Analysis and Evaluation of the Diagnostic Value
2.4. Overall Survival (OS) and Disease-Free Survival (DFS) Analyses
2.5. Gene–Gene Interaction (PPI) Network Analysis and Gene Set Enrichment Analysis (GSEA)
2.6. Body Maps of the Target Genes and Oncomine Analysis
2.7. Other Statistical Analyses
3. Results
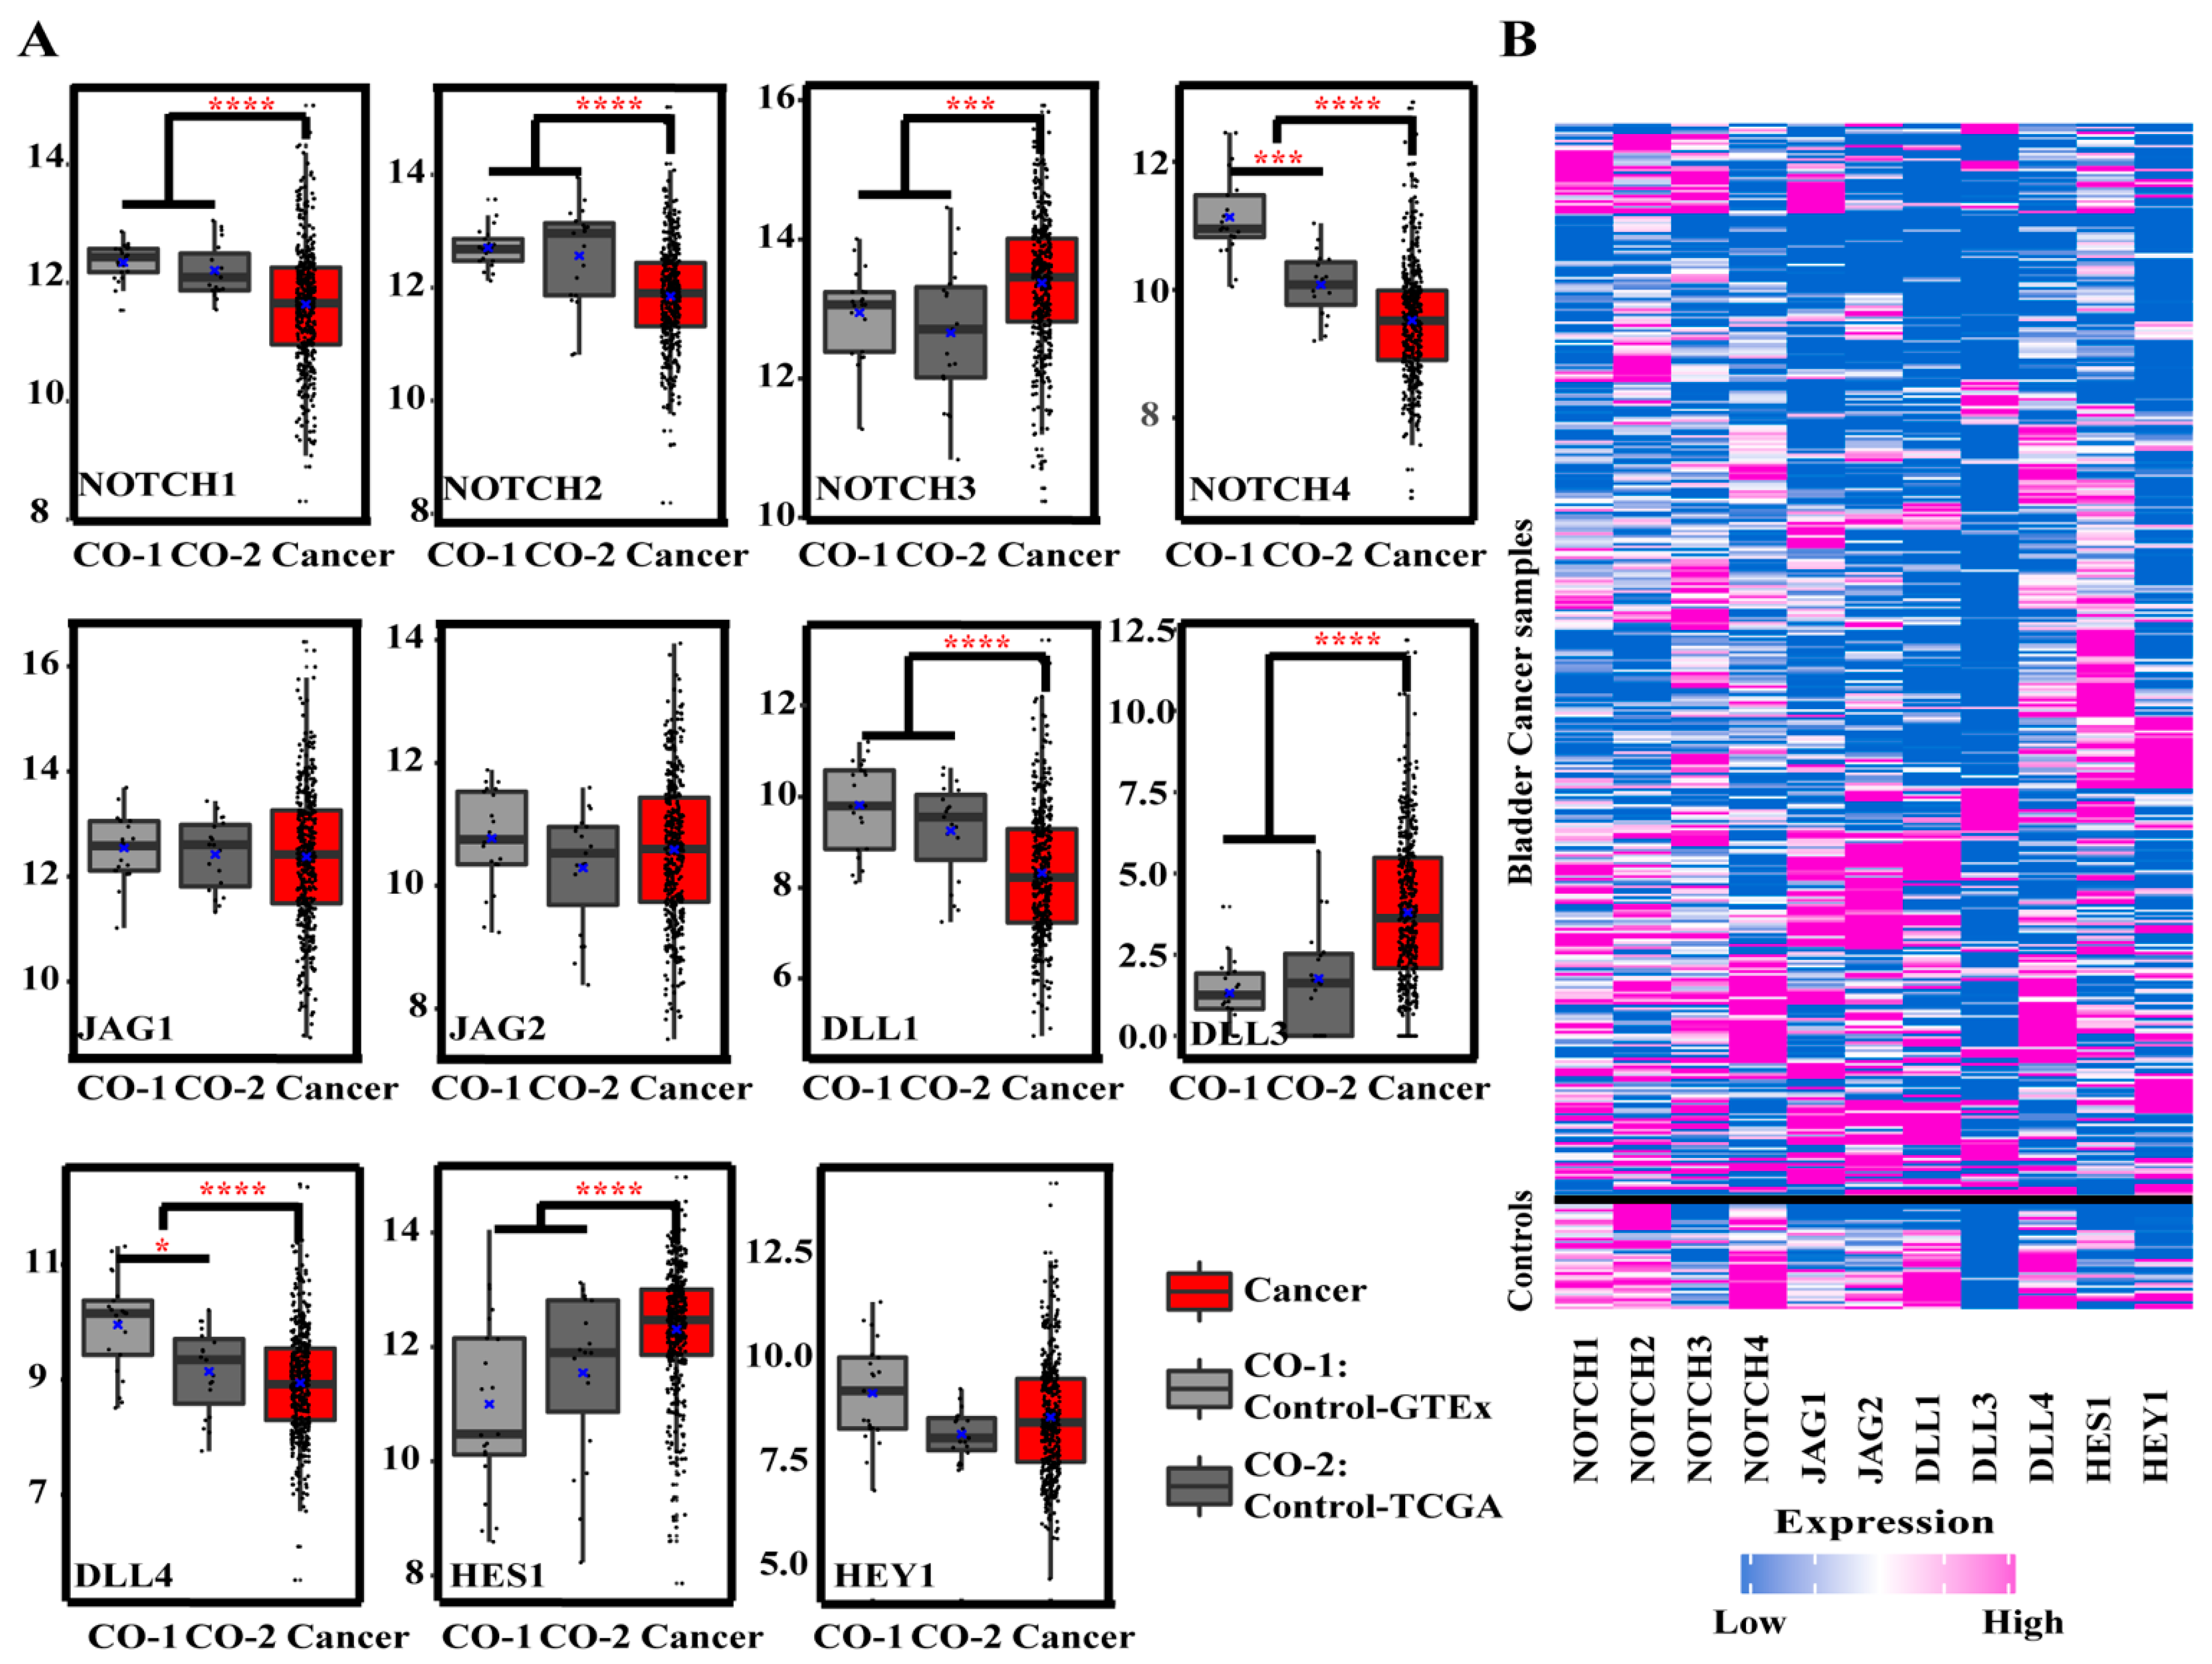
3.1. Gene Expression Analysis
3.1.1. Gene Expression of Notch Pathway-Related Genes in BCa and Controls
3.1.2. Gene Expression in Different Tumor Stages
3.1.3. Gene Expression in Patients Stratified for Lymph Nodal Metastasis
3.1.4. Gene Expression in Papillary (PT) and Non-Papillary Tumors (NPT)
3.1.5. Gene Expression in Patients Stratified for Race and Gender
3.1.6. Gene Expression in Molecular Subtypes
3.1.7. Gene Expression in Patients Stratified for Tumor-Suppressor TP53 Mutation
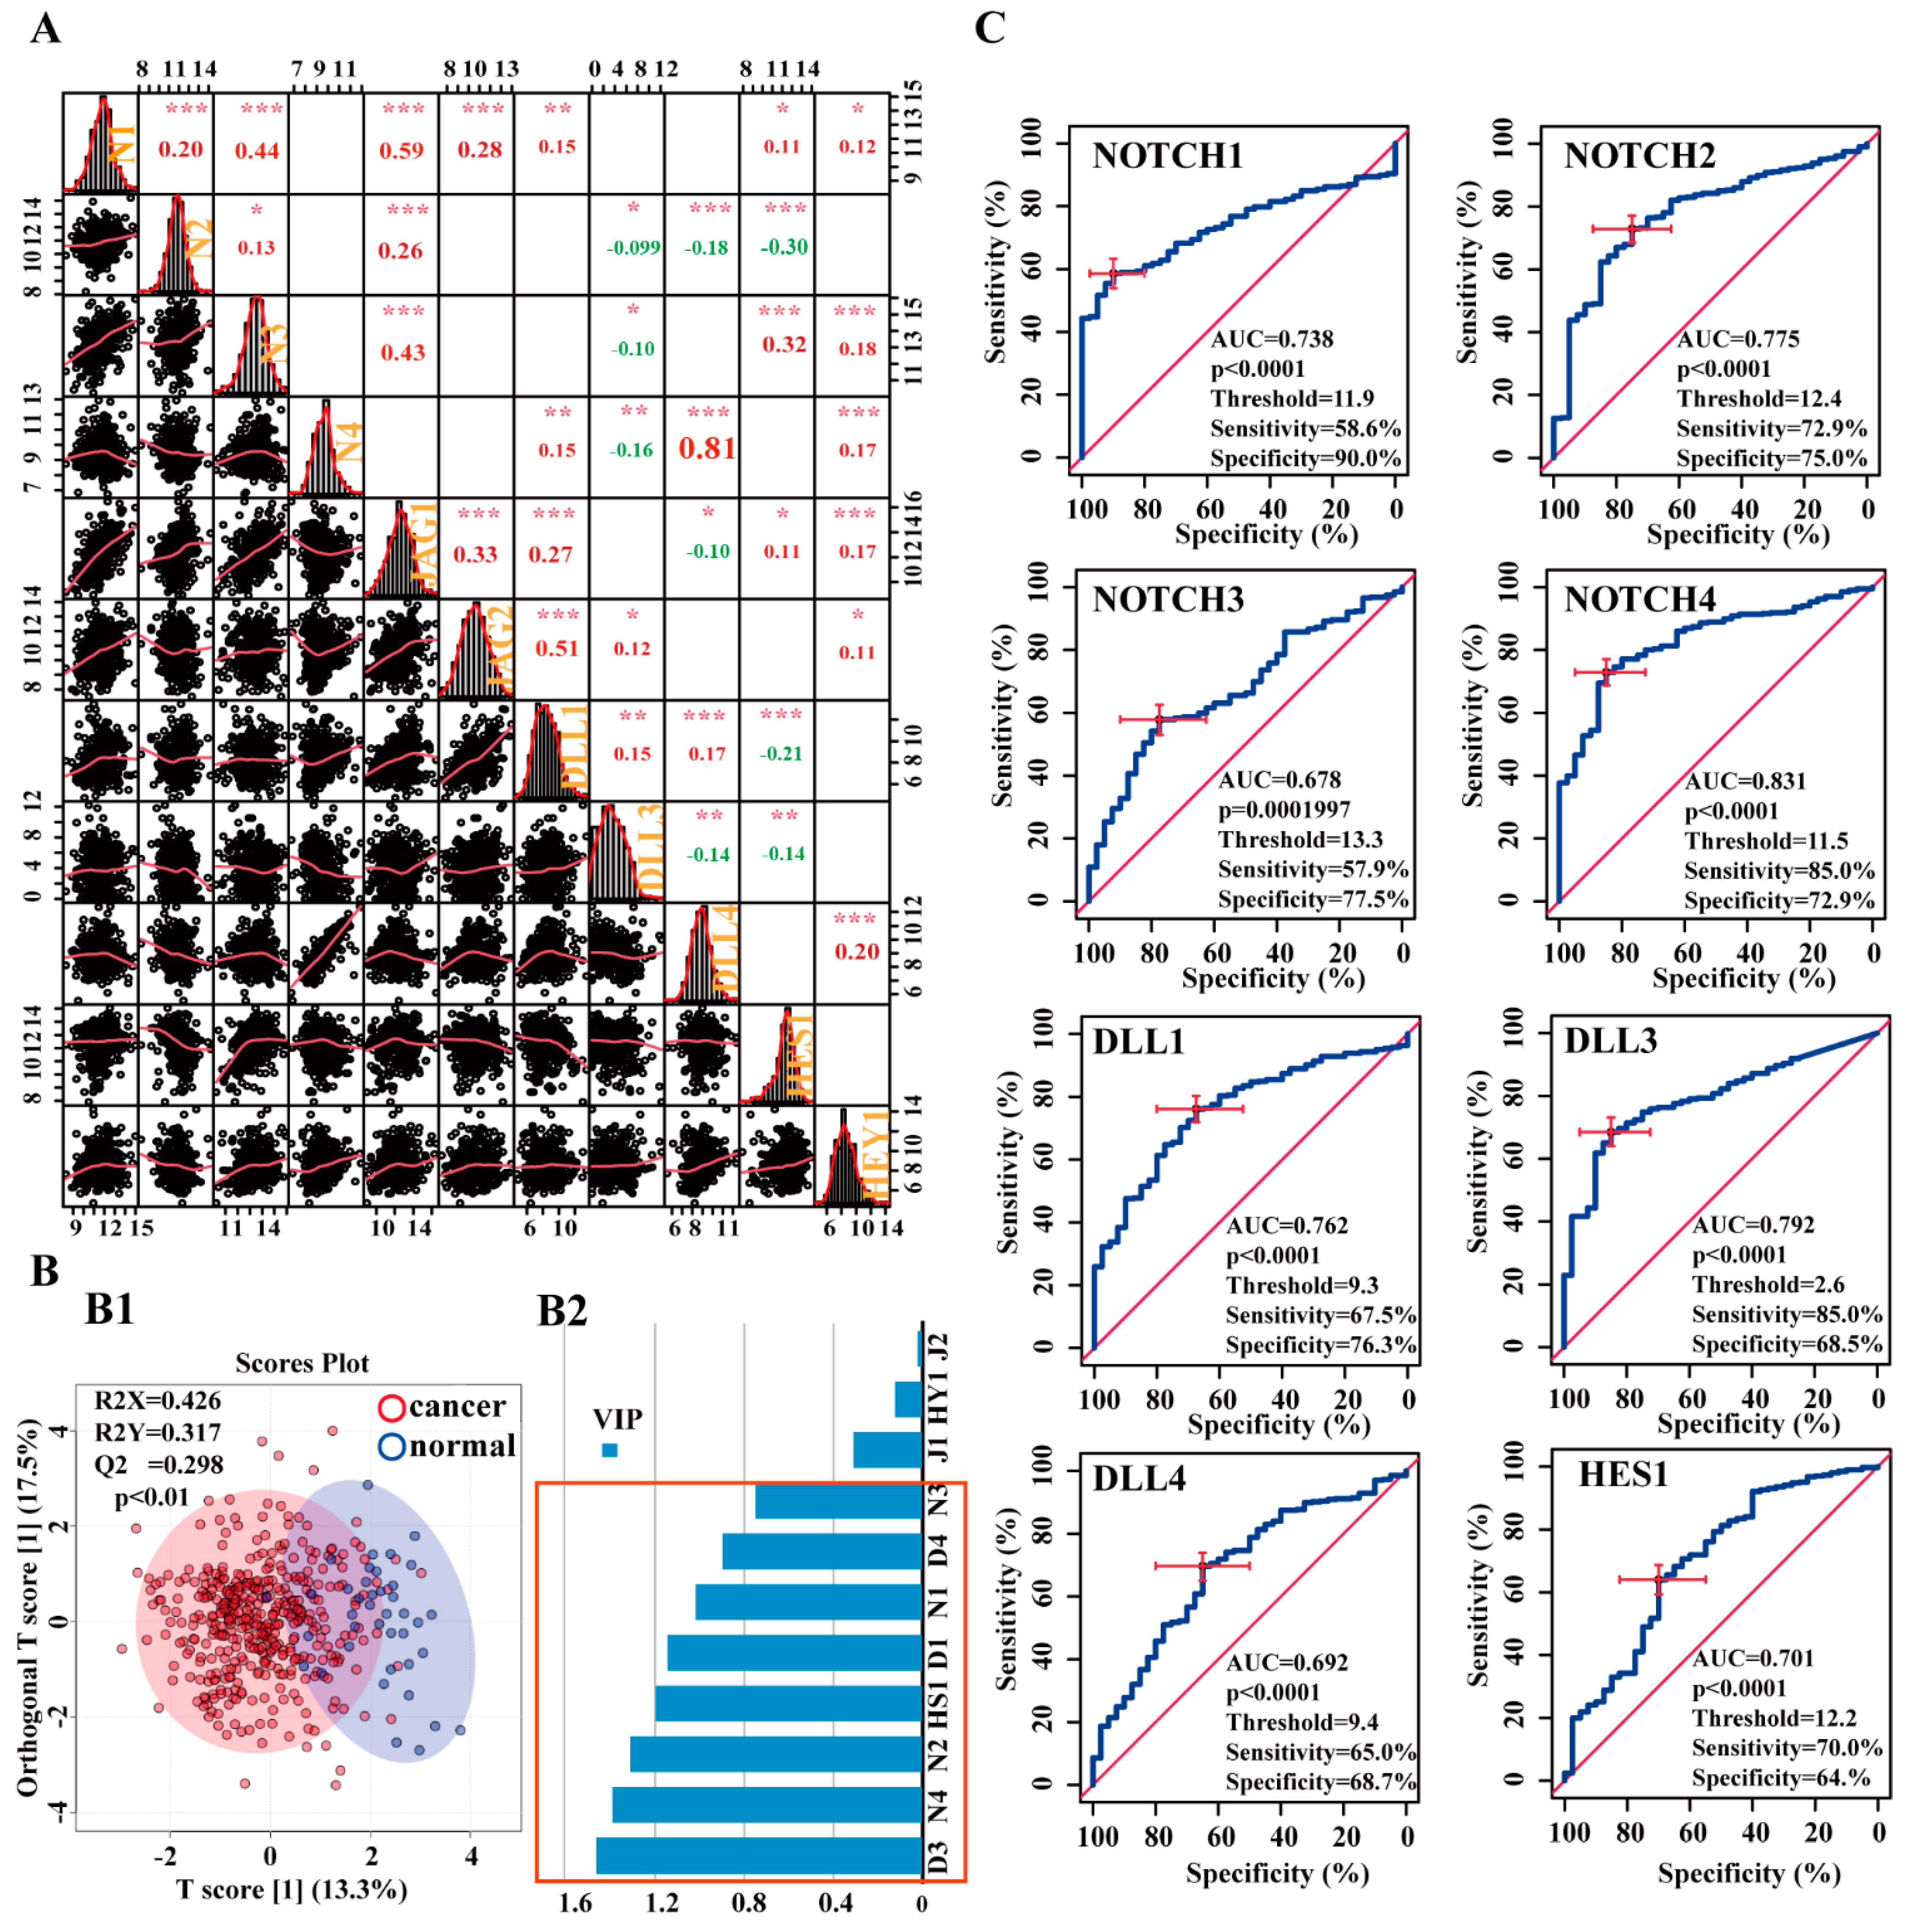
3.2. Correlation and Diagnostic Value of Notch-Related Genes, and Correlation between Notch Pathway, Lymphocyte Subtypes, and Immunomodulators
3.2.1. Correlations between Notch-related genes in the BCa Cohort
3.2.2. Potential Diagnostic Value of Notch-Related Genes
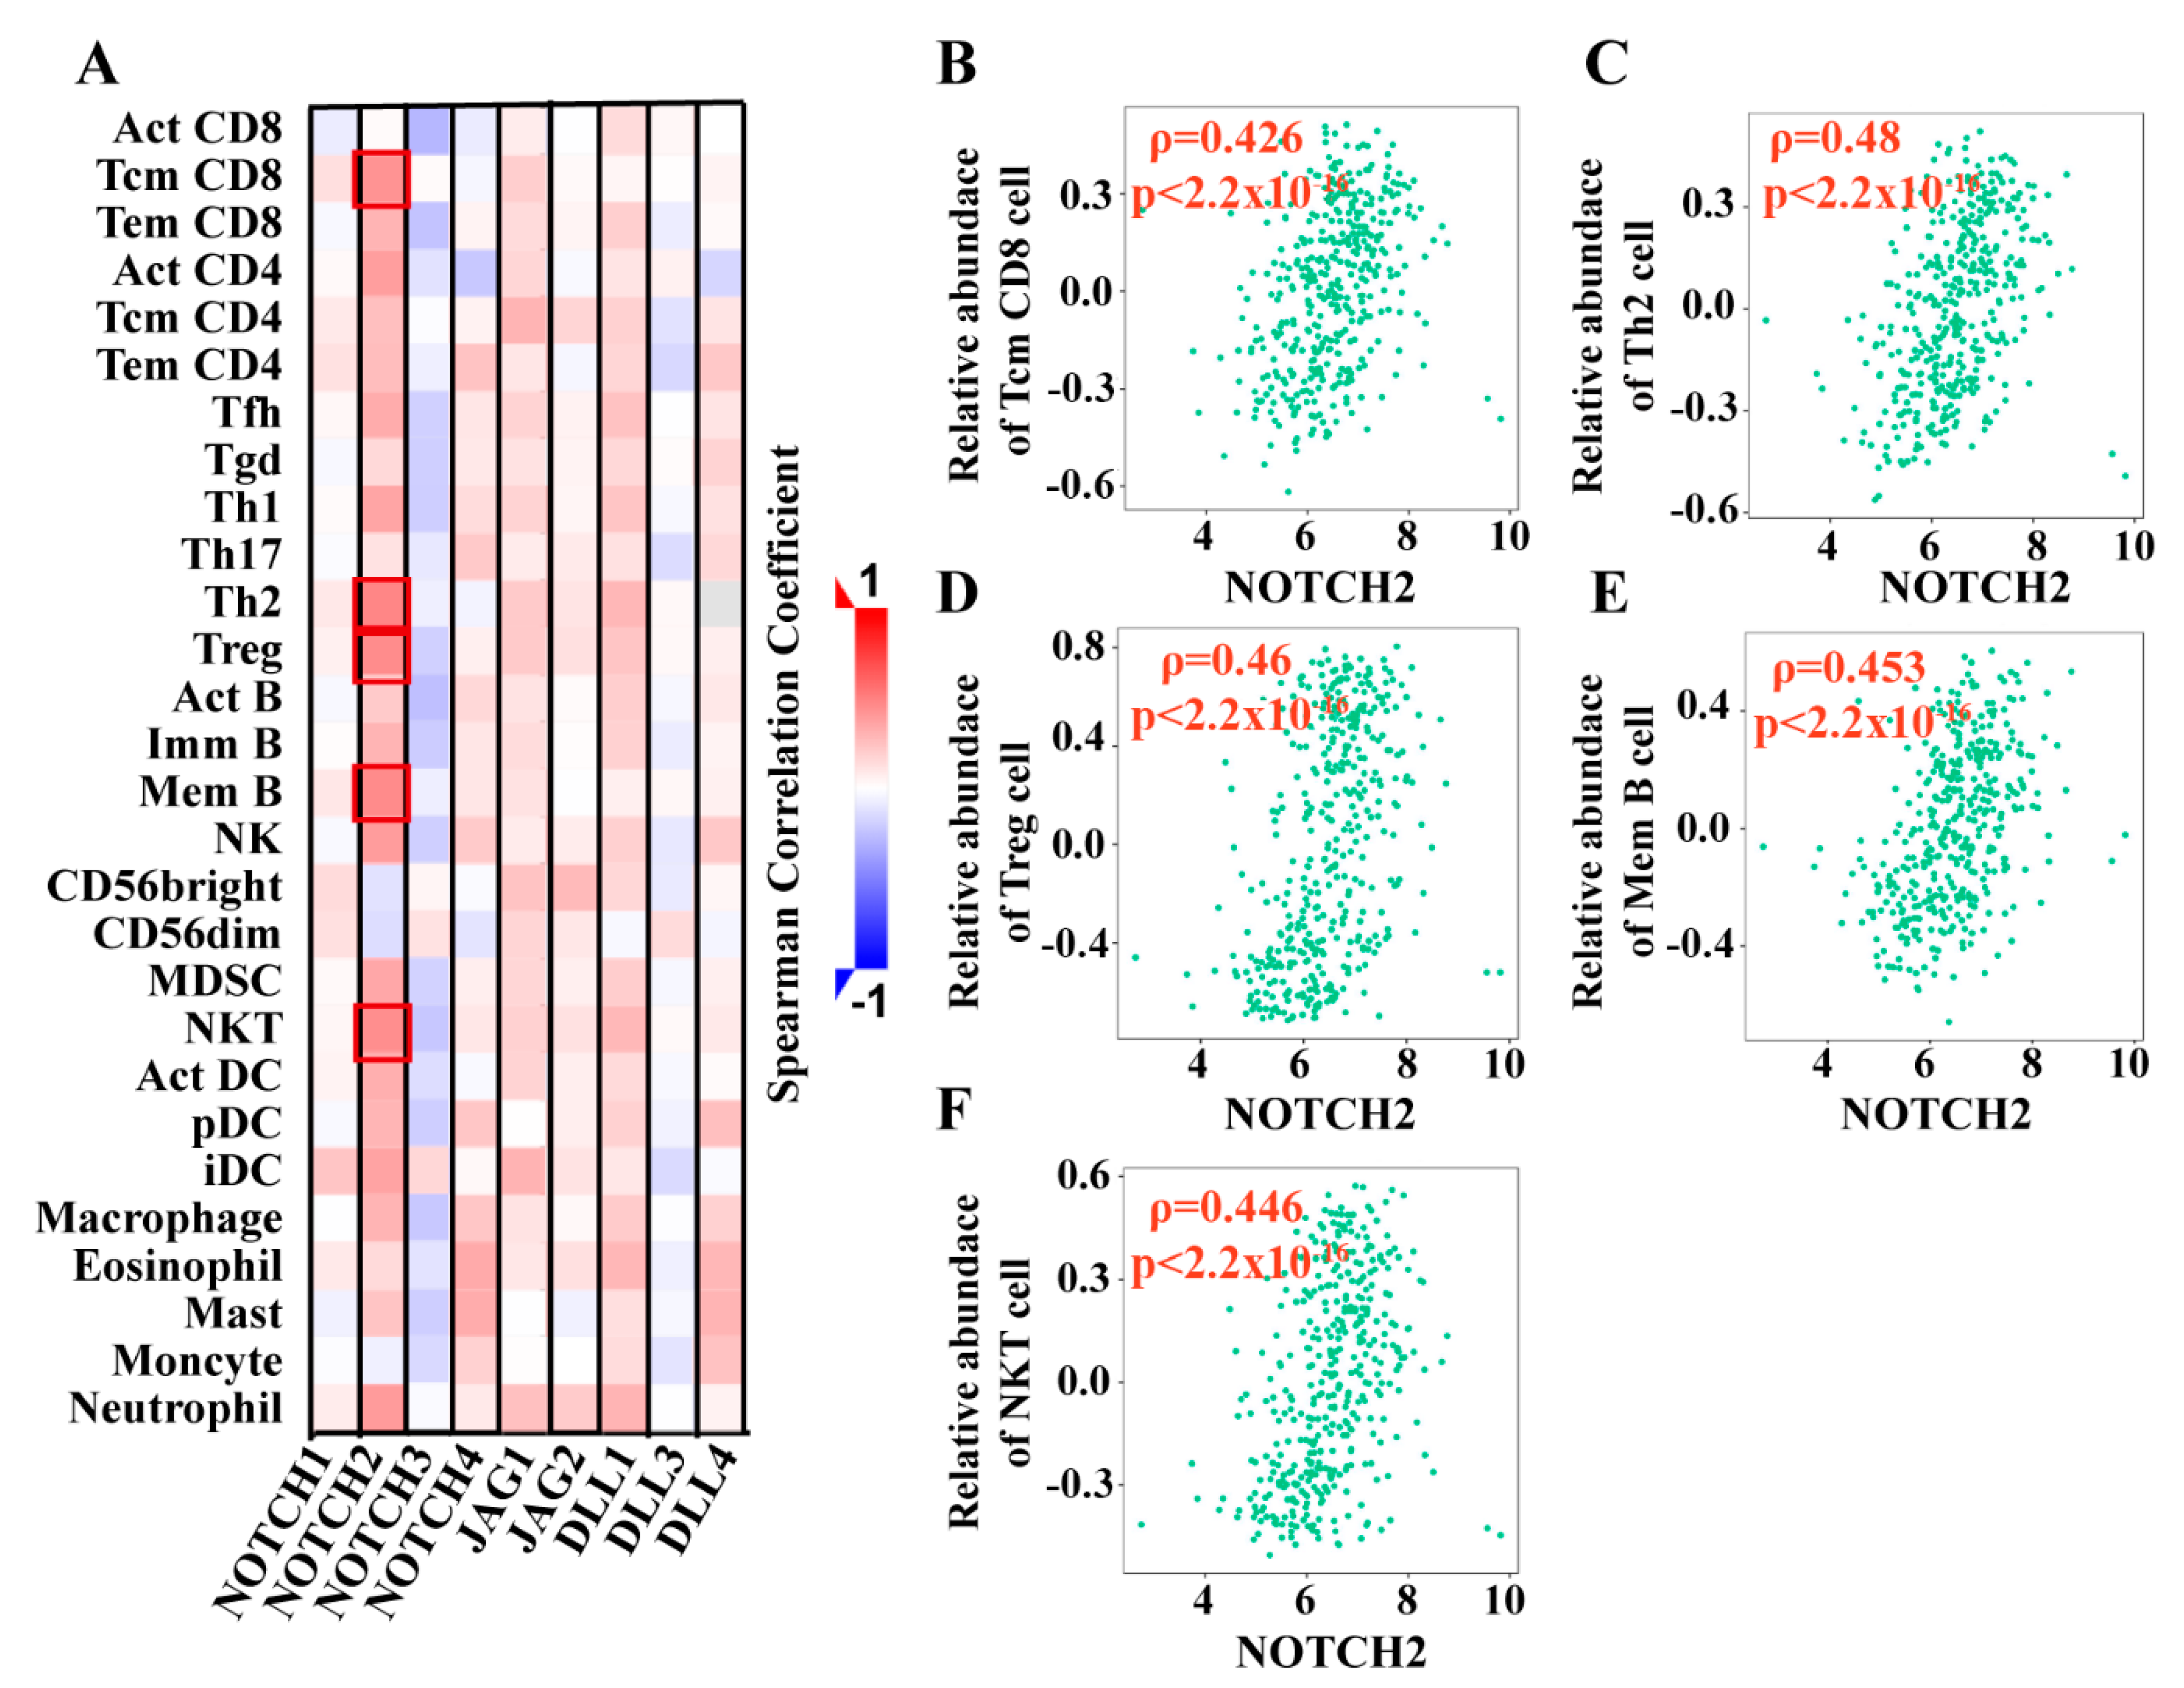
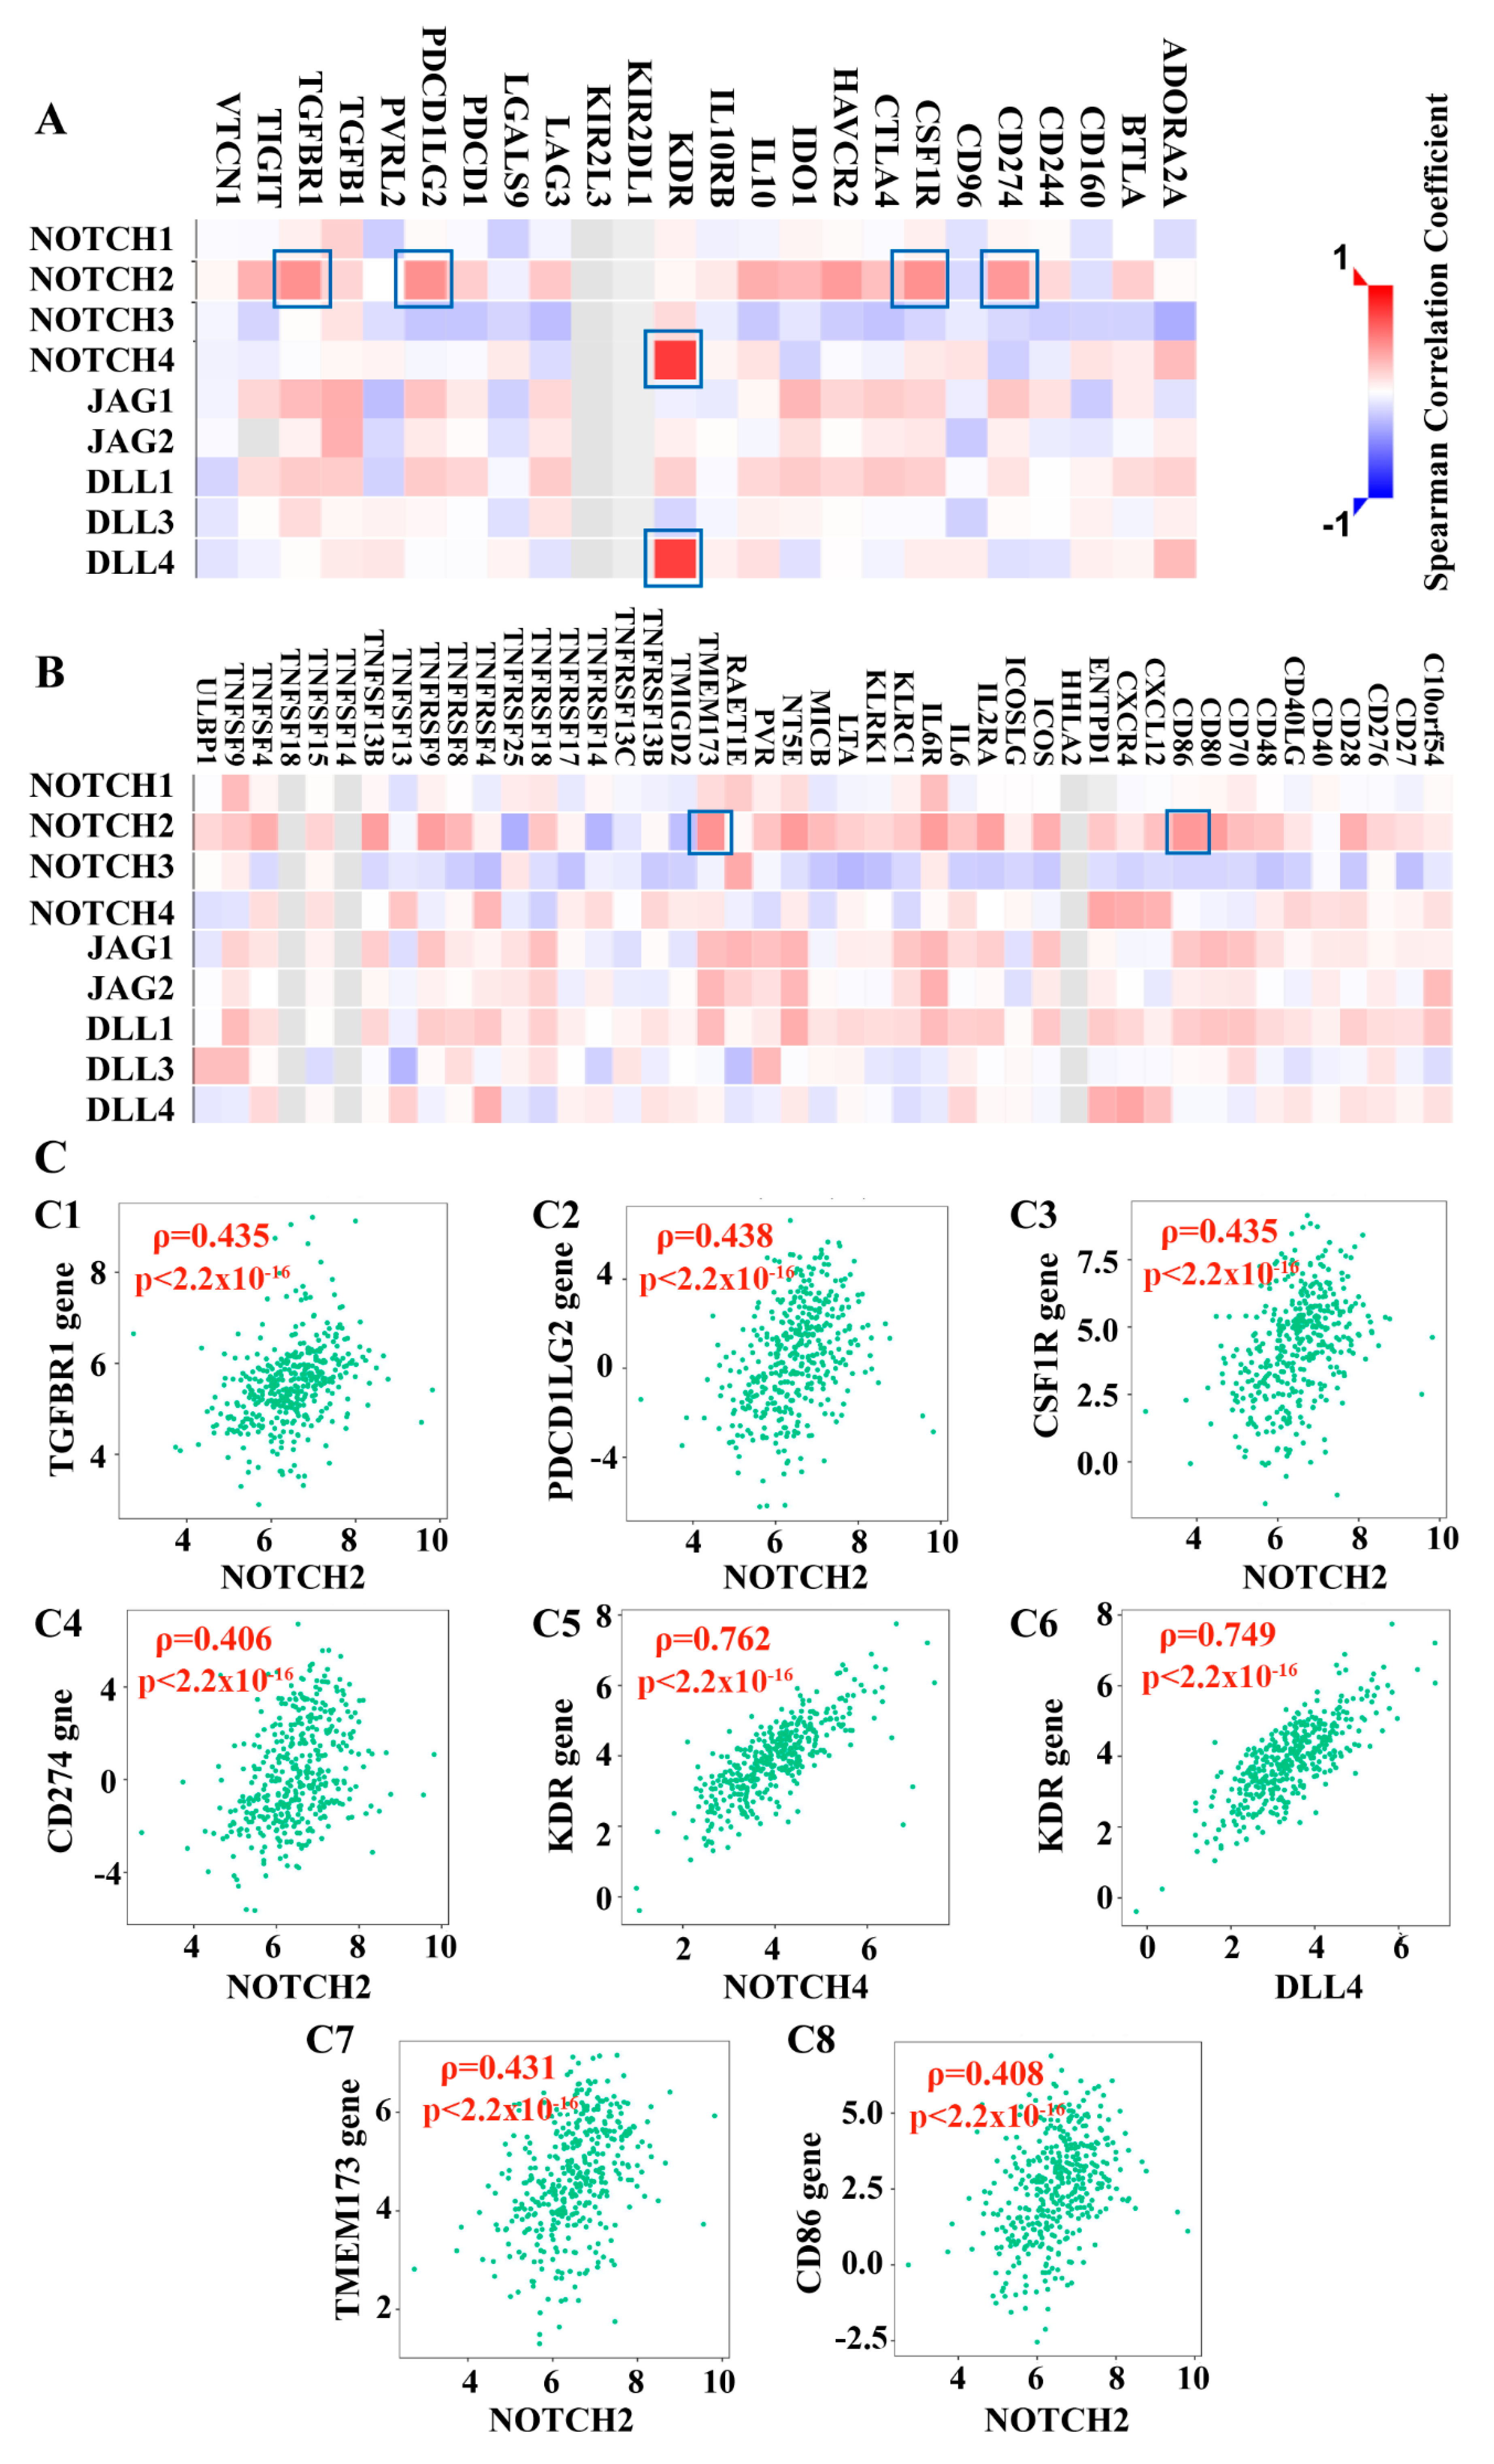
3.2.3. Notch Pathway Correlated with Lymphocyte Subtypes and Immunomodulating Genes
3.3. Overall Survival (OS) and Disease-Free Survival (DFS) Analyses
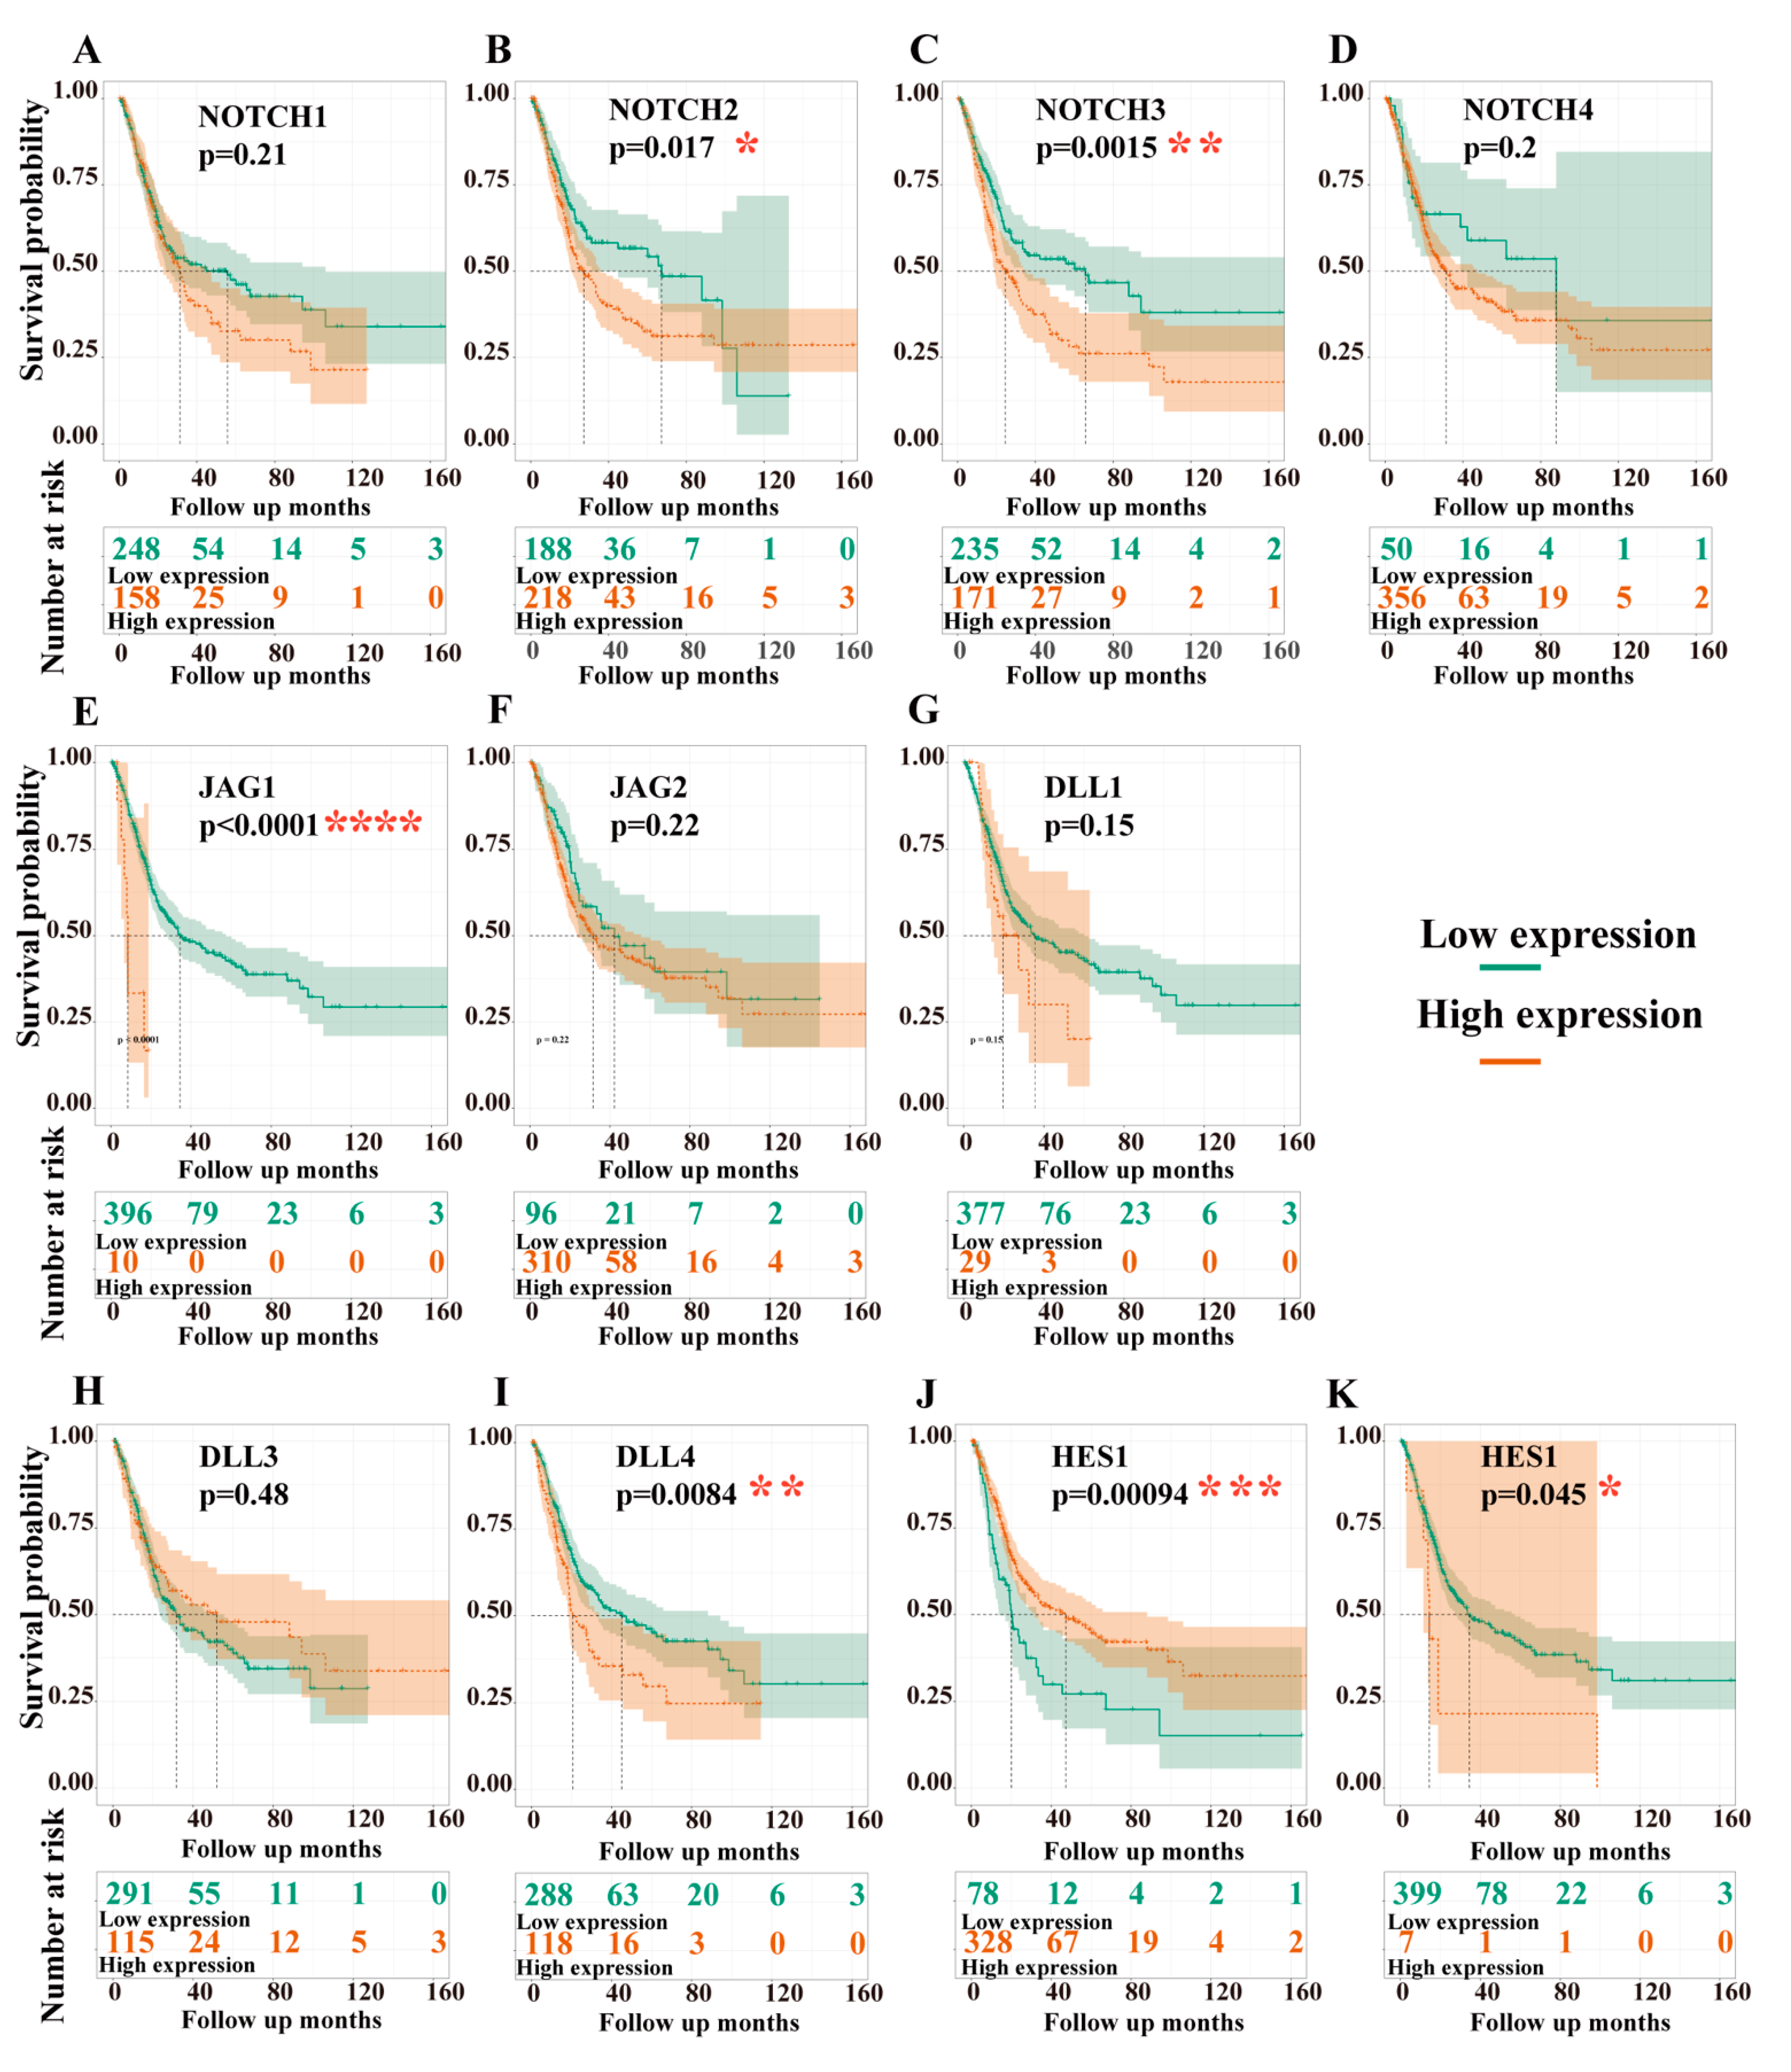
3.3.1. Dependency of Overall Survival (OS) on the Expression Levels of Target Genes
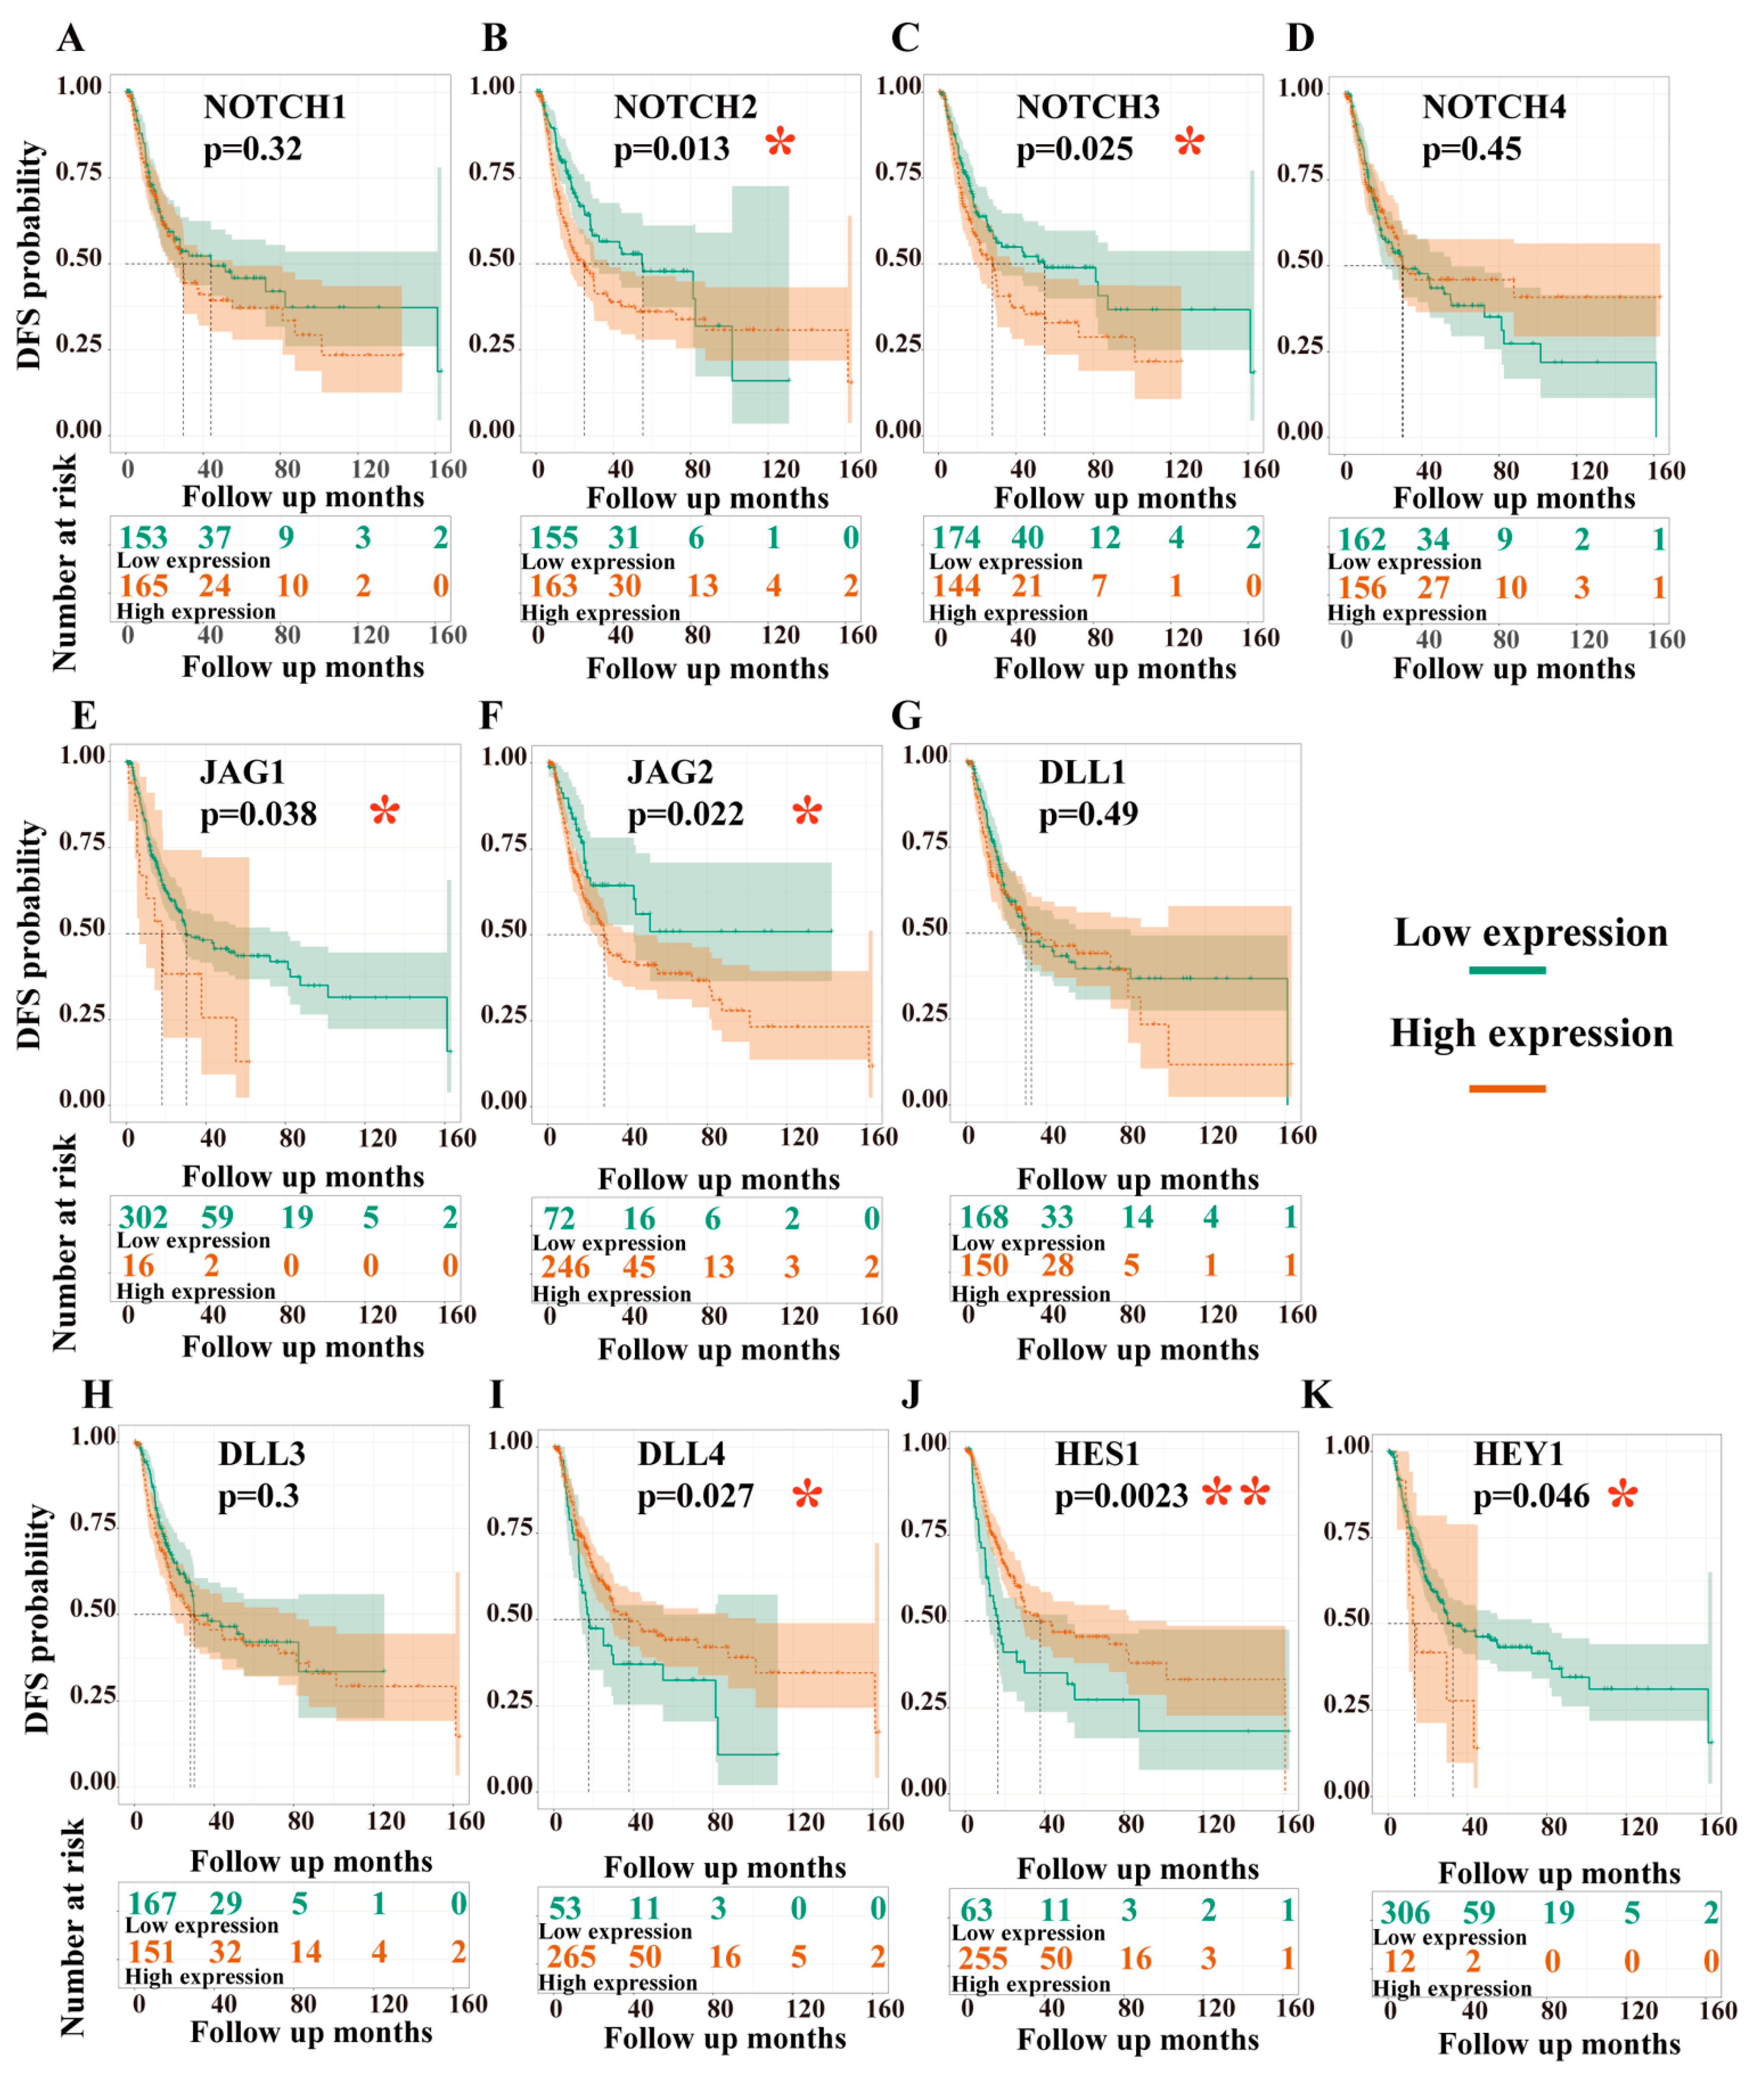
3.3.2. Dependency of Disease-Free Survival (DFS) on the Expression Levels of Target Genes
3.3.3. Combinations of the Independent Factors Correlated with OS and DFS, While Methylation of Notch Factors Did Not
3.4. Gene Networks and Gene Set Enrichment Analysis (GSEA)
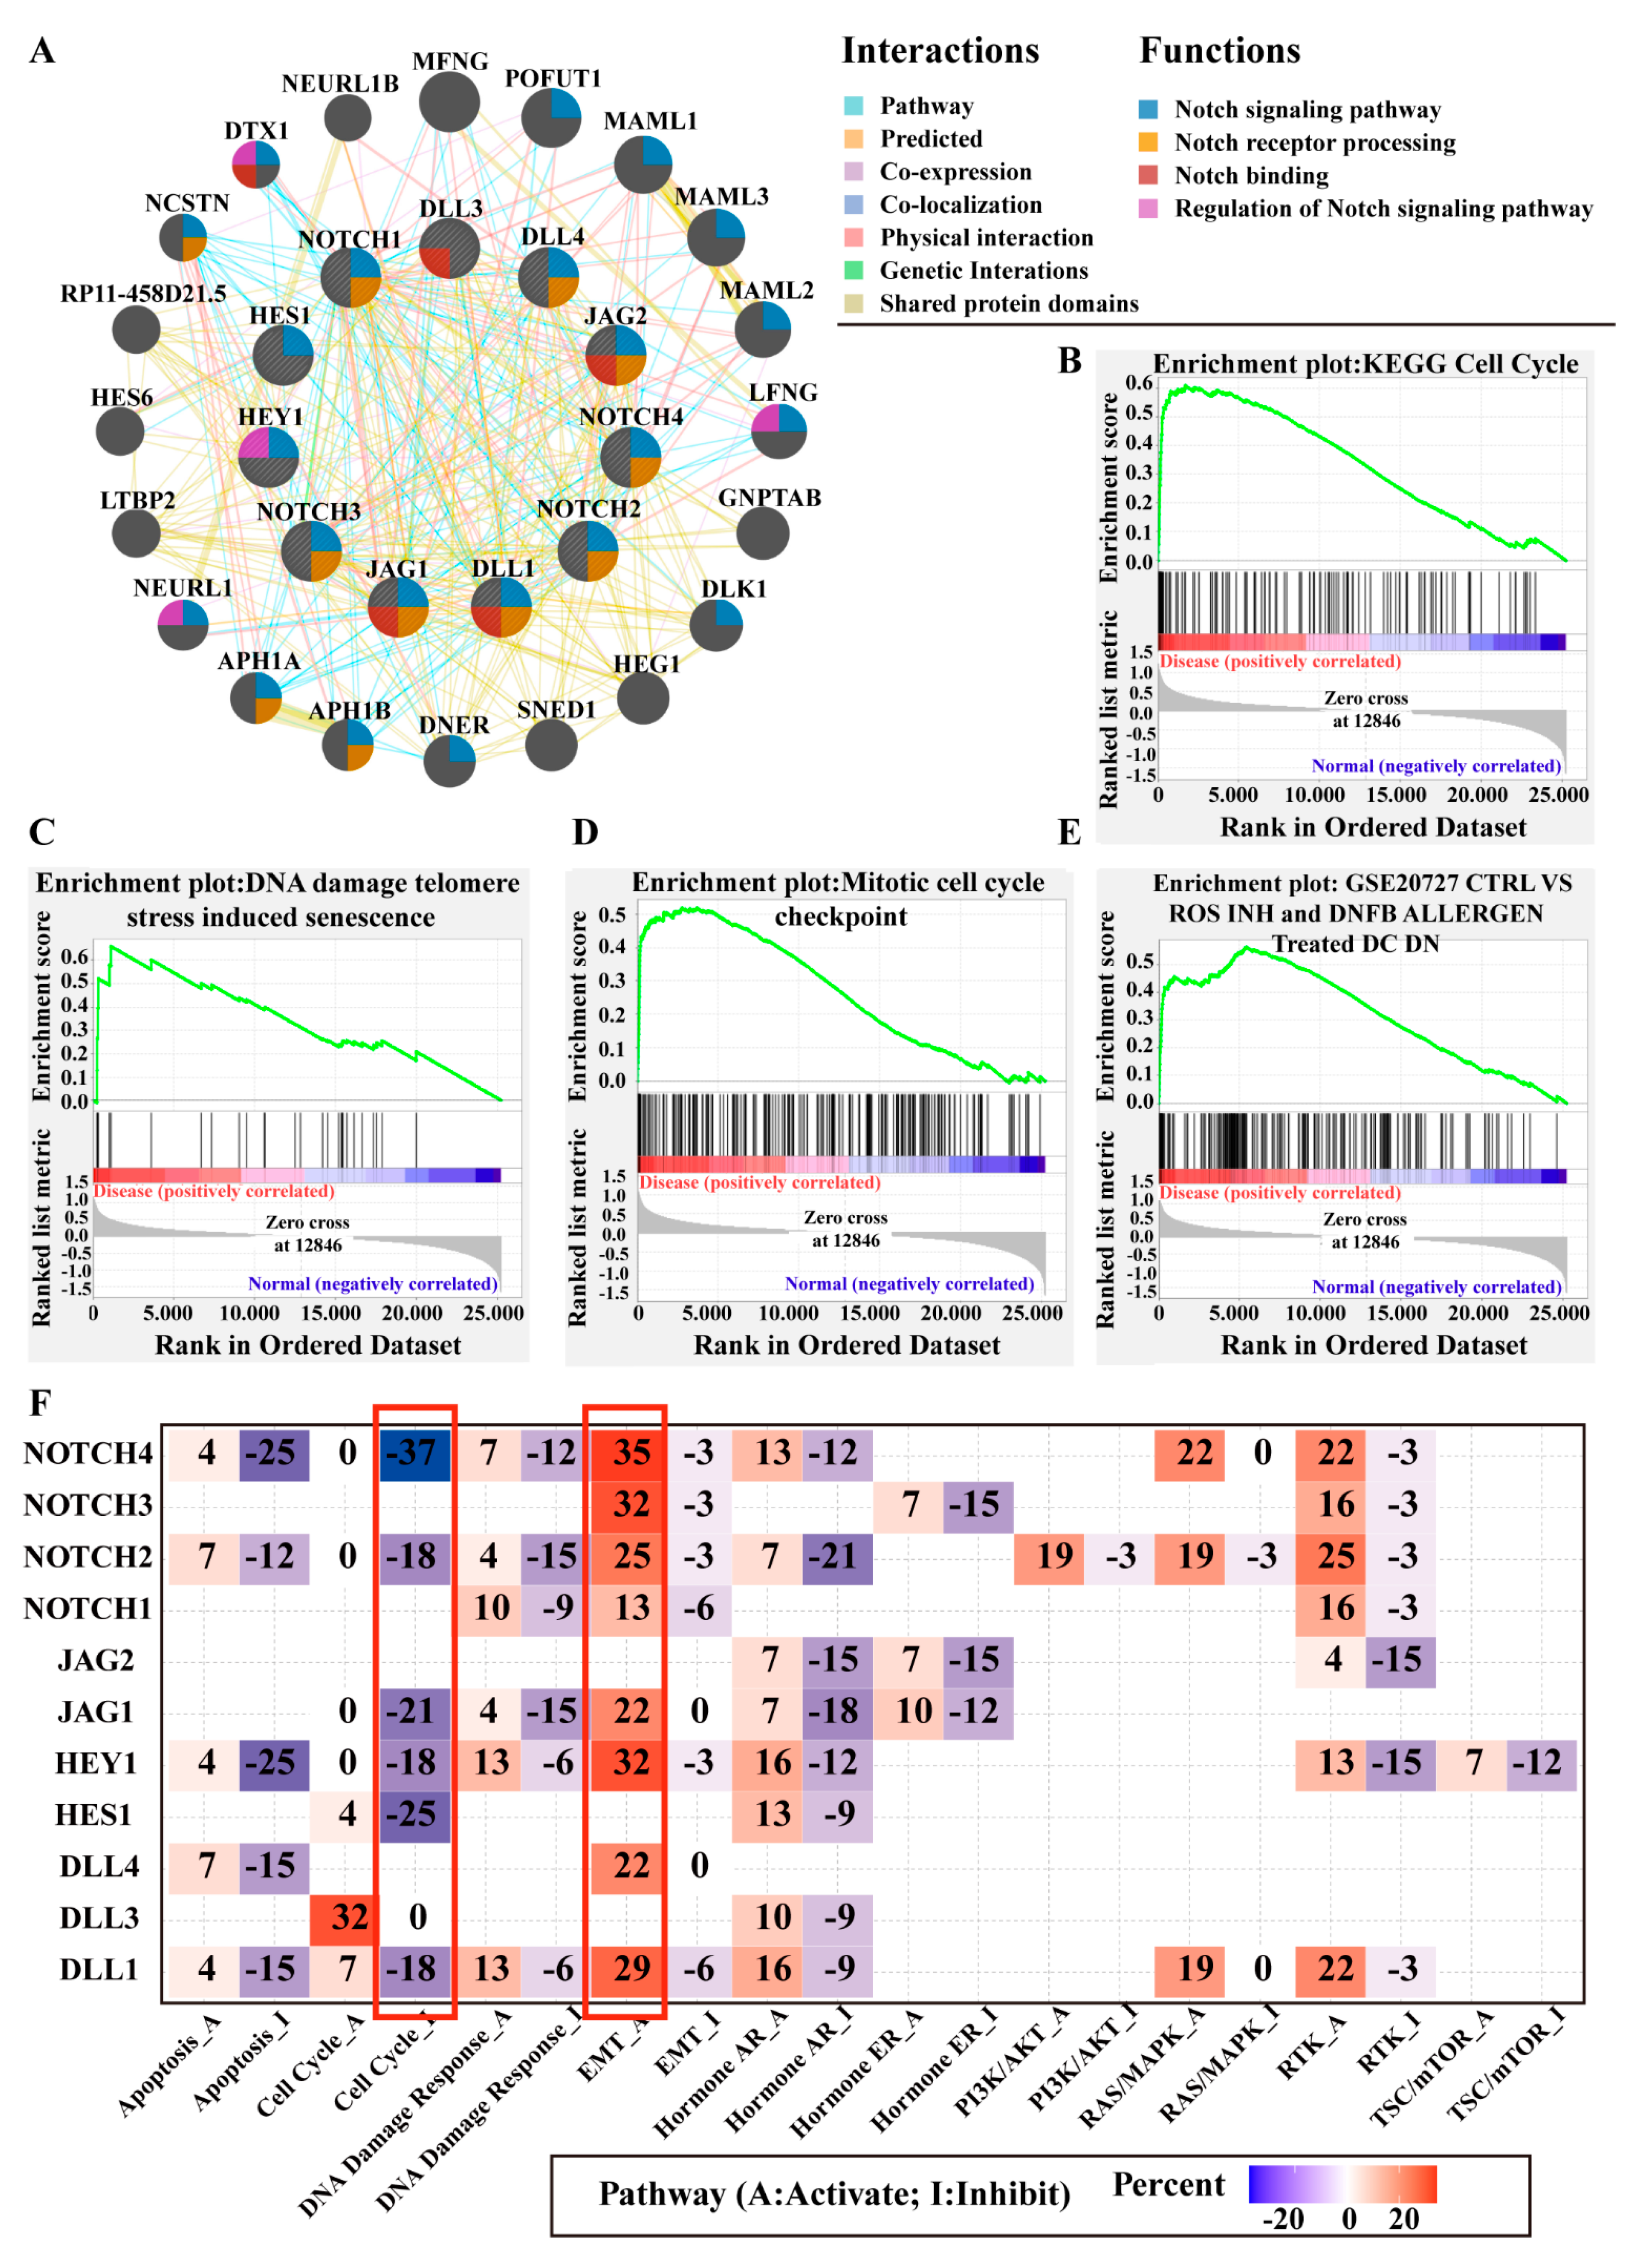
3.4.1. Gene Network Analysis
3.4.2. Gene Set Enrichment Analysis (GSEA)
3.4.3. Notch Pathway Interactions with Other Well-Known Cancer-Related Pathways
3.5. Oncomine Analysis of Notch-Related Genes and Body Maps
3.5.1. Meta-Analysis of Notch Factors in BCa
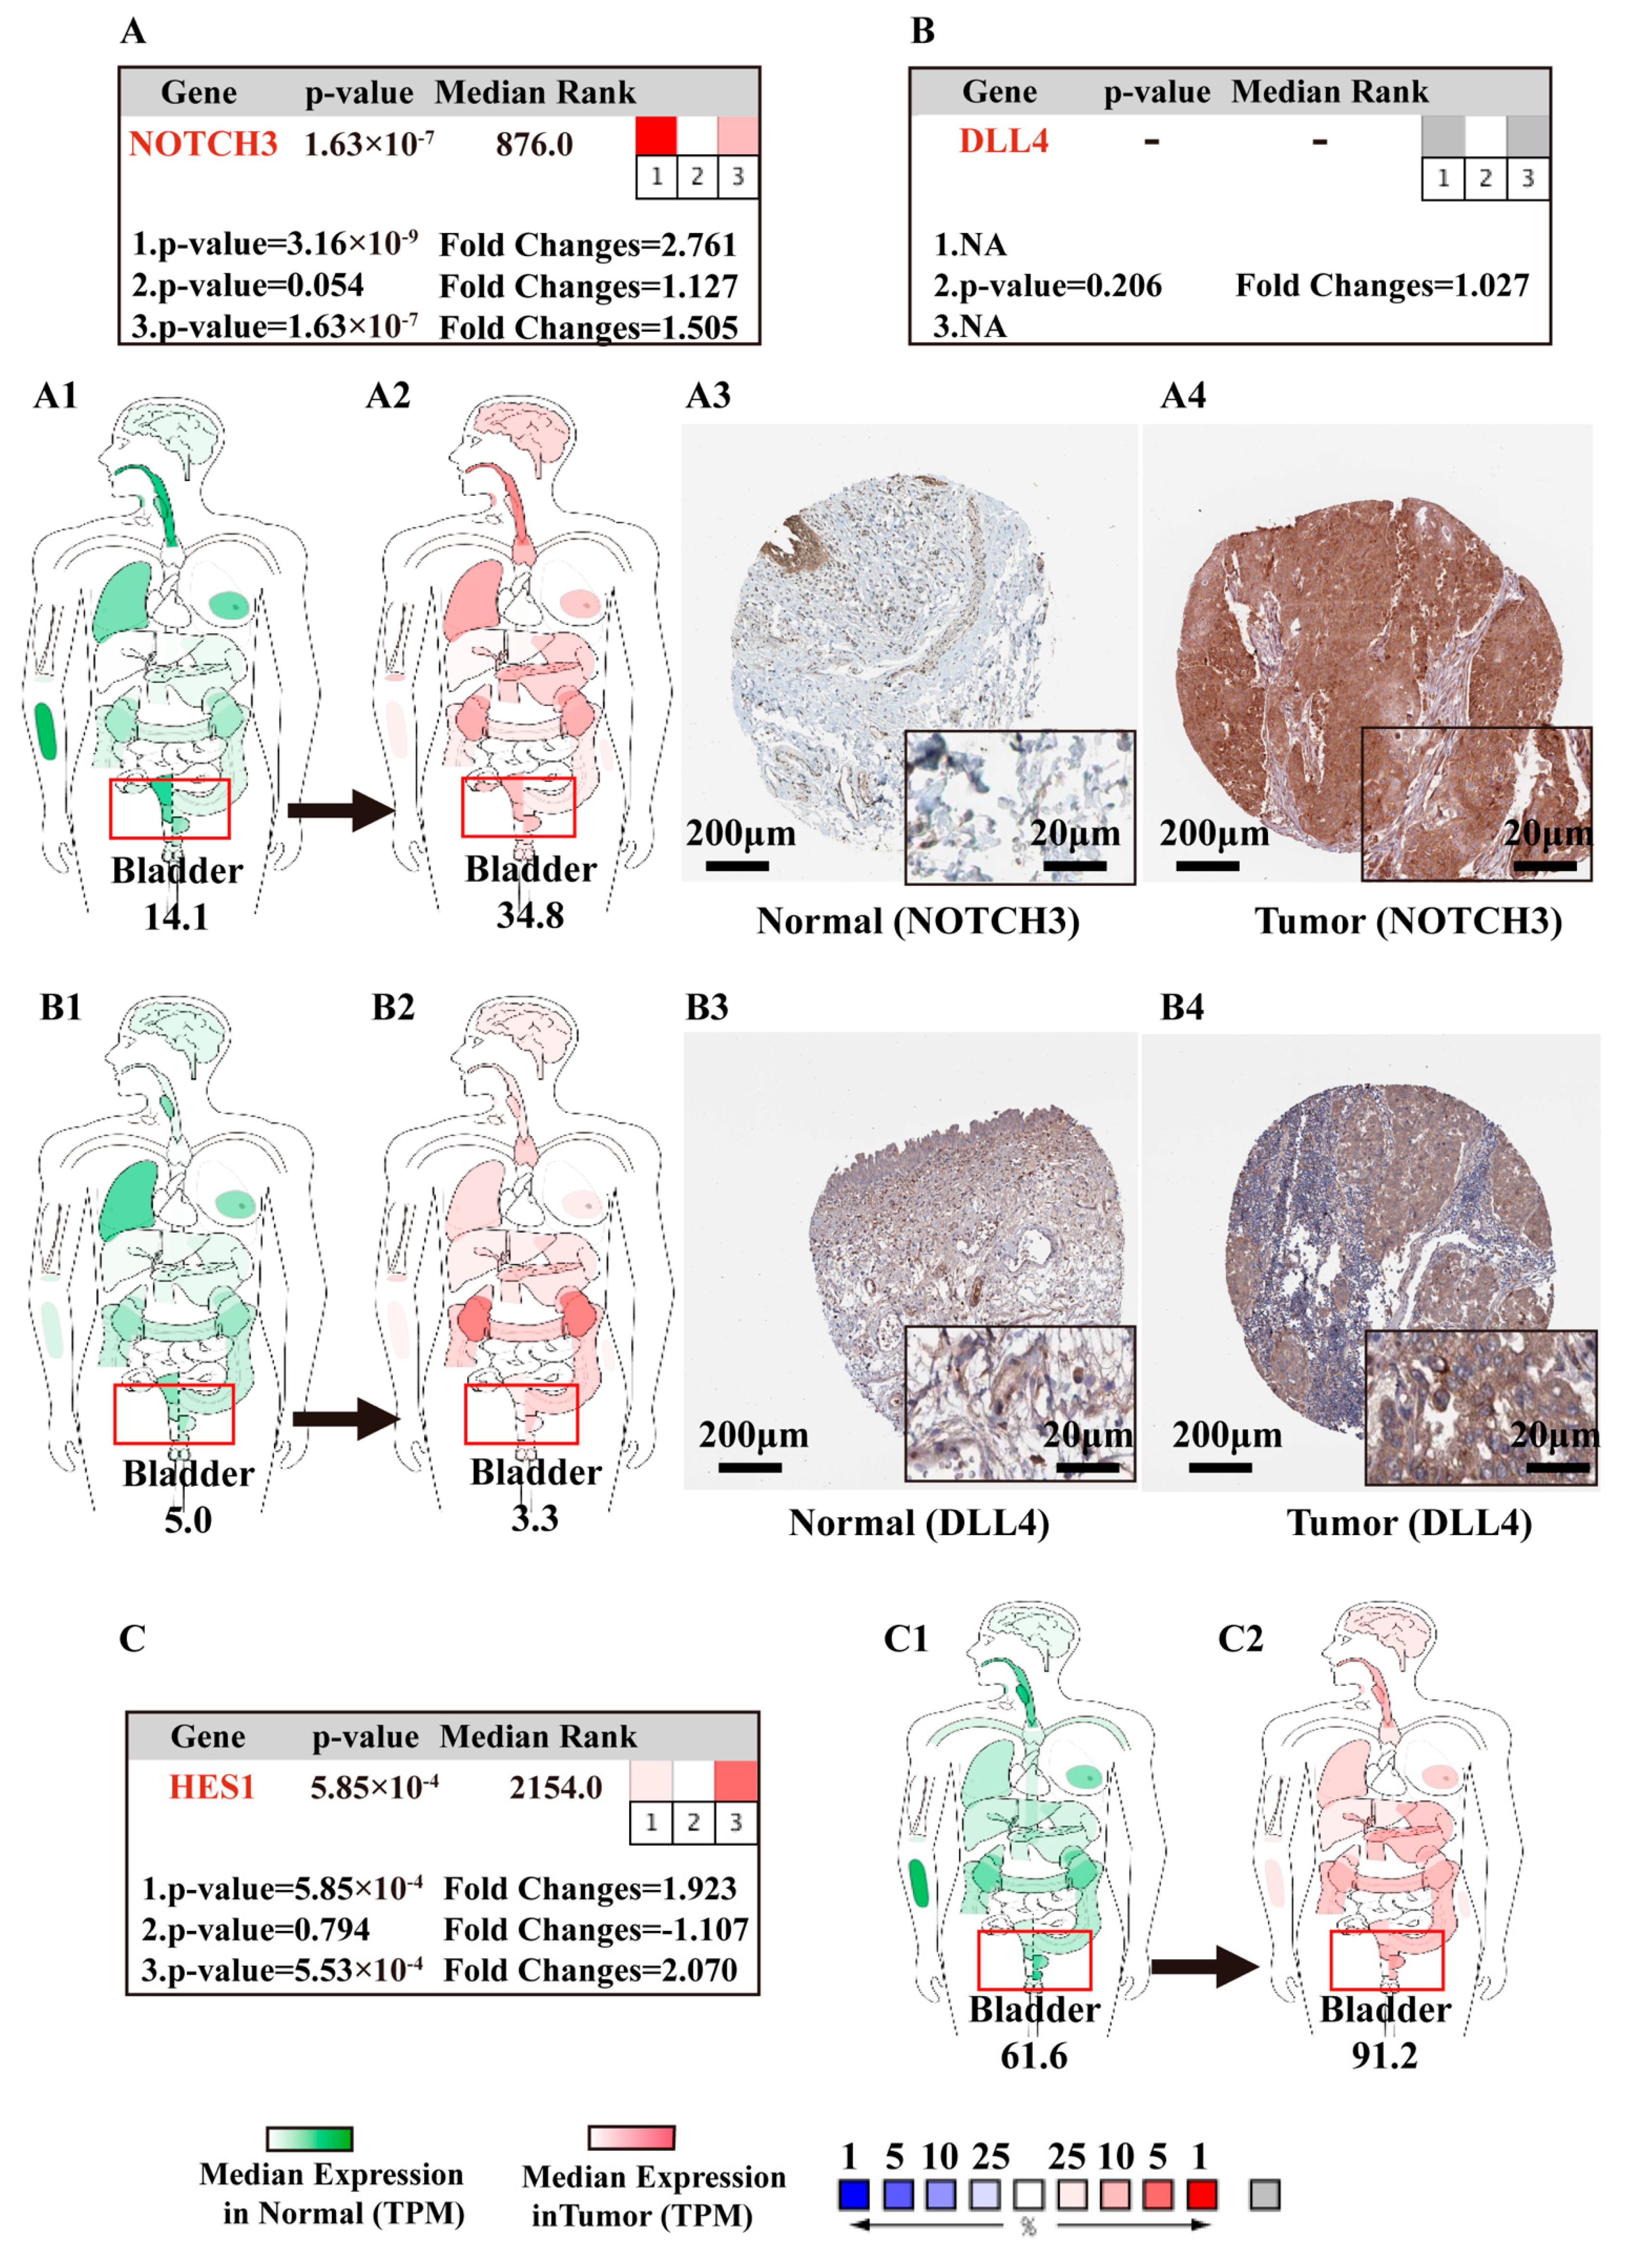
3.5.2. Body Maps of Notch Factors in Normal and BCa Patients
3.5.3. IHC of Notch-Related Proteins in Normal Bladder Tissue and BCa Samples
4. Discussion
4.1. NOTCH2/3 and DLL4 Are Potential Drivers of Notch Signaling in BCa
4.2. Differentially Expressed Notch-Related Genes Discriminate BCa and Relate to BCa Prognosis
- (i)
- Notch pathway-related gene and/or protein expression can serve as diagnostic biomarkers for BCa, with NOTCH4 in particular being the most promising biomarker candidate;
- (ii)
- (iii)
- (iv)
- all in all, according to the diagnostic, prognostic, and OPLS-DA analyses, NOTCH2, NOTCH3, DLL4, and HES1 are the most essential factors of Notch signaling in BCa, associated with clinical value (Table S17).
4.3. Notch Pathway Modulates the Development and Progression of BCa via Immune System
4.4. Notch Pathway Potentially Regulates or Crosstalks with Other Cancer Pathways
4.5. Limitations of the Study
5. Conclusions
Supplementary Materials
Author Contributions
Funding
Institutional Review Board Statement
Informed Consent Statement
Data Availability Statement
Acknowledgments
Conflicts of Interest
Abbreviations
| AFA | Black or African American |
| ASI | Asian |
| AUC | Accuracy |
| BCa | Bladder cancer |
| BP | Biological process |
| BST | Basal squamous tumors |
| CAU | Caucasian |
| DC | Dendritic cell |
| DFS | Disease-free survival |
| DLL | Delta-like canonical Notch ligand |
| EMT | Epithelial to mesenchymal transition |
| ER | Hormone estrogen receptor |
| FC | Fold change |
| FDR | False discovery rate |
| FWER | Familywise error rate |
| GEPIA | Gene expression profiling interactive analysis |
| GGI | Gene‒gene interaction |
| GO | Gene ontology |
| GSEA | Gene set enrichment analysis |
| GTEx | Gene expression omnibus |
| HPA | Human protein atlas |
| HR | Hormone androgen receptor |
| IHC | Immunochemistry |
| JAG | Serrate-like jagged canonical Notch ligand |
| KEGG | Kyoto Encyclopedia of Genes and Genomes |
| LIT | Luminal-infiltrated tumors |
| LPT | Luminal-papillary tumors |
| LT | Luminal tumors |
| MIBC | Muscle-invasive bladder cancer |
| NCBI | National Center for Biotechnology Information |
| NES | Normalized enrichment score |
| NET | Neuronal tumors |
| NMIBC | Non-muscle-invasive bladder cancer |
| NOTCH | Neurogenic locus Notch homologue |
| NPT | Non-papillary tumor |
| OS | Overall survival |
| OPLA-DA | Orthogonal partial least squares discriminant analysis |
| PT | Papillary tumor |
| RTK | Receptor tyrosine kinase signaling |
| RAS/MAPK | Ras/mitogen-activated protein kinase pathway |
| PCA | Principal component analysis |
| ROC | Receiver operating characteristic |
| SCBC | Small cell bladder cancer |
| TCGA-BLCA | Cancer genome atlas bladder cancer |
| TSC-mTOR | Tuberous sclerosis complex–mammalian target of rapamycin (TSC-mTOR) pathway |
| TISIDB | Tumor and immune system interaction database |
| TPM | Transcripts per million |
References
- Weng, A.P.; Ferrando, A.A.; Lee, W.; Morris, J.P.; Silverman, L.B.; Sanchez-Irizarry, C.; Blacklow, S.C.; Look, A.T.; Aster, J.C. Activating mutations of NOTCH1 in human T cell acute lymphoblastic leukemia. Science 2004, 306, 269–271. [Google Scholar] [CrossRef]
- Palomero, T.; Dominguez, M.; Ferrando, A.A. The role of the PTEN/AKT Pathway in NOTCH1-induced leukemia. Cell Cycle 2008, 7, 965–970. [Google Scholar] [CrossRef] [PubMed]
- Wang, Z.; Li, Y.; Ahmad, A.; Azmi, A.S.; Banerjee, S.; Kong, D.; Sarkar, F.H. Targeting Notch signaling pathway to overcome drug resistance for cancer therapy. Biochim. Biophys. Acta 2010, 1806, 258–267. [Google Scholar] [CrossRef] [PubMed]
- Goriki, A.; Seiler, R.; Wyatt, A.W.; Contreras-Sanz, A.; Bhat, A.; Matsubara, A.; Hayashi, T.; Black, P.C. Unravelling disparate roles of NOTCH in bladder cancer. Nat. Rev. Urol. 2018, 15, 345–357. [Google Scholar] [CrossRef]
- Hayashi, T.; Gust, K.M.; Wyatt, A.W.; Goriki, A.; Jager, W.; Awrey, S.; Li, N.; Oo, H.Z.; Altamirano-Dimas, M.; Buttyan, R.; et al. Not all NOTCH Is Created Equal: The Oncogenic Role of NOTCH2 in Bladder Cancer and Its Implications for Targeted Therapy. Clin. Cancer Res. 2016, 22, 2981–2992. [Google Scholar] [CrossRef]
- Greife, A.; Jankowiak, S.; Steinbring, J.; Nikpour, P.; Niegisch, G.; Hoffmann, M.J.; Schulz, W.A. Canonical Notch signalling is inactive in urothelial carcinoma. BMC Cancer 2014, 14, 628. [Google Scholar] [CrossRef]
- Maraver, A.; Fernandez-Marcos, P.J.; Cash, T.P.; Mendez-Pertuz, M.; Duenas, M.; Maietta, P.; Martinelli, P.; Munoz-Martin, M.; Martinez-Fernandez, M.; Canamero, M.; et al. NOTCH pathway inactivation promotes bladder cancer progression. J. Clin. Investig. 2015, 125, 824–830. [Google Scholar] [CrossRef] [PubMed]
- Rampias, T.; Vgenopoulou, P.; Avgeris, M.; Polyzos, A.; Stravodimos, K.; Valavanis, C.; Scorilas, A.; Klinakis, A. A new tumor suppressor role for the Notch pathway in bladder cancer. Nat. Med. 2014, 20, 1199–1205. [Google Scholar] [CrossRef]
- Zhang, H.; Liu, L.; Liu, C.; Pan, J.; Lu, G.; Zhou, Z.; Chen, Z.; Qian, C. Notch3 overexpression enhances progression and chemoresistance of urothelial carcinoma. Oncotarget 2017, 8, 34362–34373. [Google Scholar] [CrossRef] [PubMed]
- Meurette, O.; Mehlen, P. Notch Signaling in the Tumor Microenvironment. Cancer Cell 2018, 34, 536–548. [Google Scholar] [CrossRef] [PubMed]
- Hanahan, D.; Coussens, L.M. Accessories to the crime: Functions of cells recruited to the tumor microenvironment. Cancer Cell 2012, 21, 309–322. [Google Scholar] [CrossRef]
- Janssen, L.M.E.; Ramsay, E.E.; Logsdon, C.D.; Overwijk, W.W. The immune system in cancer metastasis: Friend or foe? J. Immunother. Cancer 2017, 5, 79. [Google Scholar] [CrossRef]
- Pfannstiel, C.; Strissel, P.L.; Chiappinelli, K.B.; Sikic, D.; Wach, S.; Wirtz, R.M.; Wullweber, A.; Taubert, H.; Breyer, J.; Otto, W.; et al. The Tumor Immune Microenvironment Drives a Prognostic Relevance That Correlates with Bladder Cancer Subtypes. Cancer Immunol. Res. 2019, 7, 923–938. [Google Scholar] [CrossRef]
- Borggrefe, T.; Lauth, M.; Zwijsen, A.; Huylebroeck, D.; Oswald, F.; Giaimo, B.D. The Notch intracellular domain integrates signals from Wnt, Hedgehog, TGFβ/BMP and hypoxia pathways. Biochim. Biophys. Acta 2016, 1863, 303–313. [Google Scholar] [CrossRef]
- Crane, A.; Eltemamy, M.; Shoskes, D. Transplant immunosuppressive drugs in urology. Transl. Androl. Urol. 2019, 8, 109–117. [Google Scholar] [CrossRef] [PubMed]
- Bourn, J.; Cekanova, M. Cyclooxygenase inhibitors potentiate receptor tyrosine kinase therapies in bladder cancer cells in-vitro. Drug Des. Dev. Ther. 2018, 12, 1727–1742. [Google Scholar] [CrossRef] [PubMed]
- Dangle, P.P.; Zaharieva, B.; Jia, H.; Pohar, K.S. Ras-MAPK pathway as a therapeutic target in cancer--emphasis on bladder cancer. Recent Pat. Anti-Cancer Drug Discov. 2009, 4, 125–136. [Google Scholar] [CrossRef]
- Goulet, C.R.; Champagne, A.; Bernard, G.; Vandal, D.; Chabaud, S.; Pouliot, F.; Bolduc, S. Cancer-associated fibroblasts induce epithelial-mesenchymal transition of bladder cancer cells through paracrine IL-6 signalling. BMC Cancer 2019, 19, 137. [Google Scholar] [CrossRef]
- da Silva, J.N.L.; Ranzi, A.D.; Carvalho, C.T.; Scheide, T.V.; Strey, Y.T.M.; Graziottin, T.M.; Bica, C.G. Cell Cycle Markers in the Evaluation of Bladder Cancer. Pathol. Oncol. Res. POR 2020, 26, 175–181. [Google Scholar] [CrossRef]
- D’Arcy, M.S. Cell death: A review of the major forms of apoptosis, necrosis and autophagy. Cell Biol. Int. 2019, 43, 582–592. [Google Scholar] [CrossRef] [PubMed]
- Goldar, S.; Khaniani, M.S.; Derakhshan, S.M.; Baradaran, B. Molecular mechanisms of apoptosis and roles in cancer development and treatment. Asian Pac. J. Cancer Prev. APJCP 2015, 16, 2129–2144. [Google Scholar] [CrossRef]
- Stranger, B.E.B.L.; Hasz, R.; Hunter, M.; Johns, C.; Johnson, M.; Kopen, G.; Leinweber, W.F.; Lonsdale, J.T.; McDonald, A.; Mestichelli, B.; et al. Enhancing GTEx by bridging the gaps between genotype, gene expression, and disease. Nat. Genet. 2017, 49, 1664–1670. [Google Scholar] [CrossRef]
- GTEx. Available online: https://gtexportal.org/home/datasets (accessed on 20 November 2020).
- Tomczak, K.; Czerwinska, P.; Wiznerowicz, M. The Cancer Genome Atlas (TCGA): An immeasurable source of knowledge. Contemp. Oncol. 2015, 19, A68–A77. [Google Scholar] [CrossRef]
- TCGA. Available online: https://portal.gdc.cancer.gov/ (accessed on 18 September 2020).
- R. Available online: https://www.r-project.org/ (accessed on 20 June 2020).
- Alfred Witjes, J.; Lebret, T.; Comperat, E.M.; Cowan, N.C.; De Santis, M.; Bruins, H.M.; Hernandez, V.; Espinos, E.L.; Dunn, J.; Rouanne, M.; et al. Updated 2016 EAU Guidelines on Muscle-invasive and Metastatic Bladder Cancer. Eur. Urol. 2017, 71, 462–475. [Google Scholar] [CrossRef]
- Babjuk, M.; Böhle, A.; Burger, M.; Capoun, O.; Cohen, D.; Compérat, E.M.; Hernández, V.; Kaasinen, E.; Palou, J.; Rouprêt, M.; et al. EAU Guidelines on Non-Muscle-invasive Urothelial Carcinoma of the Bladder: Update 2016. Eur. Urol. 2017, 71, 447–461. [Google Scholar] [CrossRef]
- Babjuk, M.; Burger, M.; Comperat, E.M.; Gontero, P.; Mostafid, A.H.; Palou, J.; van Rhijn, B.W.G.; Roupret, M.; Shariat, S.F.; Sylvester, R.; et al. European Association of Urology Guidelines on Non-muscle-invasive Bladder Cancer (TaT1 and Carcinoma In Situ)—2019 Update. Eur. Urol. 2019, 76, 639–657. [Google Scholar] [CrossRef]
- Chang, S.S.; Boorjian, S.A.; Chou, R.; Clark, P.E.; Daneshmand, S.; Konety, B.R.; Pruthi, R.; Quale, D.Z.; Ritch, C.R.; Seigne, J.D.; et al. Diagnosis and Treatment of Non-Muscle Invasive Bladder Cancer: AUA/SUO Guideline. J. Urol. 2016, 196, 1021–1029. [Google Scholar] [CrossRef]
- Flaig, T.W.; Spiess, P.E.; Agarwal, N.; Bangs, R.; Boorjian, S.A.; Buyyounouski, M.K.; Downs, T.M.; Efstathiou, J.A.; Friedlander, T.; Greenberg, R.E.; et al. NCCN Guidelines Insights: Bladder Cancer, Version 5.2018. J. Natl. Compr. Cancer Netw. 2018, 16, 1041–1053. [Google Scholar] [CrossRef]
- Power, N.E.; Izawa, J. Comparison of Guidelines on Non-Muscle Invasive Bladder Cancer (EAU, CUA, AUA, NCCN, NICE). Bladder Cancer 2016, 2, 27–36. [Google Scholar] [CrossRef]
- Singletary, S.E.; Allred, C.; Ashley, P.; Bassett, L.W.; Berry, D.; Bland, K.I.; Borgen, P.I.; Clark, G.M.; Edge, S.B.; Hayes, D.F.; et al. Staging system for breast cancer: Revisions for the 6th edition of the AJCC Cancer Staging Manual. Surg. Clin. 2003, 83, 803–819. [Google Scholar] [CrossRef]
- Taylor, J.; Becher, E.; Steinberg, G.D. Update on the guideline of guidelines: Non-muscle-invasive bladder cancer. BJU Int. 2020, 125, 197–205. [Google Scholar] [CrossRef]
- Witjes, J.A.; Bruins, H.M.; Cathomas, R.; Compérat, E.M.; Cowan, N.C.; Gakis, G.; Hernández, V.; Linares Espinós, E.; Lorch, A.; Neuzillet, Y.; et al. European Association of Urology Guidelines on Muscle-invasive and Metastatic Bladder Cancer: Summary of the 2020 Guidelines. Eur. Urol. 2021, 79, 82–104. [Google Scholar] [CrossRef] [PubMed]
- Sanli, O.; Dobruch, J.; Knowles, M.A.; Burger, M.; Alemozaffar, M.; Nielsen, M.E.; Lotan, Y. Bladder cancer. Nat. Rev. Dis. Primers 2017, 3, 17022. [Google Scholar] [CrossRef] [PubMed]
- Yang, D.; Ma, Y.; Zhao, P.; Ma, J.; He, C. Systematic screening of protein-coding gene expression identified HMMR as a potential independent indicator of unfavorable survival in patients with papillary muscle-invasive bladder cancer. Biomed. Pharm. 2019, 120, 109433. [Google Scholar] [CrossRef] [PubMed]
- Antoni, S.; Ferlay, J.; Soerjomataram, I.; Znaor, A.; Jemal, A.; Bray, F. Bladder Cancer Incidence and Mortality: A Global Overview and Recent Trends. Eur. Urol. 2017, 71, 96–108. [Google Scholar] [CrossRef]
- Andreassen, B.K.; Grimsrud, T.K.; Haug, E.S. Bladder cancer survival: Women better off in the long run. Eur. J. Cancer 2018, 95, 52–58. [Google Scholar] [CrossRef] [PubMed]
- Robertson, A.G.; Kim, J.; Al-Ahmadie, H.; Bellmunt, J.; Guo, G.; Cherniack, A.D.; Hinoue, T.; Laird, P.W.; Hoadley, K.A.; Akbani, R.; et al. Comprehensive Molecular Characterization of Muscle-Invasive Bladder Cancer. Cell 2017, 171, 540–556.e525. [Google Scholar] [CrossRef] [PubMed]
- Knowles, M.A.; Hurst, C.D. Molecular biology of bladder cancer: New insights into pathogenesis and clinical diversity. Nat. Rev. Cancer 2015, 15, 25–41. [Google Scholar] [CrossRef] [PubMed]
- Chandrashekar, D.S.; Bashel, B.; Balasubramanya, S.A.H.; Creighton, C.J.; Ponce-Rodriguez, I.; Chakravarthi, B.; Varambally, S. UALCAN: A Portal for Facilitating Tumor Subgroup Gene Expression and Survival Analyses. Neoplasia 2017, 19, 649–658. [Google Scholar] [CrossRef]
- Dastsooz, H.; Cereda, M.; Donna, D.; Oliviero, S. A Comprehensive Bioinformatics Analysis of UBE2C in Cancers. Int. J. Mol. Sci. 2019, 20, 2228. [Google Scholar] [CrossRef]
- UALCAN. Available online: http://ualcan.path.uab.edu (accessed on 20 December 2020).
- Ru, B.; Wong, C.N.; Tong, Y.; Zhong, J.Y.; Zhong, S.S.W.; Wu, W.C.; Chu, K.C.; Wong, C.Y.; Lau, C.Y.; Chen, I.; et al. TISIDB: An integrated repository portal for tumor-immune system interactions. Bioinformatics 2019, 35, 4200–4202. [Google Scholar] [CrossRef]
- TISIDB. Available online: http://cis.hku.hk/TISIDB (accessed on 18 March 2021).
- Triba, M.N.; Le Moyec, L.; Amathieu, R.; Goossens, C.; Bouchemal, N.; Nahon, P.; Rutledge, D.N.; Savarin, P. PLS/OPLS models in metabolomics: The impact of permutation of dataset rows on the K-fold cross-validation quality parameters. Mol. Biosyst. 2015, 11, 13–19. [Google Scholar] [CrossRef] [PubMed]
- Szymańska, E.; Saccenti, E.; Smilde, A.K.; Westerhuis, J.A. Double-check: Validation of diagnostic statistics for PLS-DA models in metabolomics studies. Metab. Off. J. Metab. Soc. 2012, 8, 3–16. [Google Scholar] [CrossRef]
- Liu, C.J.; Hu, F.F.; Xia, M.X.; Han, L.; Zhang, Q.; Guo, A.Y. GSCALite: A web server for gene set cancer analysis. Bioinformatics 2018, 34, 3771–3772. [Google Scholar] [CrossRef]
- GSCALite. Available online: http://bioinfo.life.hust.edu.cn/web/GSCALite/ (accessed on 20 March 2021).
- Franz, M.; Rodriguez, H.; Lopes, C.; Zuberi, K.; Montojo, J.; Bader, G.D.; Morris, Q. GeneMANIA update 2018. Nucleic Acids Res. 2018, 46, W60–W64. [Google Scholar] [CrossRef]
- GeneMANIA. Available online: http://genemania.org/ (accessed on 12 November 2020).
- Reimand, J.; Isserlin, R.; Voisin, V.; Kucera, M.; Tannus-Lopes, C.; Rostamianfar, A.; Wadi, L.; Meyer, M.; Wong, J.; Xu, C.; et al. Pathway enrichment analysis and visualization of omics data using g:Profiler, GSEA, Cytoscape and EnrichmentMap. Nat. Protoc. 2019, 14, 482–517. [Google Scholar] [CrossRef] [PubMed]
- Sathe, A.; Nawroth, R. Targeting the PI3K/AKT/mTOR Pathway in Bladder Cancer. Urothelial Carcinoma 2018, 1655, 335–350. [Google Scholar] [CrossRef]
- Bernardo, C.; Santos, J.; Costa, C.; Tavares, A.; Amaro, T.; Marques, I.; Gouveia, M.J.; Félix, V.; Afreixo, V.; Brindley, P.J.; et al. Estrogen receptors in urogenital schistosomiasis and bladder cancer: Estrogen receptor alpha-mediated cell proliferation. Urol. Oncol. 2020, 38, 738.e723–738.e735. [Google Scholar] [CrossRef] [PubMed]
- Li, P.; Chen, J.; Miyamoto, H. Androgen Receptor Signaling in Bladder Cancer. Cancers 2017, 9, 20. [Google Scholar] [CrossRef]
- Tang, Z.; Li, C.; Kang, B.; Gao, G.; Li, C.; Zhang, Z. GEPIA: A web server for cancer and normal gene expression profiling and interactive analyses. Nucleic Acids Res. 2017, 45, W98–W102. [Google Scholar] [CrossRef]
- GEPIA. Available online: http://gepia.cancer-pku.cn (accessed on 12 November 2020).
- Rhodes, D.R.; Yu, J.; Shanker, K.; Deshpande, N.; Varambally, R.; Ghosh, D.; Barrette, T.; Pandey, A.; Chinnaiyan, A.M. ONCOMINE: A cancer microarray database and integrated data-mining platform. Neoplasia 2004, 6, 1–6. [Google Scholar] [CrossRef]
- Oncomine. Available online: https://www.oncomine.org/ (accessed on 13 November 2020).
- Uhlen, M.; Oksvold, P.; Fagerberg, L.; Lundberg, E.; Jonasson, K.; Forsberg, M.; Zwahlen, M.; Kampf, C.; Wester, K.; Hober, S.; et al. Towards a knowledge-based Human Protein Atlas. Nat. Biotechnol. 2010, 28, 1248–1250. [Google Scholar] [CrossRef] [PubMed]
- Human_Protein_Atlas. Available online: https://www.proteinatlas.org/ (accessed on 13 December 2020).
- Charoentong, P.; Finotello, F.; Angelova, M.; Mayer, C.; Efremova, M.; Rieder, D.; Hackl, H.; Trajanoski, Z. Pan-cancer Immunogenomic Analyses Reveal Genotype-Immunophenotype Relationships and Predictors of Response to Checkpoint Blockade. Cell Rep. 2017, 18, 248–262. [Google Scholar] [CrossRef]
- Nandagopal, N.; Santat, L.A.; LeBon, L.; Sprinzak, D.; Bronner, M.E.; Elowitz, M.B. Dynamic Ligand Discrimination in the Notch Signaling Pathway. Cell 2018, 172, 869–880.e819. [Google Scholar] [CrossRef]
- Ren, H.; Zhu, J.; Yu, H.; Bazhin, A.V.; Westphalen, C.B.; Renz, B.W.; Jacob, S.N.; Lampert, C.; Werner, J.; Angele, M.K.; et al. Angiogenesis-Related Gene Expression Signatures Predicting Prognosis in Gastric Cancer Patients. Cancers 2020, 12, 3685. [Google Scholar] [CrossRef]
- Kanehisa, M.; Furumichi, M.; Tanabe, M.; Sato, Y.; Morishima, K. KEGG: New perspectives on genomes, pathways, diseases and drugs. Nucleic Acids Res. 2017, 45, D353–D361. [Google Scholar] [CrossRef]
- Fabregat, A.; Jupe, S.; Matthews, L.; Sidiropoulos, K.; Gillespie, M.; Garapati, P.; Haw, R.; Jassal, B.; Korninger, F.; May, B.; et al. The Reactome Pathway Knowledgebase. Nucleic Acids Res. 2018, 46, D649–D655. [Google Scholar] [CrossRef] [PubMed]
- Ashburner, M.; Ball, C.A.; Blake, J.A.; Botstein, D.; Butler, H.; Cherry, J.M.; Davis, A.P.; Dolinski, K.; Dwight, S.S.; Eppig, J.T.; et al. Gene ontology: Tool for the unification of biology. The Gene Ontology Consortium. Nat. Genet. 2000, 25, 25–29. [Google Scholar] [CrossRef]
- Dyrskjot, L.; Kruhoffer, M.; Thykjaer, T.; Marcussen, N.; Jensen, J.L.; Moller, K.; Orntoft, T.F. Gene expression in the urinary bladder: A common carcinoma in situ gene expression signature exists disregarding histopathological classification. Cancer Res. 2004, 64, 4040–4048. [Google Scholar] [CrossRef]
- Sanchez-Carbayo, M.; Socci, N.D.; Lozano, J.; Saint, F.; Cordon-Cardo, C. Defining molecular profiles of poor outcome in patients with invasive bladder cancer using oligonucleotide microarrays. J. Clin. Oncol. 2006, 24, 778–789. [Google Scholar] [CrossRef] [PubMed]
- Lee, J.S.; Leem, S.H.; Lee, S.Y.; Kim, S.C.; Park, E.S.; Kim, S.B.; Kim, S.K.; Kim, Y.J.; Kim, W.J.; Chu, I.S. Expression signature of E2F1 and its associated genes predict superficial to invasive progression of bladder tumors. J. Clin. Oncol. 2010, 28, 2660–2667. [Google Scholar] [CrossRef]
- Ai, X.; Jia, Z.; Liu, S.; Wang, J.; Zhang, X. Notch-1 regulates proliferation and differentiation of human bladder cancer cell lines by inhibiting expression of Kruppel-like factor 4. Oncol. Rep. 2014, 32, 1459–1464. [Google Scholar] [CrossRef]
- Hu, J.; Ye, F.; Cui, M.; Lee, P.; Wei, C.; Hao, Y.; Wang, X.; Wang, Y.; Lu, Z.; Galsky, M.; et al. Protein Profiling of Bladder Urothelial Cell Carcinoma. PLoS ONE 2016, 11, e0161922. [Google Scholar] [CrossRef] [PubMed]
- Shi, T.P.; Xu, H.; Wei, J.F.; Ai, X.; Ma, X.; Wang, B.J.; Ju, Z.H.; Zhang, G.X.; Wang, C.; Wu, Z.Q.; et al. Association of low expression of notch-1 and jagged-1 in human papillary bladder cancer and shorter survival. J. Urol. 2008, 180, 361–366. [Google Scholar] [CrossRef]
- Li, J.; Qu, W.; Jiang, Y.; Sun, Y.; Cheng, Y.; Zou, T.; Du, S. miR-489 Suppresses Proliferation and Invasion of Human Bladder Cancer Cells. Oncol. Res. 2016, 24, 391–398. [Google Scholar] [CrossRef] [PubMed]
- Li, W.; Liu, M.; Feng, Y.; Huang, Y.F.; Xu, Y.F.; Che, J.P.; Wang, G.C.; Zheng, J.H. High expression of Notch ligand Jagged2 is associated with the metastasis and recurrence in urothelial carcinoma of bladder. Int. J. Clin. Exp. Pathol. 2013, 6, 2430–2440. [Google Scholar]
- Koshkin, V.S.; Garcia, J.A.; Reynolds, J.; Elson, P.; Magi-Galluzzi, C.; McKenney, J.K.; Isse, K.; Bishop, E.; Saunders, L.R.; Balyimez, A.; et al. Transcriptomic and Protein Analysis of Small-cell Bladder Cancer (SCBC) Identifies Prognostic Biomarkers and DLL3 as a Relevant Therapeutic Target. Clin. Cancer Res. Off. J. Am. Assoc. Cancer Res. 2019, 25, 210–221. [Google Scholar] [CrossRef]
- Patel, N.S.; Dobbie, M.S.; Rochester, M.; Steers, G.; Poulsom, R.; Le Monnier, K.; Cranston, D.W.; Li, J.L.; Harris, A.L. Up-regulation of endothelial delta-like 4 expression correlates with vessel maturation in bladder cancer. Clin. Cancer Res. Off. J. Am. Assoc. Cancer Res. 2006, 12, 4836–4844. [Google Scholar] [CrossRef][Green Version]
- NCBI. Available online: https://www.ncbi.nlm.nih.gov/pmc/ (accessed on 13 December 2020).
- Fagerberg, L.; Hallström, B.M.; Oksvold, P.; Kampf, C.; Djureinovic, D.; Odeberg, J.; Habuka, M.; Tahmasebpoor, S.; Danielsson, A.; Edlund, K.; et al. Analysis of the human tissue-specific expression by genome-wide integration of transcriptomics and antibody-based proteomics. Mol. Cell Proteom. 2014, 13, 397–406. [Google Scholar] [CrossRef]
- Hayashi, T.; Fujita, K.; Hayashi, Y.; Hatano, K.; Kawashima, A.; McConkey, D.J.; Nonomura, N. Mutational Landscape and Environmental Effects in Bladder Cancer. Int. J. Mol. Sci. 2020, 21, 6072. [Google Scholar] [CrossRef]
- Grayson, M. Bladder cancer. Nature 2017, 551, S33. [Google Scholar] [CrossRef]
- McConkey, D.J.; Lee, S.; Choi, W.; Tran, M.; Majewski, T.; Lee, S.; Siefker-Radtke, A.; Dinney, C.; Czerniak, B. Molecular genetics of bladder cancer: Emerging mechanisms of tumor initiation and progression. Urol. Oncol. 2010, 28, 429–440. [Google Scholar] [CrossRef] [PubMed]
- Aine, M.; Eriksson, P.; Liedberg, F.; Sjödahl, G.; Höglund, M. Biological determinants of bladder cancer gene expression subtypes. Sci. Rep. 2015, 5, 10957. [Google Scholar] [CrossRef] [PubMed]
- Aine, M.; Eriksson, P.; Liedberg, F.; Höglund, M.; Sjödahl, G. On Molecular Classification of Bladder Cancer: Out of One, Many. Eur. Urol. 2015, 68, 921–923. [Google Scholar] [CrossRef] [PubMed]
- Kim, J.; Akbani, R.; Creighton, C.J.; Lerner, S.P.; Weinstein, J.N.; Getz, G.; Kwiatkowski, D.J. Invasive Bladder Cancer: Genomic Insights and Therapeutic Promise. Clin. Cancer Res. Off. J. Am. Assoc. Cancer Res. 2015, 21, 4514–4524. [Google Scholar] [CrossRef]
- Tan, T.Z.; Rouanne, M.; Tan, K.T.; Huang, R.Y.; Thiery, J.P. Molecular Subtypes of Urothelial Bladder Cancer: Results from a Meta-cohort Analysis of 2411 Tumors. Eur. Urol. 2019, 75, 423–432. [Google Scholar] [CrossRef]
- Chiplunkar, S.V.; Gogoi, D. The multifaceted role of Notch signal in regulating T cell fate. Immunol. Lett. 2019, 206, 59–64. [Google Scholar] [CrossRef]
- Wei, W.; Li, Z.P.; Bian, Z.X.; Han, Q.B. Astragalus Polysaccharide RAP Induces Macrophage Phenotype Polarization to M1 via the Notch Signaling Pathway. Molecules 2019, 24, 2016. [Google Scholar] [CrossRef]
- Sugimoto, K.; Maekawa, Y.; Kitamura, A.; Nishida, J.; Koyanagi, A.; Yagita, H.; Kojima, H.; Chiba, S.; Shimada, M.; Yasutomo, K. Notch2 signaling is required for potent antitumor immunity in vivo. J. Immunol. 2010, 184, 4673–4678. [Google Scholar] [CrossRef]
- Sakata-Yanagimoto, M.; Sakai, T.; Miyake, Y.; Saito, T.I.; Maruyama, H.; Morishita, Y.; Nakagami-Yamaguchi, E.; Kumano, K.; Yagita, H.; Fukayama, M.; et al. Notch2 signaling is required for proper mast cell distribution and mucosal immunity in the intestine. Blood 2011, 117, 128–134. [Google Scholar] [CrossRef]
- Sakata-Yanagimoto, M.; Chiba, S. Notch2 and immune function. Curr. Top. Microbiol. Immunol. 2012, 360, 151–161. [Google Scholar] [CrossRef]
- Tsukumo, S.I.; Yasutomo, K. Regulation of CD8(+) T Cells and Antitumor Immunity by Notch Signaling. Front. Immunol. 2018, 9, 101. [Google Scholar] [CrossRef]
- Androutsellis-Theotokis, A.; Leker, R.R.; Soldner, F.; Hoeppner, D.J.; Ravin, R.; Poser, S.W.; Rueger, M.A.; Bae, S.K.; Kittappa, R.; McKay, R.D. Notch signalling regulates stem cell numbers in-vitro and in vivo. Nature 2006, 442, 823–826. [Google Scholar] [CrossRef]
- Sasnauskiene, A.; Jonusiene, V.; Krikstaponiene, A.; Butkyte, S.; Dabkeviciene, D.; Kanopiene, D.; Kazbariene, B.; Didziapetriene, J. NOTCH1, NOTCH3, NOTCH4, and JAG2 protein levels in human endometrial cancer. Medicina 2014, 50, 14–18. [Google Scholar] [CrossRef] [PubMed]
- Abdou, A.G.; El-Wahed, M.M.; Kandil, M.A.; Samaka, R.M.; Elkady, N. Immunohistochemical analysis of the role and relationship between Notch-1 and Oct-4 expression in urinary bladder carcinoma. Apmis 2013, 121, 982–996. [Google Scholar] [CrossRef] [PubMed]
- Rasti, A.; Mehrazma, M.; Madjd, Z.; Abolhasani, M.; Saeednejad Zanjani, L.; Asgari, M. Co-expression of Cancer Stem Cell Markers OCT4 and NANOG Predicts Poor Prognosis in Renal Cell Carcinomas. Sci. Rep. 2018, 8, 11739. [Google Scholar] [CrossRef] [PubMed]
- Atlasi, Y.; Mowla, S.J.; Ziaee, S.A.; Bahrami, A.R. OCT-4, an embryonic stem cell marker, is highly expressed in bladder cancer. Int. J. Cancer 2007, 120, 1598–1602. [Google Scholar] [CrossRef]
- Tao, S.; Meng, S.; Zheng, X.; Xie, L. ATM participates in the regulation of viability and cell cycle via ellipticine in bladder cancer. Mol. Med. Rep. 2017, 15, 1143–1148. [Google Scholar] [CrossRef][Green Version]
- Khoo, K.H.; Verma, C.S.; Lane, D.P. Drugging the p53 pathway: Understanding the route to clinical efficacy. Nat. Rev. Drug Discov. 2014, 13, 217–236. [Google Scholar] [CrossRef]
- Dotto, G.P. Crosstalk of Notch with p53 and p63 in cancer growth control. Nat. Rev. Cancer 2009, 9, 587–595. [Google Scholar] [CrossRef]
- Duenas, M.; Perez-Figueroa, A.; Oliveira, C.; Suarez-Cabrera, C.; Sousa, A.; Oliveira, P.; Villacampa, F.; Paramio, J.M.; Martinez-Fernandez, M. Gene Expression Analyses in Non Muscle Invasive Bladder Cancer Reveals a Role for Alternative Splicing and Tp53 Status. Sci. Rep. 2019, 9, 10362. [Google Scholar] [CrossRef] [PubMed]
- Chatterjee, S.; Sil, P.C. Targeting the crosstalks of Wnt pathway with Hedgehog and Notch for cancer therapy. Pharmacol. Res. 2019, 142, 251–261. [Google Scholar] [CrossRef] [PubMed]


| Patient Characteristics | Classification | Number of Patients | Percent (%) |
|---|---|---|---|
| Age (years), median (IQR) | 69 (34–90) | 406 | 100 |
| Gender | Male | 299 | 73.65 |
| Female | 107 | 26.35 | |
| Race | Asian | 43 | 10.59 |
| Caucasian (White) | 323 | 79.56 | |
| Black African American | 23 | 5.67 | |
| Unknown | 17 | 4.19 | |
| Family cancer history | Yes | 143 | 35.22 |
| No | 263 | 64.78 | |
| Histological subtype | Papillary | 130 | 32.02 |
| Non-papillary | 271 | 66.75 | |
| Unknown | 5 | 1.23 | |
| T stage | T0-1 | 4 | 0.99 |
| T2-T2b | 118 | 29.06 | |
| T3-T3b | 193 | 47.54 | |
| T4-T4b | 58 | 14.29 | |
| Tx | 1 | 0.25 | |
| Unknown | 32 | 7.88 | |
| Recurrence | Yes | 141 | 34.73 |
| No | 177 | 43.60 | |
| Unknown | 88 | 21.67 | |
| Lymphnode (N) stage | N0 | 236 | 58.13 |
| N1 | 46 | 11.33 | |
| N2 | 75 | 18.47 | |
| N3 | 7 | 1.72 | |
| NX | 36 | 8.87 | |
| Unknown | 6 | 1.48 | |
| Metastatic (M) stage | M0 | 195 | 48.03 |
| M1 | 11 | 2.71 | |
| MX | 197 | 48.52 | |
| Unknown | 3 | 0.74 | |
| Tumor stage | Stage I (T1, N0, M0) | 2 | 0.49 |
| Stage II (T2a, T2b, N0, M0) | 129 | 31.77 | |
| Stage III (T1-4a, N0-3, M0) | 140 | 34.48 | |
| Stage IV (T1-4b, N1-3, M0-1) | 133 | 32.76 | |
| Unknown | 2 | 0.49 | |
| Tumor grade | High grade | 383 | 94.33 |
| Low grade | 20 | 4.93 | |
| Unknown | 3 | 0.74 | |
| Overall status | Dead | 179 | 44.09 |
| Alive | 227 | 55.91 |
| Target Genes | BCa vs. Control | p-Value | Tumor Stage | p-Value | Lymph Nodal Metastasis | p-Value | Histological Subtypes | p-Value | Race | p-Value | Gender | p-Value |
|---|---|---|---|---|---|---|---|---|---|---|---|---|
| NOTCH1 | BCa (↓) | p = 6.83 × 10⁻⁷ | C vs. N0 (↓) | p = 7.35 × 10⁻³ | C vs. PT (↓) | p = 1.52 × 10⁻³ | CAU vs. AFA (↑) | p = 1.04 × 10⁻² | ||||
| C vs. N2 (↓) | p = 3.67 × 10⁻⁴ | C vs. NPT (↓) | p = 1.46 × 10⁻⁴ | |||||||||
| NOTCH2 | BCa (↓) | p = 9.46 × 10⁻⁹ | S2 vs. S3 (↑) | p = 2.07 × 10⁻² | C vs. N0 (↓) | p = 1.00 × 10⁻⁷ | C vs. PT (↓) | p = 6.00 × 10⁻⁵ | CAU vs. ASI (↓) | p = 2.13 × 10⁻⁴ | ||
| S2 vs. S4 (↑) | p = 2.81 × 10⁻² | C vs. N1 (↓) | p = 1.29 × 10⁻² | C vs. NPT (↓) | p < 0.000001 | AFA vs. ASI (↓) | p = 1.00 × 10⁻⁷ | |||||
| C vs. N2 (↓) | p = 5.58 × 10⁻⁴ | PT vs. NPT (↑) | p = 3.00 × 10⁻⁷ | |||||||||
| NOTCH3 | BCa (↑) | p = 1.98 × 10⁻⁴ | C vs. N0 (↑) | p = 2.20 × 10⁻³ | C vs. PT (↑) | p = 3.44 × 10⁻⁴ | ||||||
| C vs. N1 (↑) | p = 6.35 × 10⁻⁴ | C vs. NPT (↑) | p = 2.41 × 10⁻³ | |||||||||
| C vs. N2 (↑) | p = 1.45 × 10⁻² | |||||||||||
| NOTCH4 | BCa (↓) | p = 5.02 × 10⁻¹² | C vs. N0 (↓) | p < 0.000001 | C vs. PT (↓) | p = 2.00 × 10⁻⁷ | AFA vs. ASI (↑) | p = 2.59 × 10⁻³ | ||||
| C vs. N1 (↓) | p < 0.000001 | C vs. NPT (↓) | p < 0.000001 | |||||||||
| C vs. N2 (↓) | p = 1.00 × 10⁻⁷ | PT vs. NPT (↓) | p = 1.00 × 10⁻² | |||||||||
| C vs. N3 (↓) | p = 7.17 × 10⁻⁴ | |||||||||||
| JAG1 | PT vs. NPT (↑) | p = 6.77 × 10⁻⁴ | CAU vs. AFA (↑) | p = 2.93 × 10⁻³ | ||||||||
| AFA vs. ASI (↓) | p = 1.47 × 10⁻² | |||||||||||
| JAG2 | S2 vs. S4 (↓) | p = 3.21 × 10⁻³ | C vs. N2 (↓) | p = 1.06 × 10⁻² | CAU vs. AFA (↑) | p = 4.45 × 10⁻² | Male vs. Female (↑) | p = 3.20 × 10⁻⁴ | ||||
| DLL1 | BCa (↓) | p = 4.67 × 10⁻⁸ | C vs. N0 (↓) | p = 1.84 × 10⁻⁴ | C vs. PT (↓) | p = 1.00 × 10⁻⁷ | ||||||
| C vs. N1 (↓) | p = 2.13 × 10⁻⁴ | C vs. NPT (↓) | p = 1.85 × 10⁻⁵ | |||||||||
| C vs. N2 (↓) | p = 5.00 × 10⁻⁷ | PT vs. NPT (↑) | p = 4.45 × 10⁻² | |||||||||
| C vs. N3 (↓) | p = 1.08 × 10⁻² | |||||||||||
| DLL3 | BCa (↑) | p = 1.02 × 10⁻⁹ | C vs. N0 (↑) | p = 3.00 × 10⁻⁷ | C vs. PT (↑) | p = 9.51 × 10⁻⁵ | ||||||
| C vs. N1 (↑) | p = 3.20 × 10⁻⁶ | C vs. NPT (↑) | p < 0.000001 | |||||||||
| C vs. N2 (↑) | p = 3.80 × 10⁻⁶ | PT vs. NPT (↑) | p = 2.26 × 10⁻² | Male vs. Female (↑) | p = 3.07 × 10⁻² | |||||||
| C vs. N3 (↑) | p = 2.36 × 10⁻³ | |||||||||||
| DLL4 | BCa (↓) | p = 6.36 × 10⁻⁵ | C vs. N0 (↓) | p = 7.29 × 10⁻³ | C vs. NPT (↓) | p = 3.63 × 10⁻⁵ | CAU vs. ASI (↓) | p = 1.55 × 10−02 | ||||
| C vs. N1 (↓) | p = 2.19 × 10⁻³ | PT vs. NPT (↓) | p = 6.46 × 10⁻³ | AFA vs. ASI (↓) | p = 2.22 × 10−02 | |||||||
| HES1 | BCa (↑) | p = 2.61 × 10⁻⁵ | C vs. N0 (↑) | p = 1.00 × 10⁻⁷ | C vs. PT (↑) | p < 0.000001 | CAU vs. ASI (↓) | p = 3.98 × 10−04 | ||||
| C vs. N1 (↑) | p = 3.63 × 10⁻³ | C vs. NPT (↑) | p = 4.40 × 10⁻⁶ | |||||||||
| C vs. N2 (↑) | p = 2.25 × 10⁻⁵ | PT vs. NPT (↓) | p = 5.05 × 10⁻³ |
| Target Genes | Molecular Subtypes | TP53 Mutation Status | ||||||
|---|---|---|---|---|---|---|---|---|
| C-TCGA vs. Subtypes | p-Value | BST vs. LT/LIT | p-Value | C-TCGA vs. TP53M/TP53WT | p-Value | TP53M vs. TP53WT | p-Value | |
| NOTCH1 | LT (↓) | p = 8.20 × 10⁻³ | LT (↓) | p = 3.31 × 10⁻² | TP53M (↓) | p = 6.20 × 10⁻³ | TP53WT (↑) | p = 3.91 × 10⁻⁷ |
| LT (↓) | p = 6.16 × 10⁻⁴ | |||||||
| NOTCH2 | LT (↓) | p = 1.50 × 10⁻³ | LT (↓) | p = 1.14 × 10⁻³ | TP53M (↓) | p = 3.46 × 10⁻² | TP53WT (↓) | p = 4.34 × 10⁻² |
| LIT (↓) | p = 3.68 × 10⁻² | TP53WT (↓) | p = 1.17 × 10⁻² | |||||
| LPT (↓) | p = 5.44 × 10⁻³ | |||||||
| NOTCH3 | BST (↑) | p = 5.69 × 10⁻⁵ | LIT (↑) | p = 4.05 × 10⁻² | TP53M (↑) | p = 5.83 × 10⁻⁴ | ||
| LT (↑) | p = 1.26 × 10⁻³ | TP53WT (↑) | p = 2.22 × 10⁻⁵ | |||||
| LIT (↑) | p = 1.06 × 10⁻² | |||||||
| LPT (↑) | p = 8.22 × 10⁻⁵ | |||||||
| NOTCH4 | BST (↓) | p = 1.47 × 10⁻² | LIT (↑) | p = 9.78 × 10⁻³ | TP53M (↓) | p = 3.02 × 10⁻² | TP53WT (↑) | p = 4.62 × 10⁻³ |
| JAG1 | BST (↑) | p = 1.10 × 10⁻⁶ | LT (↓) | p = 9.77 × 10⁻⁵ | TP53M (↑) | p = 3.95 × 10⁻² | ||
| LIT (↓) | p = 1.13 × 10⁻⁷ | |||||||
| JAG2 | NET (↑) | p = 2.09 × 10⁻² | LT (↓) | p = 5.25 × 10⁻¹² | TP53M (↑) | p = 1.32 × 10⁻³ | ||
| BST (↑) | p = 4.76 × 10⁻⁸ | LIT (↓) | p = 5.87 × 10⁻⁹ | TP53WT (↑) | p = 3.98 × 10⁻⁴ | |||
| LPT (↑) | p = 3.99 × 10⁻² | |||||||
| DLL1 | LT (↓) | p = 3.06 × 10⁻³ | LT (↓) | p = 1.44 × 10⁻⁴ | TP53WT (↓) | p = 2.86 × 10⁻² | ||
| LIT (↓) | p = 5.54 × 10⁻³ | LIT (↓) | p = 7.74 × 10⁻⁵ | |||||
| LPT (↓) | p = 1.31 × 10⁻³ | |||||||
| DLL3 | BST (↑) | p = 3.48 × 10⁻⁷ | LIT (↓) | p = 1.96 × 10⁻³ | TP53M (↑) | p = 1.00 × 10⁻² | ||
| LT (↑) | p = 4.68 × 10⁻² | TP53WT (↑) | p = 1.75 × 10⁻⁶ | |||||
| LIT (↑) | p = 9.80 × 10⁻³ | |||||||
| LPT (↑) | p = 5.16 × 10⁻³ | |||||||
| DLL4 | LT (↑) | p = 1.77 × 10⁻² | TP53WT (↑) | p = 4.02 × 10⁻³ | ||||
| LIT (↑) | p = 4.46 × 10⁻³ | |||||||
| HES1 | LT (↑) | p = 3.51 × 10⁻³ | LT (↑) | p = 3.97 × 10⁻⁵ | TP53WT (↑) | p = 2.30 × 10⁻² | TP53WT (↑) | p = 2.11 × 10⁻² |
| LIT (↑) | p = 4.79 × 10⁻² | LIT (↑) | p = 2.18 × 10⁻³ | |||||
| LPT (↑) | p = 3.14 × 10⁻⁶ | |||||||
| HEY1 | NET (↑) | p = 4.46 × 10⁻² | LT (↑) | p = 2.20 × 10⁻² | TP53M (↑) | p = 1.16 × 10⁻³ | ||
| BST (↑) | p = 5.74 × 10⁻³ | TP53WT (↑) | p = 1.63 × 10⁻⁶ | |||||
| LT (↑) | p = 1.68 × 10⁻³ | |||||||
| LIT (↑) | p = 1.50 × 10⁻² | |||||||
| Univariate Test | Multivariate Test | ||||||
|---|---|---|---|---|---|---|---|
| Gene | HR | CI95 | p-Value | Gene | HR | CI95 | p-Value |
| NOTCH1 | 1.21 | 0.9–1.63 | 0.208 | ||||
| NOTCH2 | 1.44 | 1.06–1.96 | 0.018 * | NOTCH2 | 1.27 | 0.92–1.76 | 0.151 |
| NOTCH3 | 1.6 | 1.2–2.15 | 0.002 ** | NOTCH3 | 1.65 | 1.2–2.25 | 0.002 ** |
| NOTCH4 | 1.35 | 0.85–2.15 | 0.204 | ||||
| JAG1 | 4.26 | 1.98–9.18 | 0 | JAG1 | 3.69 | 1.67–8.15 | 0.001 ** |
| JAG2 | 1.25 | 0.88–1.77 | 0.221 | ||||
| DLL1 | 1.47 | 0.87–2.5 | 0.154 | ||||
| DLL3 | 0.89 | 0.64–1.24 | 0.483 | ||||
| DLL4 | 1.53 | 1.11–2.1 | 0.009 ** | DLL4 | 1.54 | 1.11–2.14 | 0.009 ** |
| HES1 | 0.57 | 0.41–0.8 | 0.001 ** | HES1 | 0.56 | 0.39–0.81 | 0.002 ** |
| HEY1 | 2.26 | 1–5.11 | 0.045 * | HEY1 | 1.63 | 0.7–3.77 | 0.255 |
| Univariate Test | Multivariate Test | ||||||
|---|---|---|---|---|---|---|---|
| Gene | HR | CI95 | p-Value | Gene | HR | CI95 | p-Value |
| NOTCH1 | 1.18 | 0.85–1.65 | 0.322 | ||||
| NOTCH2 | 1.53 | 1.09–2.16 | 0.014 * | NOTCH2 | 1.3 | 0.91–1.85 | 0.152 |
| NOTCH3 | 1.46 | 1.05–2.04 | 0.026 * | NOTCH3 | 1.52 | 1.08–2.15 | 0.016 * |
| NOTCH4 | 0.88 | 0.63–1.23 | 0.447 | ||||
| JAG1 | 1.9 | 1.02–3.52 | 0.042 * | JAG1 | 1.42 | 0.75–2.68 | 0.28 |
| JAG2 | 1.66 | 1.07–2.58 | 0.023 * | JAG2 | 1.63 | 1.05–2.55 | 0.03 * |
| DLL1 | 1.12 | 0.81–1.56 | 0.494 | ||||
| DLL3 | 1.19 | 0.85–1.67 | 0.3 | ||||
| DLL4 | 0.65 | 0.44–0.95 | 0.028 * | DLL4 | 0.68 | 0.46–1.01 | 0.056 |
| HES1 | 0.56 | 0.39–0.82 | 0.003 ** | HES1 | 0.59 | 0.4–0.88 | 0.01 * |
| HEY1 | 1.97 | 1–3.87 | 0.046 * | HEY1 | 1.67 | 0.84–3.34 | 0.146 |
| Name | Role in BCa | Description |
|---|---|---|
| NOTCH1 | Suppression *(↓) | Activated NOTCH1 suppressed BCa in vitro and in vivo by reducing ERK1 and ERK2(ERK1/2) [8]. Suppression of NOTCH1 may be advantageous for tumor progression [6]. |
| Oncogene (↑) | NOTCH1 knockdown led to cancer cell growth and significantly inhibited growth and proliferation [72]. | |
| NOTCH2 | Suppression *(↓) | NOTCH2 was significantly downregulated in BCa [6,8]. Inactivation of NOTCH2 favors the process of EMT and promotes BCa progression [7]. |
| Oncogene (↑) | High rate of NOTCH2 copy number gain and over-expression in BCa, and the activation of NOTCH2 promotes metastasis, resulting in poor survival [5]. | |
| NOTCH3 | Suppression (↓) | Deletion of the intracellular domain of NOTCH3 leads to negative function in BCa, i.e., turning it into potential tumor-suppressive gene [8]. |
| Oncogene*(↑) | Significantly upregulated NOTCH3 enhanced the BCa growth and chemoresistance in urothelial carcinoma with worse survival [9]. | |
| NOTCH4 | Suppression * (↓) | NOTCH4 was significantly downregulated in BCa, especially in the T1 stage of bladder tumor. However, in patients diagnosed with muscle-invasive bladder tumor (MIBC), high NOTCH4 expression correlated with poor survival and more vascular invasion [73]. |
| Oncogene | NA | |
| JAG1 | Suppression (↓) | JAG1 significantly decreased in BCa and was associated with poor prognosis [74]. |
| Oncogene (↑) | miR-489 directly suppressed JAG1 expression, inhibiting the proliferation and invasion of human bladder cancer cells [75]. | |
| JAG2 | Suppression | NA |
| Oncogene (↑) | JAG2 was overexpressed in BCa and was significantly associated with the metastasis and recurrence [76]. | |
| DLL1 | Suppression *(↓) | DLL1 was significantly decreased in BCa. Supposed to be a suppressive gene [6]. |
| Oncogene | NA | |
| DLL3 | Suppression | NA |
| Oncogene * (↑) | DLL3 was significantly upregulated in small cell components correlated with worse clinical outcomes in small cell bladder cancer (SCBC) [77]. | |
| DLL4 | Suppression | NA |
| Oncogene (↑) | DLL4 was significantly upregulated in BCa, and the expression of DLL4 was found to be associated with vascular differentiation in BCa [78]. |
Publisher’s Note: MDPI stays neutral with regard to jurisdictional claims in published maps and institutional affiliations. |
© 2021 by the authors. Licensee MDPI, Basel, Switzerland. This article is an open access article distributed under the terms and conditions of the Creative Commons Attribution (CC BY) license (https://creativecommons.org/licenses/by/4.0/).
Share and Cite
Zhang, C.; Berndt-Paetz, M.; Neuhaus, J. A Comprehensive Bioinformatics Analysis of Notch Pathways in Bladder Cancer. Cancers 2021, 13, 3089. https://doi.org/10.3390/cancers13123089
Zhang C, Berndt-Paetz M, Neuhaus J. A Comprehensive Bioinformatics Analysis of Notch Pathways in Bladder Cancer. Cancers. 2021; 13(12):3089. https://doi.org/10.3390/cancers13123089
Chicago/Turabian StyleZhang, Chuan, Mandy Berndt-Paetz, and Jochen Neuhaus. 2021. "A Comprehensive Bioinformatics Analysis of Notch Pathways in Bladder Cancer" Cancers 13, no. 12: 3089. https://doi.org/10.3390/cancers13123089
APA StyleZhang, C., Berndt-Paetz, M., & Neuhaus, J. (2021). A Comprehensive Bioinformatics Analysis of Notch Pathways in Bladder Cancer. Cancers, 13(12), 3089. https://doi.org/10.3390/cancers13123089