Simple Summary
Childhood tumors of the central nervous system (CNS) constitute a grave disease and their diagnosis is difficult to be handled. To gain better knowledge of the tumor’s biology, it is essential to understand the underlying mechanisms of the disease. MicroRNAs (miRNAs) are small noncoding RNAs that are dysregulated in many types of CNS tumors and regulate their occurrence and development through specific signal pathways. However, different types of CNS tumors’ area are characterized by different deregulated miRNAs. Here, we hypothesized that CNS tumors could have commonly deregulated miRNAs, i.e., miRNAs that are simultaneously either upregulated or downregulated in all tumor types compared to the normal brain tissue, irrespectively of the tumor sub-type and/or diagnosis. The only criterion is that they are present in brain tumors. This approach could lead us to the discovery of miRNAs that could be used as pan-CNS tumoral therapeutic targets, if successful.
Abstract
Despite extensive experimentation on pediatric tumors of the central nervous system (CNS), related to both prognosis, diagnosis and treatment, the understanding of pathogenesis and etiology of the disease remains scarce. MicroRNAs are known to be involved in CNS tumor oncogenesis. We hypothesized that CNS tumors possess commonly deregulated miRNAs across different CNS tumor types. Aim: The current study aims to reveal the co-deregulated miRNAs across different types of pediatric CNS tumors. Materials: A total of 439 CNS tumor samples were collected from both in-house microarray experiments as well as data available in public databases. Diagnoses included medulloblastoma, astrocytoma, ependydoma, cortical dysplasia, glioblastoma, ATRT, germinoma, teratoma, yoc sac tumors, ocular tumors and retinoblastoma. Results: We found miRNAs that were globally up- or down-regulated in the majority of the CNS tumor samples. MiR-376B and miR-372 were co-upregulated, whereas miR-149, miR-214, miR-574, miR-595 and miR-765 among others, were co-downregulated across all CNS tumors. Receiver-operator curve analysis showed that miR-149, miR-214, miR-574, miR-595 and miR765 could distinguish between CNS tumors and normal brain tissue. Conclusions: Our approach could prove significant in the search for global miRNA targets for tumor diagnosis and therapy. To the best of our knowledge, there are no previous reports concerning the present approach.
1. Introduction
A central nervous system (CNS) tumor begins when healthy cells in the brain or the spinal cord change and grow out of control, forming an either benign or cancerous tumor. The movement and cognition of patients suffering from a CNS tumor are affected, making it challenging to treat, because the tissues around the tumor are often vital to the body’s functioning [1]. About 1200–1500 new cases of CNS tumors are diagnosed per year in the US alone, with an equal ratio between the two sexes. More than 90% of primary CNS tumors occur in the intracranial cavity affecting the brain, meninges, epiphysis, optic nerve, and parapharyngeal areas.
Childhood CNS tumors differ greatly from other childhood neoplasms, as CNS tumors are related to high mortality rate if the tumor is unable to be removed surgically. The treatment of CNS tumors in infants and young children may be especially challenging because a child’s brain is still developing. However, more than half of these patients are disease-free five years after their diagnosis. With this increase in survival, these children are expected to have serious, permanent, neurological, cognitive, endocrinological and psychological problems after extensive radiotherapy treatment. Therefore, the life quality of long-term survivors needs to be improved. An interdisciplinary approach in managing brain tumors in children is important to improve treatment, especially in benign tumors, and in low-grade children malignancies.
MicroRNAs (miRNAs) are endogenous single-stranded RNA molecules ranging from 20 to 25 nucleotides in size, and deriving from larger precursors by maturation [2]. They play an important role in modifying the sequence, structure and expression of messenger (m)RNAs and at the same time, they affect protein translation. MiRNAs control cell proliferation, differentiation, apoptosis, angiogenesis, epithelial-to-mesenchymal transition (EMT), metastasis and metabolic pathways in cancer, including CNS tumors [3]. Thus, through their expression profiles, they can be used as biomarkers for the prognosis, diagnosis and treatment of different types of cancers [2].
In different cancers, miRNA expression is deregulated by a variety of mechanisms, including amplification, deletion, mutations, epigenetic silencing [4,5,6], or loss of the expression of their transcription factor [7,8]. Several miRNAs are distributed in fragile or cancer-related genomic regions [9]. In addition, they have been shown to function either as oncogenes or tumor suppressor genes [10,11]. MiRNAs can simultaneously target oncogenes and tumor suppressor genes in cancer cells. Therefore, the regulation of several signaling pathways is cooperatively being carried out by a combination of different miRNAs. Their oncogenic or tumor suppressor activity depends heavily on their cellular environment. For example, the miR-29 family exhibits tumor suppressor activity in lung cancer via targeting the DNA methyltransferase DNMT3A, while it has oncogenic activity in breast cancer, by targeting the DNA methyltransferases DNMT3B and/or ZFP36 [12].
Τhe identification of free circulating miRNAs from the whole blood, plasma or serum, can be successfully used in cancer research, and despite the heterogeneity in circulating tumor cells (CTCs) [13], miRNA profiling can be used as a prognostic and therapy-monitoring tool in childhood CNS tumors [14,15]. MiRNA profiling has been used to detect changes in neurons [16] and in some cases of pediatric CNS tumors they have also been used as diagnostic and therapeutic molecules [17,18]. Nevertheless, there is still a lot more to learn regarding their role in CNS tumors. New insights on the role of miRNAs in CNS tumors could help us understand better their pathology, etiology and treatment.
In this study, we hypothesized that different childhood tumors of the CNS could share similar miRNA expression patterns. We explored various GEO datasets containing expression data from different types of pediatric brain tumors, and we identified miRNAs that could serve as candidate biomarkers in their diagnosis, prognosis and therapy.
2. Materials and Methods
2.1. Collection and Analysis of Variables
Along with the microarray data we collected categorical variables for all tumor and control samples. In particular, we collected the following categorical variables: gender, age, country of origin of the study, survival at biopsy, diagnosis, anatomic location in the brain, tumor grade, developmental status (i.e., based on the subject’s age), sampling (if the biopsy took place at diagnosis or relapse), and clinical outcome.
2.2. Microarray Samples
We mined microarray data from the publicly available databases Gene Expression Omnibus (https://www.ncbi.nlm.nih.gov/geo/, accessed on 5 September 2020) (GEO) and ArrayExpress (https://www.ebi.ac.uk/arrayexpress/, accessed on 5 September 2020) which contain experiments on childhood CNS tumors. To this end, we combined the keywords: “childhood”, “CNS”, “brain tumor”, “primary”, “embryonal”, “central nervous system tumor”, [(pediatric tumor miRNA) AND “Homo sapiens”[porgn:__txid9606]], [(pediatric medulloblastoma miRNA) AND “Homo sapiens”[porgn:__txid9606]], [(pediatric astrocytoma miRNA) AND “Homo sapiens”[porgn:__txid9606]], [(pediatric ependymoma miRNA) AND “Homo sapiens”[porgn:__txid9606]]. From the recovered experiments (GEO Series) we selected only those concerning miRNA expression. Our search finally included 10 different series, as well as in-house microarray experiments concerning miRNA expression. In total, we collected data from 451 CNS tumor samples for further analysis, yet 12 samples were removed because they included patients older than 60 years old (Table 1).

Table 1.
Summary of the microarray experiments (data series) used in the present study (Legend: GCTs: Intracranial pediatric germ cell tumors).
2.3. Microarray Data Pre-Processing
The extracted microarray data were entered into a Microsoft Excel® file. In order to identify the common miRNAs across all series we used the miRNA symbols as the common “denominator” across all series. Since each series had multiple occurrences of miRNAs, they were entered in a diagonal form in a hyper-matrix (Figure 1), in which the rows correspond to miRNA symbols, columns correspond to samples and the individual series were inserted diagonally. Empty cells were replaced with “NaN”.
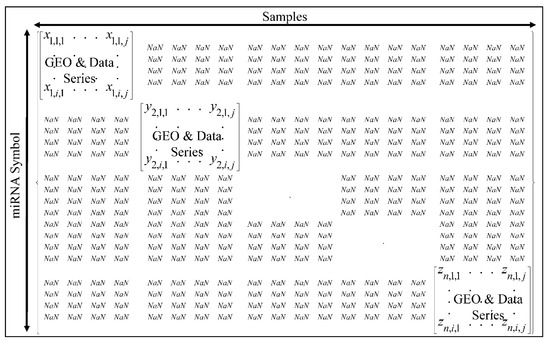
Figure 1.
The hyper-matrix containing all data series for further processing, where n is the data series, i is the miRNA and j the respective sample.
2.4. Microarray Data Post-Processing
Microarray data were processed in Matlab®. They were initially background corrected using the multiplicative background correction (MBC) approach [26]. Specifically, MBC subtracts the logarithmic estimates of the background intensity from the logarithmic foreground intensity. Where no background data were provided in the GEO data series, microarray data were considered as background corrected and further correction was applied. In particular, the data series for which no background correction was applied were: GSE34016, GSE62367, GSE63319, GSE66968, and GSE84747.
After background correction, negative values were removed and replaced with “NaN” values. Our intention was to find miRNA expression, even those of low expression values. It is possible that not only those values that are of great difference are of importance, but also that those that have very low expression values could be of biological importance.
Microarray data normalization was then performed using three algorithms: (a) Loess [27], (b) Rank Invariant, and (c) Quantile algorithm. To account for batch effects, we divided the matrix elements by the global mean. To account for differences across series we used the log2-transformed ratio, which is performed as:
where, Ri,j is the global mean-transformed ratio, xi,j is the expression value of gene i and sample j, Xi,j is the restructured value of the ith gene and jth sample.
The three algorithms were compared for their efficiencies. In general, the Quantile algorithm performed better as compared to the other two. The normalized data are provided as supplementary data (Table S1).
To reduce the complexity of the data set, we followed the replicate averaging approach proposed by Uzman et al. [28]. We used the Student’s t-test [29] to identify the differentially expressed miRNA genes (DE miRNAs) across all tumor samples as compared to all control samples. The false discovery rate (FDR) was calculated as previously described [30,31,32]. The DE miRNA genes per experiment were identified at a confidence level of 95%. DE miRNAs were treated in two different ways. Data were further processed and analyzed as “ratios”, i.e., as gene expression values calculated as the log2-transformed ratio of each tumor sample over the mean of all control samples, using the following formula:
where E is the expression value, FTumor,i,j is the expression value of tumor sample i and miRNA j, is the mean expression value of all controls and miRNA j.
In addition, data were also analyzed as “naturals”, meaning DEGs that are non-log2-transformed and thus including the control and tumor samples separately.
2.5. Unsupervised Classification Methods
DEGs were further analyzed for common expression patterns using classification methods, using Matlab®. To gain further insight into the gene expression data, we used unsupervised hierarchical clustering (HCL) and k-means classification [33,34]. HCL with dendrogram was used and correlations were calculated with Euclidean distance. K-means classification [33,34] was recently reported as one of the best performing clustering approaches for microarray class discovery studies [35]. We applied the squared Euclidean as a distance measure, since it is generally considered to be a more appropriate measure for use with k-means and found to outperform for ratio-based measurements [36]. We used 100 iterations and the optimal cluster number for the k-means algorithm was estimated using the Calinski–Harabasz criterion. Complete k-means clusters, centroids and sorted centroids [37] were utilized. The DE miRNAs were also classified based on their diagnosis categorical variable. In particular, the mean values of all samples with respect to the diagnosis was estimated and the resulting descriptive statistical measure was utilized for further k-means classification. Gene expression was also analyzed with respect to the chromosomal distribution of the DE miRNAs. We explored the mean expression per chromosome and heat-maps of chromosomal-related expression.
2.6. Common Expression Patterns in DE miRNAs
DE miRNAs were examined for possible common expression patterns, i.e., miRNAs that were either down- or up-regulated in all CNS tumor samples, irrespectively of the tumor diagnosis. The clusters revealed by unsupervised classification were examined separately. Each miRNA was counted for its occurrences for up- or down-regulation in all samples and the result was divided by the total number of samples, giving the percentage of up- or down-regulated samples of the respective miRNA. We have looked for miRNAs that were either up or down-regulated in all samples (100%), in 90–99% of all samples, 80–89% of all samples and 75–80% of all samples.
2.7. Receiver Operating Characteristic (ROC) Analysis
ROC curves and naïve Bayes classification were used to investigate the diagnostic ability of the co-deregulated miRNAs between CNS tumors and control samples. In the case of naïve Bayes classification, the algorithm used Bayes theorem, and (naively) assumes that the predictors are conditionally independent, given a class. Naïve Bayes classifiers assign observations to the most probable class (in other words, the maximum a posteriori decision rule).
2.8. Statistical Analysis
For comparisons between groups, the Student’s t-test and one-way analysis of variance (ANOVA) were performed for the continuous variables and chi-square tests were used for the categorical variables. Post hoc comparisons (adjusted with Bonferroni criterion) were also performed when significant differences (p < 0.05) of the variables in ANOVA tests were identified. A value of p < 0.05 (two-tailed) was set as the level of significance.
Chi-square test of independence was used to evaluate the association between patients’ characteristics. The characteristics that were found statistically significant were entered into a logistic regression model in order to evaluate the probability of having multiple positive reactions. The modeling of a quantitative variable based on one or more qualitative and quantitative parameters, was performed through linear regression. Multiple logistic regression was performed in order to evaluate the probability of having multiple positive reactions. The relative risk (RR), odds ratio (OR), and absolute risk (AR) were calculated.
2.9. Gene Ontology (GO) Enrichment Analysis
We performed GO enrichment analysis using the gprofiler [38] and WebGestalt web-tools [39]. Relations of the differentially expressed genes and the transcription factor binding motifs were further investigated using the Pubgene Ontology Database (www.pubgene.org, accessed on 5 September 2020). Gene definitions and functions were based on the National Institute of Health databases (http://www.ncbi.nlm.nih.gov/sites/entrez/, accessed on 5 September 2020).
2.10. Pathway Analysis
Pathway analysis was performed using the gprofiler [38] and WebGestalt web-tools [39].
3. Results
3.1. CNS Sample Cohort
In total, we analyzed 439 CNS samples (97 females and 165 males and 81 fetuses of unknown gender, as well as 171 samples for which no data were available). The total number of neoplasms were 195, irrespectively of the tumor type, and the control samples were 244. The majority of tumor samples were malignant (n = 154), followed by benign tumors (n = 41), mainly of grade I. Our sample cohort consisted of 53 grade I tumors, 18 grade II, 12 grade III and 92 grade IV tumors. Descriptive statistics of our sample cohort are summarized in Table 2.
Table 2.
The sample cohort that was used in the present study.
3.2. Deregulated (DE) miRNAs
We identified 406 co-deregulated (DE) miRNA genes across all CNS tumor samples (p-value < 0.05 and FDR < 0.0019). DE miRNAs, were further processed to identify for similar patterns of expression and Gene Ontology (GO) enrichment analysis.
3.3. Chromosomal Distribution of DE miRNAs
We analyzed the chromosomal distribution of the co-deregulated miRNAs across all CNS tumor samples. This included the estimation of the mean expression of the co-DE miRNAs per chromosome, as well as per chromosomal location (Figure 2). Although one would expect to find higher values of DE miRNA expression in longer chromosomes, such as chromosomes 1–5, we noticed that the highest expression was manifested by miRNAs located in chromosome 21. Also, chromosome 20 manifested the lowest miRNA expression in all CNS tumor samples, as expected due to its short chromosomal length (Figure 2A). In order to obtain a panoramic view of the chromosome-related expression across all samples, we created a heat-map with respect to chromosomal expression, which could provide a hint of the co-DE miRNAs (Figure 2B). In addition, when examining the mean miRNA expression with respect to their chromosomal location, we found that the co-upregulated miRNAs harbored primarily in chromosomal regions 17q23.1, 21q21.3 and 3q26.2. On the other hand, co-down-regulated miRNAs were primarily located in chromosomal regions 19p13.2, 1q23.1 and 2q37.3 (Figure 2C). We also created a heat-map for all chromosomal locations, which confirmed the possible presence of co-DE miRNAs (Figure 2D).
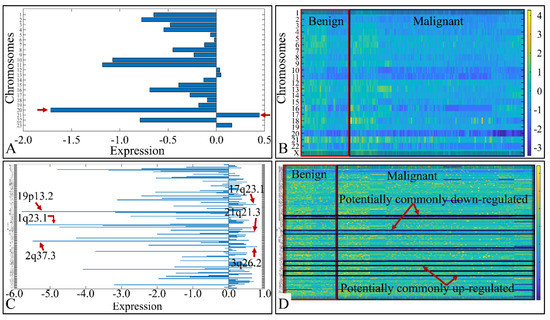
Figure 2.
miRNA expression with respect to their chromosomal distribution (A) and location (C). The heat-maps depict the chromosome-related expression of the DE miRNAs (B), and their chromosomal location (D) (Legend: in sub-figure (A) the x-axis corresponds to miRNA expression and the y-axis to chromosome number. In sub-figure (B) the x-axis corresponds to tumor samples, the y-axis to chromosome number. In sub-figure (C), the x-axis corresponds to miRNA expression and the y-axis to chromosomal locations. In sub-figure (D) the x-axis corresponds to tumor samples, the y-axis to chromosomal locations and the z-axis (the heat-map) to miRNA expression).
3.4. Unsupervised K-Means Classification
Classification algorithms are a valuable tool for the detection of common patterns across a gene expression dataset. Using k-means classification we clustered the DE miRNAs into four clusters, with no obvious pattern, corroborating the heterogeneity of the various types of CNS tumors (Figure 3). Each of them was then clustered hierarchically, to find potential patterns of expression (Figure 4, Figure 5, Figure 6 and Figure 7). As expected, the DE miRNAs did not successfully cluster the different types of CNS tumors. However, clusters 1.3, 1.4 (Figure 4), 2.3 (Figure 5), 4.2, 4.3 and 4.8 (Figure 7) manifested similar expression patterns between astrocytomas and medulloblastomas, suggesting common regulatory mechanisms between these two CNS tumor types.
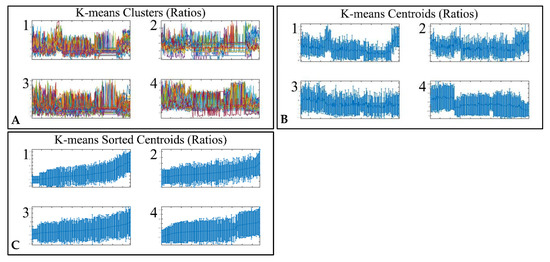
Figure 3.
Unsupervised k-means clustering of DE miRNAs. Clustering resulted in four clusters (A), which are presented with their centroids (B) and the respective sorted centroids (C).
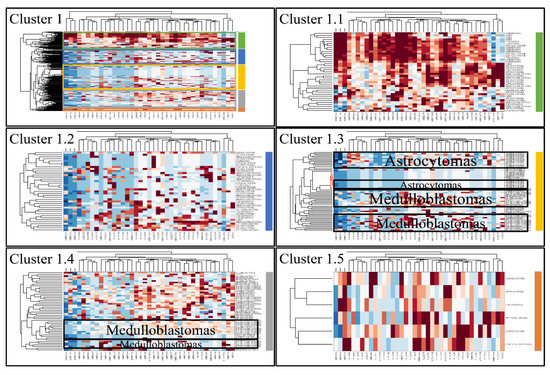
Figure 4.
Hierarchical clustering (HCL) of cluster 1 as revealed previously by k-means clustering. The complete HCL is presented (Cluster 1) with its respective sub-clusters, denoted as clusters 1.1, 1.2, 1.3, 1.4 and 1.5. In sub-clusters 1.3 and 1.4, the DE miRNAs grouped together astrocytoma and medulloblastomas (at the right side of HCL for cluster 1, selected cluster are marked with different colors. Each sub-cluster is presented with its respective color).
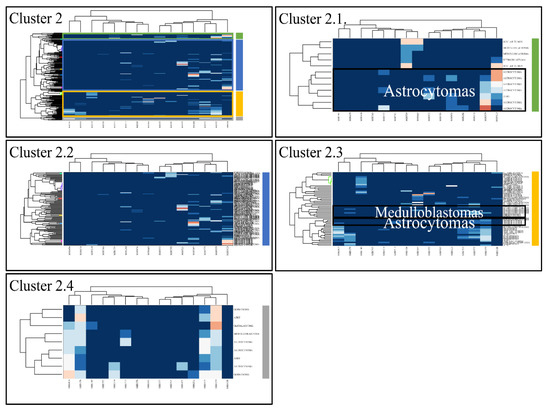
Figure 5.
Hierarchical clustering (HCL) of cluster 2 as revealed previously by k-means clustering. The complete HCL is presented (Cluster 2) with its respective sub-clusters, denoted as clusters 2.1, 2.2, 2.3 and 2.4. In sub-cluster 2.3 miRNAs grouped together astrocytomas and medulloblastomas.
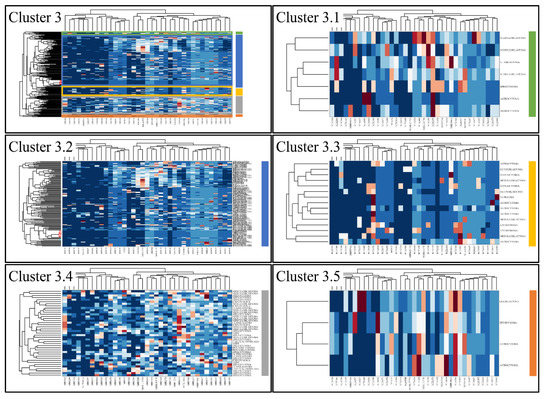
Figure 6.
Hierarchical clustering (HCL) of cluster 3 as revealed previously by k-means clustering. The complete HCL is presented (Cluster 3) with its respective sub-clusters, denoted as clusters 3.1, 3.2, 3.3 3.4 and 3.5.
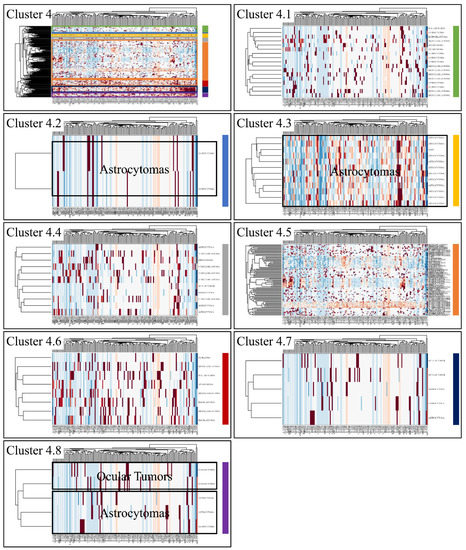
Figure 7.
Hierarchical clustering (HCL) of cluster 4 as revealed previously by k-means clustering. The complete HCL is presented (Cluster 4) with its respective sub-clusters, denoted as clusters 4.1, 4.2, 4.3, 4.4, 4.5, 4.6, 4.7 and 4.8. In sub-cluster 4.2, 4.3 and 4.8 miRNAs grouped together astrocytomas and ocular tumors.
3.5. Common DE miRNAs in Different CNS Tumor Types
We then examined each k-means cluster separately aiming to find co-deregulatory patterns of expression among all CNS tumors. We found several miRNAs that were globally up- or down-regulated in all tumor samples.
In particular, in cluster 1, MIR376B and MIR372 were globally up-regulated across most tumors (>75% and <100%) (Figure 8A,B). In cluster 2, MIR149, MIR214, MIR574, MIR595 and MIR765 were globally down-regulated across all CNS tumor samples (Figure 8C,D); ten miRNA genes were also found globally down-regulated in >90% of all samples (Figure 8E). In cluster 3 (Figure 8F) we detected 23 globally down-regulated miRNAs (>90%) (Figure 8G) and in cluster 4 (Figure 8H), 21 globally up-regulated miRNAs (>90%) (Figure 8I). The results of this analysis are also summarized in Table 3.
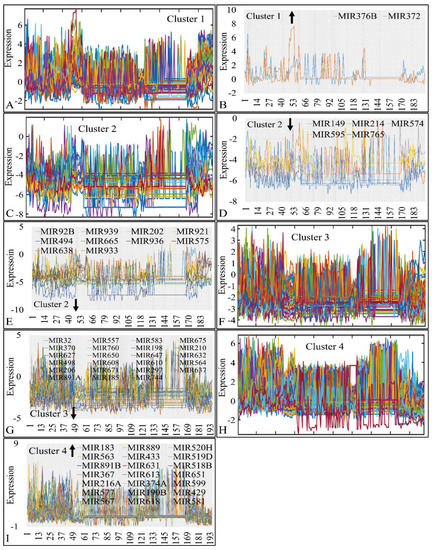
Figure 8.
Common DE miRNAs across all CNS tumor samples. The co-DE miRNAs are presented in each k-means cluster (1–4). Each k-means cluster is presented separately along with the individual genes manifesting global up- or down-regulation. In particular, cluster 1 (A), manifested two globally up-regulated miRNAs (>75% and <100%) (B), cluster 2 (C), manifested five globally down-regulated miRNAs, which also consisted of a special case as they were down-regulated in all samples (100%) (D) and 10 globally down-regulated miRNAs in >90% of all samples (E), cluster 3 (F) manifested 23 globally down-regulated miRNAs (>90%) (G) and cluster 4 (H) manifested 21 globally up-regulated miRNAs (>90%) in all samples (I) (the arrow next to cluster number signifies the tendency of miRNAs in the respective cluster).
Table 3.
Common up- and down-regulated miRNAs across all CNS tumors. K-means clusters were also analyzed for the presence of co-DE miRNAs in all samples. MiRNAs were considered to manifest a common pattern of expression if they were globally up-regulated in at least >75% of all samples or down-regulated in at least >90% of all samples. All miRNAs were sorted with respect to their cluster presence.
3.6. Descriptive K-Means
We analyzed the gene expression patterns, aiming to discover tumor groups according to their mean expression values. For example, we searched for an ascending or descending order of expression, based on the tumor’s characteristics, including tumor aggressiveness, diagnosis etc.
Interestingly, a set of genes manifested an ascending order with respect to the classification of tumors as malignant, benign and controls (denoted as “Second Diagnosis”). Clustering analysis (Figure 9A–C) manifested four clusters, where the fourth cluster manifested the aforementioned ascending behavior (Figure 9D). The DE miRNAs in cluster 4 included: MIR1202, MIR1207, MIR1243, MIR1246, MIR1307, MIR1469, MIR1915, MIR2861, MIR3130, MIR3143, MIR3178, MIR3191, MIR3196, MIR3202, MIR320A, MIR320E, MIR3613, MIR3621, MIR3665, MIR3667, MIR3679, MIR3684, MIR4261, MIR4267, MIR4280, MIR4281, MIR4330, MIR494, MIR500B, MIR514B, MIR550, MIR560, MIR638 and MIRLET7A2.
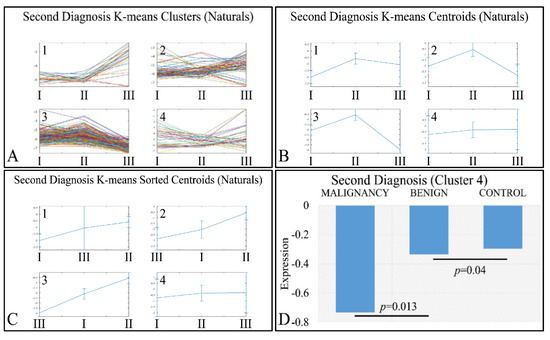
Figure 9.
K-means clustering of DE miRNAs with respect to second diagnosis (controls, benign or malignant tumors), presented with the respective clusters (A), the centroids (B) and the sorted centroids (C). Cluster 4 manifested an ascending pattern from malignant tumors to controls (D). The expression levels were found to be significantly different between malignant and benign tumors, as well as between benign tumors and controls (Legend: I: Malignancy, II: Benign, III: Controls. Expression values range in the negative domain because we have used the log2-transformed natural values, in order to better visualize the differences).
An interesting pattern was also manifested with respect to tumor grading. We performed k-means clustering (Figure 10A–C), where clusters 2 (Figure 10D), 3 (Figure 10E) and 4 (Figure 10F) manifested as ascending pattern of expression. In particular, the control samples had the lowest expression levels, compared to the tumor samples, followed by tumors of grade IV and thereafter, by tumors of grades I, II and III. It apprears that the transition from the control samples to the most aggressive tumor types is direct, while the transition from lower tumor grades (I to III) follows a gradual pattern.
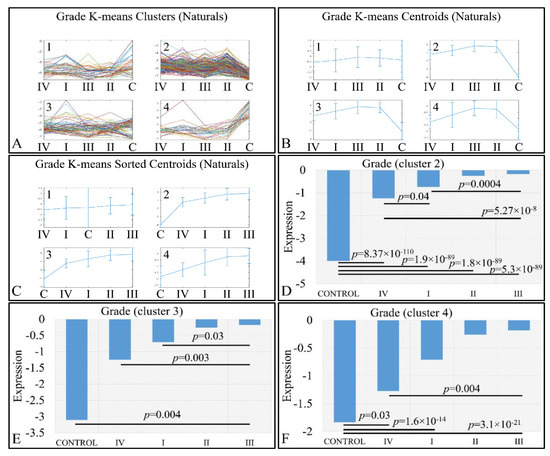
Figure 10.
Expression patterns of miRNAs with respect to tumor grade, utilizing k-means clustering. Tumor grade includes the classification of tumors in five general categories: control and tumor grading from I to IV, which is presented with the respective clusters (A), the centroids (B) and the sorted centroids (C). Clusters 2 (D), 3 (E) and 4 (F) manifested an ascending motif from controls to grade IV, I, II and III. Significant differences between tumor grades are noted in the respective clusters (Legend: I: tumor grade I, II: tumor grade II, III: tumor grade III, IV: tumor grade IV).
We also examined this pattern with respect to the log2-transformed ratios (tumors/controls), and found a similar pattern (Figure 11). K-means clustering (Figure 11A–C) manifested four clusters, where cluster 1 (Figure 11D) and cluster 3 (Figure 11E) manifested the same interesting behavior as in the previously observed behavior; yet, when the control samples were included, the only significant difference observed was between grades I and IV (Figure 11E). However, in the case of cluster 4, tumor grade appeared to play a role in miRNA expression, in an ascending order from grade I to grade III, followed by tumors of grade IV (Figure 11F). Significant differences were manifested between tumor grades, as presented in Figure 11F.
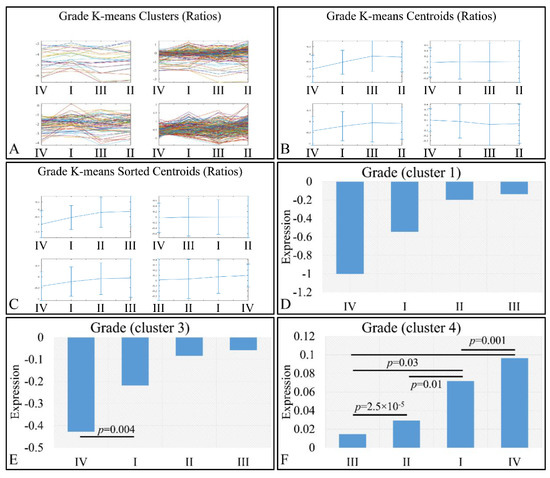
Figure 11.
Expression patterns of miRNAs with respect to tumor grade utilizing k-means clustering and the log2-transformed ratios (tumors/controls). Tumor grade includes the classification of tumors into four general categories: tumor grading from I to IV, which is presented with the respective clusters (A), the centroids (B) and the sorted centroids (C). Clusters 1 (D) and 3 (E) manifested an ascending pattern from controls to grade IV, I, II and III, while cluster 4 manifested an ascending order from grade III to grade I and IV (F). Significant differences between tumor grades are noted in the respective clusters (Legend: I: tumor grade I, II: tumor grade II, III: tumor grade III, IV: tumor grade IV).
3.7. Functional Analysis of DE miRNAs
The next step included the examination of the commonly expressed miRNAs, as well as those miRNAs that manifested expression patterns in each of the above-mentioned tumor catogories, for their functional properties.
3.7.1. Gene Ontology Enrichment Analysis of Commonly Expressed miRNAs
The globally co-DE miRNAs (i.e., up- or down-regulated across all CNS tumors) were examined for their functional profiles, using Gene Ontology (GO) enrichment analysis. As expected, the co-DE miRNAs were also involved in mRNA binding (Molecular Function), gene silencing, regulation of developmental processes and vasculature morphogenesis (Biological Process) and were located in the extracellular space (Cellular Component) (Figure 12).
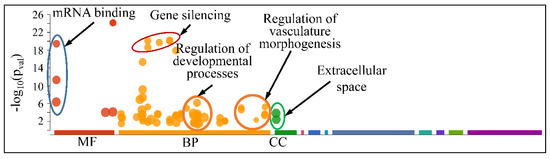
Figure 12.
Functional annotation (GO enrichment analysis) of miRNAs found to be globally deregulated across all CNS tumor samples (Legend: MF: Molecular Function, BP: Biological Process, CC: Cellular Component).
However, when separating the DE miRNAs into those being globally up-regulated and down-regulated, we found that the first were annotated in less functions, which included mRNA binding (Molecular Function) and gene silencing and the regulation of gene expression (Biological Process) (Figure 13); meanwhile, the latter further participate in the regulation of developmental processes and vasculature morphogenesis (Biological Process) (Figure 14). It is noteworthy that it appeared that there was a distinct separation between the co-up- and down-regulated miRNAs with respect to their annotated functions, signifying that down-regulated miRNAs affect more developmental properties and the regulation of cell proliferation.
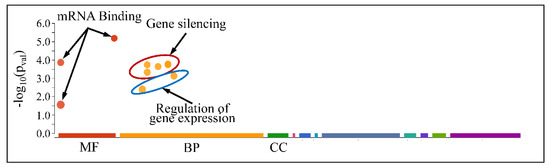
Figure 13.
Functional annotation of miRNAs found globally up-regulated in all tumor samples (Legend: MF: Molecular Function, BP: Biological Process, CC: Cellular Component).
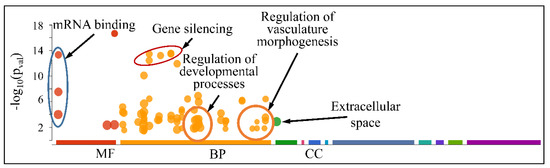
Figure 14.
Functional annotation of miRNAs found globally down-regulated in all tumor samples (Legend: MF: Molecular Function, BP: Biological Process, CC: Cellular Component).
3.7.2. The Special Case of Down-Regulated miRNAs across All CNS Tumor Samples
As aforementioned, our search for common miRNAs revealed five miRNAs (MIR149, MIR214, MIR574, MIR595 and MIR765) that were down-regulated across all CNS tumor samples (100% of all cases). Target prediction analysis showed that these miRNAs had 2893 unique mRNA targets. When examining the functional annotation of their mRNA targets, we found that they participated in functions such as neuronal morphogenesis (nervous system development, generation of neurons, neuron projection development and neuron projection morphogenesis, among others), axon formation, synaptic function, as well as developmental processes (Figure 15 and Table 4).
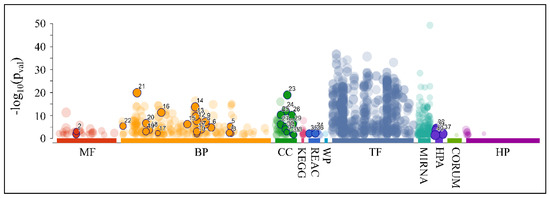
Figure 15.
Functional annotation of the predicted mRNA targets for the co-downregulated miRNAs: MIR149, MIR214, MIR574, MIR595 and MIR765 (Legend: MF: Molecular Function, BP: Biological Process, CC: Cellular Component, KEGG: KEGG pathway database, REAC: Reactome pathway database, WP: WikiPathways, TF: Transcription Factor Binding Motifs, MIRNA: MiRNA Targets, HPA: The Human Protein Atlas, CORUM: The Comprehensive Resource of Mammalian Protein Complexes, HP: Human Phenotype Ontology).
Table 4.
The respective functional annotation of the predicted mRNA targets for the co-downregulated miRNAs: MIR149, MIR214, MIR574, MIR595 and MIR765. The colors correspond to the annotation colors presented in Figure 14 (Legend: MF: Molecular Function, BP: Biological Process, CC: Cellular Component, KEGG: KEGG pathway database, REAC: Reactome pathway database, HPA: The Human Protein Atlas).
3.7.3. Functional Analysis of the DE miRNAs Manifested Expression Patterns
Accordingly, we searched for the functional properties of the DE miRNAs with respect to the ascending patterns observed either for diagnosis (Figure 9) or tumor grade (Figure 10 and Figure 11). The DE miRNAs that participated in cluster 4 (Figure 9) did not manifest any significant functional annotations. On the contrary, the miRNAs that manifested an expression pattern with respect to the tumor grade (Figure 10 and Figure 11) were found to participate in functions such as angiogenesis, blood vessel developmental processes and vascularization, as well as cell proliferation (Figure 16). This was an interesting finding, since it appeared that miRNAs participating in tumor grading were related to angiogenesis, a significant characteristic of tumor growth.
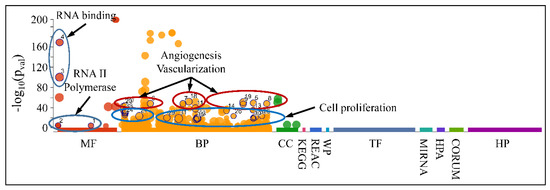
Figure 16.
Functional annotation of miRNAs found to manifest an expressional pattern with respect to the tumor grade. (Legend: MF: Molecular Function, BP: Biological Process, CC: Cellular Component, KEGG: KEGG pathway database, REAC: Reactome pathway database, WP: WikiPathways, TF: Transcription Factor Binding Motifs, MIRNA: MiRNA Targets, HPA: The Human Protein Atlas, CORUM: The Comprehensive Resource of Mammalian Protein Complexes, HP: Human Phenotype Ontology).
3.8. ROC Analysis of Globally Down-Regulated miRNAs
In order to investigate the diagnostic ability of the globally down-regulated miRNAs, we also performed a receiver operating characteristic curve (ROC) analysis with respect to the control and neoplasmatic samples. Confirming our previous observations, the five co-downregulated miRNAs (MIR149, MIR214, MIR574, MIR595 and MIR765) could successfully discriminate the controls and CNS tumor samples with an area under the curve (AUC) ≥ 0.925 (p < 0.001), corroborating their use as diagnostic markers (Figure 17A–E).
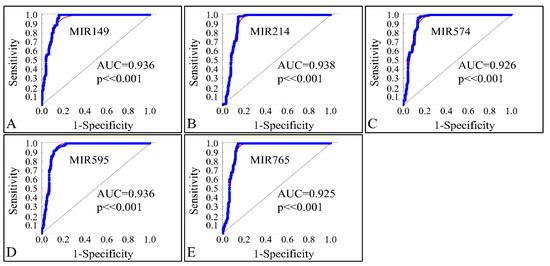
Figure 17.
ROC analysis of MIR149 (A), MIR214 (B), MIR574 (C), MIR595 (D) and MIR765 (E). The miRNAs could successfully discriminate the controls and neoplasmatic CNS tumor samples with an area under the curve (AUC) ≥ 0.925 (p < 0.001), corroborating their use as diagnostic markers (Legend: AUC: Area under the Curve).
4. Discussion
MicroRNAs are considered as key modulating molecules in cellular epigenetic processes. In addition, they offer insight to many processes in normal and tumor cells. However, the study of miRNAs often involves hybridization-based microarray technologies, a high-throughput technology, that may generate a large opportunity for errors when used for testing their expression. Due to such limitations, all experiments must be regulated and controlled to reduce the chances of error regarding the produced data. In addition, other technologies must be implemented as a way to confirm the results of the microarrays.
In the present approach we used high throughput expression data and processed them to find common expression patterns between different childhood CNS tumors. There are numerous works concerning the role of miRNAs in CNS tumors, such as childhood embryonal tumors [1,18,40,41,42,43,44,45,46], astrocytoma [24,47,48], glioblastoma [49,50,51], ependymoma [52] and others. Yet, all the previous studies concerned the role of miRNAs in specific tumor types.
We followed a different approach, in which we introduced a novel concept of examining the role of miRNAs, simultaneously in the majority of the different CNS tumor types. To the best of our knowledge, there are no previous works similar to this approach. Although this type of approach could appear bold, it has several advantages. The identification of global biomarkers for CNS tumors is very useful, since CNS tumors manifest a challenge both due to their anatomic position as well as their severity. On the other hand, therapy constitutes a real peril for patients, since even in the cases of benign neoplasms both surgery and chemotherapy could prove dangerous for the patient. Thus, our skepsis leans towards the identification of biomarkers that could be used in all CNS tumor cases. Is such an approach possible? It could prove to be a tedious task. Yet, our reasoning is based on the hypothesis that tumors, irrespective of their type, follow a common machinery (at least to an extent), which is still unidentifiable. No matter how different the tumor is, which varies even from one patient to another, there are common signatures that lead oncogenesis, but most importantly tumor ontogenesis. Therefore, the identification of such biomarkers could be facilitated by similar approaches, such as the one presented here.
We found previously uncharacterized miRNA genes in pediatric CNS tumors, including MIR149, MIR214, MIR574 and MIR765, apart from one study that reported MIR595 upregulation in glioblastoma compared to control cells, in vitro [53]. Other miRNAs were also previously reported to regulate epithelial-to-mesenchymal transition (EMT) [54,55] and participate in CNS tumors, such as MIR34A. The overexpression of miR-34a was previously observed in pediatric ependymomas [56], pediatric pilocytic astrocytoma [17] and in pediatric low- and high-grade astrocytoma [57], suggesting that it plays a global oncogenic role in pediatric brain malignancies. miR-34 has been reported to be dysregulated in various human cancers and regarded as a tumor suppressive microRNA because of its synergistic effect with the well-known tumor suppressor p53 [58]. However, in this study MIR34A was not within the top co-DE miRNAs.
Before further discussing the individual miRNAs with respect to the literature, we need to note an interesting remark. Our sampling consisted of a large variety of CNS tissues, where some included fetal and neonatal samples. It is certain that the developing brain has a dynamic transcriptomic profile, which changes both spatially (with respect to brain location) as well as temporally [21]. Thus, it is possible that an analysis comparing tumor samples to normal brain tissue entails the problem of discovering different genes due to the tissue’s developmental stages and not due to the differences in pathology. First of all, it is important to highlight that in the case of CNS tumors one of the greatest problems is the obtainment of control samples, since biopsies of normal CNS tissue are extremely rare and difficult. Therefore, all available normal CNS samples are not to be unthoughtfully disregarded. Therefore, our first observation is that such a possibility cannot be ruled out. In order to completely remove this problematic, it is imperative to match samples (patients and controls) by age or use as controls adjacent (to the tumor) normal tissue. However, both approaches have their disadvantages. The first is that using only specific age groups restricts the number of available samples as well as the global temporal dynamics of gene regulation. On the other hand, using adjacent tissue that is considered to be normal has the disadvantage of including micro-environmental effects of the tumor on the nearby tissue [59,60,61]. A global approach has the disadvantage of identifying genes similar to both tissues with respect to their developmental machinery, yet this could also be an advantage. Another concept that we have to bear in mind is that tumors utilize a large part of the developmental machinery for their ontogenesis (and probably oncogenesis), which attributes to both normal developmental tissues and CNS tumors a common transcription profile [62,63,64,65,66]. Let us suppose that differentially expressed genes are found due to the difference in age (for example fetal/neonatal vs. child) and not the pathological state. The presence of developmental genes as differentially expressed indicates first of all that in tumors, developmental processes are active and most importantly they are different from one type of tissue to the other and secondly, that the tumor utilizes similar growth mechanisms to normal brain development [64,67]. Further on, in our study we have found that globally up- or down-regulated miRNAs manifested developmental-like functions, which confirmed the aforementioned reasoning. In addition, the identified developmental processes were attributed probably to the globally down-regulated miRNAs, which indicated that tumor tissues were utilizing the developmental machinery. Finally, there is a diversity in the use of control samples throughout the literature, where several studies have used age-matched [22] samples and others did not [19,20,24].
Interestingly, the majority of the co-DE miRNAs were found to be up-regulated (n = 261), and less down-regulated (n = 145). Yet, the co-down-regulated miRNAs manifested their DE profile in more tumor samples compared to the up-regulated ones. For example, five miRNAs were found to be down-regulated simultaneously across all CNS tumors, while no miRNA was found to be up-regulated in all the tumor samples. It is noteworthy that the down-regulated miRNAs participated in more functions, including the regulation of developmental processes, while the up-regulated miRNAs participated in many less functions. Yet, the up-regulated miRNAs are of greater importance with respect to therapy, since the over-expressed miRNAs can be inhibited using oligonucleotides that are perfectly complementary to their mature miRNA targets, whereas the transfection of miRNA mimics (chemically synthesized double-stranded RNA molecules) to imitate mature miRNA duplexes, a more difficult task. The difficulty lies in that it is unclear whether the transfected miRNAs behave similarly to endogenous miRNAs.
Although many of the up-regulated miRNAs that we found are not known to participate in CNS tumors, MIR183 has been previously reported to be up-regulated in glioblastoma [68] and glioma [69,70,71]. In addition, there are two contradictory reports regarding MIR433. One study reported that MIR433 down-regulation is connected to tumor suppression [72], which was in agreement with our study, whereas another mentions that MIR433 up-regulation has tumor suppressive effects [73]. Regarding MIR519D we found only one report, stating that this miRNA is down-regulated in CNS tumors [74], conferring tumor suppressive properties; in contrast, we found that MRI519D is overexpressed in the majority of the CNS tumors. At the same time, MIR518B was up-regulated and reported to manifest tumor suppressive properties in glioblastoma [75,76]. Interestingly, MIR367 was recently found to function as tumor promoting miRNA, since its inhibition attenuates tumor aggressiveness and proliferation in embryonal tumors [77,78,79]. On the other hand, MIR613 was reported to act as a tumor suppressor, inhibiting glioma progression [80], while we found it up-regulated in the majority of the CNS tumors. Similarly, MIR216A has been reported to manifest tumor suppressing properties in glioma cells, yet it is also found that its role has been contradictory, as it participates either as tumor suppressor or oncogene depending on the tumor type [81]. In our study, MIR216A was up-regulated in the majority of the examined CNS tumors, suggesting that it functions as an oncogene. A contradictory finding concerned MIR599, which was found to be upregulated and probably act as an oncogene. Yet, MIR599 was reported in two studies to act as a tumor suppressor in glioma tumors, as it was found to be down-regulated [82,83]. Finally, MIR577 [84,85,86] and MIR429 [87,88] were previously reported to act as tumor suppressors in gliomas, while we have found them to function as oncogenes in the global setting of CNS tumors.
The present approach is reported previously in the literature. To the best of our knowledge, this is the first time such a reasoning is presented in the literature. In a previous work we have performed a similar approach for urinary bladder cancer, where we have reported that a single gene (CDC20) manifested a common profile among different subtypes of urothelial bladder cancer [89]. In the meantime, CDC20 was confirmed to be a molecule of interest for prognosis and therapy [90,91,92]. Thus, the present approach could also prove useful for the detection of therapeutic strategies. One drawback to the present approach is that several of the identified miRNAs are still unknown for their role in CNS tumors and, therefore, a series of functional investigations are required not limited to the validation of the expressional profile, but extended to the actual verification of miRNA targets.
In summary, the current study provides significant insights in the growing role of miRNA signatures in pediatric CNS neoplasms of different type, such as medulloblastomas, ATRTs, astrocytomas, ependymomas, glioblastomas and others. In general, we found good evidence that miRNAs manifest global patterns of co-deregulated expression across all CNS tumor types. Collectively, our findings highlight miRNAs that could be used as novel molecular biomarkers with a promising potential in pediatric CNS malignancies.
5. Conclusions
The present study proposed a novel approach to investigate the miRNA-related mechanisms across different types of pediatric CNS tumors. Interestingly, we found miRNAs that were globally down- and up-regulated in all CNS tumor samples. Our approach could be useful in the discovery of novel therapeutic markers for CNS tumors, yet further research is required in order to confirm miRNAs’ functions.
Supplementary Materials
The following are available online at https://www.mdpi.com/article/10.3390/cancers13123028/s1, Table S1: Quantile normalized microarray data.
Author Contributions
G.I.L.; Conceptualization, methodology, software, validation, formal analysis, investigation, resources, data curation, writing-original draft preparation, visualization, supervision, project administration, funding acquisition, M.B.; methodology, resources, validation, writing-review and editing, A.Z.; validation, writing-review, editing and proof-reading, funding acquisition. All authors have read and agreed to the published version of the manuscript.
Funding
This research received no external funding.
Institutional Review Board Statement
The study was conducted according to the guidelines of the Declaration of Helsinki, and approved by the “Aghia Sophia” Children’s Hospital Ethics Committee (Protocol No. 35/19.16/09/13).
Informed Consent Statement
Informed consent was obtained from all subjects involved in the study.
Data Availability Statement
Data are available from the corresponding author upon reasonable request.
Conflicts of Interest
The authors declare no conflict of interest.
References
- Braoudaki, M.; Lambrou, G.I. MicroRNAs in pediatric central nervous system embryonal neoplasms: The known unknown. J. Hematol. Oncol. 2015, 8, 6. [Google Scholar] [CrossRef]
- Calin, G.A.; Croce, C.M. MicroRNA-cancer connection: The beginning of a new tale. Cancer Res. 2006, 66, 7390–7394. [Google Scholar] [CrossRef]
- Georgakopoulos-Soares, I.; Chartoumpekis, D.V.; Kyriazopoulou, V.; Zaravinos, A. Emt factors and metabolic pathways in cancer. Front. Oncol. 2020, 10, 499. [Google Scholar] [CrossRef]
- Garzon, R.; Calin, G.A.; Croce, C.M. MicroRNAs in Cancer. Annu. Rev. Med. 2009, 60, 167–179. [Google Scholar] [CrossRef]
- Zaravinos, A.; Lambrou, G.I.; Mourmouras, N.; Katafygiotis, P.; Papagregoriou, G.; Giannikou, K.; Delakas, D.; Deltas, C. New miRNA profiles accurately distinguish renal cell carcinomas and upper tract urothelial carcinomas from the normal kidney. PLoS ONE 2014, 9, e91646. [Google Scholar] [CrossRef]
- Wang, B.; Li, D.; Kovalchuk, O. p53 Ser15 phosphorylation and histone modifications contribute to IR-induced miR-34a transcription in mammary epithelial cells. Cell Cycle 2013, 12, 2073–2083. [Google Scholar] [CrossRef]
- Migliore, C.; Giordano, S. Resistance to targeted therapies: A role for microRNAs? Trends Mol. Med. 2013, 19, 633–642. [Google Scholar] [CrossRef]
- Petrelli, A.; Perra, A.; Cora, D.; Sulas, P.; Menegon, S.; Manca, C.; Migliore, C.; Kowalik, M.A.; Ledda-Columbano, G.M.; Giordano, S.; et al. MicroRNA/gene profiling unveils early molecular changes and nuclear factor erythroid related factor 2 (NRF2) activation in a rat model recapitulating human hepatocellular carcinoma (HCC). Hepatology 2014, 59, 228–241. [Google Scholar] [CrossRef]
- Calin, G.A.; Sevignani, C.; Dumitru, C.D.; Hyslop, T.; Noch, E.; Yendamuri, S.; Shimizu, M.; Rattan, S.; Bullrich, F.; Negrini, M.; et al. Human microRNA genes are frequently located at fragile sites and genomic regions involved in cancers. Proc. Natl. Acad. Sci. USA 2004, 101, 2999–3004. [Google Scholar] [CrossRef] [PubMed]
- Fernandez, L.A.; Northcott, P.A.; Taylor, M.D.; Kenney, A.M. Normal and oncogenic roles for microRNAs in the developing brain. Cell Cycle 2009, 8, 4049–4054. [Google Scholar] [CrossRef]
- Northcott, P.A.; Fernandez, L.A.; Hagan, J.P.; Ellison, D.W.; Grajkowska, W.; Gillespie, Y.; Grundy, R.; Van Meter, T.; Rutka, J.T.; Croce, C.M.; et al. The miR-17/92 polycistron is up-regulated in sonic hedgehog-driven medulloblastomas and induced by N-myc in sonic hedgehog-treated cerebellar neural precursors. Cancer Res. 2009, 69, 3249–3255. [Google Scholar] [CrossRef]
- Jiang, H.; Zhang, G.; Wu, J.H.; Jiang, C.P. Diverse roles of miR-29 in cancer (review). Oncol. Rep. 2014, 31, 1509–1516. [Google Scholar] [CrossRef] [PubMed]
- Keller, L.; Pantel, K. Unravelling tumour heterogeneity by single-cell profiling of circulating tumour cells. Nat. Rev. Cancer 2019, 19, 553–567. [Google Scholar] [CrossRef]
- Williams, Z.; Ben-Dov, I.Z.; Elias, R.; Mihailovic, A.; Brown, M.; Rosenwaks, Z.; Tuschl, T. Comprehensive profiling of circulating microRNA via small RNA sequencing of cDNA libraries reveals biomarker potential and limitations. Proc. Natl. Acad. Sci. USA 2013, 110, 4255–4260. [Google Scholar] [CrossRef]
- Zampetaki, A.; Willeit, P.; Drozdov, I.; Kiechl, S.; Mayr, M. Profiling of circulating microRNAs: From single biomarkers to re-wired networks. Cardiovasc. Res. 2012, 93, 555–562. [Google Scholar] [CrossRef]
- Sempere, L.F.; Freemantle, S.; Pitha-Rowe, I.; Moss, E.; Dmitrovsky, E.; Ambros, V. Expression profiling of mammalian microRNAs uncovers a subset of brain-expressed microRNAs with possible roles in murine and human neuronal differentiation. Genome Biol. 2004, 5, R13. [Google Scholar] [CrossRef]
- Birks, D.K.; Barton, V.N.; Donson, A.M.; Handler, M.H.; Vibhakar, R.; Foreman, N.K. Survey of MicroRNA expression in pediatric brain tumors. Pediatric Blood Cancer 2011, 56, 211–216. [Google Scholar] [CrossRef] [PubMed]
- Braoudaki, M.; Lambrou, G.I.; Giannikou, K.; Milionis, V.; Stefanaki, K.; Birks, D.K.; Prodromou, N.; Kolialexi, A.; Kattamis, A.; Spiliopoulou, C.A.; et al. Microrna expression signatures predict patient progression and disease outcome in pediatric embryonal central nervous system neoplasms. J. Hematol. Oncol. 2014, 7, 96. [Google Scholar] [CrossRef]
- Wang, H.W.; Wu, Y.H.; Hsieh, J.Y.; Liang, M.L.; Chao, M.E.; Liu, D.J.; Hsu, M.T.; Wong, T.T. Pediatric primary central nervous system germ cell tumors of different prognosis groups show characteristic miRNome traits and chromosome copy number variations. BMC Genom. 2010, 11, 132. [Google Scholar] [CrossRef]
- Jones, T.A.; Jeyapalan, J.N.; Forshew, T.; Tatevossian, R.G.; Lawson, A.R.; Patel, S.N.; Doctor, G.T.; Mumin, M.A.; Picker, S.R.; Phipps, K.P.; et al. Molecular analysis of pediatric brain tumors identifies microRNAs in pilocytic astrocytomas that target the MAPK and NF-κB pathways. Acta Neuropathol. Commun. 2015, 3, 86. [Google Scholar] [CrossRef]
- Moreau, M.P.; Bruse, S.E.; Jornsten, R.; Liu, Y.; Brzustowicz, L.M. Chronological changes in microRNA expression in the developing human brain. PLoS ONE 2013, 8, e60480. [Google Scholar] [CrossRef] [PubMed]
- Edward, D.P.; Alkatan, H.; Rafiq, Q.; Eberhart, C.; Al Mesfer, S.; Ghazi, N.; Al Safieh, L.; Kondkar, A.A.; Abu Amero, K.K. MicroRNA profiling in intraocular medulloepitheliomas. PLoS ONE 2015, 10, e0121706. [Google Scholar] [CrossRef]
- Castro-Magdonel, B.E.; Orjuela, M.; Camacho, J.; García-Chéquer, A.J.; Cabrera-Muñoz, L.; Sadowinski-Pine, S.; Durán-Figueroa, N.; Orozco-Romero, M.J.; Velázquez-Wong, A.C.; Hernández-Ángeles, A.; et al. miRNome landscape analysis reveals a 30 miRNA core in retinoblastoma. BMC Cancer 2017, 17, 458. [Google Scholar] [CrossRef] [PubMed]
- Darrigo Júnior, L.G.; Lira, R.C.P.; Fedatto, P.F.; Marco Antonio, D.S.; Valera, E.T.; Aguiar, S.; Yunes, J.A.; Brandalise, S.R.; Neder, L.; Saggioro, F.P.; et al. MicroRNA profile of pediatric pilocytic astrocytomas identifies two tumor-specific signatures when compared to non-neoplastic white matter. J. Neuro-Oncol. 2019, 141, 373–382. [Google Scholar] [CrossRef] [PubMed]
- Braoudaki, M.; Lambrou, G.I.; Giannikou, K.; Papadodima, S.A.; Lykoudi, A.; Stefanaki, K.; Sfakianos, G.; Kolialexi, A.; Tzortzatou-Stathopoulou, F.; Tzetis, M.; et al. miR-15a and miR-24-1 as putative prognostic microRNA signatures for pediatric pilocytic astrocytomas and ependymomas. Tumour Biol. 2016, 37, 9887–9897. [Google Scholar] [CrossRef]
- Zhang, D.; Zhang, M.; Wells, M.T. Multiplicative background correction for spotted microarrays to improve reproducibility. Genet. Res. 2006, 87, 195–206. [Google Scholar] [CrossRef]
- Cleveland, W.S. Robust locally weighted regression and smoothing scatterplots. J. Am. Stat. Assoc. 1979, 74, 829–836. [Google Scholar] [CrossRef]
- Uzman, B.G.; Foley, G.E.; Farber, S.; Lazarus, H. Morphologic variations in human leukemic lymphoblasts (CCRF-CEM cells) after long-term culture and exposure to chemotherapeutic agents. A study with the electron microscope. Cancer 1966, 19, 1725–1742. [Google Scholar] [CrossRef]
- Yang, I.V.; Chen, E.; Hasseman, J.P.; Liang, W.; Frank, B.C.; Wang, S.; Sharov, V.; Saeed, A.I.; White, J.; Li, J.; et al. Within the fold: Assessing differential expression measures and reproducibility in microarray assays. Genome Biol. 2002, 3, research0062. [Google Scholar]
- Klipper-Aurbach, Y.; Wasserman, M.; Braunspiegel-Weintrob, N.; Borstein, D.; Peleg, S.; Assa, S.; Karp, M.; Benjamini, Y.; Hochberg, Y.; Laron, Z. Mathematical formulae for the prediction of the residual beta cell function during the first two years of disease in children and adolescents with insulin-dependent diabetes mellitus. Med. Hypotheses 1995, 45, 486–490. [Google Scholar] [CrossRef]
- Storey, J.D.; Tibshirani, R. Statistical significance for genomewide studies. Proc. Natl. Acad. Sci. USA 2003, 100, 9440–9445. [Google Scholar] [CrossRef]
- Storey, J.D.; Tibshirani, R. Statistical methods for identifying differentially expressed genes in DNA microarrays. In Functional Genomics; Humana Press: Totowa, NJ, USA, 2003; Volume 224, pp. 149–157. [Google Scholar]
- Forgy, E.W. Cluster analysis of multivariate data: Efficiency vs. interpretability of classifications, 1965. Biometrics 1965, 21, 768769. [Google Scholar]
- Lloyd, S. Least squares quantization in PCM. IEEE Trans. Inf. Theory 1982, 28, 129–137. [Google Scholar] [CrossRef]
- Freyhult, E.; Landfors, M.; Onskog, J.; Hvidsten, T.R.; Ryden, P. Challenges in microarray class discovery: A comprehensive examination of normalization, gene selection and clustering. BMC Bioinform. 2010, 11, 503. [Google Scholar] [CrossRef]
- Gibbons, F.D.; Roth, F.P. Judging the quality of gene expression-based clustering methods using gene annotation. Genome Res. 2002, 12, 1574–1581. [Google Scholar] [CrossRef]
- Lambrou, G.; Braoudaki, M. A Novel Method for the Analysis of Gene Expression Microarray Data with K-Means Clustering: Sorted K-Means. Int. J. Eng. Res. Sci. 2016, 2, 99–105. [Google Scholar]
- Raudvere, U.; Kolberg, L.; Kuzmin, I.; Arak, T.; Adler, P.; Peterson, H.; Vilo, J. g:Profiler: A web server for functional enrichment analysis and conversions of gene lists (2019 update). Nucleic Acids Res. 2019, 47, w191–w198. [Google Scholar] [CrossRef] [PubMed]
- Zhang, B.; Schmoyer, D.; Kirov, S.; Snoddy, J. GOTree Machine (GOTM): A web-based platform for interpreting sets of interesting genes using Gene Ontology hierarchies. BMC Bioinform. 2004, 5, 16. [Google Scholar]
- Braoudaki, M.; Koutsouris, D.D.; Kouris, I.; Paidi, A.; Koutsouri, G.; George Lambrou, I. Bioinformatics and Regression Analyses Manifest Tumor-Specific miRNA Expression Dynamics in Pediatric Embryonal Malignancies. In Proceedings of the 2018 40th Annual International Conference of the IEEE Engineering in Medicine and Biology Society (EMBC), Honolulu, HI, USA, 18–21 July 2018; pp. 5834–5837. [Google Scholar] [CrossRef]
- Braoudaki, M.; Sarafidis, M.; Koutsouris, D.D.; Koutsouri, G.; Lambrou, G.I. Bioinformatics Analysis Reveals Ki-67 Specific microRNA Functions in Pediatric Embryonal Tumors. In Proceedings of the 2019 41st Annual International Conference of the IEEE Engineering in Medicine and Biology Society (EMBC), Berlin, Germany, 23–27 July 2019; pp. 1346–1349. [Google Scholar] [CrossRef]
- Hennchen, M.; Stubbusch, J.; Abarchan-El Makhfi, I.; Kramer, M.; Deller, T.; Pierre-Eugene, C.; Janoueix-Lerosey, I.; Delattre, O.; Ernsberger, U.; Schulte, J.B.; et al. Lin28B and Let-7 in the Control of Sympathetic Neurogenesis and Neuroblastoma Development. J. Neurosci. 2015, 35, 16531–16544. [Google Scholar] [CrossRef]
- Kusakabe, K.; Kohno, S.; Inoue, A.; Seno, T.; Yonezawa, S.; Moritani, K.; Mizuno, Y.; Kurata, M.; Kitazawa, R.; Tauchi, H.; et al. Combined morphological, immunohistochemical and genetic analyses of medulloepithelioma in the posterior cranial fossa. Neuropathology 2018, 38, 179–184. [Google Scholar] [CrossRef]
- Lee, Y.Y.; Yang, Y.P.; Huang, M.C.; Wang, M.L.; Yen, S.H.; Huang, P.I.; Chen, Y.W.; Chiou, S.H.; Lan, Y.T.; Ma, H.I.; et al. MicroRNA142-3p promotes tumor-initiating and radioresistant properties in malignant pediatric brain tumors. Cell Transplant. 2014, 23, 669–690. [Google Scholar] [CrossRef]
- Roussel, M.F.; Hatten, M.E. Cerebellum development and medulloblastoma. Curr. Top. Dev. Biol. 2011, 94, 235–282. [Google Scholar] [CrossRef] [PubMed]
- Shalaby, T.; Fiaschetti, G.; Baumgartner, M.; Grotzer, M.A. MicroRNA signatures as biomarkers and therapeutic target for CNS embryonal tumors: The pros and the cons. Int. J. Mol. Sci. 2014, 15, 21554–21586. [Google Scholar] [CrossRef] [PubMed]
- Conti, A.; Romeo, S.G.; Cama, A.; La Torre, D.; Barresi, V.; Pezzino, G.; Tomasello, C.; Cardali, S.; Angileri, F.F.; Polito, F.; et al. MiRNA expression profiling in human gliomas: Upregulated miR-363 increases cell survival and proliferation. Tumour Biol. 2016, 37, 14035–14048. [Google Scholar] [CrossRef] [PubMed]
- Pezuk, J.A.; Salomão, K.B.; Baroni, M.; Pereira, C.A.; Geron, L.; Brassesco, M.S. Aberrantly expressed microRNAs and their implications in childhood central nervous system tumors. Cancer Metastasis Rev. 2019, 38, 813–828. [Google Scholar] [CrossRef]
- Conti, L.; Crisafulli, L.; Caldera, V.; Tortoreto, M.; Brilli, E.; Conforti, P.; Zunino, F.; Magrassi, L.; Schiffer, D.; Cattaneo, E. REST controls self-renewal and tumorigenic competence of human glioblastoma cells. PLoS ONE 2012, 7, e38486. [Google Scholar] [CrossRef]
- Fox, J.L.; Dews, M.; Minn, A.J.; Thomas-Tikhonenko, A. Targeting of TGFβ signature and its essential component CTGF by miR-18 correlates with improved survival in glioblastoma. RNA 2013, 19, 177–190. [Google Scholar] [CrossRef]
- Mazzacurati, L.; Marzulli, M.; Reinhart, B.; Miyagawa, Y.; Uchida, H.; Goins, W.F.; Li, A.; Kaur, B.; Caligiuri, M.; Cripe, T.; et al. Use of miRNA response sequences to block off-target replication and increase the safety of an unattenuated, glioblastoma-targeted oncolytic HSV. Mol. Ther. 2015, 23, 99–107. [Google Scholar] [CrossRef]
- Zakrzewska, M.; Fendler, W.; Zakrzewski, K.; Sikorska, B.; Grajkowska, W.; Dembowska-Bagińska, B.; Filipek, I.; Stefańczyk, Ł.; Liberski, P.P. Altered MicroRNA Expression Is Associated with Tumor Grade, Molecular Background and Outcome in Childhood Infratentorial Ependymoma. PLoS ONE 2016, 11, e0158464. [Google Scholar] [CrossRef]
- Hao, Y.; Zhang, S.; Sun, S.; Zhu, J.; Xiao, Y. MiR-595 targeting regulation of SOX7 expression promoted cell proliferation of human glioblastoma. Biomed. Pharmacother. 2016, 80, 121–126. [Google Scholar] [CrossRef]
- Zaravinos, A. The Regulatory Role of MicroRNAs in EMT and Cancer. J. Oncol. 2015, 2015, 865816. [Google Scholar] [CrossRef]
- Koutsaki, M.; Spandidos, D.A.; Zaravinos, A. Epithelial-mesenchymal transition-associated miRNAs in ovarian carcinoma, with highlight on the miR-200 family: Prognostic value and prospective role in ovarian cancer therapeutics. Cancer Lett. 2014, 351, 173–181. [Google Scholar] [CrossRef]
- Costa, F.F.; Bischof, J.M.; Vanin, E.F.; Lulla, R.R.; Wang, M.; Sredni, S.T.; Rajaram, V.; Bonaldo Mde, F.; Wang, D.; Goldman, S.; et al. Identification of microRNAs as potential prognostic markers in ependymoma. PLoS ONE 2011, 6, e25114. [Google Scholar] [CrossRef]
- Ruiz Esparza-Garrido, R.; Velazquez-Flores, M.A.; Diegoperez-Ramirez, J.; Lopez-Aguilar, E.; Siordia-Reyes, G.; Hernandez-Ortiz, M.; Martinez-Batallar, A.G.; Encarnacion-Guevara, S.; Salamanca-Gomez, F.; Arenas-Aranda, D.J. A proteomic approach of pediatric astrocytomas: MiRNAs and network insight. J. Proteom. 2013, 94, 162–175. [Google Scholar] [CrossRef]
- Zhang, L.; Liao, Y.; Tang, L. MicroRNA-34 family: A potential tumor suppressor and therapeutic candidate in cancer. J. Exp. Clin. Cancer Res. 2019, 38, 53. [Google Scholar] [CrossRef]
- Aran, D.; Camarda, R.; Odegaard, J.; Paik, H.; Oskotsky, B.; Krings, G.; Goga, A.; Sirota, M.; Butte, A.J. Comprehensive analysis of normal adjacent to tumor transcriptomes. Nat. Commun. 2017, 8, 1077. [Google Scholar] [CrossRef]
- Slaughter, D.P.; Southwick, H.W.; Smejkal, W. Field cancerization in oral stratified squamous epithelium; clinical implications of multicentric origin. Cancer 1953, 6, 963–968. [Google Scholar] [CrossRef]
- Heaphy, C.M.; Griffith, J.K.; Bisoffi, M. Mammary field cancerization: Molecular evidence and clinical importance. Breast Cancer Res. Treat. 2009, 118, 229–239. [Google Scholar] [CrossRef]
- Bakhshinyan, D.; Savage, N.; Salim, S.K.; Venugopal, C.; Singh, S.K. The Strange Case of Jekyll and Hyde: Parallels Between Neural Stem Cells and Glioblastoma-Initiating Cells. Front. Oncol. 2020, 10, 603738. [Google Scholar] [CrossRef]
- Wechsler-Reya, R.; Scott, M.P. The developmental biology of brain tumors. Annu. Rev. Neurosci. 2001, 24, 385–428. [Google Scholar] [CrossRef]
- Grimmer, M.R.; Weiss, W.A. Childhood tumors of the nervous system as disorders of normal development. Curr. Opin. Pediatrics 2006, 18, 634–638. [Google Scholar] [CrossRef]
- Lu, Q.R.; Qian, L.; Zhou, X. Developmental origins and oncogenic pathways in malignant brain tumors. Wiley Interdiscip. Rev. Dev. Biol. 2019, 8, e342. [Google Scholar] [CrossRef]
- Liu, C.; Zong, H. Developmental origins of brain tumors. Curr. Opin. Neurobiol. 2012, 22, 844–849. [Google Scholar] [CrossRef]
- Madhusoodanan, J. Elusive cancer cells dissected using developmental-biology toolkit. Nature 2021, 592, 647–649. [Google Scholar] [CrossRef]
- Wu, W.; Yu, T.; Wu, Y.; Tian, W.; Zhang, J.; Wang, Y. The miR155HG/miR-185/ANXA2 loop contributes to glioblastoma growth and progression. J. Exp. Clin. Cancer Res. 2019, 38, 133. [Google Scholar] [CrossRef]
- Dong, H.; Cao, W.; Xue, J. Long noncoding FOXD2-AS1 is activated by CREB1 and promotes cell proliferation and metastasis in glioma by sponging miR-185 through targeting AKT1. Biochem. Biophys. Res. Commun. 2019, 508, 1074–1081. [Google Scholar] [CrossRef]
- Tang, H.; Wang, Z.; Liu, X.; Liu, Q.; Xu, G.; Li, G.; Wu, M. LRRC4 inhibits glioma cell growth and invasion through a miR-185-dependent pathway. Curr. Cancer Drug Targets 2012, 12, 1032–1042. [Google Scholar] [CrossRef]
- Zhang, Z.; Tang, H.; Wang, Z.; Zhang, B.; Liu, W.; Lu, H.; Xiao, L.; Liu, X.; Wang, R.; Li, X.; et al. MiR-185 targets the DNA methyltransferases 1 and regulates global DNA methylation in human glioma. Mol. Cancer 2011, 10, 124. [Google Scholar] [CrossRef]
- Shahar, T.; Granit, A.; Zrihan, D.; Canello, T.; Charbit, H.; Einstein, O.; Rozovski, U.; Elgavish, S.; Ram, Z.; Siegal, T.; et al. Expression level of miRNAs on chromosome 14q32.31 region correlates with tumor aggressiveness and survival of glioblastoma patients. J. Neuro-Oncol. 2016, 130, 413–422. [Google Scholar] [CrossRef]
- Sun, S.; Wang, X.; Xu, X.; Di, H.; Du, J.; Xu, B.; Wang, Q.; Wang, J. MiR-433-3p suppresses cell growth and enhances chemosensitivity by targeting CREB in human glioma. Oncotarget 2017, 8, 5057–5068. [Google Scholar] [CrossRef]
- Visani, M.; de Biase, D.; Marucci, G.; Cerasoli, S.; Nigrisoli, E.; Bacchi Reggiani, M.L.; Albani, F.; Baruzzi, A.; Pession, A. Expression of 19 microRNAs in glioblastoma and comparison with other brain neoplasia of grades I-III. Mol. Oncol. 2014, 8, 417–430. [Google Scholar] [CrossRef]
- Xu, G.; Li, J.Y. Differential expression of PDGFRB and EGFR in microvascular proliferation in glioblastoma. Tumour Biol. 2016, 37, 10577–10586. [Google Scholar] [CrossRef]
- Xu, X.; Zhang, F.; Chen, X.; Ying, Q. MicroRNA-518b functions as a tumor suppressor in glioblastoma by targeting PDGFRB. Mol. Med. Rep. 2017, 16, 5326–5332. [Google Scholar] [CrossRef]
- Kaid, C.; Jordan, D.; Bueno, H.M.S.; Araujo, B.H.S.; Assoni, A.; Okamoto, O.K. miR-367 as a therapeutic target in stem-like cells from embryonal central nervous system tumors. Mol. Oncol. 2019, 13, 2574–2587. [Google Scholar] [CrossRef]
- Kaid, C.; Silva, P.B.; Cortez, B.A.; Rodini, C.O.; Semedo-Kuriki, P.; Okamoto, O.K. miR-367 promotes proliferation and stem-like traits in medulloblastoma cells. Cancer Sci. 2015, 106, 1188–1195. [Google Scholar] [CrossRef]
- Lavon, I.; Zrihan, D.; Granit, A.; Einstein, O.; Fainstein, N.; Cohen, M.A.; Cohen, M.A.; Zelikovitch, B.; Shoshan, Y.; Spektor, S.; et al. Gliomas display a microRNA expression profile reminiscent of neural precursor cells. Neuro-Oncol. 2010, 12, 422–433. [Google Scholar] [CrossRef]
- Yu, X.; Wang, W. Tumor suppressor microRNA-613 inhibits glioma cell proliferation, invasion and angiogenesis by targeting vascular endothelial growth factor A. Mol. Med. Rep. 2017, 16, 6729–6735. [Google Scholar] [CrossRef]
- Zhang, J.; Xu, K.; Shi, L.; Zhang, L.; Zhao, Z.; Xu, H.; Liang, F.; Li, H.; Zhao, Y.; Xu, X.; et al. Overexpression of MicroRNA-216a Suppresses Proliferation, Migration, and Invasion of Glioma Cells by Targeting Leucine-Rich Repeat-Containing G Protein-Coupled Receptor 5. Oncol. Res. 2017, 25, 1317–1327. [Google Scholar] [CrossRef]
- Zhang, T.; Ma, G.; Zhang, Y.; Huo, H.; Zhao, Y. miR-599 inhibits proliferation and invasion of glioma by targeting periostin. Biotechnol. Lett. 2017, 39, 1325–1333. [Google Scholar] [CrossRef]
- Zhu, X.Y.; Li, G.X.; Liu, Z.L. MiR-599 as a potential biomarker for prognosis of glioma. Eur. Rev. Med. Pharmacol. Sci. 2018, 22, 294–298. [Google Scholar] [CrossRef]
- Wei, N.; Wei, H.; Zhang, H. Long non-coding RNA ZEB1-AS1 promotes glioma cell proliferation, migration and invasion through regulating miR-577. Eur. Rev. Med. Pharmacol. Sci. 2018, 22, 3085–3093. [Google Scholar] [CrossRef]
- Wu, P.; Gao, Y.; Shen, S.; Xue, Y.; Liu, X.; Ruan, X.; Shao, L.; Liu, Y.; Wang, P. KHDRBS3 regulates the permeability of blood-tumor barrier via cDENND4C/miR-577 axis. Cell Death Dis. 2019, 10, 536. [Google Scholar] [CrossRef]
- Zhang, W.; Shen, C.; Li, C.; Yang, G.; Liu, H.; Chen, X.; Zhu, D.; Zou, H.; Zhen, Y.; Zhang, D.; et al. miR-577 inhibits glioblastoma tumor growth via the Wnt signaling pathway. Mol. Carcinog. 2016, 55, 575–585. [Google Scholar] [CrossRef]
- Chen, W.; Zhang, B.; Guo, W.; Gao, L.; Shi, L.; Li, H.; Lu, S.; Liu, Y.; Li, X. miR-429 inhibits glioma invasion through BMK1 suppression. J. Neuro-Oncol. 2015, 125, 43–54. [Google Scholar] [CrossRef]
- Sun, X.; Li, Z.; Chen, Y. The Potential Prognostic Value of MicroRNA-429 for Human Gliomas. Ann. Clin. Lab. Sci. 2016, 46, 44–48. [Google Scholar]
- Zaravinos, A.; Lambrou, G.I.; Boulalas, I.; Delakas, D.; Spandidos, D.A. Identification of common differentially expressed genes in urinary bladder cancer. PLoS ONE 2011, 6, e18135. [Google Scholar] [CrossRef]
- Gao, X.; Chen, Y.; Chen, M.; Wang, S.; Wen, X.; Zhang, S. Identification of key candidate genes and biological pathways in bladder cancer. PeerJ 2018, 6, e6036. [Google Scholar] [CrossRef]
- Shen, P.; He, X.; Lan, L.; Hong, Y.; Lin, M. Identification of cell division cycle 20 as a candidate biomarker and potential therapeutic target in bladder cancer using bioinformatics analysis. Biosci. Rep. 2020, 40. [Google Scholar] [CrossRef]
- Wang, L.; Zhang, J.; Wan, L.; Zhou, X.; Wang, Z.; Wei, W. Targeting Cdc20 as a novel cancer therapeutic strategy. Pharmacol. Ther. 2015, 151, 141–151. [Google Scholar] [CrossRef]


Publisher’s Note: MDPI stays neutral with regard to jurisdictional claims in published maps and institutional affiliations. |
© 2021 by the authors. Licensee MDPI, Basel, Switzerland. This article is an open access article distributed under the terms and conditions of the Creative Commons Attribution (CC BY) license (https://creativecommons.org/licenses/by/4.0/).