Simple Summary
This study presents an algorithm to estimate the relative biological effectiveness (RBE) for cell survival under hypoxic conditions using the repair-misrepair-fixation model. The study finds that the RBE values are in the range of 1.0–3.0 for the linear energy transfer equal to 1.1 to 22.6 keV/μm under aerobic condition (21% O2) and further increase to the range of 1.1–4.4 under severe hypoxia (0.1% O2).
Abstract
This study uses the yields of double-strand breaks (DSBs) to determine the relative biological effectiveness (RBE) of proton beams, using cell survival as a biological endpoint. DSB induction is determined when cells locate at different depths (6 positions) along the track of 62 MeV proton beams. The DNA damage yields are estimated using Monte Carlo Damage Simulation (MCDS) software. The repair outcomes are estimated using Monte Carlo excision repair (MCER) simulations. The RBE for cell survival at different oxygen concentrations is calculated using the repair-misrepair-fixation (RMF) model. Using 60Co γ-rays (linear energy transfer (LET) = 2.4 keV/μm) as the reference radiation, the RBE for DSB induction and enzymatic DSB under aerobic condition (21% O2) are in the range 1.0–1.5 and 1.0–1.6 along the track depth, respectively. In accord with RBE obtained from experimental data, RMF model-derived RBE values for cell survival are in the range of 1.0–3.0. The oxygen enhancement ratio (OER) for cell survival (10%) decreases from 3.0 to 2.5 as LET increases from 1.1 to 22.6 keV/μm. The RBE values for severe hypoxia (0.1% O2) are in the range of 1.1–4.4 as LET increases, indicating greater contributions of direct effects for protons. Compared with photon therapy, the overall effect of 62 MeV proton beams results in greater cell death and is further intensified under hypoxic conditions.
1. Introduction
Proton therapy (PT) has been used in radiation therapy (RT) because its dose is specific to the target and surrounding healthy tissues are only slightly affected [1]. The dose is measured using the Bragg curve, whereby the absorbed dose increases gradually and suddenly rises to a peak at the end of the proton track [2]. This feature can be further modulated into a spread-out Bragg peak (SOBP), whereby a uniform dose is delivered at a depth throughout the target volume for clinical RT [3].
An RT treatment plan relies on relative biological effectiveness (RBE) to determine the doses for PT. Currently, the RBE for PT is 1.1, but many studies have demonstrated that this value does not correctly reflect the effectiveness of PT, compared with photon therapy [4,5,6,7]. RBE is closely related to linear energy transfer (LET) [8], and the LET also varies at different positions of the proton track. Several studies show that the LET is largest at the distal edge of the Bragg peak, as is the RBE [5,9,10]. The RBE for protons is 1.1–1.2 at the entrance position and increases to 1.7–3.6 at the Bragg peak when cell survival is taken as the biological endpoint [5,10,11,12]. For other endpoints, such as double-strand break (DSB) induction, the RBE is 1.0–1.1 at the entrance position and mildly increases to 1.2–1.9 at the Bragg peak [9,13].
In addition to DSB induction, misrepair of DSBs also affects the total DSB yields. Here, the yields for DSB induction are produced immediately (seconds to minutes) after the time that cells are irradiated by ionizing radiations [8]. Multiple repair pathways are activated when DNA damages are initiated, in which homologous recombination (HR) and non-homologous end-joining (NHEJ) deal with the DSB [14] while base-excision repair (BER) and nucleotide-excision repair (NER) pathways [15,16] deal with non-DSB clustered damage [17]. If those DSBs are not fully repaired, residual DSB can lead to genome instability or cell death [18,19] but do not contribute to additional DSBs. However, extra DSBs could be formatted from the misrepair of non-DSB clustered damage by BER- and NER-associated enzymes and are termed as “enzymatic DSB” [15,20,21]. For example, suppose an unrepaired single-strand break (SSB) is located on a site opposite a damaged base or an apurinic/apyrimidinic (AP) site where the base or AP site is a target for removal in BER pathways. During the removal, the DNA backbone is incised to form a break near an existing SSB, and an enzymatic DSB is then formed. The enzymatic DSB yields for cells irradiated by 60Co γ-rays, protons, and helium ions are comparable to the levels of DSB induction; hence it is important to evaluate the yields of enzymatic DSB when RBE is evaluated [22,23,24].
Furthermore, oxygen also plays a vital role in the RBE. DNA damage induction is mainly caused by direct and indirect actions. For low LET radiations, about two-thirds of DNA damage is induced via indirect actions, mostly by hydroxyl radicals (OH) [7]. These radicals R react with oxygen to form RO2, which attacks DNA and leads to the formation of DNA damage. The DNA damage is “fixed” and irreversible, which is termed the oxygen fixation hypothesis [8]. The presence of O2 modifies the pathway and the final chemical products [25]. Normal cells generally contain higher oxygen concentrations than tumor cells [26]. The level of DNA damage decreases as oxygen concentration decreases [8,27]. Moreover, hypoxia is reported to affect the biology of tumors, including DNA damage induction, repair process, and genomic instability [28,29,30,31].
In RT, mathematical models are able to theoretically predict the RBE for cell survival and provide essential biological information for treatment plans. These models include the local effect model [32,33], the microdosimetric-kinetic model [34,35,36,37], the NanOX model [38,39,40] and the DSB-based repair-misrepair-fixation (RMF) model [41,42,43]. Among these models, the RMF model has been used to predict cell survival for various human cell lines [44] based on the yields for DSB induction and has been applied for treatment planning systems [45,46].
Although measured RBE values for cell survival under hypoxia conditions are available [47,48], to our knowledge, we have not found any other simulation to estimate RBE values for PT under hypoxic conditions. This study determines the RBE of a 62 MeV proton beam for DSB induction and cell survival under normal oxygen and hypoxic conditions, respectively, and compares these values with experimental data. The RBE values for cell survival derived by RMF model agree well with the experimental data for AG01522 and U87 cell lines under normal oxygen conditions [10]. Our data also show a significant difference between the RBE values for DSB induction and the values for cell survival, indicating that enzymatic DSB may play an important role in the cause of cell killing.
2. Materials and Methods
2.1. Energy Spectra
All energy spectra for depths P1 to P6 (see Figure 1) are in accord with those from Chaudhary et al. (2014) [10]. They were ungraphed using Image J software, a Java-based image processing software package that was developed at the National Institute of Health [49] using an interval 0.2 MeV.
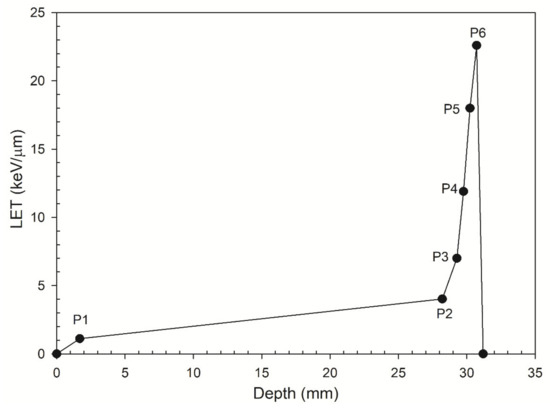
Figure 1.
LET versus the depths P1–P6. The depths P1–P6 represent six locations along the track of a 62 MeV proton beam.
2.2. Monte Carlo Damage Simulation (MCDS)
Monte Carlo simulation is a mathematical technique that applies to stochastic events. It is based on repeated random sampling from numerical simulations, and the results depend on the average outcomes over a large number of runs [50]. The MCDS simulates the yield of DNA damage in a cell irradiated with photons, mono-energetic electrons, protons ions up as heavy as 56Fe ions [27,51,52].
MCDS is not a Monte Carlo radiation transport code and cannot simulate the stochastic events generated by ionizing radiations as track structure simulations [53,54,55]. The approach, used in track structure simulations, estimates DNA damage profiles by superimposing DNA geometry to the radiation track structures [55]. This approach is a direct way to estimate DNA damage yields correctly but is more computationally expensive. Alternatively, the other approach is to use the clustering algorithm that MCDS employs. Specifically, MCDS generates random numbers of damage configurations within one cell and simulates the process of DNA damage in two main steps: (1) the initial damage within a cell is randomly distributed in a DNA segment and (2) this damage distribution in a particular segment is subdivided into lesions [51]. The approach used in MCDS is indirectly and reduces the computational time. MCDS estimates the yield for different types of DNA damage and uses reported DNA damage data and the major trends for DNA damage spectra that are similar to those for detailed track structure simulations. Table 1 shows the types and classifications of DNA damage and their abbreviations, including base damage (BD), simple single-strand break (SSB), simple double-strand break (DSB), two or more strand breaks on the same strand (SSB+), two or more strand breaks on opposite strands that do not constitute DSB (2SSB), DSBs with additional break(s) on a strand within 10 base pairs (DSB+) and more than one DSB within 10 base pairs (DSB++).

Table 1.
Description of abbreviations used in this Study.
2.3. Monte Carlo Excision Repair Simulation (MCER)
The MCER code simulates the probability of the repair outcomes in the BER and NER pathways for DNA damage in cells that are irradiated with electrons, protons and helium ions [21] and has been applied in several studies [20,23,24]. These pathways include short-patch BER (SP BER), long-patch BER (LP BER), SP BER/NER, and LP BER/NER pathways [20,21]. The repair outcomes were correct repair, repair with a mutation and conversion into a DSB. The third outcome results from the misrepair of some sugars or BD, which convert these non-DSB clusters into DSBs. The details of MCER are described elsewhere [21]. To generate the MCER results, this study used the following parameters for the input conditions: inhibition distance = 8 base pairs; probability of choosing a lesion from the first strand break = 0.5; polymerase error for SPBER = 1.0−4; polymerase error for LPBER and NER = 1.0−6; probability of incorrect insertion opposite a damaged base = 0.75; probability of incorrect insertion opposite a lost base = 0.75. The values for the parameters mentioned above were suggested by previous studies [20,21].
2.4. Calculation of DSB Conversion from DNA Damage
The yield for DSB conversion for proton ions is calculated by the formula below. Enzymatic is defined as the conversion probability for repair pathways for total DNA damage, which is composed of i lesions, and Yi is the yield of the total number of non-DSB clusters per Gy per gigabase pair (per Gy per Gbp), which is composed of i lesions, for proton ions with energy E.
2.5. RMF Model
An RMF model [41] was developed to link DSB induction to cell survival. The linear-quadratic (LQ) equation [8] based cell survival fraction curve fitting parameters α and β are expressed as:
where is the fraction of the initial DSB that are potentially rejoinable and defined below
The parameter j defines the least number of lesions per DSB that cannot be rejoined, is the total number of DSB per cell per Gy and is the expected number of DSB per cell per Gy, which is composed of exactly i lesions. The DNA damage yields were converted into the unit per Gy per Gbp using the factor 6 Gbp per cell for a typical mammalian cell [51]. Assuming a continuous slowing down approximation (CSDA), the CSDA range of the particles (62 MeV protons) is above 1.7 cm (calculated by MCDS), which is much greater than the sphere used here (μm). For a uniform irradiation, is the frequency-mean specific energy for a spherical target composed of water with diameter d and is defined as [58]:
The diameter for this study was set as 8 μm. The size of nuclear diameter (~8 μm) was the typical size of V79 Chinese hamster cells used in many experiments [59]. The yields of DSB induction for V79 cells irradiated by ionizing radiations with a wide LET (0.2–520 keV/μm) were used to be the benchmark for MCDS [27].
is defined as the fraction of DSBs that undergo lethal first order misrepair and damage fixation and is defined as the fraction of initial DSBs that undergo pairwise damage interactions [41]. For this study, parameter j had a value of 9 to achieve the best fit for the measured survival data of AG01522 cells and U87 cells [10] for a LET value of 1−22.6 keV/μm. Parameter j = 8 is used in moderate hypoxia (2% O2). When oxygen concentration decreased to 0.1%, the parameter j had a value of 7 to achieve the best fit to the measured OER data in Figure 2c.
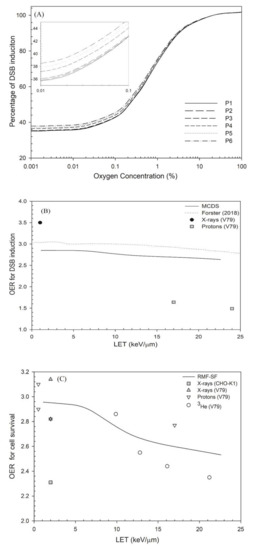
Figure 2.
(a) Percentage of DSB induction versus oxygen concentration, (b) OER for DSB induction using the simulation results of Forster et al. (2018) [60] and this study (MCDS). The experimental data were taken from Prise et al. (1990) [61]. (c) OER for cell survival at 10% versus LET. When oxygen concentration decreases to 0.1%, the parameter j has a value of 7 to achieve the best fit to the measured OER data. These measured OER values were taken from published studies: CHO-K1 cells [62] and V79 cells irradiated by X-ray [48,61], proton ions [61] and helium ions [63].
All calculations for RBE for cell survival in a normal oxygen concentration (21% O2) or in moderate hypoxia (2% O2) [29] used values of = 5.79 × 10⁻³ and = 5.59 × 10⁻⁵, which were used in a previous study [41]. For severe hypoxia (0.1% O2) [29], the calculations used values of = 4.1 × 10⁻³ and = 3 × 10⁻⁵.
2.6. RBE for DSB Induction and Cell Survival
The RBE is defined as the ratio of the dose of low LET reference radiation to the dose of any other radiation that is required to achieve an equal biological effect [8]. The RBE is also expressed as a ratio of the DSB yield, Σ, because DSB induction is linearly proportional to the absorbed dose, D, up to a hundred Gy under aerobic condition (21% O2) [64] and severe hypoxia (0.1% O2) [65], as:
Subscripts P and γ, respectively, denote protons and γ-rays. The DSB yield for 60Co γ-rays is the reference for all reported RBE values.
Cell survival is described using a LQ equation [8]:
where S denotes the fraction of cells that survive at dose D and the curve-fitting parameters are α and β. Using Equation (6) and the RBE definition in Equation (5), the formula for RBE for cell survival [66] becomes:
where , , , and are the α and β parameters that are defined in Equations (2) and (3) for 60Co γ-rays and proton exposure, respectively, and is the dose of protons.
2.7. Oxygen Enhancement Ratio (OER)
The effect of oxygen on cells is quantified in terms of the OER, which is the ratio of the hypoxic dose to the aerated dose that is required to achieve the same biological outcome [57]. OER is also defined as the ratio of the biological effect, such as DSB yield or cell deaths, at the same dose [67]. For this study, OER for DSB induction was defined as the ratio of the yield of DSB induction under aerobic conditions (21% O2) to the yield under severe hypoxia (0.1% O2). To calculate the OER for cell survival (Equation (8)), where the doses, Da (aerobic condition) and Dh (severe hypoxia) (0.1% O2) are calculated using Equations (9) and (10), respectively, as shown below:
where , , , and are the α and β parameters that are defined in Equations (2) and (3), respectively, under aerobic conditions (21% O2) and severe hypoxia (0.1% O2).
3. Results
3.1. DSB Induction and Enzymatic DSB Yield at Normal Oxygen Concentrations
Table 2 lists the DNA damage profile for six depths for a mono-energetic 62 MeV proton track.
Table 2.
Absolute yield of DNA damage (per Gy per Gbp) induced by a 62 MeV proton beam at normal oxygen concentrations (21%).
The limits of the standard deviations for all subtypes of DNA damage (i.e., BD, SSB, SSB+, 2SSB, DSB, DSB+, and DSB were within 0.2%. As the depth and LET increased, the yield for simpler damage (BD and SSB) decreased whereas the yield for complex damage (SSB+, 2SSB, DSB, DSB+, and DSB++) increased. In total damage, the portion of BD decreased from 68 to 64%, while the portion of simple SSB only slightly increased from 29 to 30%, indicating that the percentage of complex DNA damage increased as the depth increased. That is attributed to the fact that protons are low-LET radiations, which suggests that the damage was distributed spatially sparsely and the majority of the damage was of the simple types such as BD and SSB [68]. However, as LET increased, the energy deposition became denser and localized, and consequently, the yield of base damage reduced and the yields of complex DNA damage such as DSB, DSB+, and DSB++ increased, as shown in P6 (Bragg peak).
The absolute yields and RBE values for DSB induction predicted by MCDS are shown in Table 3.
Table 3.
The absolute yield of DNA damage (Gy−1Gbp−1) and RBE induced by 60Co. γ-rays and a 62 MeV proton beam under oxygen concentrations 21, 2, and 0.1%.
The yield for DSB induction for depths P1 to P6 increased as the LET increased but decreased as oxygen concentration decreased. The RBE values for DSB induction at 21% O2 were in the range of 1.02–1.52 but increased to 1.02–1.55 at 2% O2 and further increased to 1.02–1.62 at 0.1% O2. The RBE values for depths P1 to P4 are almost the same under all oxygen concentrations, whereas they increased slightly 7% for positions P5 and P6 (Bragg peak) as oxygen concentration decreased to 0.1%. Furthermore, the RMF model-derived RBE values for cell survival are compared with the experimental data in Table 4.
Table 4.
RBE for cell survival at 10% Using the RMF model with parameter j = 9 and an irradiated dose = 1 Gy under normal oxygen concentration (21% O2).
Table 4 shows that the RBE value for normal AG01522 cell survival for depths P1–P6 was in the range of 1.2–2.7. For radio-resistant U87 cells, the RBE value was in the range of 1.1–3.3. The RMF model predicted the RBE value for cell survival ranging over 1.0–3.0 for depths P1–P6, which was similar to the experimental data. In contrast, the RBE for DSB induction for depths P1–P6 depths was 1.0–1.5, which was much less than the RBE for cell survival.
In Table 5, the probability of correct repair for the LP BER pathway decreases from 0.962 to 0.926 for depths P1 to P6, while the probability of mutation and DSB formation increases from 0.029 to 0.055 and from 0.009 to 0.019, respectively.
Table 5.
The average repair outcome probability for all types of DNA damage for cells irradiated by a 62 MeV proton beam for LP BER pathway.
Furthermore, repairing efficacy by different repair pathways was studied and all repair outcomes from SP BER, LP BER, SP BER/NER, and LP BER/NER for positions P1 and P6 were listed in Table 6.
Table 6.
The average repair outcome probability for all types of DNA damage for cells irradiated by a 62 MeV proton beam for SP BER, LP BER, SP BER/NER, and LP BER/NER pathways.
In summation, for all repair pathways, the probability of correct repair decreases from 0.983–0.896 (P1) to 0.967–0.818 (P6). Furthermore, the probabilities of mutation and DSB formation increase from 0.008–0.065 (P1) to 0.017–0.110 (P6) and from 0.008–0.038 (P1) to 0.016–0.072 (P6), respectively. The limits of the standard deviations for all probabilities reported in Table 5 and Table 6 are below 0.1%.
Table 7 lists the yields of DNA induction and enzymatic DSB and RBE for DSB induction and enzymatic DSB from LP BER.
Table 7.
The yields of DNA induction, enzymatic DSB and RBE of DSB induction and enzymatic DSB for LP BER pathway.
The results show that the yield for DSB induction for depth P1 and P6 are 8.28 per Gbp per Gy to 12.4 per Gbp per Gy, respectively. The yield of the maximum enzymatic DSB for depth P1 and P6 was, respectively, 5.72 per Gbp per Gy and 9.66 per Gbp per Gy, which accounts for 69–78% of the yields for DSB induction. The RBE for DSB induction was in the range of 1.0–1.5 (Table 3), which was similar to the range of 1.0–1.6 for the maximum enzymatic DSB yield (Table 7).
3.2. OER and RBE for Cell Survival under Different Oxygen Concentrations
The effects of oxygen on DSB induction and cell survival are shown in Figure 2 and Figure 3, respectively. The yield of DSB induction under severe hypoxia (< 0.1% O2) is about 40–45% of the value at normal oxygen concentration (21% O2; see Figure 2a). For a 2% oxygen concentration, the yield of DSB induction was about 15% less than the yield at normal oxygen concentrations (21% O2). Figure 2b shows that the OER values for DSB induction decreased from 2.85 to 2.6 as LET increases from 1 keV/μm (at P1) to 22.6 keV/μm (at P6) [10], similar to the OER value obtained from Forster’s study [60], 3.0 (1 keV/μm) to 2.9 (22.6 keV/μm). However, the experimental data show that the OER for DSB induction is only 1.5 at LET = 24 keV/μm [61].
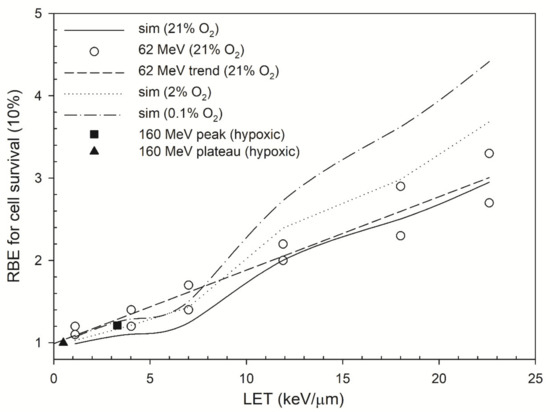
Figure 3.
RBE values as a function of LET. The RBE values (dose = 1 Gy) for cell survival at 10% predicted by the RMF model were plotted for oxygen concentrations of 0.1% (dash–dot line), 2% (dotted line) and 21% (solid line). The RBE values were measured under 21% O2 (open circle) [10]. This figure also includes the RBE values of 160 MeV proton beams (black square and triangle) [47,48] to represent the RBE values of proton beams under hypoxic conditions (no exact values for oxygen level).
Figure 2c shows that the OER for cell survival at 10%under 0.1% O2 versus LET. The OER decline for cell survival is more obvious than that for DSB induction. That is, the OER for cell survival decreased from 3.0 to 2.5 as LET increased by 22.6 keV/μm while the OER for DSB induction was in the range of 3.0–2.9. The experimental data showed a decrease from 2.9 to 2.4 as LET increased from 9.9 keV/μm to 21.2 keV/μm [63] for helium ions and a decrease from 2.8 to 2.0 as LET increased from 17 keV/μm to 24 keV/μm for protons [61]. Figure 3 shows that the RBE values for cell survival under normal oxygen conditions were in the range of 1.0–3.0, and the RBE values under 2% oxygen concentration are in the range of 1.0–3.7. Under severe hypoxia (0.1% oxygen concentration), the RBE value for cell survival at depths P1–P6 increased from 1.1 to 4.4.
4. Discussion
This study calculates the RBE for DSB induction and cell survival at various oxygen concentrations. The RBE values are compared with experimental data and the results show that the RBE for cell survival is greatly affected by LET (position of the track) and oxygen concentration. The effects of LET and oxygen on RBE are discussed in the following sections.
4.1. The Effect of LET on DNA Profile for Depths P1-P6
The MCDS-derived RBE for DSB induction and the RBE value using the RMF model for cell survival has been documented in several studies [37,69], including the comparisons with experimental data for PT [24,37,70]. Compared with the track structure simulations for cells irradiated with lower energy proton beams, such as a 0.3 MeV proton beam (LET = 55.6 keV/μm), the MCDS-derived DNA damage profiles are also similar to those derived by these track structure simulations [51,68,71]. For example, the percentage of BD for 0.3 MeV proton beam by MCDS is 54% [51], which is comparable to the value using track structure simulations, 55% [68]. Recent track structure simulations show that the percentages of DSB, DSB+, and DSB++ for a 0.3 MeV proton beam are respectively 4.8, 3.6, and 1.3% and total DSB yield is 22.8 per Gbp per Gy [72]. The percentages of DSB, DSB+, and DSB++ by MCDS (this work) are 4.0, 2.2, and 1.4%, and the total DSB yield is 22.2 per Gbp per Gy, which is comparable to the DNA profiles obtained by track structure simulations. However, other study reported that the measured DSB yields (γ-H2AX foci) are in the range of 5–16 DSBs per Gy per cell (0.8–2.7 per cell per Gbp) for a wide range of LET (1 ~ 270 keV/µm) [73], which is far below than the results obtained by MCDS, 8–25 per Gy per Gbp [41]. This is probably due to that MCDS used the measured DSB yields obtained by pulsed-field gel electrophoresis (PFGE) which tends to have higher yields compared to the number using γ-H2AX methods [73,74].
Table 2 lists the yields of all types of DNA damage in that BD occupies the greatest portion of total damage and is decreasing from 68% (P1) to 64% (P6, with the highest LET), whereas the portions of other types of DNA damage are increasing, although to different levels. Where absolute yield is concerned, both BD and SSB decrease along with the depth of the track while SSB+, 2SSB, DSB, DSB+, and DSB++ increase, indicating that the composition of DNA profiles from P1 to P6 becomes more complex. Other studies using the Geant4-DNA Monte Carlo code also show similar trends for the SSB and DSB yields [75,76]. For example, the SSB yield decreases slowly from 349 per Gy per Gbp to 314 per Gy per Gbp (~9 % reduction) and the DSB yield increases from 13.7 per Gy per Gbp to 22.4 per Gy per Gbp (64% increase) as LET increases to 20 keV/µm [76]. Our results show that the SSB yield decreases from 187 per Gy per Gbp to 170 per Gy per Gbp (~9 % reduction), and the DSB yield increases from 8.3 per Gy per Gbp to 12.4 per Gy per Gbp (49% increase) (Table 2). These findings support the theory that higher-LET radiation produces more complex clustered damage [77]. The yield of complex DNA damage is also related to repair outcomes. When initial DNA damage is clustered and more complex, misrepair or deletion usually occurs because of physical or biochemical interactions, such as oxygen fixation or incomplete repair; then, the RBE for cell survival using the RMF model increases along with the depth (see Equation (2). Therefore, the RBE for DSB induction (in Table 3), as same as the RBE for cell survival, has an increasing trend along with the increase of LET.
4.2. Parameter j and α
Under normal oxygen concentration, the only adjustable parameter for the RMF model is parameter j (since = 5.79 × 10⁻³ and = 5.59 × 10⁻⁵ were determined in a previous study [41]), which defines the least number of lesions per DSB that cannot be rejoined (explained in Materials and Methods). Parameter j has been shown to be a constant value of 7 for X-ray data and of 10 for all low-LET radiations (LET <= 20 keV/μm) [41], but the best fit in this study is a value for j = 9 for RBE for cell survival of protons at all positions (LET < = 22.6 keV/μm) at normal oxygen concentrations and a value for j = 7 at severe hypoxia (0.1% O2). These results suggest that a very complex DSB, such as DSB with eight lesions, can be rejoined under normal oxygen concentration. Our results also show that the parameter j does not depend on the LET for low-LET radiations (LET < = 22.6 keV/μm), but its value decreases for lower oxygen concentrations (see Figure 2c). For all oxygen concentrations, the fraction of rejoined DSB is in the range of 0.98–0.99, indicating that some DSB (around 2%) cannot be fully rejoined, and it turns out fR < 1.
The LQ model parameter α has been shown to be linearly proportional to LET by experiments [10]. This relationship can also be derived by the RMF model using the DSB yields by other Monte Carlo simulations [78] (see Appendix A for details). However, as LET increases to certain values, Equation (2) also shows that α does not have a linear relationship with LET since the second term cannot be ignored and α becomes nonlinear [66].
4.3. OER
In Figure 2b, the OER value for DSB induction using MCDS is 2.85–2.64 for LET = 1 ~ 22.6 keV/μm, which is in good agreement with the simulated OER value from 3.0 to 2.8 as LET increases to 22.6 keV/μm [60]. Other OER values measured using the filter elution technique are from 3.5 to 1.5 as LET increases from 1 keV/μm to 24 keV/μm [61]. This large difference between the simulation results and experimental measurements may be due to the applied experimental methods in that the result for filter elution-derived OER is somewhat different to the result for PFGE [79]. The filter elution technique was a popular method and has been replaced by newer methods such as PFGE [79]. Most simulations use the DSB yields from PFGE to determine the simulation parameters [80]. In Figure 2c, RMF-model derived OER for cell survival decreases from 3.0 to 2.5 while the measured OER value varies a lot for different radiations. For proton beams, the OER value from the entrance to the SOBP is in the range of 3.0–2.5 (not included in Figure 2c, [81]). For helium ions, the OER value decreases from 2.9 to 2.2 as LET increases from 9.89 keV/μm to 28.5 keV/μm [63], which is in agreement with those obtained by the RMF model.
4.4. RBE
Table 3 shows that the RBE value for DSB induction increases from 1.02 to 1.52 as LET increases from 1.11 keV/μm to 22.60 keV/μm and slightly increases to the range of 1.02–1.62 as oxygen decreases from 21% to 0.1%. Other studies also show that the RBE for DSB induction decreases as oxygen concentration decreases [24,27,82]. In Table 4, the RBE for cell survival obtained from the RMF model is in good agreement with the measured RBE for cell survival [10]. These data show that the RBE for DSB induction in severe hypoxia (0.1% O2) increases by 7% and the RBE for cell survival using the RMF model increases from 1.0–3.0 to 1.0–3.7as oxygen concentration decreases from 21% to 2% and to 1.1–4.4 as oxygen further decreases to 0.1% (in Figure 3). The relationship between RBE values for DSB induction and cell survival has been discussed previously and indicated that the RBE values for cell survival are generally larger or at least equal to the values for DSB induction [37]. The possible causes for this disagreement suggest that cell killing processes may be involved with other biophysical processes other than DSB induction, such as DNA damage repair, mutation, and genomic aberration [83].
Because the trend of RBE for DSB induction increases as oxygen concentration decreases (Table 3), the increasing trend in the RBE for cell survival under 0.1% O2 seems to be correct. However, the RBE values could be overestimated. For example, if the dose required to reach 10% survival for cells irradiated by 62 MeV proton beams in the Bragg peak (P6, measured RBE = 3.3, in Table 4) is 1 Gy (under 21% O2), then the dose would increase to 3.3 Gy for cells treated with60Co γ-rays Gy (under 21% O2) and further increase to 9.9 Gy (measured OER of 60Co γ-rays = 3.0, [84]) for cells treated with 60Co γ-rays under 0.1% O2. The calculated OER value for proton ions (at depth P6) is 2.6 (Figure 2c) and it can be inferred that the RBE (for proton beams relative to 60Co γ-rays) under 0.1% O2 is around 3.8, which is 16% less than the value, 4.4, derived by the RMF model. These higher RBE values for PT under hypoxic conditions represent the difficulty to efficiently and successfully kill tumor cells by photon therapy since the oxygen level is significantly lower in tumor cells [26].
In Figure 3, the RBE values for cell survival under moderate hypoxia (2% O2) are comparable to those under normal oxygen concentration (21% O2) and higher RBE values are predicted for cells irradiated at P5 and P6 (Bragg Peak) under severe hypoxia (0.1% O2). In contrast, the RBE value for positions P1–P2 (plateau region) only increases slightly. Experimental data also showed that the RBE values of therapeutic proton beams (LET < 5 keV/μm) under hypoxic conditions are about the same (1.0 ~ 1.2) as those under normal oxygen concentration [47,48]. For higher-LET radiations, the RBE for cell survival increases as oxygen concentration decreases, indicating intensified tumor-killing when cells are irradiated under moderate hypoxia (~1% O2) [85,86]; this is because the yields of DNA damage induction under hypoxic conditions are mostly obtained by direct actions [24]. The presence of oxygen increases the yields of DNA damage induction via indirect actions, i.e., reacting with free radicals R to form RO2. Under hypoxic conditions, the yields of DNA damage induction reduce to one-third of the yields under aerobic conditions for low-LET radiations; however, for higher-LET radiations, the yields of DNA damage induction reduce less because the direct action contributes more in the DNA damage induction. Moreover, the enzymatic DSB yields also reduce due to the reduction in the total damage when oxygen concentration decreases. The overall effects on cells irradiated by proton ions under hypoxic conditions lead to a higher RBE for DSB induction and cell survival.
The study by Lomax et al. (2013) [25] shows that the results of misrepair of DNA damage can be applicable to future RT. Our results show that the yields of enzymatic DSB increase as LET increases (Table 5 and Table 6) and are comparable to the yields of DSB induction (Table 7). It may be possible to target the repair pathway to inhibit the repair of clustered damage in tumor cells by using DNA repair inhibitors such as poly-(ADP-ribose) polymerase (PARP) inhibitors [87,88], leading to an increase in enzymatic DSB yields. In that case, radiosensitizers can be jointly used in the tumor regions to increase the yields in DNA damage induction. For example, we can add oxygen mimetics [89] as a substituent for oxygen in the process of “fixing” DNA damage.
Alternatively, instead of modifying the microenvironment in the tumors, a larger irradiated volume containing a wider SOBP with higher-LET radiations may be applied in RT. This proposal is in line with the idea of “LET-painting” [90], which suggests the redistribution of LET by using different energies of proton beams. In addition, oxygen can be seen as a biomarker to distinguish normal and tumor cells: the median oxygen level in most normal tissues is around 4–7.5%, while the level in tumors is 0.3–4.2% [26]. Because higher-LET proton beams exhibit a higher RBE under hypoxic conditions, the cell killing should be more intensified in tumor regions than that for normal cells. If some radiation scavengers such as dimethylsulfoxide are given into normal cells (located in the outer region of the irradiated volume) to reduce complications, then it is possible to improve the treatment efficiency and reduce complications simultaneously [70].
5. Conclusions
This paper presents an algorithm to estimate the RBE for cell survival under hypoxic conditions using the RMF model. This algorithm uses the yields of DSB induction and three parameters (j, and ) to calculate the parameters of LQ model, i.e., α and β and further determines the RBE for cell survival. The RBE values determined by this algorithm are comparable to the measured values and could be used in clinical treatment planning for hypoxic tumor cells.
Author Contributions
Conceptualization, C.-C.C. and Y.-Y.H.; methodology, C.-C.C. and Y.-Y.H.; software, C.-C.C.; validation, C.-C.C., F.-H.C. and Y.-Y.H.; formal analysis, C.-C.C.; investigation, C.-C.C.; data curation, C.-C.C.; writing—original draft preparation, C.-C.C. and Y.-Y.H.; writing—review and editing, F.-H.C. and Y.-Y.H.; supervision, Y.-Y.H.; project administration, Y.-Y.H.; funding acquisition, F.-H.C. and Y.-Y.H. All authors have read and agreed to the published version of the manuscript.
Funding
This research was funded by grants CSMU-INT-109-08 supported by the Chung Shan Medical University, Taichung, Taiwan awarded to Ya-Yun Hsiao; CMRPD1H0473 and CMRPD1J0322 supported by Linkou-Chang Gung Memorial Hospital; and MOST 109-2314-B-182-078-MY3, 109-2628-B-182-008 supported by the Ministry of Sciences and Technology, Taiwan awarded to Fang-Hsin Chen.
Institutional Review Board Statement
Not applicable.
Informed Consent Statement
Not applicable.
Data Availability Statement
Not applicable.
Acknowledgments
This research was supported by the Chung Shan Medical University, Taichung, Taiwan, Linkou-Chang Gung Memorial Hospital and the Ministry of Sciences and Technology, Taiwan.
Conflicts of Interest
The authors report no conflict of interest. The authors alone are responsible for the content and writing of the paper.
Appendix A
The LQ model parameter α for cells that are irradiated by proton ions is defined as:
(from Equation (2)).
The definitions of all parameters are described in the Materials and Methods Section. Parameter is small enough to be ignored ( and ) [41], and and so Equation (2) is approximated as:
The value for (DSB yield) is about 50–100 per cell per Gy, so Equation (A1) is approximated as:
DSB induction (per Gbp per Gy) is almost linearly proportional to LET [78]:
the cells are mammalian cells and 1 cell = 6 Gbp (giga basepairs) so the DSB yield is multiplied by 6 and the equation becomes:
Equation (A2) is rewritten as:
This corresponds to the equation, [10], which is experimentally derived. and are the respective LQ model parameters α for protons and 225 kVp X-rays, and is a constant that differs for different cell systems.
Although the power of LET in Equation (A5) is not 1 (0.9583), yet for low-LET radiations, the parameters and can be respectively approximated to Gy−1 and = 0.006842 μm keV−1 Gy−1. The experimentally derived value for is 0.11–0.54 Gy−1 while is 0.0127–0.0451 μm keV−1 Gy−1 [10].
References
- Karger, C.P.; Jäkel, O. Current Status and New Developments in Ion Therapy. Strahlenther. Onkol. 2007, 183, 295–300. [Google Scholar] [CrossRef] [PubMed]
- Palmans, H.; Rabus, H.; Belchior, A.L.; Bug, M.U.; Galer, S.; Giesen, U.; Gonon, G.; Gruel, G.; Hilgers, G.; Moro, D.; et al. Future development of biologically relevant dosimetry. Br. J. Radiol. 2015, 88, 20140392. [Google Scholar] [CrossRef] [PubMed]
- Fokas, E.; Kraft, G.; An, H.; Engenhart-Cabillic, R. Ion beam radiobiology and cancer: Time to update ourselves. Biochim. Biophys. Acta (BBA) Bioenerg. 2009, 1796, 216–229. [Google Scholar] [CrossRef] [PubMed]
- Calugaru, V.; Nauraye, C.; Noël, G.; Giocanti, N.; Favaudon, V.; Mégnin-Chanet, F. Radiobiological Characterization of Two Therapeutic Proton Beams with Different Initial Energy Spectra Used at the Institut Curie Proton Therapy Center in Orsay. Int. J. Radiat. Oncol. Biol. Phys. 2011, 81, 1136–1143. [Google Scholar] [CrossRef]
- Paganetti, H. Relative biological effectiveness (RBE) values for proton beam therapy. Variations as a function of biological endpoint, dose, and linear energy transfer. Phys. Med. Biol. 2014, 59, R419–R472. [Google Scholar] [CrossRef]
- Ilicic, K.; Combs, S.E.; Schmid, T. New insights in the relative radiobiological effectiveness of proton irradiation. Radiat. Oncol. 2018, 13, 6. [Google Scholar] [CrossRef]
- Vanderwaeren, L.; Dok, R.; Verstrepen, K.; Nuyts, S. Clinical Progress in Proton Radiotherapy: Biological Unknowns. Cancers 2021, 13, 604. [Google Scholar] [CrossRef]
- Hall, E.J.; Giaccia, A.J. Radiobiology for the Radiologist; Wolters Kluwer Health/Lippincott Williams & Wilkins: Philadelphia, PA, USA, 2012. [Google Scholar]
- Wang, C.C.; Hsiao, Y.; Lee, C.C.; Chao, T.C.; Wang, C.C.; Tung, C.J. Monte Carlo simulations of therapeutic proton beams for relative biological effectiveness of double-strand break. Int. J. Radiat. Biol. 2012, 88, 158–163. [Google Scholar] [CrossRef]
- Chaudhary, P.; Marshall, T.I.; Perozziello, F.M.; Manti, L.; Currell, F.J.; Hanton, F.; McMahon, S.J.; Kavanagh, J.N.; Cirrone, G.P.; Romano, F.; et al. Relative Biological Effectiveness Variation Along Monoenergetic and Modulated Bragg Peaks of a 62-MeV Therapeutic Proton Beam: A Preclinical Assessment. Int. J. Radiat. Oncol. Biol. Phys. 2014, 90, 27–35. [Google Scholar] [CrossRef]
- Paganetti, H.; Niemierko, A.; Ancukiewicz, M.; Gerweck, L.E.; Goitein, M.; Loeffler, J.S.; Suit, H.D. Relative biological effectiveness (RBE) values for proton beam therapy. Int. J. Radiat. Oncol. Biol. Phys. 2002, 53, 407–421. [Google Scholar] [CrossRef]
- Paganetti, H. Proton Relative Biological Effectiveness–Uncertainties and Opportunities. Int. J. Part. Ther. 2018, 5, 2–14. [Google Scholar] [CrossRef]
- Chaudhary, P.; Marshall, T.I.; Currell, F.J.; Kacperek, A.; Schettino, G.; Prise, K.M. Variations in the Processing of DNA Double-Strand Breaks Along 60-MeV Therapeutic Proton Beams. Int. J. Radiat. Oncol. Biol. Phys. 2016, 95, 86–94. [Google Scholar] [CrossRef]
- Ceccaldi, R.; Rondinelli, B.; D’Andrea, A.D. Repair Pathway Choices and Consequences at the Double-Strand Break. Trends Cell Biol. 2016, 26, 52–64. [Google Scholar] [CrossRef]
- Blaisdell, J.O.; Harrison, L.; Wallace, S.S. Base Excision Repair Processing of Radiation-induced Clustered DNA Lesions. Radiat. Prot. Dosim. 2001, 97, 25–31. [Google Scholar] [CrossRef]
- Kara, A.; Özgür, A.; Nalbantoğlu, S.; Karadağ, A. DNA repair pathways and their roles in drug resistance for lung adenocarcinoma. Mol. Biol. Rep. 2021, 48, 3813–3825. [Google Scholar] [CrossRef] [PubMed]
- Georgakilas, A.G.; O’Neill, P.; Stewart, R.D. Induction and Repair of Clustered DNA Lesions: What Do We Know So Far? Radiat. Res. 2013, 180, 100–109. [Google Scholar] [CrossRef] [PubMed]
- Berthel, E.; Ferlazzo, M.L.; Devic, C.; Bourguignon, M.; Foray, N. What Does the History of Research on the Repair of DNA Double-Strand Breaks Tell Us? A Comprehensive Review of Human Radiosensitivity. Int. J. Mol. Sci. 2019, 20, 5339. [Google Scholar] [CrossRef]
- Zhao, L.; Bao, C.; Shang, Y.; He, X.; Ma, C.; Lei, X.; Mi, D.; Sun, Y. The Determinant of DNA Repair Pathway Choices in Ionising Radiation-Induced DNA Double-Strand Breaks. BioMed Res. Int. 2020, 2020, 4834965. [Google Scholar] [CrossRef]
- Semenenko, V.A.; Stewart, R.D. Monte Carlo simulation of base and nucleotide excision repair of clustered DNA damage sites. II. Comparisons of model predictions to measured data. Radiat. Res. 2005, 164, 194–201. [Google Scholar] [CrossRef]
- Semenenko, V.A.; Stewart, R.D.; Ackerman, E.J. Monte Carlo simulation of base and nucleotide excision repair of clustered DNA damage sites. I. Model properties and predicted trends. Radiat. Res. 2005, 164, 180–193. [Google Scholar] [CrossRef] [PubMed]
- Frankenberg, D. Repair of DNA double-strand breaks and its effect on RBE. Adv. Space Res. 1994, 14, 235–248. [Google Scholar] [CrossRef]
- Tsai, J.-Y.; Chen, F.-H.; Hsieh, T.-Y.; Hsiao, Y.-Y. Effects of indirect actions and oxygen on relative biological effectiveness: Estimate of DSB induction and conversion induced by gamma rays and helium ions. J. Radiat. Res. 2015, 56, 691–699. [Google Scholar] [CrossRef]
- Luo, W.-R.; Chen, F.-H.; Huang, R.-J.; Chen, Y.-P.; Hsiao, Y.-Y.; Chen, F.-H. Effects of indirect actions and oxygen on relative biological effectiveness: Estimate of DSB inductions and conversions induced by therapeutic proton beams. Int. J. Radiat. Biol. 2020, 96, 187–196. [Google Scholar] [CrossRef] [PubMed]
- Lomax, M.E.; Folkes, L.K.; O’Neill, P. Biological consequences of radiation-induced DNA damage: Relevance to radiotherapy. Clin. Oncol. 2013, 25, 578–585. [Google Scholar] [CrossRef] [PubMed]
- McKeown, S.R. Defining normoxia, physoxia and hypoxia in tumours-implications for treatment response. Br. J. Radiol. 2014, 87, 20130676. [Google Scholar] [CrossRef]
- Stewart, R.D.; Yu, V.K.; Georgakilas, A.G.; Koumenis, C.; Park, J.H.; Carlson, D.J. Effects of radiation quality and oxygen on clustered DNA lesions and cell death. Radiat. Res. 2011, 176, 587–602. [Google Scholar] [CrossRef]
- Chan, N.; Ali, M.; McCallum, G.P.; Kumareswaran, R.; Koritzinsky, M.; Wouters, B.G.; Wells, P.G.; Gallinger, S.; Bristow, R.G. Hypoxia Provokes Base Excision Repair Changes and a Repair-Deficient, Mutator Phenotype in Colorectal Cancer Cells. Mol. Cancer Res. 2014, 12, 1407–1415. [Google Scholar] [CrossRef]
- Hammond, E.; Asselin, M.-C.; Forster, D.; O’Connor, J.; Senra, J.; Williams, K. The Meaning, Measurement and Modification of Hypoxia in the Laboratory and the Clinic. Clin. Oncol. 2014, 26, 277–288. [Google Scholar] [CrossRef]
- Manoochehri Khoshinani, H.; Afshar, S.; Najafi, R. Hypoxia: A Double-Edged Sword in Cancer Therapy. Cancer Invest. 2016, 34, 536–545. [Google Scholar] [CrossRef]
- Tang, M.; Bolderson, E.; O’Byrne, K.J.; Richard, D.J. Tumor Hypoxia Drives Genomic Instability. Front. Cell Dev. Biol. 2021, 9. [Google Scholar] [CrossRef]
- Elsässer, T.; Weyrather, W.K.; Friedrich, T.; Durante, M.; Iancu, G.; Krämer, M.; Kragl, G.; Brons, S.; Winter, M.; Weber, K.-J.; et al. Quantification of the Relative Biological Effectiveness for Ion Beam Radiotherapy: Direct Experimental Comparison of Proton and Carbon Ion Beams and a Novel Approach for Treatment Planning. Int. J. Radiat. Oncol. Biol. Phys. 2010, 78, 1177–1183. [Google Scholar] [CrossRef] [PubMed]
- Friedrich, T.; Scholz, U.; Elsässer, T.; Durante, M.; Scholz, M. Calculation of the biological effects of ion beams based on the microscopic spatial damage distribution pattern. Int. J. Radiat. Biol. 2012, 88, 103–107. [Google Scholar] [CrossRef]
- Hawkins, R.B. A microdosimetric-kinetic model of cell death from exposure to ionizing radiation of any LET, with experimental and clinical applications. Int. J. Radiat. Biol. 1996, 69, 739–755. [Google Scholar] [CrossRef]
- Hawkins, R.B. A microdosimetric-kinetic theory of the dependence of the RBE for cell death on LET. Med. Phys. 1998, 25, 1157–1170. [Google Scholar] [CrossRef]
- Hawkins, R.B.; Inaniwa, T. A Microdosimetric-Kinetic Model for Cell Killing by Protracted Continuous Irradiation Including Dependence on LET I: Repair in Cultured Mammalian Cells. Radiat. Res. 2013, 180, 584–594. [Google Scholar] [CrossRef] [PubMed]
- Stewart, R.D.; Carlson, D.J.; Butkus, M.P.; Hawkins, R.; Friedrich, T.; Scholz, M. A comparison of mechanism-inspired models for particle relative biological effectiveness (RBE). Med. Phys. 2018, 45, e925–e952. [Google Scholar] [CrossRef] [PubMed]
- Cunha, M.; Monini, C.; Testa, E.; Beuve, M. NanOx, a new model to predict cell survival in the context of particle therapy. Phys. Med. Biol. 2017, 62, 1248. [Google Scholar] [CrossRef]
- Monini, C.; Cunha, M.; Testa, E.; Beuve, M. Study of the Influence of NanOx Parameters. Cancers 2018, 10, 87. [Google Scholar] [CrossRef]
- Monini, C.; Cunha, M.; Chollier, L.; Testa, E.; Beuve, M. Determination of the Effective Local Lethal Function for the NanOx Model. Radiat. Res. 2020, 193, 331–340. [Google Scholar] [CrossRef]
- Carlson, D.J.; Stewart, R.D.; Semenenko, V.A.; Sandison, G.A. Combined Use of Monte Carlo DNA Damage Simulations and Deterministic Repair Models to Examine Putative Mechanisms of Cell Killing. Radiat. Res. 2008, 169, 447–459. [Google Scholar] [CrossRef] [PubMed]
- Frese, M.C.; Yu, V.K.; Stewart, R.D.; Carlson, D.J. A Mechanism-Based Approach to Predict the Relative Biological Effectiveness of Protons and Carbon Ions in Radiation Therapy. Int. J. Radiat. Oncol. Biol. Phys. 2012, 83, 442–450. [Google Scholar] [CrossRef] [PubMed]
- Streitmatter, S.W.; Stewart, R.D.; Jenkins, P.A.; Jevremovic, T. DNA double strand break (DSB) induction and cell survival in iodine-enhanced computed tomography (CT). Phys. Med. Biol. 2017, 62, 6164–6184. [Google Scholar] [CrossRef] [PubMed]
- Mara, E.; Clausen, M.; Khachonkham, S.; Deycmar, S.; Pessy, C.; Dörr, W.; Kuess, P.; Georg, D.; Gruber, S. Investigating the impact of alpha/beta and LET d on relative biological effectiveness in scanned proton beams: An in vitro study based on human cell lines. Med. Phys. 2020, 47, 3691–3702. [Google Scholar] [CrossRef] [PubMed]
- Kamp, F.; Carlson, D.J.; Wilkens, J.J. Rapid implementation of the repair-misrepair-fixation (RMF) model facilitating online adaption of radiosensitivity parameters in ion therapy. Phys. Med. Biol. 2017, 62, N285–N296. [Google Scholar] [CrossRef][Green Version]
- Mairani, A.; Dokic, I.; Magro, G.; Tessonnier, T.; Kamp, F.; Carlson, D.J.; Ciocca, M.; Cerutti, F.; Sala, P.R.; Ferrari, A.; et al. Biologically optimized helium ion plans: Calculation approach and its in vitro validation. Phys. Med. Biol. 2016, 61, 4283–4299. [Google Scholar] [CrossRef] [PubMed]
- Urano, M.; Goitein, M.; Verhey, L.; Mendiondo, O.; Suit, H.D.; Koehler, A. Relative biological effectiveness of a high energy modulated proton beam using a spontaneous murine tumor In vivo. Int. J. Radiat. Oncol. Biol. Phys. 1980, 6, 1187–1193. [Google Scholar] [CrossRef]
- Raju, M.R.; Amols, H.I.; Bain, E.; Carpenter, S.G.; Cox, R.A.; Robertson, J.B. A heavy particle comparative study. Part III: OER and RBE. Br. J. Radiol. 1978, 51, 712–719. [Google Scholar] [CrossRef] [PubMed]
- Schneider, C.A.; Rasband, W.S.; Eliceiri, K.W. NIH Image to ImageJ: 25 years of image analysis. Nat. Methods 2012, 9, 671–675. [Google Scholar] [CrossRef]
- Harrison, R.L. Introduction to Monte Carlo Simulation. In Proceedings of the 2008 Winter Simulation Conference, Miami, FL, USA, 7–10 December 2008; Volume 1204, pp. 17–21. [Google Scholar]
- SSemenenko, V.A.; Stewart, R.D. A Fast Monte Carlo Algorithm to Simulate the Spectrum of DNA Damages Formed by Ionizing Radiation. Radiat. Res. 2004, 161, 451–457. [Google Scholar] [CrossRef]
- Semenenko, V.A.; Stewart, R.D. Fast Monte Carlo simulation of DNA damage formed by electrons and light ions. Phys. Med. Biol. 2006, 51, 1693–1706. [Google Scholar] [CrossRef] [PubMed]
- El Naqa, I.; Pater, P.; Seuntjens, J. Monte Carlo role in radiobiological modelling of radiotherapy outcomes. Phys. Med. Biol. 2012, 57, R75–R97. [Google Scholar] [CrossRef]
- Incerti, S.; Kyriakou, I.; Bernal, M.A.; Bordage, M.C.; Francis, Z.; Guatelli, S.; Ivanchenko, V.; Karamitros, M.; Lampe, N.; Lee, S.B.; et al. Geant4-DNA example applications for track structure simulations in liquid water: A report from the Geant4-DNA Project. Med. Phys. 2018, 45, e722–e739. [Google Scholar] [CrossRef] [PubMed]
- Chatzipapas, K.P.; Papadimitroulas, P.; Emfietzoglou, D.; Kalospyros, S.A.; Hada, M.; Georgakilas, A.G.; Kagadis, G.C. Ionizing Radiation and Complex DNA Damage: Quantifying the Radiobiological Damage Using Monte Carlo Simulations. Cancers 2020, 12, 799. [Google Scholar] [CrossRef]
- Watanabe, R.; Rahmanian, S.; Nikjoo, H. Spectrum of Radiation-Induced Clustered Non-DSB Damage—A Monte Carlo Track Structure Modeling and Calculations. Radiat. Res. 2015, 183, 525–540. [Google Scholar] [CrossRef] [PubMed]
- Carlson, D.J.; Stewart, R.D.; Semenenko, V.A. Effects of oxygen on intrinsic radiation sensitivity: A test of the relationship between aerobic and hypoxic linear-quadratic (LQ) model parameters. Med. Phys. 2006, 33, 3105. [Google Scholar] [CrossRef]
- Booz, J.; Braby, L.; Coyne, J.; Kliauga, P.; Lindborg, L.; Menzel, H.G.; Parmentier, N. ICRU 1983 Microdosimetry Report 36; International Commission on Radiation Units and Measurements: Bethesda, MD, USA, 1983. [Google Scholar]
- Kassis, A.I. The Amazing World of Auger Electrons. Int. J. Radiat. Biol. 2004, 80, 789–803. [Google Scholar] [CrossRef]
- Rothkamm, K.; Lobrich, M. Evidence for a lack of DNA double-strand break repair in human cells exposed to very low x-ray doses. Proc. Natl. Acad. Sci. USA 2003, 100, 5057–5062. [Google Scholar] [CrossRef]
- Sapora, O.; Barone, F.; Belli, M.; Maggi, A.; Quintiliani, M.; Tabocchini, M. Relationships Between Cell Killing, Mutation Induction and DNA Damage in X-irradiated V79 Cells: The Influence of Oxygen and DMSO. Int. J. Radiat. Biol. 1991, 60, 467–482. [Google Scholar] [CrossRef]
- Dasu, A.; Toma-Dasu, I. Impact of variable RBE on proton fractionation. Med. Phys. 2013, 40, 011705. [Google Scholar] [CrossRef]
- Hsiao, Y.; Stewart, R.D. Monte Carlo simulation of DNA damage induction by x-rays and selected radioisotopes. Phys. Med. Biol. 2008, 53, 233–244. [Google Scholar] [CrossRef] [PubMed]
- Nikjoo, H.; O’Neill, P.; Wilson, W.E.; Goodhead, D.T. Computational approach for determining the spectrum of DNA damage induced by ionizing radiation. Radiat. Res. 2001, 156, 577–583. [Google Scholar] [CrossRef]
- Forster, J.C.; Douglass, M.J.J.; Phillips, W.M.; Bezak, E. Monte Carlo Simulation of the Oxygen Effect in DNA Damage Induction by Ionizing Radiation. Radiat. Res. 2018, 190, 248–261. [Google Scholar] [CrossRef]
- Prise, K.M.; Folkard, M.; Davies, S.; Michael, B.D. The Irradiation of V79 Mammalian Cells by Protons with Energies below 2 MeV. Part II. Measurement of Oxygen Enhancement Ratios and DNA Damage. Int. J. Radiat. Biol. 1990, 58, 261–277. [Google Scholar] [CrossRef]
- Furusawa, Y.; Fukutsu, K.; Aoki, M.; Itsukaichi, H.; Eguchikasai, K.; Ohara, H.; Yatagai, F.; Kanai, T.; Ando, K. Inactivation of Aerobic and Hypoxic Cells from Three Different Cell Lines by Accelerated (3)He-, (12)C- and (20)Ne-ion Beams. Radiat. Res. 2000, 154, 485–496. [Google Scholar] [CrossRef]
- Tinganelli, W.; Ma, N.-Y.; Von Neubeck, C.; Maier, A.; Schicker, C.; Kraft-Weyrather, W.; Durante, M. Influence of acute hypoxia and radiation quality on cell survival. J. Radiat. Res. 2013, 54 (Suppl. 1), i23–i30. [Google Scholar] [CrossRef] [PubMed]
- Streitmatter, S.W.; Stewart, R.D.; Moffitt, G.; Jevremovic, T. Mechanistic Modeling of the Relative Biological Effectiveness of Boron Neutron Capture Therapy. Cells 2020, 9, 2302. [Google Scholar] [CrossRef] [PubMed]
- Chan, C.-C.; Hsiao, Y.-Y. The Effects of Dimethylsulfoxide and Oxygen on DNA Damage Induction and Repair Outcomes for Cells Irradiated by 62 MeV Proton and 3.31 MeV Helium Ions. J. Pers. Med. 2021, 11, 286. [Google Scholar] [CrossRef]
- Nikjoo, H.; O’Neill, P.; Terrissol, M.; Goodhead, D.T. Quantitative modelling of DNA damage using Monte Carlo track structure method. Radiat. Environ. Biophys. 1999, 38, 31–38. [Google Scholar] [CrossRef]
- Nikjoo, H.; Emfietzoglou, D.; Liamsuwan, T.; Taleei, R.; Liljequist, D.; Uehara, S. Radiation track, DNA damage and response—A review. Rep. Prog. Phys. 2016, 79, 116601. [Google Scholar] [CrossRef]
- Nikitaki, Z.; Nikolov, V.; Mavragani, I.V.; Mladenov, E.; Mangelis, A.; Laskaratou, D.A.; Fragkoulis, G.I.; Hellweg, C.E.; Martin, O.A.; Emfietzoglou, D.; et al. Measurement of complex DNA damage induction and repair in human cellular systems after exposure to ionizing radiations of varying linear energy transfer (LET). Free Radic. Res. 2016, 50, S64–S78. [Google Scholar] [CrossRef]
- Kinner, A.; Wu, W.; Staudt, C.; Iliakis, G. Gamma-H2AX in recognition and signaling of DNA double-strand breaks in the context of chromatin. Nucleic Acids Res. 2008, 36, 5678–5694. [Google Scholar] [CrossRef] [PubMed]
- Sakata, D.; Kyriakou, I.; Tran, H.N.; Bordage, M.-C.; Rosenfeld, A.; Ivanchenko, V.; Incerti, S.; Emfietzoglou, D.; Guatelli, S. Electron track structure simulations in a gold nanoparticle using Geant4-DNA. Phys. Med. 2019, 63, 98–104. [Google Scholar] [CrossRef] [PubMed]
- Sakata, D.; Belov, O.; Bordage, M.-C.; Emfietzoglou, D.; Guatelli, S.; Inaniwa, T.; Ivanchenko, V.; Karamitros, M.; Kyriakou, I.; Lampe, N.; et al. Fully integrated Monte Carlo simulation for evaluating radiation induced DNA damage and subsequent repair using Geant4-DNA. Sci. Rep. 2020, 10, 1–13. [Google Scholar] [CrossRef] [PubMed]
- Nickoloff, J.A.; Sharma, N.; Taylor, L. Clustered DNA Double-Strand Breaks: Biological Effects and Relevance to Cancer Radiotherapy. Genes 2020, 11, 99. [Google Scholar] [CrossRef]
- Kundrát, P.; Friedland, W.; Becker, J.; Eidemüller, M.; Ottolenghi, A.; Baiocco, G. Analytical formulas representing track-structure simulations on DNA damage induced by protons and light ions at radiotherapy-relevant energies. Sci. Rep. 2020, 10, 15775. [Google Scholar] [CrossRef] [PubMed]
- Prise, K.M.; Ahnström, G.; Belli, M.; Carlsson, J.; Frankenberg, D.; Kiefer, J.; Löbrich, M.; Michael, B.D.; Nygren, J.; Simone, G.; et al. A review of dsb induction data for varying quality radiations. Int. J. Radiat. Biol. 1998, 74, 173–184. [Google Scholar] [CrossRef]
- Pinto, M.; Prise, K.M.; Michael, B.D. A Monte Carlo model of DNA double-strand break clustering and rejoining kinetics for the analysis of pulsed-field gel electrophoresis data. Radiat. Res. 2004, 162, 453–463. [Google Scholar] [CrossRef]
- Kanemoto, A.; Hirayama, R.; Moritake, T.; Furusawa, Y.; Sun, L.; Sakae, T.; Kuno, A.; Terunuma, T.; Yasuoka, K.; Mori, Y.; et al. RBE and OER within the spread-out Bragg peak for proton beam therapy: In vitro study at the Proton Medical Research Center at the University of Tsukuba. J. Radiat. Res. 2014, 55, 1028–1032. [Google Scholar] [CrossRef]
- Stewart, R.D.; Streitmatter, S.W.; Argento, D.C.; Kirkby, C.; Goorley, J.T.; Moffitt, G.; Jevremovic, T.; Sandison, G.A. Rapid MCNP simulation of DNA double strand break (DSB) relative biological effectiveness (RBE) for photons, neutrons, and light ions. Phys. Med. Biol. 2015, 60, 8249–8274. [Google Scholar] [CrossRef]
- Alhmoud, J.F.; Woolley, J.F.; Al Moustafa, A.-E.; Malki, M.I.; Alhmoud, J.F. DNA Damage/Repair Management in Cancers. Cancers 2020, 12, 1050. [Google Scholar] [CrossRef]
- Sapozink, M.D. Oxygen Enhancement Ratios in Synchronous HeLa Cells Exposed to Low-LET Radiation. Radiat. Res. 1977, 69, 27–39. [Google Scholar] [CrossRef] [PubMed]
- Weyrather, W.; Kraft, G. RBE of carbon ions: Experimental data and the strategy of RBE calculation for treatment planning. Radiother. Oncol. 2004, 73 (Suppl. 2), S161–S169. [Google Scholar] [CrossRef]
- Karger, C.P.; Glowa, C.; Peschke, P.; Kraft-Weyrather, W. The RBE in ion beam radiotherapy: In vivo studies and clinical application. Z. Med. Phys. 2021, 31, 105–121. [Google Scholar] [CrossRef]
- Madhusudan, S.; Hickson, I.D. DNA repair inhibition: A selective tumour targeting strategy. Trends Mol. Med. 2005, 11, 503–511. [Google Scholar] [CrossRef] [PubMed]
- Abbotts, R.; Thompson, N.; Madhusudan, S. DNA repair in cancer: Emerging targets for personalized therapy. Cancer Manag. Res. 2014, 6, 77–92. [Google Scholar] [CrossRef] [PubMed]
- Gong, L.; Zhang, Y.; Liu, C.; Zhang, M.; Han, S. Application of Radiosensitizers in Cancer Radiotherapy. Int. J. Nanomed. 2021, 16, 1083–1102. [Google Scholar] [CrossRef] [PubMed]
- Bassler, N.; Toftegaard, J.; Lühr, A.; Sørensen, B.S.; Scifoni, E.; Krämer, M.; Jäkel, O.; Mortensen, L.S.; Overgaard, J.; Petersen, J.B. LET-painting increases tumour control probability in hypoxic tumours. Acta Oncol. 2014, 53, 25–32. [Google Scholar] [CrossRef] [PubMed]


Publisher’s Note: MDPI stays neutral with regard to jurisdictional claims in published maps and institutional affiliations. |
© 2021 by the authors. Licensee MDPI, Basel, Switzerland. This article is an open access article distributed under the terms and conditions of the Creative Commons Attribution (CC BY) license (https://creativecommons.org/licenses/by/4.0/).