
miRNA Clusters with Up-Regulated Expression in Colorectal Cancer


Abstract
Simple Summary
Abstract
1. Introduction
2. Materials and Methods
2.1. Literature Search Strategy
2.1.1. Eligibility Criteria for Articles
- Studies published in the English language
- Studies with samples of human tumour tissue from patients with CRC
- Studies where the miRNA expression profile of the CRC tumour tissue was compared with that of normal tissue
- Studies with available expression data about up-regulated miRNAs
- Reviews, book chapters, meta-analysis, and systematic reviews
- Studies using only animal models and cell lines
- Studies where only plasma or serum samples from patients with CRC were analysed.
2.1.2. Eligibility Criteria for Selecting miRNAs and miRNA Clusters
2.2. Searching for Further Data about miRNAs
2.3. Classification of Target Genes by Panther Analysis
3. Results
3.1. Characteristic of Studies Involved in Meta-Analysis
- miR-106a/18b/20b/19b-2/92a-2/363 (miR-106a/363)
- miR-106b/93/25
- miR-17/18a/19a/20a/19b-1/92a-1 (miR-17/92a-1)
- miR-181a-1/181b-1
- miR-181a-2/181b-2
- miR-181c/181d
- miR-183/96/182
- miR-191/425
- miR-200c/141
- miR-203a/203b
- miR-222/221
- miR-23a/27a/24-2
- miR-29b-1/29a
- miR-301b/130b
- miR-452/224
3.2. Genomic Location of Selected Clusters and Regulation of Their Expression
3.3. Regulation of miRNA Expression by Long Non-Coding RNAs
3.4. miRNA Families
3.5. Expression of miRNA Clusters in Tissues, the Circulation and Stool of Patients with CRC
3.6. Association of miRNA Clusters Expression with Clinicopathological Characteristics
3.7. Association of miRNA Cluster Expression with Response to Chemotherapy
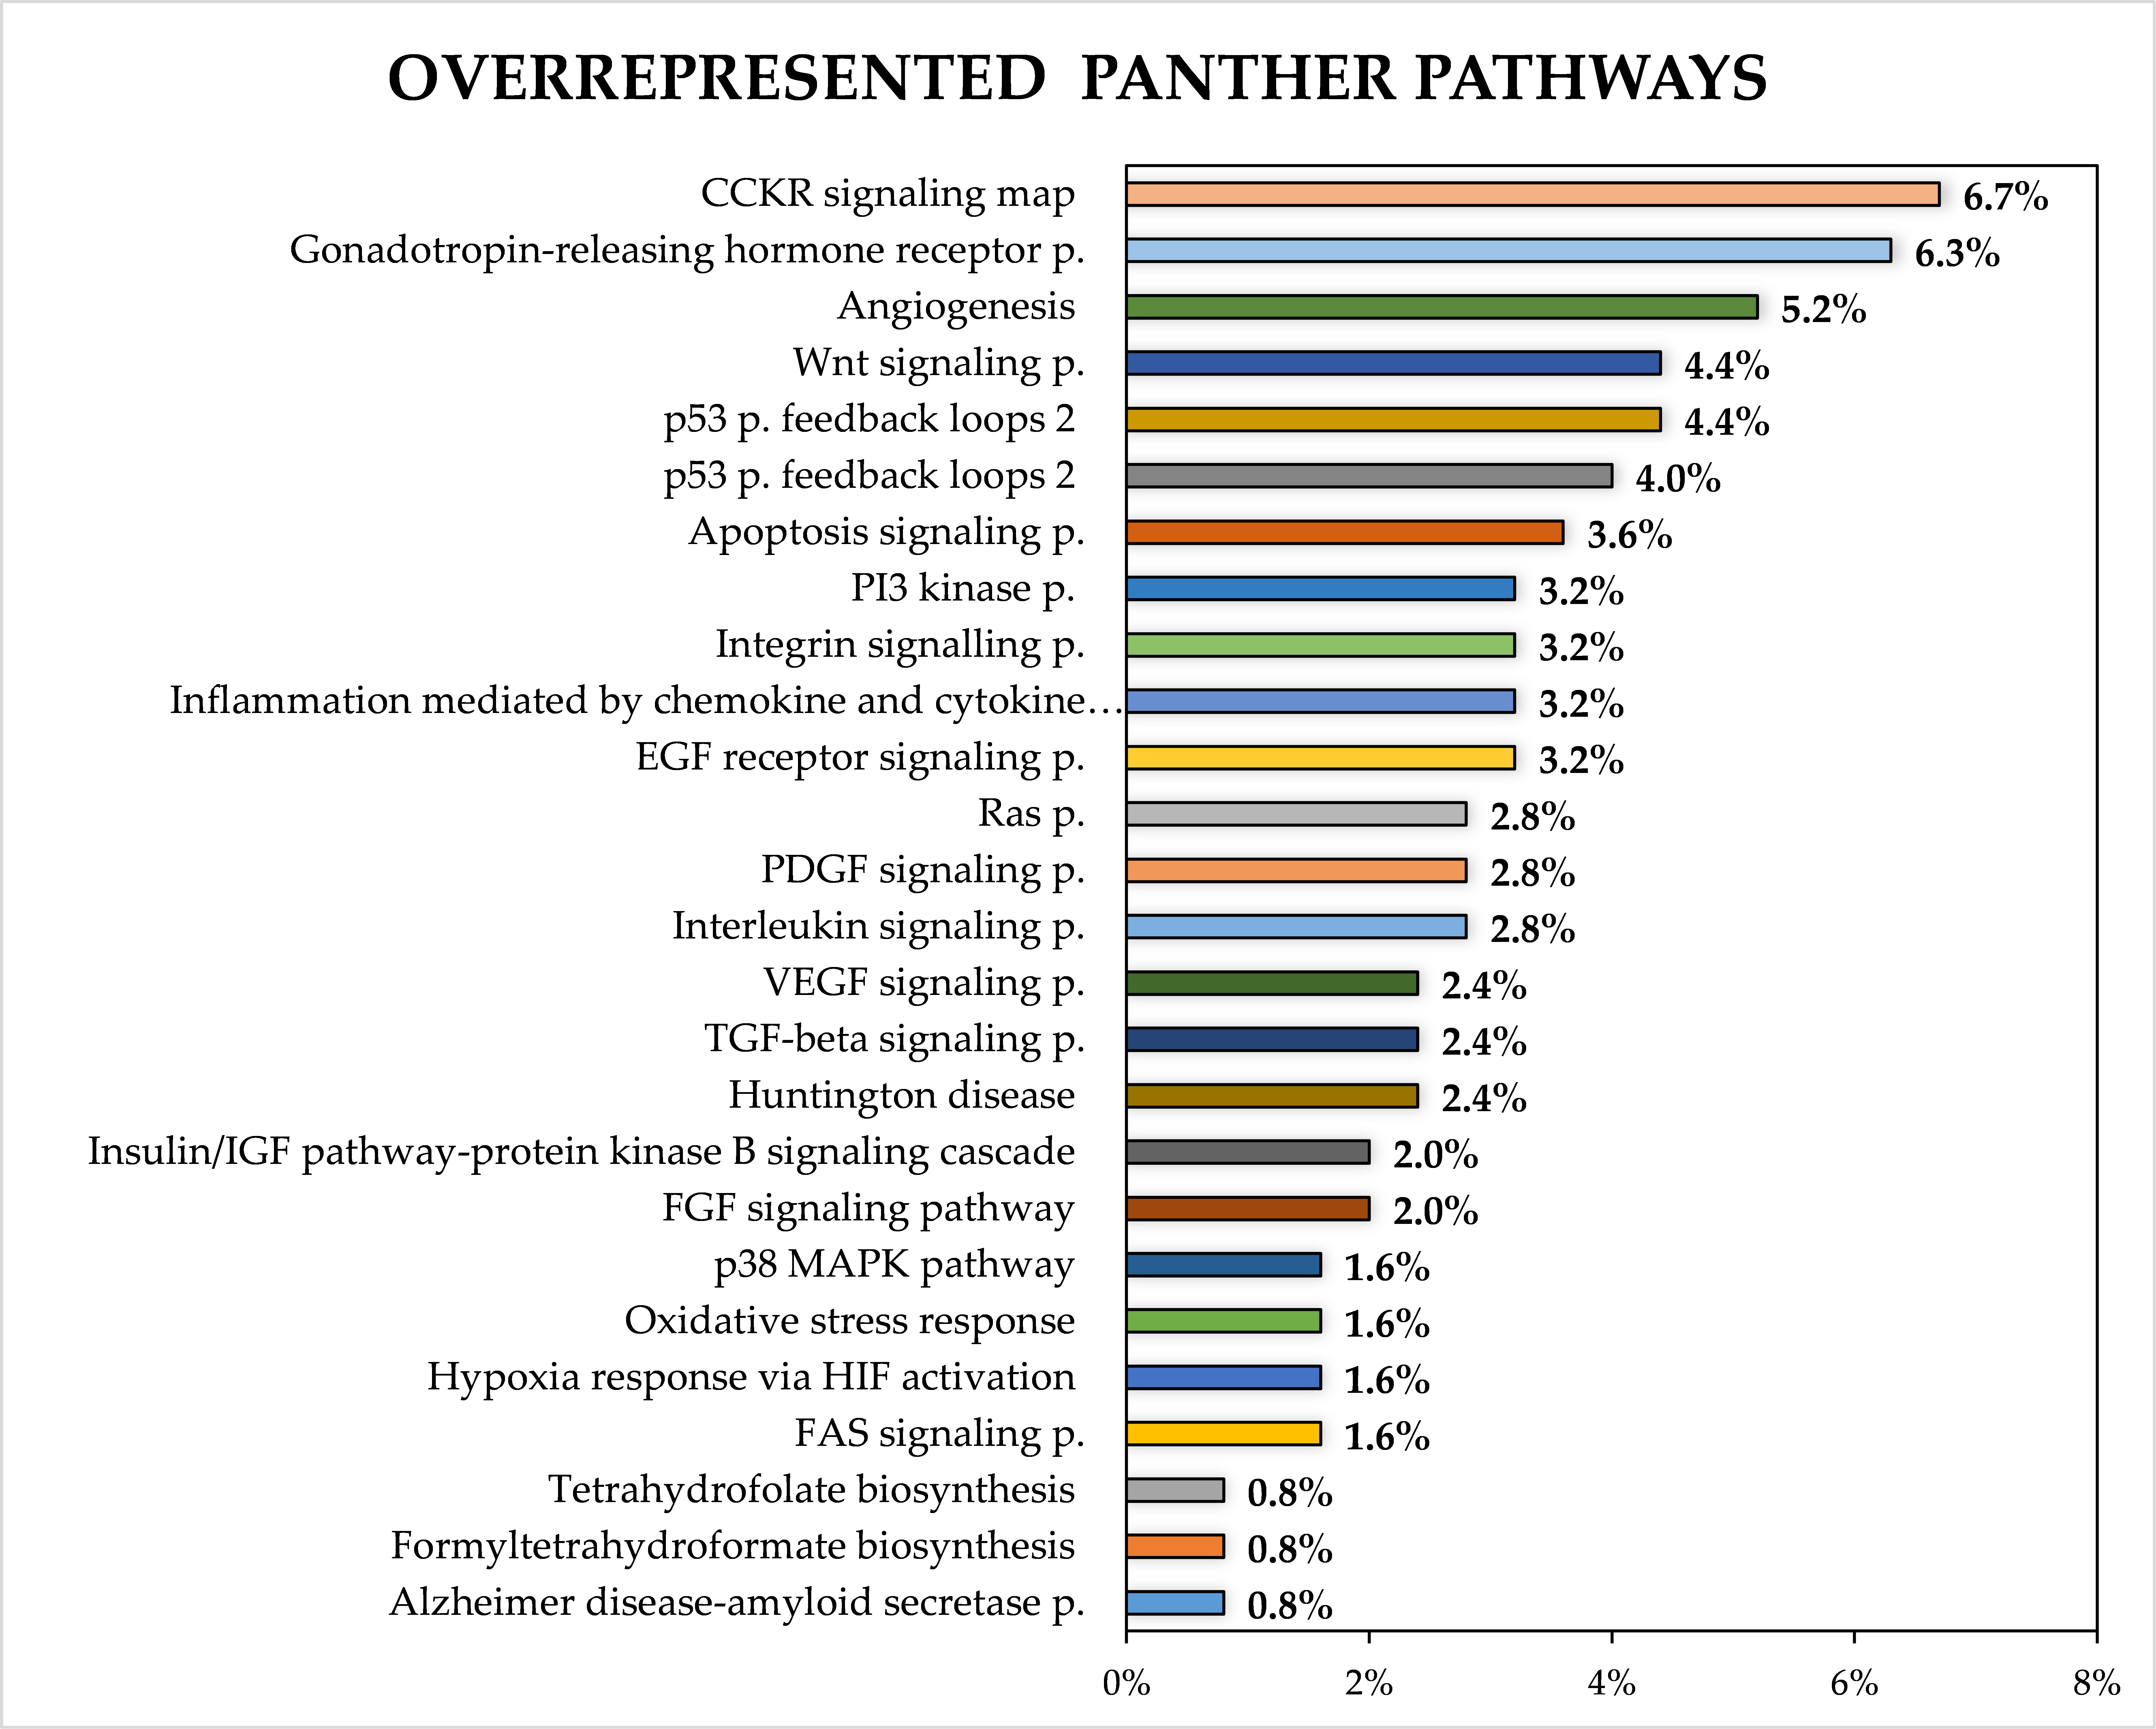
3.8. Target Genes of miRNA Clusters
4. Discussion
5. Conclusions
Supplementary Materials
Author Contributions
Funding
Institutional Review Board Statement
Informed Consent Statement
Data Availability Statement
Conflicts of Interest
References
- Wong, M.C.; Huang, J.; Lok, V.; Wang, J.; Fung, F.; Ding, H.; Zheng, Z.-J. Differences in Incidence and Mortality Trends of Colorectal Cancer Worldwide Based on Sex, Age, and Anatomic Location. Clin. Gastroenterol. Hepatol. 2021, 19, 955–966.e61. [Google Scholar] [CrossRef]
- Vishnubalaji, R.; Hamam, R.; Abdulla, M.-H.; Mohammed, M.A.V.; Kassem, M.; Al-Obeed, O.; Aldahmash, A.; Alajez, N.M. Genome-wide mRNA and miRNA expression profiling reveal multiple regulatory networks in colorectal cancer. Cell Death Dis. 2015, 6, e1614. [Google Scholar] [CrossRef]
- Pizzini, S.; Bisognin, A.; Mandruzzato, S.; Biasiolo, M.; Facciolli, A.; Perilli, L.; Rossi, E.; Esposito, G.; Rugge, M.; Pilati, P.; et al. Impact of microRNAs on regulatory networks and pathways in human colorectal carcinogenesis and development of metastasis. BMC Genom. 2013, 14, 589. [Google Scholar] [CrossRef]
- Bonneau, E.; Neveu, B.; Kostantin, E.; Tsongalis, G.J.; De Guire, V. How close are miRNAs from clinical practice? A perspective on the diagnostic and therapeutic market. Electron. J. Int. Fed. Clin. Chem. Lab. Med. 2019, 30, 114–127. [Google Scholar]
- Kim, S.; Song, M.L.; Min, H.; Hwang, I.; Baek, S.K.; Kwon, T.K.; Park, J.-W. miRNA biogenesis-associated RNase III nucleases Drosha and Dicer are upregulated in colorectal adenocarcinoma. Oncol. Lett. 2017, 14, 4379–4383. [Google Scholar] [CrossRef]
- Stratmann, J.; Wang, C.-J.; Gnosa, S.; Wallin, Å.; Hinselwood, D.; Sun, X.-F.; Zhang, H. Dicer and miRNA in relation to clinicopathological variables in colorectal cancer patients. BMC Cancer 2011, 11, 345. [Google Scholar] [CrossRef]
- Vychytilova-Faltejskova, P.; Kovarikova, A.S.; Grolich, T.; Prochazka, V.; Slaba, K.; Machackova, T.; Halamkova, J.; Svoboda, M.; Kala, Z.; Kiss, I.; et al. MicroRNA Biogenesis Pathway Genes Are Deregulated in Colorectal Cancer. Int. J. Mol. Sci. 2019, 20, 4460. [Google Scholar] [CrossRef] [PubMed]
- Lai, H.-H.; Lin, L.-J.; Hung, L.-Y.; Chen, P.-S. Role of Dicer in regulating oxaliplatin resistance of colon cancer cells. Biochem. Biophys. Res. Commun. 2018, 506, 87–93. [Google Scholar] [CrossRef] [PubMed]
- Baskerville, S. Microarray profiling of microRNAs reveals frequent coexpression with neighboring miRNAs and host genes. RNA 2005, 11, 241–247. [Google Scholar] [CrossRef] [PubMed]
- Marsico, A.; Huska, M.R.; Lasserre, J.; Hu, H.; Vučićević, D.; Musahl, A.; Orom, U.A.; Vingron, M. PROmiRNA: A new miRNA promoter recognition method uncovers the complex regulation of intronic miRNAs. Genome Biol. 2013, 14, R84. [Google Scholar] [CrossRef]
- Liu, B.; Shyr, Y.; Cai, J.; Liu, Q. Interplay between miRNAs and host genes and their role in cancer. Briefings Funct. Genom. 2019, 18, 255–266. [Google Scholar] [CrossRef] [PubMed]
- Mi, H.; Ebert, D.; Muruganujan, A.; Mills, C.; Albou, L.-P.; Mushayamaha, T.; Thomas, P.D. PANTHER version 16: A revised family classification, tree-based classification tool, enhancer regions and extensive API. Nucleic Acids Res. 2021, 49, D394–D403. [Google Scholar] [CrossRef]
- Georgakilas, G.; Vlachos, I.S.; Paraskevopoulou, M.D.; Yang, P.; Zhang, Y.; Economides, A.N.; Hatzigeorgiou, A.G. microTSS: Accurate microRNA transcription start site identification reveals a significant number of divergent pri-miRNAs. Nat. Commun. 2014, 5, 5700. [Google Scholar] [CrossRef] [PubMed]
- Pidíkova, P.; Reis, R.; Herichova, I. miRNA Clusters with Down-Regulated Expression in Human Colorectal Cancer and Their Regulation. Int. J. Mol. Sci. 2020, 21, 4633. [Google Scholar] [CrossRef] [PubMed]
- Mogilyansky, E.; Rigoutsos, I. The miR-17/92 cluster: A comprehensive update on its genomics, genetics, functions and increasingly important and numerous roles in health and disease. Cell Death Differ. 2013, 20, 1603–1614. [Google Scholar] [CrossRef] [PubMed]
- Ozsolak, F.; Poling, L.L.; Wang, Z.; Liu, H.; Liu, X.S.; Roeder, R.G.; Zhang, X.; Song, J.S.; Fisher, D.E. Chromatin structure analyses identify miRNA promoters. Genes Dev. 2008, 22, 3172–3183. [Google Scholar] [CrossRef]
- Cerami, E.; Gao, J.; Dogrusoz, U.; Gross, B.E.; Sumer, S.O.; Aksoy, B.A.; Jacobsen, A.; Byrne, C.J.; Heuer, M.L.; Larsson, E.; et al. The cBio Cancer Genomics Portal: An Open Platform for Exploring Multidimensional Cancer Genomics Data. Cancer Discov. 2012, 2, 401–404. [Google Scholar] [CrossRef]
- Cancer Genome Atlas Network. Comprehensive molecular characterization of human colon and rectal cancer. Nature 2012, 487, 330–337. [Google Scholar] [CrossRef]
- Gao, J.; Aksoy, B.A.; Dogrusoz, U.; Dresdner, G.; Gross, B.; Sumer, S.O.; Sun, Y.; Jacobsen, A.; Sinha, R.; Larsson, E.; et al. Integrative Analysis of Complex Cancer Genomics and Clinical Profiles Using the cBioPortal. Sci. Signal. 2013, 6, pl1. [Google Scholar] [CrossRef]
- Thomas, M.; Lange-Grünweller, K.; Hartmann, D.; Golde, L.; Schlereth, J.; Streng, D.; Aigner, A.; Grünweller, A.; Hartmann, R.K. Analysis of Transcriptional Regulation of the Human miR-17-92 Cluster; Evidence for Involvement of Pim-1. Int. J. Mol. Sci. 2013, 14, 12273–12296. [Google Scholar] [CrossRef]
- He, C.; Li, Z.; Chen, P.; Huang, H.; Hurst, L.D.; Chen, J. Young intragenic miRNAs are less coexpressed with host genes than old ones: Implications of miRNA–host gene coevolution. Nucleic Acids Res. 2012, 40, 4002–4012. [Google Scholar] [CrossRef]
- Rodriguez, A.; Griffiths-Jones, S.; Ashurst, J.L.; Bradley, A. Identification of Mammalian microRNA Host Genes and Transcription Units. Genome Res. 2004, 14, 1902–1910. [Google Scholar] [CrossRef] [PubMed]
- Pierce, M.L.; Weston, M.D.; Fritzsch, B.; Gabel, H.W.; Ruvkun, G.; Soukup, G.A. MicroRNA-183 family conservation and ciliated neurosensory organ expression. Evol. Dev. 2008, 10, 106–113. [Google Scholar] [CrossRef]
- Dambal, S.; Shah, M.; Mihelich, B.L.; Nonn, L. The microRNA-183 cluster: The family that plays together stays together. Nucleic Acids Res. 2015, 43, 7173–7188. [Google Scholar] [CrossRef] [PubMed]
- Saini, H.K.; Griffiths-Jones, S.; Enright, A.J. Genomic analysis of human microRNA transcripts. Proc. Natl. Acad. Sci. USA 2007, 104, 17719–17724. [Google Scholar] [CrossRef]
- Yates, A.D.; Achuthan, P.; Akanni, W.; Allen, J.; Alvarez-Jarreta, J.; Amode, M.R.; Armean, I.M.; Azov, A.G.; Bennett, R.; Bhai, J.; et al. Ensemble. Nucleic Acids Res. 2019, 48, D682–D688. [Google Scholar] [CrossRef]
- Sun, T.; Du, S.-Y.; Armenia, J.; Qu, F.; Fan, J.; Wang, X.; Fei, T.; Komura, K.; Liu, S.X.; Lee, G.-S.M.; et al. Expression of lncRNA MIR222HG co-transcribed from the miR-221/222 gene promoter facilitates the development of castration-resistant prostate cancer. Oncogene 2018, 7, 1–13. [Google Scholar] [CrossRef]
- Aakko, S.; Straume, A.H.; Birkeland, E.E.; Chen, P.; Qiao, X.; ’Lønning, P.E.; Kallio, M.J. MYC-Induced miR-203b-3p and miR-203a-3p Control Bcl-xL Expression and Paclitaxel Sensitivity in Tumor Cells. Transl. Oncol. 2019, 12, 170–179. [Google Scholar] [CrossRef]
- Javanmard, A.-R.; Dokanehiifard, S.; Bohlooli, M.; Soltani, B.M. LOC646329 long non-coding RNA sponges miR-29b-1 and regulates TGFβ signaling in colorectal cancer. J. Cancer Res. Clin. Oncol. 2020, 146, 1205–1215. [Google Scholar] [CrossRef]
- Biasiolo, M.; Sales, G.; Lionetti, M.; Agnelli, L.; Todoerti, K.; Bisognin, A.; Coppe, A.; Romualdi, C.; Neri, A.; Bortoluzzi, S. Impact of Host Genes and Strand Selection on miRNA and miRNA Expression. PLoS ONE 2011, 6, e23854. [Google Scholar] [CrossRef]
- Gasiulė, S.; Dreize, N.; Kaupinis, A.; Ražanskas, R.; Čiupas, L.; Stankevičius, V.; Kapustina, Ž.; Laurinavičius, A.; Valius, M.; Vilkaitis, G. Molecular Insights into miRNA-Driven Resistance to 5-Fluorouracil and Oxaliplatin Chemotherapy: miR-23b Modulates the Epithelial–Mesenchymal Transition of Colorectal Cancer Cells. J. Clin. Med. 2019, 8, 2115. [Google Scholar] [CrossRef]
- Wang, Y.; Luo, J.; Zhang, H.; Lu, J. microRNAs in the Same Clusters Evolve to Coordinately Regulate Functionally Related Genes. Mol. Biol. Evol. 2016, 33, 2232–2247. [Google Scholar] [CrossRef]
- Edvardsson, K.; Nguyen-Vu, T.; Kalasekar, S.M.; Pontén, F.; Gustafsson, J.-Å.; Williams, C. Estrogen receptor expression induces changes in the microRNA pool in human colon cancer cells. Carcinogenesis 2013, 34, 1431–1441. [Google Scholar] [CrossRef] [PubMed]
- Guo, X.; Zhu, Y.; Hong, X.; Zhang, M.; Qiu, X.; Wang, Z.; Qi, Z.; Hong, X. miR-181d and c-myc-mediated inhibition of CRY2 and FBXL3 reprograms metabolism in colorectal cancer. Cell Death Dis. 2017, 8, e2958. [Google Scholar] [CrossRef] [PubMed]
- Draht, M.X.G.; Goudkade, D.; Koch, A.; Grabsch, H.I.; Weijenberg, M.P.; Van Engeland, M.; Melotte, V.; Smits, K.M. Prognostic DNA methylation markers for sporadic colorectal cancer: A systematic review. Clin. Epigenetics 2018, 10, 1–16. [Google Scholar] [CrossRef] [PubMed]
- Hur, K.; Toiyama, Y.; Takahashi, M.; Balaguer, F.; Nagasaka, T.; Koike, J.; Hemmi, H.; Koi, M.; Boland, C.R.; Goel, A. MicroRNA-200c modulates epithelial-to-mesenchymal transition (EMT) in human colorectal cancer metastasis. Gut 2012, 62, 1315–1326. [Google Scholar] [CrossRef] [PubMed]
- Taheri, Z.; Aghdaei, H.A.; Irani, S.; Modarressi, M.H.; Noormohammadi, Z. Clinical correlation of miR-200c/141 cluster DNA methylation and miR-141 expression with the clinicopathological features of colorectal primary lesions/tumors. Rep. Biochem. Mol. Biol. 2019, 8, 208–215. [Google Scholar]
- Kawasaki, Y.; Matsumura, K.; Miyamoto, M.; Tsuji, S.; Okuno, M.; Suda, S.; Hiyoshi, M.; Kitayama, J.; Akiyama, T. REG4 is a transcriptional target of GATA6 and is essential for colorectal tumorigenesis. Sci. Rep. 2015, 5, 14291. [Google Scholar] [CrossRef]
- Fernandes, J.C.R.; Acuña, S.M.; Aoki, J.I.; Floeter-Winter, L.M.; Muxel, S.M. Long Non-Coding RNAs in the Regulation of Gene Expression: Physiology and Disease. Non-Coding RNA 2019, 5, 17. [Google Scholar] [CrossRef]
- Hu, G.; Niu, F.; Humburg, B.A.; Liao, K.; Bendi, V.S.; Callen, S.; Fox, H.S.; Buch, S. Molecular mechanisms of long noncoding RNAs and their role in disease pathogenesis. Oncotarget 2018, 9, 18648–18663. [Google Scholar] [CrossRef]
- Chen, S.; Liu, Y.; Wang, Y.; Xue, Z. LncRNA CCAT1 Promotes Colorectal Cancer Tumorigenesis Via A miR-181b-5p/TUSC3 Axis. OncoTargets Ther. 2019, 12, 9215–9225. [Google Scholar] [CrossRef]
- Shang, A.; Wang, W.; Gu, C.; Chen, W.; Lu, W.; Sun, Z.; Li, D. Long non-coding RNA CCAT1 promotes colorectal cancer progression by regulating miR-181a-5p expression. Aging 2020, 12, 8301–8320. [Google Scholar] [CrossRef] [PubMed]
- Gao, Z.; Zhou, H.; Wang, Y.; Chen, J.; Ou, Y. Regulatory effects of lncRNA ATB targeting miR-200c on proliferation and apoptosis of colorectal cancer cells. J. Cell. Biochem. 2020, 121, 332–343. [Google Scholar] [CrossRef] [PubMed]
- Liu, X.; Wang, C. Long non-coding RNA ATB is associated with metastases and promotes cell invasion in colorectal cancer via sponging miR-141-3p. Exp. Ther. Med. 2020, 20, 1. [Google Scholar] [CrossRef] [PubMed]
- Villegas, V.E.; Zaphiropoulos, P.G. Neighboring Gene Regulation by Antisense Long Non-Coding RNAs. Int. J. Mol. Sci. 2015, 16, 3251–3266. [Google Scholar] [CrossRef] [PubMed]
- Sun, Z.; Shao, B.; Liu, Z.; Dang, Q.; Guo, Y.; Chen, C.; Guo, Y.; Chen, Z.; Liu, J.; Hu, S.; et al. LINC01296/miR-141-3p/ZEB1-ZEB2 axis promotes tumor metastasis via enhancing epithelial-mesenchymal transition process. J. Cancer 2021, 12, 2723–2734. [Google Scholar] [CrossRef]
- Wu, G.; Xue, M.; Zhao, Y.; Han, Y.; Li, C.; Zhang, S.; Zhang, J.; Xu, J. Long noncoding RNA ZEB1-AS1 acts as a Sponge of miR-141-3p to Inhibit Cell Proliferation in Colorectal Cancer. Int. J. Med. Sci. 2020, 17, 1589–1597. [Google Scholar] [CrossRef]
- Lin, M.; Li, Y.; Xian, J.; Chen, J.; Feng, Y.; Mao, C.; Pan, Y.; Li, Z.; Zeng, Y.; Yang, L.; et al. Long non-coding RNA AGER-1 inhibits colorectal cancer progression through sponging miR-182. Int. J. Biol. Markers 2020, 35, 10–18. [Google Scholar] [CrossRef]
- Ma, S.; Yang, D.; Liu, Y.; Wang, Y.; Lin, T.; Li, Y.; Yang, S.; Zhang, W.; Zhang, R. LncRNA BANCR promotes tumorigenesis and enhances adriamycin resistance in colorectal cancer. Aging 2018, 10, 2062–2078. [Google Scholar] [CrossRef]
- Wei, H.; Yang, Z.; Lin, B. Overexpression of long non coding RNA CA3-AS1 suppresses proliferation, invasion and promotes apoptosis via miRNA-93/PTEN axis in colorectal cancer. Gene 2019, 687, 9–15. [Google Scholar] [CrossRef] [PubMed]
- Xu, X.-W.; Zheng, B.-A.; Hu, Z.-M.; Qian, Z.-Y.; Huang, C.-J.; Liu, X.-Q.; Wu, W.-D. Circular RNA hsa_circ_000984 promotes colon cancer growth and metastasis by sponging miR-106b. Oncotarget 2017, 8, 91674–91683. [Google Scholar] [CrossRef]
- Shen, T.; Cheng, X.; Liu, X.; Xia, C.; Zhang, H.; Pan, D.; Zhang, X.; Li, Y. Circ_0026344 restrains metastasis of human colorectal cancer cells via miR-183. Artif. Cells Nanomed. Biotechnol. 2019, 47, 4038–4045. [Google Scholar] [CrossRef]
- Zhang, J.; Liu, H.; Zhao, P.; Zhou, H.; Mao, T. Has_circ_0055625 from circRNA profile increases colon cancer cell growth by sponging miR-106b-5p. J. Cell. Biochem. 2019, 120, 3027–3037. [Google Scholar] [CrossRef]
- Lu, X.; Yu, Y.; Liao, F.; Tan, S. Homo Sapiens Circular RNA 0079993 (hsa_circ_0079993) of the POLR2J4 Gene Acts as an Oncogene in Colorectal Cancer Through the microRNA-203a-3p.1 and CREB1 Axis. Med. Sci. Monit. 2019, 25, 6872–6883. [Google Scholar] [CrossRef]
- Miao, X.; Xi, Z.; Zhang, Y.; Li, Z.; Huang, L.; Xin, T.; Shen, R.; Wang, T. Circ-SMARCA5 suppresses colorectal cancer progression via downregulating miR-39-3p and upregulating ARID4B. Dig. Liver Dis. 2020, 52, 1494–1502. [Google Scholar] [CrossRef] [PubMed]
- Han, P.; Li, J.-W.; Zhang, B.-M.; Lv, J.-C.; Li, Y.-M.; Gu, X.-Y.; Yu, Z.-W.; Jia, Y.-H.; Bai, X.-F.; Li, L.; et al. The lncRNA CRNDE promotes colorectal cancer cell proliferation and chemoresistance via miR-181a-5p-mediated regulation of Wnt/β-catenin signaling. Mol. Cancer 2017, 16, 1–13. [Google Scholar] [CrossRef]
- Zhou, T.; Wu, L.; Ma, N.; Tang, F.; Yu, Z.; Jiang, Z.; Li, Y.; Zong, Z.; Hu, K. SOX9-activated FARSA-AS1 predetermines cell growth, stemness, and metastasis in colorectal cancer through upregulating FARSA and SOX. Cell Death Dis. 2020, 11, 1071. [Google Scholar] [CrossRef] [PubMed]
- Shen, B.; Yuan, Y.; Zhang, Y.; Yu, S.; Peng, W.; Huang, X.; Feng, J. Long non-coding RNA FBXL19-AS1 plays oncogenic role in colorectal cancer by sponging miR-203. Biochem. Biophys. Res. Commun. 2017, 488, 67–73. [Google Scholar] [CrossRef]
- Xu, Y.; Qiu, A.; Peng, F.; Tan, X.; Wang, J.; Gong, X. Exosomal transfer of circular RNA FBXW7 ameliorates the chemoresistance to oxaliplatin in colorectal cancer by sponging miR-18b-5p. Neoplasma 2021, 68, 108–118. [Google Scholar] [CrossRef] [PubMed]
- Yin, S.L.; Xiao, F.; Liu, Y.F.; Chen, H.; Guo, G.C. Long non-coding RNA FENDRR restrains the aggressiveness of CRC via regulating miR-18a-5p/ING4 axis. J. Cell. Biochem. 2019, 121, 3973–3985. [Google Scholar] [CrossRef] [PubMed]
- Zhang, M.; Jiang, X.; Jiang, S.; Guo, Z.; Zhou, Q.; He, J. LncRNA FOXD2-AS1 Regulates miR-25-3p/Sema4c Axis To Promote The Invasion And Migration Of Colorectal Cancer Cells. Cancer Manag. Res. 2019, 11, 10633–10639. [Google Scholar] [CrossRef] [PubMed]
- Cheng, K.; Zhao, Z.; Wang, G.; Wang, J.; Zhu, W. lncRNA GAS5 inhibits colorectal cancer cell proliferation via the miR-182-5p/FOXO3a axis. Oncol. Rep. 2018, 40, 2371–2380. [Google Scholar] [CrossRef] [PubMed]
- Ren, J.; Ding, L.; Zhang, D.; Shi, G.; Xu, Q.; Shen, S.; Wang, Y.; Wang, T.; Hou, Y. Carcinoma-associated fibroblasts promote the stemness and chemoresistance of colorectal cancer by transferring exosomal lncRNA H. Theranostics 2018, 8, 3932–3948. [Google Scholar] [CrossRef]
- Ding, D.; Li, C.; Zhao, T.; Li, D.; Yang, L.; Zhang, B. LncRNA H19/miR-29b-3p/PGRN Axis Promoted Epithelial-Mesenchymal Transition of Colorectal Cancer Cells by Acting on Wnt Signaling. Mol. Cells 2018, 41, 423–435. [Google Scholar]
- Jiang, Z.; Li, L.; Hou, Z.; Liu, W.; Wang, H.; Zhou, T.; Li, Y.; Chen, S. LncRNA HAND2-AS1 inhibits 5-fluorouracil resistance by modulating miR-20a/PDCD4 axis in colorectal cancer. Cell. Signal. 2020, 66, 109483. [Google Scholar] [CrossRef]
- Liu, Y.; Chen, X.; Chen, X.; Liu, J.; Gu, H.; Fan, R.; Ge, H. Long non-coding RNA HOTAIR knockdown enhances radiosensitivity through regulating microRNA-93/ATG12 axis in colorectal cancer. Cell Death Dis. 2020, 11, 1–14. [Google Scholar] [CrossRef]
- Xiao, Z.; Qu, Z.; Chen, Z.; Fang, Z.; Zhou, K.; Huang, Z.; Guo, X.; Zhang, Y. LncRNA HOTAIR is a Prognostic Biomarker for the Proliferation and Chemoresistance of Colorectal Cancer via MiR-203a-3p-Mediated Wnt/ß-Catenin Signaling Pathway. Cell. Physiol. Biochem. 2018, 46, 1275–1285. [Google Scholar] [CrossRef] [PubMed]
- Ren, T.; Hou, J.; Liu, C.; Shan, F.; Xiong, X.; Qin, A.; Chen, J.; Ren, W. The long non-coding RNA HOTAIRM1 suppresses cell progression via sponging endogenous miR-17-5p/ B-cell translocation gene 3 (BTG3) axis in 5-fluorouracil resistant colorectal cancer cells. Biomed. Pharmacother. 2019, 117, 109171. [Google Scholar] [CrossRef]
- Liu, K.; Yao, H.; Wen, Y.; Zhao, H.; Zhou, N.; Lei, S.; Xiong, L. Functional role of a long non-coding RNA LIFR-AS1/miR-29a/TNFAIP3 axis in colorectal cancer resistance to pohotodynamic therapy. Biochim. Biophys. Acta Mol. Basis Dis. 2018, 1864, 2871–2880. [Google Scholar] [CrossRef]
- Zhan, J.; Tong, J.; Fu, Q. Long non-coding RNA LINC00858 promotes TP53-wild-type colorectal cancer progression by regulating the microRNA-25-3p/SMAD7 axis. Oncol. Rep. 2020, 43, 1267–1277. [Google Scholar] [CrossRef]
- Yu, X.; Mi, L.; Dong, J.; Zou, J. Long intergenic non-protein-coding RNA 1567 (LINC01567) acts as a “sponge” against microRNA-93 in regulating the proliferation and tumorigenesis of human colon cancer stem cells. BMC Cancer 2017, 17, 716. [Google Scholar] [CrossRef]
- Yang, Z.; An, Y.; Wang, N.; Dong, X.; Kang, H. LINC02595 promotes tumor progression in colorectal cancer by inhibiting miR-203b-3p activity and facilitating BCL2L1 expression. J. Cell. Physiol. 2020, 235, 7449–7464. [Google Scholar] [CrossRef]
- Xie, J.J.; Li, W.H.; Li, X.; Ye, W.; Shao, C.F. LncRNA MALAT1 promotes colorectal cancer development by sponging miR-363-3p to regulate EZH2 expression. J. Boil. Regul. Homeost. Agents 2019, 33, 331–343. [Google Scholar]
- Zhuang, M.; Zhao, S.; Jiang, Z.; Wang, S.; Sun, P.; Quan, J.; Yan, D.; Wang, X. MALAT1 sponges miR-106b-5p to promote the invasion and metastasis of colorectal cancer via SLAIN2 enhanced microtubules mobility. EBioMedicine 2019, 41, 286–298. [Google Scholar] [CrossRef] [PubMed]
- Tang, D.; Yang, Z.; Long, F.; Luo, L.; Yang, B.; Zhu, R.; Sang, X.; Cao, G. Inhibition of MALAT1 reduces tumor growth and metastasis and promotes drug sensitivity in colorectal cancer. Cell. Signal. 2019, 57, 21–28. [Google Scholar] [CrossRef] [PubMed]
- Wang, H.; Li, H.; Zhang, L.; Yang, D. Overexpression of MEG3 sensitizes colorectal cancer cells to oxaliplatin through regulation of miR-141/PDCD4 axis. Biomed. Pharmacother. 2018, 106, 1607–1615. [Google Scholar] [CrossRef] [PubMed]
- Zhao, L.; Liu, C.; Yan, S.; Hu, G.; Xiang, K.; Xiang, H.; Yu, H. LINC00657 promotes colorectal cancer stem-like cell invasion by functioning as a miR-203a sponge. Biochem. Biophys. Res. Commun. 2020, 529, 500–506. [Google Scholar] [CrossRef] [PubMed]
- Sun, X.; Bai, Y.; Yang, C.; Hu, S.; Hou, Z.; Wang, G. RETRACTED ARTICLE: Long noncoding RNA SNHG15 enhances the development of colorectal carcinoma via functioning as a ceRNA through miR-141/SIRT1/Wnt/β-catenin axis. Artif. Cells Nanomed. Biotechnol. 2019, 47, 2536–2544. [Google Scholar] [CrossRef] [PubMed]
- Horita, K.; Kurosaki, H.; Nakatake, M.; Ito, M.; Kono, H.; Nakamura, T. Long noncoding RNA UCA1 enhances sensitivity to oncolytic vaccinia virus by sponging miR-18a/miR-182 and modulating the Cdc42/filopodia axis in colorectal cancer. Biochem. Biophys. Res. Commun. 2019, 516, 831–838. [Google Scholar] [CrossRef]
- Zhou, F.; Shen, F.; Zheng, Z.; Ruan, J. The LncRNA XIRP2-AS1 predicts favorable prognosis in colon cancer. OncoTargets Ther. 2019, 12, 5767–5778. [Google Scholar] [CrossRef]
- Yang, L.; Cao, M.; Zhang, J.; Li, X.; Sun, Q. LncRNA XIST modulates HIF-1A/AXL signaling pathway by inhibiting miR-93-5p in colorectal cancer. Mol. Genet. Genom. Med. 2020, 8, e1112. [Google Scholar] [CrossRef]
- Lv, S.-Y.; Shan, T.-D.; Pan, X.-T.; Tian, Z.-B.; Liu, X.-S.; Liu, F.-G.; Sun, X.-G.; Xue, H.-G.; Li, X.-H.; Han, Y.; et al. The lncRNA ZEB1-AS1 sponges miR-181a-5p to promote colorectal cancer cell proliferation by regulating Wnt/β-catenin signaling. Cell Cycle 2018, 17, 1245–1254. [Google Scholar] [CrossRef] [PubMed]
- Glažar, P.; Papavasileiou, P.; Rajewsky, N. circBase: A database for circular RNAs. RNA 2014, 20, 1666–1670. [Google Scholar] [CrossRef]
- Shin, C.; Nam, J.-W.; Farh, K.K.-H.; Chiang, H.R.; Shkumatava, A.; Bartel, D.P. Expanding the MicroRNA Targeting Code: Functional Sites with Centered Pairing. Mol. Cell 2010, 38, 789–802. [Google Scholar] [CrossRef] [PubMed]
- Jeong, G.; Lim, Y.-H.; Kim, N.J.; Wee, G.; Kim, Y.K. Knockout of miR-221 and miR-222 reveals common and specific targets for paralogous miRNAs. RNA Biol. 2017, 14, 197–205. [Google Scholar] [CrossRef] [PubMed]
- Guo, L.; Zhao, Y.; Zhang, H.; Yang, S.; Chen, F. Integrated evolutionary analysis of human miRNA gene clusters and families implicates evolutionary relationships. Gene 2014, 534, 24–32. [Google Scholar] [CrossRef] [PubMed]
- Agarwal, V.; Bell, G.W.; Nam, J.-W.; Bartel, D.P. Predicting effective microRNA target sites in mammalian mRNAs. eLife 2015, 4, e05005. [Google Scholar] [CrossRef]
- Osumi, H.; Shinozaki, E.; Yamaguchi, K.; Zembutsu, H. Clinical utility of circulating tumor DNA for colorectal cancer. Cancer Sci. 2019, 110, 1148–1155. [Google Scholar] [CrossRef]
- Jurj, A.; Zanoaga, O.; Braicu, C.; Lazar, V.; Tomuleasa, C.; Irimie, A.; Berindan-Neagoe, I. A Comprehensive Picture of Extracellular Vesicles and Their Contents. Molecular Transfer to Cancer Cells. Cancers 2020, 12, 298. [Google Scholar] [CrossRef]
- Dai, J.; Su, Y.; Zhong, S.; Cong, L.; Liu, B.; Yang, J.; Tao, Y.; He, Z.; Chen, C.; Jiang, Y. Exosomes: Key players in cancer and potential therapeutic strategy. Signal. Transduct. Target. Ther. 2020, 5, 145. [Google Scholar] [CrossRef]
- Arroyo, J.D.; Chevillet, J.; Kroh, E.M.; Ruf, I.K.; Pritchard, C.C.; Gibson, D.F.; Mitchell, P.; Bennett, C.F.; Pogosova-Agadjanyan, E.L.; Stirewalt, D.L.; et al. Argonaute2 complexes carry a population of circulating microRNAs independent of vesicles in human plasma. Proc. Natl. Acad. Sci. USA 2011, 108, 5003–5008. [Google Scholar] [CrossRef]
- Pritchard, C.C.; Kroh, E.; Wood, B.; Arroyo, J.D.; Dougherty, K.J.; Miyaji, M.M.; Tait, J.F.; Tewari, M. Blood Cell Origin of Circulating MicroRNAs: A Cautionary Note for Cancer Biomarker Studies. Cancer Prev. Res. 2012, 5, 492–497. [Google Scholar] [CrossRef] [PubMed]
- Tai, Y.; Chen, K.; Hsieh, J.; Shen, T. Exosomes in cancer development and clinical applications. Cancer Sci. 2018, 109, 2364–2374. [Google Scholar] [CrossRef] [PubMed]
- Jaiswal, R.; Sedger, L.M. Intercellular Vesicular Transfer by Exosomes, Microparticles and Oncosomes—Implications for Cancer Biology and Treatments. Front. Oncol. 2019, 9, 125. [Google Scholar] [CrossRef] [PubMed]
- Baj-Krzyworzeka, M.; Mytar, B.; Szatanek, R.; Surmiak, M.; Węglarczyk, K.; Baran, J.; Siedlar, M. Colorectal cancer-derived microvesicles modulate differentiation of human monocytes to macrophages. J. Transl. Med. 2016, 14, 1–15. [Google Scholar] [CrossRef]
- Yue, B.; Sun, B.; Liu, C.; Zhao, S.; Zhang, D.; Yu, F.; Yan, D. Long non-coding RNA Fer-1-like protein 4 suppresses oncogenesis and exhibits prognostic value by associating with miR-106a-5p in colon cancer. Cancer Sci. 2015, 106, 1323–1332. [Google Scholar] [CrossRef]
- Ng, E.K.-O.; Chong, W.W.S.; Jin, H.; Lam, E.K.Y.; Shin, V.Y.; Yu, J.; Poon, T.C.W.; Ng, S.S.M.; Sung, J.J.Y. Differential expression of microRNAs in plasma of patients with colorectal cancer: A potential marker for colorectal cancer screening. Gut 2009, 58, 1375–1381. [Google Scholar] [CrossRef]
- Pesta, M.; Kucera, R.; Topolcan, O.; Karlikova, M.; Houfkova, K.; Polivka, J.; Macanova, T.; Machova, I.; Slouka, D.; Kulda, V. Plasma microRNA Levels Combined with CEA and CA19-9 in the Follow-Up of Colorectal Cancer Patients. Cancers 2019, 11, 864. [Google Scholar] [CrossRef] [PubMed]
- Huang, Z.; Huang, D.; Ni, S.; Peng, Z.; Sheng, W.; Du, X. Plasma microRNAs are promising novel biomarkers for early detection of colorectal cancer. Int. J. Cancer 2009, 127, 118–126. [Google Scholar] [CrossRef]
- Perilli, L.; Vicentini, C.; Agostini, M.; Pizzini, S.; Pizzi, M.; D’Angelo, E.; Bortoluzzi, S.; Mandruzzato, S.; Mammano, E.; Rugge, M.; et al. Circulating miR-182 is a biomarker of colorectal adenocarcinoma progression. Oncotarget 2014, 5, 6611–6619. [Google Scholar] [CrossRef] [PubMed]
- Li, L.; Guo, Y.; Chen, Y.; Wang, J.; Zhen, L.; Guo, X.; Liu, J.; Jing, C. The Diagnostic Efficacy and Biological Effects of microRNA-29b for Colon Cancer. Technol. Cancer Res. Treat. 2016, 15, 772–779. [Google Scholar] [CrossRef]
- Ogata-Kawata, H.; Izumiya, M.; Kurioka, D.; Honma, Y.; Yamada, Y.; Furuta, K.; Gunji, T.; Ohta, H.; Okamoto, H.; Sonoda, H.; et al. Circulating Exosomal microRNAs as Biomarkers of Colon Cancer. PLoS ONE 2014, 9, e92921. [Google Scholar] [CrossRef] [PubMed]
- Ostenfeld, M.S.; Jensen, S.G.; Jeppesen, D.; Christensen, L.-L.; Thorsen, S.B.; Stenvang, J.; Hvam, M.L.; Thomsen, A.; Mouritzen, P.; Rasmussen, M.; et al. miRNA profiling of circulating EpCAM+extracellular vesicles: Promising biomarkers of colorectal cancer. J. Extracell. Vesicles 2016, 5, 31488. [Google Scholar] [CrossRef] [PubMed]
- Li, J.; Liu, Y.; Wang, C.; Deng, T.; Liang, H.; Wang, Y.; Huang, D.; Fan, Q.; Wang, X.; Ning, T.; et al. Serum miRNA expression profile as a prognostic biomarker of stage II/III colorectal adenocarcinoma. Sci. Rep. 2015, 5, 12921. [Google Scholar] [CrossRef]
- Li, X.; Zhang, X.; Zhang, Q.; Lin, R. miR-182 contributes to cell proliferation, invasion and tumor growth in colorectal cancer by targeting DAB2IP. Int. J. Biochem. Cell Biol. 2019, 111, 27–36. [Google Scholar] [CrossRef] [PubMed]
- Nikolouzakis, T.K.; Vassilopoulou, L.; Fragkiadaki, P.; Sapsakos, T.M.; Papadakis, G.Z.; Spandidos, D.; Tsatsakis, A.; Tsiaoussis, J. Improving diagnosis, prognosis and prediction by using biomarkers in CRC patients (Review). Oncol. Rep. 2018, 39, 2455–2472. [Google Scholar] [CrossRef]
- Ahmed, F.E.; Ahmed, N.C.; Vos, P.W.; Bonnerup, C.; Atkins, J.N.; Casey, M.; Nuovo, G.J.; Naziri, W.; Wiley, J.E.; Mota, H.; et al. Diagnostic microRNA markers to screen for sporadic human colon cancer in stool: I. Proof of principle. Cancer Genom. Proteom. 2013, 10, 93–113. [Google Scholar]
- Aghabozorgi, A.S.; Sarabi, M.M.; Jafarzadeh-Esfehani, R.; Koochakkhani, S.; Hassanzadeh, M.; Kavousipour, S.; Eftekhar, E. Molecular determinants of response to 5-fluorouracil-based chemotherapy in colorectal cancer: The undisputable role of micro-ribonucleic acids. World J. Gastrointest. Oncol. 2020, 12, 942–956. [Google Scholar] [CrossRef]
- Loktionov, A. Biomarkers for detecting colorectal cancer non-invasively: DNA, RNA or proteins? World J. Gastrointest. Oncol. 2020, 12, 124–148. [Google Scholar] [CrossRef]
- Gonzalez-Pons, M.; Cruz-Correa, M. Colorectal Cancer Biomarkers: Where Are We Now? BioMed Res. Int. 2015, 2015, 1–14. [Google Scholar] [CrossRef]
- Yau, T.O.; Tang, C.-M.; Harriss, E.K.; Dickins, B.; Polytarchou, C. Faecal microRNAs as a non-invasive tool in the diagnosis of colonic adenomas and colorectal cancer: A meta-analysis. Sci. Rep. 2019, 9, 1–13. [Google Scholar] [CrossRef]
- Ahlquist, D.A.; Harrington, J.J.; Burgart, L.J.; Roche, P.C. Morphometric analysis of the “mucocellular layer” overlying colorectal cancer and normal mucosa: Relevance to exfoliation and stool screening. Hum. Pathol. 2000, 31, 51–57. [Google Scholar] [CrossRef]
- Yamazaki, N.; Koga, Y.; Yamamoto, S.; Kakugawa, Y.; Otake, Y.; Hayashi, R.; Saito, N.; Matsumura, Y. Application of the Fecal MicroRNA Test to the Residuum from the Fecal Occult Blood Test. Jpn. J. Clin. Oncol. 2013, 43, 726–733. [Google Scholar] [CrossRef] [PubMed]
- Rotelli, M.T.; Di Lena, M.; Cavallini, A.; Lippolis, C.; Bonfrate, L.; Chetta, N.; Portincasa, P.; Altomare, D.F. Fecal microRNA profile in patients with colorectal carcinoma before and after curative surgery. Int. J. Color. Dis. 2015, 30, 891–898. [Google Scholar] [CrossRef]
- Koga, Y.; Yasunaga, M.; Takahashi, A.; Kuroda, J.; Moriya, Y.; Akasu, T.; Fujita, S.; Yamamoto, S.; Baba, H.; Matsumura, Y. MicroRNA Expression Profiling of Exfoliated Colonocytes Isolated from Feces for Colorectal Cancer Screening. Cancer Prev. Res. 2010, 3, 1435–1442. [Google Scholar] [CrossRef] [PubMed]
- Choi, H.H.; Cho, Y.-S.; Choi, J.H.; Kim, H.-K.; Kim, S.S.; Chae, H.-S. Stool-Based miR-92a and miR-144* as Noninvasive Biomarkers for Colorectal Cancer Screening. Oncology 2019, 97, 173–179. [Google Scholar] [CrossRef]
- Yau, T.O.; Wu, C.W.; Dong, Y.; Tang, C.-M.; Ng, S.S.M.; Chan, F.K.; Sung, J.J.Y.; Yu, J. microRNA-221 and microRNA-18a identification in stool as potential biomarkers for the non-invasive diagnosis of colorectal carcinoma. Br. J. Cancer 2014, 111, 1765–1771. [Google Scholar] [CrossRef]
- Zhu, Y.; Xu, A.; Li, J.; Fu, J.; Wang, G.; Yang, Y.; Cui, L.; Sun, J. Fecal miR-29a and miR-224 as the noninvasive biomarkers for colorectal cancer. Cancer Biomark. 2016, 16, 259–264. [Google Scholar] [CrossRef]
- Duran-Sanchon, S.; Moreno, L.; Augé, J.M.; Serra-Burriel, M.; Cuatrecasas, M.; Moreira, L.; Martín, A.; Serradesanferm, A.; Pozo, À.; Costa, R.; et al. Identification and Validation of MicroRNA Profiles in Fecal Samples for Detection of Colorectal Cancer. Gastroenterology 2020, 158, 947–957.e4. [Google Scholar] [CrossRef]
- Rapado-González, Ó.; Majem, B.; Álvarez-Castro, A.; Díaz-Peña, R.; Abalo, A.; Suárez-Cabrera, L.; Gil-Moreno, A.; Santamaría, A.; López-López, R.; Muinelo-Romay, L.; et al. A Novel Saliva-Based miRNA Signature for Colorectal Cancer Diagnosis. J. Clin. Med. 2019, 8, 2029. [Google Scholar] [CrossRef]
- Pita-Fernández, S.; González-Sáez, L.; López-Calviño, B.; Seoane-Pillado, T.; Rodríguez-Camacho, E.; Pazos-Sierra, A.; González-Santamaría, P.; Pértega-Díaz, S. Effect of diagnostic delay on survival in patients with colorectal cancer: A retrospective cohort study. BMC Cancer 2016, 16, 1–11. [Google Scholar] [CrossRef]
- Song, M.; Emilsson, L.; Bozorg, S.R.; Nguyen, L.H.; Joshi, A.D.; Staller, K.; Nayor, J.; Chan, A.T.; Ludvigsson, J.F. Risk of colorectal cancer incidence and mortality after polypectomy: A Swedish record-linkage study. Lancet Gastroenterol. Hepatol. 2020, 5, 537–547. [Google Scholar] [CrossRef]
- Hamzehzadeh, L.; Yousefi, M.; Ghaffari, S.-H. Colorectal Cancer Screening: A Comprehensive Review to Recent Non-Invasive Methods. Int. J. Hematol. Stem Cell Res. 2017, 11, 250–261. [Google Scholar]
- Vychytilova-Faltejskova, P.; Radova, L.; Sachlova, M.; Kosarova, Z.; Slaba, K.; Fabian, P.; Grolich, T.; Prochazka, V.; Kala, Z.; Svoboda, M.; et al. Serum-based microRNA signatures in early diagnosis and prognosis prediction of colon cancer. Carcinogenesis 2016, 37, 941–950. [Google Scholar] [CrossRef] [PubMed]
- Luo, H.; Shen, K.; Li, B.; Li, R.; Wang, Z.; Xie, Z. Clinical significance and diagnostic value of serum NSE, CEA, CA19-9, CA125 and CA242 levels in colorectal cancer. Oncol. Lett. 2020, 20, 742–750. [Google Scholar] [CrossRef]
- Jelski, W.; Mroczko, B. Biochemical Markers of Colorectal Cancer—Present and Future. Cancer Manag. Res. 2020, 12, 4789–4797. [Google Scholar] [CrossRef]
- Mitchell, P.S.; Parkin, R.K.; Kroh, E.M.; Fritz, B.R.; Wyman, S.K.; Pogosova-Agadjanyan, E.L.; Peterson, A.; Noteboom, J.; O’Briant, K.C.; Allen, A.; et al. Circulating microRNAs as stable blood-based markers for cancer detection. Proc. Natl. Acad. Sci. USA 2008, 105, 10513–10518. [Google Scholar] [CrossRef]
- Köberle, V.; Pleli, T.; Schmithals, C.; Alonso, E.A.; Haupenthal, J.; Bonig, H.; Peveling-Oberhag, J.; Biondi, R.M.; Zeuzem, S.; Kronenberger, B.; et al. Differential Stability of Cell-Free Circulating microRNAs: Implications for Their Utilization as Biomarkers. PLoS ONE 2013, 8, e75184. [Google Scholar] [CrossRef]
- Liu, H.; Liu, T.; Wu, H.; Chen, Y.; Tseng, Y.; Yao, C.; Weng, S.; Dong, L.; Shen, X. Serum micro RNA signatures and metabolomics have high diagnostic value in colorectal cancer using two novel methods. Cancer Sci. 2018, 109, 1185–1194. [Google Scholar] [CrossRef]
- Bovell, L.C.; Shanmugam, C.; Putcha, B.D.K.; Katkoori, V.R.; Zhang, B.; Bae, S.; Singh, K.P.; Grizzle, W.E.; Manne, U. The Prognostic Value of MicroRNAs Varies with Patient Race/Ethnicity and Stage of Colorectal Cancer. Clin. Cancer Res. 2013, 19, 3955–3965. [Google Scholar] [CrossRef]
- Hao, H.; Xia, G.; Wang, C.; Zhong, F.; Liu, L.; Zhang, D. miR-106a suppresses tumor cells death in colorectal cancer through targeting ATG. Med. Mol. Morphol. 2016, 50, 76–85. [Google Scholar] [CrossRef]
- Bullock, M.D.; Pickard, K.; Mitter, R.; Sayan, A.E.; Primrose, J.N.; Ivan, C.; Calin, G.A.; Thomas, G.J.; Packham, G.K.; Mirnezami, A.H. Stratifying risk of recurrence in stage II colorectal cancer using deregulated stromal and epithelial microRNAs. Oncotarget 2015, 6, 7262–7279. [Google Scholar] [CrossRef] [PubMed][Green Version]
- Chen, W.-Y.; Zhao, X.-J.; Yu, Z.-F.; Hu, F.-L.; Liu, Y.-P.; Cui, B.-B.; Dong, X.-S.; Zhao, Y.-S. The potential of plasma miRNAs for diagnosis and risk estimation of colorectal cancer. Int. J. Clin. Exp. Pathol. 2015, 8, 7092–7101. [Google Scholar] [PubMed]
- Riordan, A.M.; Thomas, M.K.; Ronnekleiv-Kelly, S.; Warner, T.; Geiger, P.G.; Kennedy, G.D. Utility of micro-ribonucleic acid profile for predicting recurrence of rectal cancer. J. Surg. Res. 2012, 177, 87–92. [Google Scholar] [CrossRef] [PubMed]
- Yamazaki, N.; Koga, Y.; Taniguchi, H.; Kojima, M.; Kanemitsu, Y.; Saito, N.; Matsumura, Y. High expression of miR-181c as a predictive marker of recurrence in stage II colorectal cancer. Oncotarget 2016, 8, 6970–6983. [Google Scholar] [CrossRef]
- Liu, G.-H.; Zhou, Z.-G.; Chen, R.; Wang, M.-J.; Zhou, B.; Li, Y.; Sun, X.-F. Serum miR-21 and miR-92a as biomarkers in the diagnosis and prognosis of colorectal cancer. Tumor Biol. 2013, 34, 2175–2181. [Google Scholar] [CrossRef]
- Ke, T.-W.; Wei, P.-L.; Yeh, K.-T.; Chen, W.T.-L.; Cheng, Y.-W. MiR-92a Promotes Cell Metastasis of Colorectal Cancer Through PTEN-Mediated PI3K/AKT Pathway. Ann. Surg. Oncol. 2014, 22, 2649–2655. [Google Scholar] [CrossRef] [PubMed]
- Wei, Q.-D.; Zheng, W.-B.; Sun, K.; Xue, Q.; Yang, C.-Z.; Li, G.-X. MiR-92a promotes the invasion and migration of colorectal cancer by targeting RECK. Int. J. Clin. Exp. Pathol 2019, 12, 1565–1577. [Google Scholar]
- Brînzan, C.; Aşchie, M.; Cozaru, G.; Dumitru, E.; Mitroi, A. The diagnostic value of miR-92a, -143, and -145 expression levels in patients with colorectal adenocarcinoma from Romania. Medicine 2020, 99, e21895. [Google Scholar] [CrossRef]
- Slattery, M.L.; Mullany, L.E.; Sakoda, L.C.; Wolff, R.K.; Samowitz, W.S.; Herrick, J.S. Dysregulated genes and miRNAs in the apoptosis pathway in colorectal cancer patients. Apoptosis 2018, 23, 237–250. [Google Scholar] [CrossRef]
- Conev, N.; Donev, I.S.; Konsoulova, A.; Chervenkov, T.G.; Kashlov, J.K.; Ivanov, K.D. Serum expression levels of miR-17, miR-21, and miR-92 as potential biomarkers for recurrence after adjuvant chemotherapy in colon cancer patients. Biosci. Trends 2015, 9, 393–401. [Google Scholar] [CrossRef] [PubMed]
- Mullany, L.E.; Herrick, J.S.; Sakoda, L.C.; Samowitz, W.; Stevens, J.R.; Wolff, R.K.; Slattery, M.L. miRNA involvement in cell cycle regulation in colorectal cancer cases. Genes Cancer 2018, 9, 53–65. [Google Scholar] [CrossRef] [PubMed]
- Ulivi, P.; Canale, M.; Passardi, A.; Marisi, G.; Valgiusti, M.; Frassineti, G.L.; Calistri, D.; Amadori, D.; Scarpi, E. Circulating Plasma Levels of miR-20b, miR-29b and miR-155 as Predictors of Bevacizumab Efficacy in Patients with Metastatic Colorectal Cancer. Int. J. Mol. Sci. 2018, 19, 307. [Google Scholar] [CrossRef]
- Dong, J.; Geng, J.; Tan, W. MiR-363-3p suppresses tumor growth and metastasis of colorectal cancer via targeting SphK2. Biomed. Pharmacother. 2018, 105, 922–931. [Google Scholar] [CrossRef] [PubMed]
- Xiao, Z.-G.; Deng, Z.-S.; Zhang, Y.-D.; Huang, Z.-C. Clinical significance of microRNA-93 downregulation in human colon cancer. Eur. J. Gastroenterol. Hepatol. 2013, 25, 296–301. [Google Scholar] [CrossRef]
- Yang, I.-P.; Tsai, H.-L.; Miao, Z.-F.; Huang, C.-W.; Kuo, C.-H.; Wu, J.-Y.; Wang, W.-M.; Juo, S.-H.H.; Wang, J.-Y. Development of a deregulating microRNA panel for the detection of early relapse in postoperative colorectal cancer patients. J. Transl. Med. 2016, 14, 108. [Google Scholar] [CrossRef]
- Chen, Y.; Wang, G.; Lin, B.; Huang, J. MicroRNA-93-5p expression in tumor tissue and its tumor suppressor function via targeting programmed death ligand-1 in colorectal cancer. Cell Biol. Int. 2020, 44, 1224–1236. [Google Scholar] [CrossRef] [PubMed]
- Li, X.; Yang, C.; Wang, X.; Zhang, J.; Zhang, R.; Liu, R. The expression of miR-25 is increased in colorectal cancer and is associated with patient prognosis. Med. Oncol. 2013, 31, 1–6. [Google Scholar] [CrossRef]
- Li, D.; Zhang, T.; Lai, J.; Zhang, J.; Wang, T.; Ling, Y.; He, S.; Hu, Z. MicroRNA-25/ATXN3 interaction regulates human colon cancer cell growth and migration. Mol. Med. Rep. 2019, 19, 4213–4221. [Google Scholar] [CrossRef]
- Ma, Y.; Zhang, P.; Wang, F.; Zhang, H.; Yang, Y.; Shi, C.; Xia, Y.; Peng, J.; Liu, W.; Yang, Z.; et al. Elevated oncofoetal miR-17-5p expression regulates colorectal cancer progression by repressing its target gene P. Nat. Commun. 2012, 3, 1–12. [Google Scholar] [CrossRef]
- Fang, L.; Li, H.; Wang, L.; Hu, J.; Jin, T.; Wang, J.; Yang, B.B. MicroRNA-17-5p promotes chemotherapeutic drug resistance and tumour metastasis of colorectal cancer by repressing PTEN expression. Oncotarget 2014, 5, 2974–2987. [Google Scholar] [CrossRef] [PubMed]
- Huang, C.; Liu, J.; Xu, L.; Hu, W.; Wang, J.; Wang, M.; Yao, X. MicroRNA-17 promotes cell proliferation and migration in human colorectal cancer by downregulating SIK1. Cancer Manag. Res. 2019, 11, 3521–3534. [Google Scholar] [CrossRef] [PubMed]
- Wu, C.-W.; Dong, Y.-J.; Liang, Q.-Y.; He, X.-Q.; Ng, S.S.M.; Chan, F.K.L.; Sung, J.J.Y.; Yu, J. MicroRNA-18a Attenuates DNA Damage Repair through Suppressing the Expression of Ataxia Telangiectasia Mutated in Colorectal Cancer. PLoS ONE 2013, 8, e57036. [Google Scholar] [CrossRef] [PubMed]
- Matsumura, T.; Sugimachi, K.; Iinuma, H.; Takahashi, Y.; Kurashige, J.; Sawada, G.; Ueda, M.; Uchi, R.; Ueo, H.; Takano, Y.; et al. Exosomal microRNA in serum is a novel biomarker of recurrence in human colorectal cancer. Br. J. Cancer 2015, 113, 275–281. [Google Scholar] [CrossRef] [PubMed]
- Zhang, G.-J.; Li, Y.; Zhou, H.; Xiao, H.-X.; Zhou, T. miR-20a is an independent prognostic factor in colorectal cancer and is involved in cell metastasis. Mol. Med. Rep. 2014, 10, 283–291. [Google Scholar] [CrossRef] [PubMed]
- Kahlert, C.; Klupp, F.; Brand, K.; Lasitschka, F.; Diederichs, S.; Kirchberg, J.; Rahbari, N.; Dutta, S.; Bork, U.; Fritzmann, J.; et al. Invasion front-specific expression and prognostic significance of microRNA in colorectal liver metastases. Cancer Sci. 2011, 102, 1799–1807. [Google Scholar] [CrossRef]
- Cruz-Gil, S.; Sanchez-Martinez, R.; de Cedron, M.G.; Martin-Hernandez, R.; Vargas, T.; Molina, S.; Herranz, J.; Davalos, A.; Reglero, G.; de Molina, A.R. Targeting the lipid metabolic axis ACSL/SCD in colorectal cancer progression by therapeutic miRNAs: miR-19b-1 role. J. Lipid Res. 2018, 59, 14–24. [Google Scholar] [CrossRef]
- Xu, M.; Kuang, Y.; Wang, M.; Han, X.; Yang, Q. A microRNA expression signature as a predictor of survival for colon adenocarcinoma. Neoplasma 2017, 64, 56–64. [Google Scholar] [CrossRef] [PubMed]
- Li, Z.; Wang, H.; Xu, Z.; Sun, Y.; Han, J. Expression and mechanism of microRNA-181A on incidence and survival in late liver metastases of colorectal cancer. Oncol. Rep. 2016, 35, 1403–1408. [Google Scholar] [CrossRef]
- Ji, D.; Chen, Z.; Li, M.; Zhan, T.; Yao, Y.; Zhang, Z.; Xi, J.; Yan, L.; Gu, J. MicroRNA-181a promotes tumor growth and liver metastasis in colorectal cancer by targeting the tumor suppressor WIF-1. Mol. Cancer 2014, 13, 86. [Google Scholar] [CrossRef]
- Huang, L.; Wen, C.; Yang, X.; Lou, Q.; Wang, X.; Che, J.; Chen, J.; Yang, Z.; Wu, X.; Huang, M.; et al. PEAK1, acting as a tumor promoter in colorectal cancer, is regulated by the EGFR/KRas signaling axis and miR-181d. Cell Death Dis. 2018, 9, 1–12. [Google Scholar] [CrossRef] [PubMed]
- Zhou, T.; Zhang, G.-J.; Zhou, H.; Xiao, H.-X.; Li, Y. Overexpression of microRNA-183 in human colorectal cancer and its clinical significance. Eur. J. Gastroenterol. Hepatol. 2014, 26, 229–233. [Google Scholar] [CrossRef]
- Chen, Y.; Song, W. Wnt/catenin β1/microRNA 183 predicts recurrence and prognosis of patients with colorectal cancer. Oncol. Lett. 2018, 15, 4451–4456. [Google Scholar] [CrossRef] [PubMed]
- Zheng, S.; Zhong, Y.-F.; Tan, D.-M.; Xu, Y.; Chen, H.-X.; Wang, D. miR-183-5p enhances the radioresistance of colorectal cancer by directly targeting ATG5. J. Bioscience 2019, 44, 92. [Google Scholar] [CrossRef]
- Rapti, S.-M.; Kontos, C.; Papadopoulos, I.N.; Scorilas, A. High miR-96 levels in colorectal adenocarcinoma predict poor prognosis, particularly in patients without distant metastasis at the time of initial diagnosis. Tumor Biol. 2016, 37, 11815–11824. [Google Scholar] [CrossRef] [PubMed]
- Sun, Y.; Liu, Y.; Cogdell, D.; Calin, G.A.; Sun, B.; Kopetz, S.; Hamilton, S.R.; Zhang, W. Examining plasma microRNA markers for colorectal cancer at different stages. Oncotarget 2016, 7, 11434–11449. [Google Scholar] [CrossRef]
- Ress, A.L.; Stiegelbauer, V.; Winter, E.; Schwarzenbacher, D.; Kiesslich, T.; Lax, S.; Jahn, S.; Deutsch, A.; Bauernhofer, T.; Ling, H.; et al. MiR-96-5p influences cellular growth and is associated with poor survival in colorectal cancer patients. Mol. Carcinog. 2015, 54, 1442–1450. [Google Scholar] [CrossRef]
- Wang, S.; Yang, M.H.; Wang, X.Y.; Lin, J.; Ding, Y.Q. Increased expression of miRNA-182 in colorectal carcinoma: An independent and tissue-speciic prognostic factor. Int. J. Clin. Exp. Pathol. 2014, 7, 3498–3503. [Google Scholar]
- Liu, H.; Du, L.; Wen, Z.; Yang, Y.; Li, J.; Wang, L.; Zhang, X.; Liu, Y.; Dong, Z.; Li, W.; et al. Up-regulation of miR-182 expression in colorectal cancer tissues and its prognostic value. Int. J. Color. Dis. 2013, 28, 697–703. [Google Scholar] [CrossRef]
- Chen, X.-Y.; Zhang, J.; Hou, L.-D.; Zhang, R.; Chen, W.; Fan, H.-N.; Huang, Y.-X.; Liu, H.; Zhu, J.-S. Upregulation of PD-L1 predicts poor prognosis and is associated with miR-191-5p dysregulation in colon adenocarcinoma. Int. J. Immunopathol. Pharmacol. 2018, 32, 1–15. [Google Scholar] [CrossRef]
- Xi, Y.; Formentini, A.; Chien, M.; Weir, D.B.; Russo, J.J.; Ju, J.; Kornmann, M.; Ju, J. Prognostic Values of microRNAs in Colorectal Cancer. Biomark. Insights 2006, 1, 113–121. [Google Scholar] [CrossRef]
- Roh, M.S.; Lee, H.W.; Jung, S.B.; Kim, K.; Lee, E.H.; Park, M.-I.; Lee, J.S.; Kim, M.-S. Expression of miR-200c and its clinicopathological significance in patients with colorectal cancer. Pathol. Res. Pr. 2018, 214, 350–355. [Google Scholar] [CrossRef]
- Toiyama, Y.; Hur, K.; Tanaka, K.; Inoue, Y.; Kusunoki, M.; Boland, C.R.; Goel, A. Serum miR-200c Is a Novel Prognostic and Metastasis-Predictive Biomarker in Patients with Colorectal Cancer. Ann. Surg. 2014, 259, 735–743. [Google Scholar] [CrossRef]
- Santasusagna, S.; Moreno, I.; Navarro, A.; Rodenas, F.M.; Hernández, R.; Castellano, J.J.; Muñoz, C.; Monzo, M. Prognostic Impact of miR-200 Family Members in Plasma and Exosomes from Tumor-Draining versus Peripheral Veins of Colon Cancer Patients. Oncology 2018, 95, 309–318. [Google Scholar] [CrossRef] [PubMed]
- Tang, R.-Y.; Wang, Z.; Chen, H.-Q.; Zhu, S.-B. Negative Correlation between miR-200c and Decorin Plays an Important Role in the Pathogenesis of Colorectal Carcinoma. BioMed Res. Int. 2017, 2017, 1–8. [Google Scholar] [CrossRef] [PubMed]
- Li, W.; Chang, J.; Tong, D.; Peng, J.; Huang, D.; Guo, W.; Zhang, W.; Li, J. Differential microRNA expression profiling in primary tumors and matched liver metastasis of patients with colorectal cancer. Oncotarget 2017, 8, 35783–35791. [Google Scholar] [CrossRef] [PubMed]
- Diaz, T.; Tejero, R.; Moreno, I.; Ferrer, G.; Cordeiro, A.; Artells, R.; Navarro, A.; Hernandez, R.; Tapia, G.; Monzo, M. Role of miR-200 family members in survival of colorectal cancer patients treated with fluoropyrimidines. J. Surg. Oncol. 2014, 109, 676–683. [Google Scholar] [CrossRef]
- Cheng, H.; Zhang, L.; Cogdell, D.E.; Zheng, H.; Schetter, A.J.; Nykter, M.; Harris, C.C.; Chen, K.; Hamilton, S.R.; Zhang, W. Circulating Plasma MiR-141 Is a Novel Biomarker for Metastatic Colon Cancer and Predicts Poor Prognosis. PLoS ONE 2011, 6, e17745. [Google Scholar] [CrossRef]
- Liang, Z.; Li, X.; Liu, S.; Li, C.; Wang, X.; Xing, J. MiR-141–3p inhibits cell proliferation, migration and invasion by targeting TRAF5 in colorectal cancer. Biochem. Biophys. Res. Commun. 2019, 514, 699–705. [Google Scholar] [CrossRef]
- Takano, Y.; Masuda, T.; Iinuma, H.; Yamaguchi, R.; Sato, K.; Tobo, T.; Hirata, H.; Kuroda, Y.; Nambara, S.; Hayashi, N.; et al. Circulating exosomal microRNA-203 is associated with metastasis possibly via inducing tumor-associated macrophages in colorectal cancer. Oncotarget 2017, 8, 78598–78613. [Google Scholar] [CrossRef]
- Deng, B.; Wang, B.; Fang, J.; Zhu, X.; Cao, Z.; Lin, Q.; Zhou, L.; Sun, X. MiRNA-203 suppresses cell proliferation, migration and invasion in colorectal cancer via targeting of EIF5A. Sci. Rep. 2016, 6, 28301. [Google Scholar] [CrossRef]
- Yuan, K.; Xie, K.; Fox, J.; Zeng, H.; Gao, H.; Huang, C.; Wu, M. Decreased Levels of miR-224 and the Passenger Strand of miR-221 Increase MBD2, Suppressing Maspin and Promoting Colorectal Tumor Growth and Metastasis in Mice. Gastroenterology 2013, 145, 853–864.e9. [Google Scholar] [CrossRef]
- Ba, S.; Xuan, Y.; Long, Z.-W.; Chen, H.-Y.; Zheng, S.-S. MicroRNA-27a Promotes the Proliferation and Invasiveness of Colon Cancer Cells by Targeting SFRP1 through the Wnt/β-Catenin Signaling Pathway. Cell. Physiol. Biochem. 2017, 42, 1920–1933. [Google Scholar] [CrossRef]
- Liang, J.; Tang, J.; Shi, H.; Li, H.; Zhen, T.; Duan, J.; Kang, L.; Zhang, F.; Dong, Y.; Han, A. miR-27a-3p targeting RXRα promotes colorectal cancer progression by activating Wnt/β-catenin pathway. Oncotarget 2017, 8, 82991–83008. [Google Scholar] [CrossRef] [PubMed]
- Liu, X.; Pan, B.; Sun, L.; Chen, X.; Zeng, K.; Hu, X.; Xu, T.; Xu, M.; Wang, S. Circulating Exosomal miR-27a and miR-130a Act as Novel Diagnostic and Prognostic Biomarkers of Colorectal Cancer. Cancer Epidemiol. Biomark. Prev. 2018, 27, 746–754. [Google Scholar] [CrossRef] [PubMed]
- Liu, W.; Qian, K.; Wei, X.; Deng, H.; Zhao, B.; Chen, Q.; Zhang, J.; Liu, H. miR-27a promotes proliferation, migration, and invasion of colorectal cancer by targeting FAM172A and acts as a diagnostic and prognostic biomarker. Oncol. Rep. 2017, 37, 3554–3564. [Google Scholar] [CrossRef] [PubMed]
- Kerimis, D.; Kontos, C.; Christodoulou, S.; Papadopoulos, I.N.; Scorilas, A. Elevated expression of miR-24-3p is a potentially adverse prognostic factor in colorectal adenocarcinoma. Clin. Biochem. 2017, 50, 285–292. [Google Scholar] [CrossRef]
- Gao, Y.; Liu, Y.; Du, L.; Li, J.; Qu, A.; Zhang, X.; Wang, L.; Wang, C. Down-regulation of miR-24-3p in colorectal cancer is associated with malignant behavior. Med. Oncol. 2014, 32, 1–8. [Google Scholar] [CrossRef]
- Inoue, A.; Yamamoto, H.; Uemura, M.; Nishimura, J.; Hata, T.; Takemasa, I.; Ikenaga, M.; Ikeda, M.; Murata, K.; Mizushima, T.; et al. MicroRNA-29b is a Novel Prognostic Marker in Colorectal Cancer. Ann. Surg. Oncol. 2015, 22, 1410–1418. [Google Scholar] [CrossRef]
- Tang, W.; Zhu, Y.; Gao, J.; Fu, J.; Liu, C.; Liu, Y.; Song, C.; Zhu, S.; Leng, Y.; Wang, G.; et al. MicroRNA-29a promotes colorectal cancer metastasis by regulating matrix metalloproteinase 2 and E-cadherin via KLF. Br. J. Cancer 2014, 110, 450–458. [Google Scholar] [CrossRef]
- Kuo, T.-Y.; Hsi, E.; Yang, I.-P.; Tsai, P.-C.; Wang, J.-Y.; Juo, S.-H.H. Computational Analysis of mRNA Expression Profiles Identifies MicroRNA-29a/c as Predictor of Colorectal Cancer Early Recurrence. PLoS ONE 2012, 7, e31587. [Google Scholar] [CrossRef] [PubMed]
- Yuan, Z.; Baker, K.; Redman, M.W.; Wang, L.; Adams, S.V.; Yu, M.; Dickinson, B.; Makar, K.; Ulrich, N.; Böhm, J.; et al. Dynamic plasma microRNAs are biomarkers for prognosis and early detection of recurrence in colorectal cancer. Br. J. Cancer 2017, 117, 1202–1210. [Google Scholar] [CrossRef]
- Aharonov, R.; Weissmann-Brenner, A.; Kushnir, M.; Yanai, G.L.; Gibori, H.; Purim, O.; Kundel, Y.; Morgenstern, S.; Halperin, M.; Niv, Y.; et al. Tumor microRNA-29a expression and the risk of recurrence in stage II colon cancer. Int. J. Oncol. 2012, 40, 2097–2103. [Google Scholar] [CrossRef]
- Colangelo, T.; Fucci, A.; Votino, C.; Sabatino, L.; Pancione, M.; Laudanna, C.; Binaschi, M.; Bigioni, M.; Maggi, C.A.; Parente, D.; et al. MicroRNA-130b Promotes Tumor Development and Is Associated with Poor Prognosis in Colorectal Cancer. Neoplasia 2013, 15, 1086–1099. [Google Scholar] [CrossRef]
- Li, T.; Jian, X.; He, H.; Lai, Q.; Li, X.; Deng, D.; Liu, T.; Zhu, J.; Jiao, H.; Ye, Y.; et al. MiR-452 promotes an aggressive colorectal cancer phenotype by regulating a Wnt/β-catenin positive feedback loop. J. Exp. Clin. Cancer Res. 2018, 37, 238. [Google Scholar] [CrossRef]
- Yan, J.; Wei, R.; Li, H.; Dou, Y.; Wang, J. miR-452-5p and miR-215-5p expression levels in colorectal cancer tissues and their relationship with clinicopathological features. Oncol. Lett. 2020, 20, 2955–2961. [Google Scholar] [CrossRef] [PubMed]
- Adamopoulos, P.G.; Kontos, C.K.; Rapti, S.-M.; Papadopoulos, I.N.; Scorilas, A. miR-224 overexpression is a strong and independent prognosticator of short-term relapse and poor overall survival in colorectal adenocarcinoma. Int. J. Oncol. 2014, 46, 849–859. [Google Scholar] [CrossRef] [PubMed][Green Version]
- Ling, H.; Pickard, K.; Ivan, C.; Isella, C.; Ikuo, M.; Mitter, R.; Spizzo, R.; Bullock, M.D.; Braicu, C.; Pileczki, V.; et al. The clinical and biological significance of MIR-224 expression in colorectal cancer metastasis. Gut 2016, 65, 977–989. [Google Scholar] [CrossRef] [PubMed]
- Conteduca, V.; Sansonno, D.; Russi, S.; Dammacco, F. Precancerous colorectal lesions. Int. J. Oncol. 1943, 43, 973–984. [Google Scholar] [CrossRef] [PubMed]
- Gupta, R.; Sinha, S.; Paul, R.N. The impact of microsatellite stability status in colorectal cancer. Curr. Probl. Cancer 2018, 42, 548–559. [Google Scholar] [CrossRef] [PubMed]
- Gelsomino, F.; Barbolini, M.; Spallanzani, A.; Pugliese, G.; Cascinu, S. The evolving role of microsatellite instability in colorectal cancer: A review. Cancer Treat. Rev. 2016, 51, 19–26. [Google Scholar] [CrossRef]
- Earle, J.S.; Luthra, R.; Romans, A.; Abraham, R.; Ensor, J.; Yao, H.; Hamilton, S.R. Association of MicroRNA Expression with Microsatellite Instability Status in Colorectal Adenocarcinoma. J. Mol. Diagn. 2010, 12, 433–440. [Google Scholar] [CrossRef]
- Blondy, S.; David, V.; Verdier, M.; Mathonnet, M.; Perraud, A.; Christou, N. 5-Fluorouracil resistance mechanisms in colorectal cancer: From classical pathways to promising processes. Cancer Sci. 2020, 111, 3142–3154. [Google Scholar] [CrossRef] [PubMed]
- Longley, D.B.; Harkin, D.P.; Johnston, P.G. 5-Fluorouracil: Mechanisms of action and clinical strategies. Nat. Rev. Cancer 2003, 3, 330–338. [Google Scholar] [CrossRef]
- Martinez-Balibrea, E.; Martínez-Cardús, A.; Ginés, A.; De Porras, V.R.; Moutinho, C.; Layos, L.; Manzano, J.L.; Bugés, C.; Bystrup, S.; Esteller, M.; et al. Tumor-Related Molecular Mechanisms of Oxaliplatin Resistance. Mol. Cancer Ther. 2015, 14, 1767–1776. [Google Scholar] [CrossRef] [PubMed]
- Vaghari-Tabari, M.; Majidinia, M.; Moein, S.; Qujeq, D.; Asemi, Z.; Alemi, F.; Mohamadzadeh, R.; Targhazeh, N.; Safa, A.; Yousefi, B. MicroRNAs and colorectal cancer chemoresistance: New solution for old problem. Life Sci. 2020, 259, 118255. [Google Scholar] [CrossRef]
- Barisciano, G.; Colangelo, T.; Rosato, V.; Muccillo, L.; Taddei, M.L.; Ippolito, L.; Chiarugi, P.; Galgani, M.; Bruzzaniti, S.; Matarese, G.; et al. miR-27a is a master regulator of metabolic reprogramming and chemoresistance in colorectal cancer. Br. J. Cancer 2020, 122, 1354–1366. [Google Scholar] [CrossRef] [PubMed]
- Fu, Q.; Cheng, J.; Zhang, J.; Zhang, Y.; Chen, X.; Luo, S.; Xie, J. miR-20b reduces 5-FU resistance by suppressing the ADAM9/EGFR signaling pathway in colon cancer. Oncol. Rep. 2017, 37, 123–130. [Google Scholar] [CrossRef] [PubMed]
- Liu, J.; Huang, Y.; Wang, H.; Wu, D. MiR-106a-5p promotes 5-FU resistance and the metastasis of colorectal cancer by targeting TGFβR2. Int. J. Clin. Exp. Pathol 2018, 11, 5622–5634. [Google Scholar] [PubMed]
- Zhang, G.-J.; Li, L.-F.; Yang, G.-D.; Xia, S.-S.; Wang, R.; Leng, Z.-W.; Liu, Z.-L.; Tian, H.-P.; He, Y.; Meng, C.-Y.; et al. MiR-92a promotes stem cell-like properties by activating Wnt/β-catenin signaling in colorectal cancer. Oncotarget 2017, 8, 101760–101770. [Google Scholar] [CrossRef]
- Zhang, J.; Zhang, K.; Bi, M.; Jiao, X.; Zhang, D.; Dong, Q. Circulating microRNA expressions in colorectal cancer as predictors of response to chemotherapy. Anti-Cancer Drugs 2014, 25, 346–352. [Google Scholar] [CrossRef]
- Chen, Q.; Xia, H.-W.; Ge, X.-J.; Zhang, Y.-C.; Tang, Q.-L.; Bi, F. Serum miR-19a Predicts Resistance to FOLFOX Chemotherapy in Advanced Colorectal Cancer Cases. Asian Pac. J. Cancer Prev. 2013, 14, 7421–7426. [Google Scholar] [CrossRef]
- Jin, G.; Liu, Y.; Zhang, J.; Bian, Z.; Yao, S.; Fei, B.; Zhou, L.; Yin, Y.; Huang, Z. A panel of serum exosomal microRNAs as predictive markers for chemoresistance in advanced colorectal cancer. Cancer Chemother. Pharmacol. 2019, 84, 315–325. [Google Scholar] [CrossRef]
- Kjersem, J.; Ikdahl, T.; Lingjaerde, O.; Guren, T.; Tveit, K.; Kure, E. Plasma microRNAs predicting clinical outcome in metastatic colorectal cancer patients receiving first-line oxaliplatin-based treatment. Mol. Oncol. 2013, 8, 59–67. [Google Scholar] [CrossRef]
- Shang, J.; Yang, F.; Wang, Y.; Wang, Y.; Xue, G.; Mei, Q.; Wang, F.; Sun, S. MicroRNA-23a Antisense Enhances 5-Fluorouracil Chemosensitivity Through APAF-1/Caspase-9 Apoptotic Pathway in Colorectal Cancer Cells. J. Cell. Biochem. 2014, 115, 772–784. [Google Scholar] [CrossRef]
- Balacescu, O.; Sur, D.; Cainap, C.; Visan, S.; Cruceriu, D.; Manzat-Saplacan, R.; Muresan, M.-S.; Balacescu, L.; Lisencu, C.; Irimie, A. The Impact of miRNA in Colorectal Cancer Progression and Its Liver Metastases. Int. J. Mol. Sci. 2018, 19, 3711. [Google Scholar] [CrossRef]
- Saberinia, A.; Alinezhad, A.; Jafari, F.; Soltany, S.; Sigari, R.A. Oncogenic miRNAs and target therapies in colorectal cancer. Clin. Chim. Acta 2020, 508, 77–91. [Google Scholar] [CrossRef]
- Ding, L.; Lan, Z.; Xiong, X.; Ao, H.; Feng, Y.; Gu, H.; Yu, M.; Cui, Q. The Dual Role of MicroRNAs in Colorectal Cancer Progression. Int. J. Mol. Sci. 2018, 19, 2791. [Google Scholar] [CrossRef]
- Tripathi, S.; Flobak, Å.; Chawla, K.; Baudot, A.; Bruland, T.; Thommesen, L.; Kuiper, M.T.R.; Lægreid, A. The gastrin and cholecystokinin receptors mediated signaling network: A scaffold for data analysis and new hypotheses on regulatory mechanisms. BMC Syst. Biol. 2015, 9, 1–15. [Google Scholar] [CrossRef]
- Gao, F.; Wang, W. MicroRNA-96 promotes the proliferation of colorectal cancer cells and targets tumor protein p53 inducible nuclear protein 1, forkhead box protein O1 (FOXO1) and FOXO3a. Mol. Med. Rep. 2015, 11, 1200–1206. [Google Scholar] [CrossRef]
- Li, T.; Lai, Q.; Wang, S.; Cai, J.; Xiao, Z.; Deng, D.; He, L.; Jiao, H.; Ye, Y.; Liang, L.; et al. MicroRNA-224 sustains Wnt/β-catenin signaling and promotes aggressive phenotype of colorectal cancer. J. Exp. Clin. Cancer Res. 2016, 35, 1–11. [Google Scholar] [CrossRef]
- Tang, Q.; Zou, Z.; Zou, C.; Zhang, Q.; Huang, R.; Guan, X.; Li, Q.; Han, Z.; Wang, D.; Wei, H.; et al. MicroRNA-93 suppress colorectal cancer development via Wnt/β-catenin pathway downregulating. Tumor Biol. 2014, 36, 1701–1710. [Google Scholar] [CrossRef]
- Huang, W.; Tian, Y.; Dong, S.; Cha, Y.; Li, J.; Guo, X.; Yuan, X. The long non-coding RNA SNHG3 functions as a competing endogenous RNA to promote malignant development of colorectal cancer. Oncol. Rep. 2017, 38, 1402–1410. [Google Scholar] [CrossRef]
- Humphreys, K.J.; McKinnon, R.A.; Michael, M.Z. miR-18a Inhibits CDC42 and Plays a Tumour Suppressor Role in Colorectal Cancer Cells. PLoS ONE 2014, 9, e112288. [Google Scholar] [CrossRef]
- Shah, M.S.; Kim, E.; Davidson, L.A.; Knight, J.M.; Zoh, R.S.; Goldsby, J.S.; Callaway, E.S.; Zhou, B.; Ivanov, I.; Chapkin, R.S. Comparative effects of diet and carcinogen on microRNA expression in the stem cell niche of the mouse colonic crypt. Biochim. Biophys. Acta Mol. Basis Dis. 2016, 1862, 121–134. [Google Scholar] [CrossRef][Green Version]
- Zhong, X.; Xiao, Y.; Chen, C.; Wei, X.; Hu, C.; Ling, X.; Liu, X. MicroRNA-203-mediated posttranscriptional deregulation of CPEB4 contributes to colorectal cancer progression. Biochem. Biophys. Res. Commun. 2015, 466, 206–213. [Google Scholar] [CrossRef]
- Jiang, T.; Ye, L.; Han, Z.; Liu, Y.; Yang, Y.; Peng, Z.; Fan, J. miR-19b-3p promotes colon cancer proliferation and oxaliplatin-based chemoresistance by targeting SMAD4: Validation by bioinformatics and experimental analyses. J. Exp. Clin. Cancer Res. 2017, 36, 1–14. [Google Scholar] [CrossRef]
- Dews, M.; Fox, J.L.; Hultine, S.; Sundaram, P.; Wang, W.; Liu, Y.Y.; Furth, E.E.; Enders, G.H.; Eldeiry, W.S.; Schelter, J.M.; et al. The Myc–miR-17∼92 Axis Blunts TGFβ Signaling and Production of Multiple TGFβ-Dependent Antiangiogenic Factors. Cancer Res. 2010, 70, 8233–8246. [Google Scholar] [CrossRef]
- Chen, M.; Lin, M.; Wang, X. Overexpression of miR-19a inhibits colorectal cancer angiogenesis by suppressing KRAS expression. Oncol. Rep. 2017, 39, 619–626. [Google Scholar] [CrossRef]
- Ma, H.; Pan, J.-S.; Jin, L.-X.; Wu, J.; Ren, Y.-D.; Chen, P.; Xiao, C.; Han, J. MicroRNA-17~92 inhibits colorectal cancer progression by targeting angiogenesis. Cancer Lett. 2016, 376, 293–302. [Google Scholar] [CrossRef]
- Farooqi, A.A.; de la Roche, M.; Djamgoz, M.B.; Siddik, Z.H. Overview of the oncogenic signaling pathways in colorectal cancer: Mechanistic insights. Semin. Cancer Biol. 2019, 58, 65–79. [Google Scholar] [CrossRef]
- Zhou, Y.; Wan, G.; Spizzo, R.; Ivan, C.; Mathur, R.; Hu, X.; Ye, X.; Lu, J.; Fan, F.; Xia, L.; et al. miR-203 induces oxaliplatin resistance in colorectal cancer cells by negatively regulating ATM kinase. Mol. Oncol. 2013, 8, 83–92. [Google Scholar] [CrossRef] [PubMed]
- Zhang, X.; Zhang, X.; Liu, C.; Jia, N.; Li, X.; Xiao, J. miR-224 promotes colorectal cancer cells proliferation via downregulation of P21WAF1/CIP1. Mol. Med. Rep. 2014, 9, 941–946. [Google Scholar] [CrossRef] [PubMed][Green Version]
- Zheng, L.; Zhang, Y.; Liu, Y.; Zhou, M.; Lu, Y.; Yuan, L.; Zhang, C.; Hong, M.; Wang, S.; Li, X. MiR-106b induces cell radioresistance via the PTEN/PI3K/AKT pathways and p21 in colorectal cancer. J. Transl. Med. 2015, 13, 1–13. [Google Scholar] [CrossRef] [PubMed]
- Sokolova, V.; Fiorino, A.; Zoni, E.; Crippa, E.; Reid, J.F.; Gariboldi, M.; Pierotti, M.A. The Effects of miR-20a on p21: Two Mechanisms Blocking Growth Arrest in TGF-β-Responsive Colon Carcinoma. J. Cell. Physiol. 2015, 230, 3105–3114. [Google Scholar] [CrossRef]
- Yin, Q.; Wang, P.-P.; Peng, R.; Zhou, H. MiR-19a enhances cell proliferation, migration, and invasiveness through enhancing lymphangiogenesis by targeting thrombospondin-1 in colorectal cancer. Biochem. Cell Biol. 2019, 97, 731–739. [Google Scholar] [CrossRef]
- Amodeo, V.; Bazan, V.; Fanale, D.; Insalaco, L.; Caruso, S.; Cicero, G.; Bronte, G.; Rolfo, C.; Santini, D.; Russo, A. Effects of anti-miR-182 on TSP-1 expression in human colon cancer cells: There is a sense in antisense? Expert Opin. Ther. Targets 2013, 17, 1249–1261. [Google Scholar] [CrossRef]
- Qian, Z.; Gong, L.; Mou, Y.; Han, Y.; Zheng, S. MicroRNA-203a-3p is a candidate tumor suppressor that targets thrombospondin 2 in colorectal carcinoma. Oncol. Rep. 2019, 42, 1825–1832. [Google Scholar] [CrossRef]
- Liu, H.; Cheng, X.-H. MiR-29b reverses oxaliplatin-resistance in colorectal cancer by targeting SIRT1. Oncotarget 2018, 9, 12304–12315. [Google Scholar] [CrossRef]
- Chen, H.; Lu, W.; Huang, C.; Ding, K.; Xia, D.; Wu, Y.; Cai, M. Prognostic significance of ZEB1 and ZEB2 in digestive cancers: A cohort-based analysis and secondary analysis. Oncotarget 2017, 8, 31435–31448. [Google Scholar] [CrossRef]
- Chen, J.; Wang, Y.; Zhuo, L.; Liu, Z.; Liu, T.; Li, W.; Cai, Y.; Zheng, H. Fas signaling induces stemness properties in colorectal cancer by regulation of Bmi1. Mol. Carcinog. 2017, 56, 2267–2278. [Google Scholar] [CrossRef] [PubMed]
- Li, X.L.; Hara, T.; Choi, Y.; Subramanian, M.; Francis, P.; Bilke, S.; Walker, R.L.; Pineda, M.; Zhu, Y.; Yang, Y.; et al. A p21-ZEB1 Complex Inhibits Epithelial-Mesenchymal Transition through the MicroRNA 183-96-182 Cluster. Mol. Cell. Biol. 2014, 34, 533–550. [Google Scholar] [CrossRef] [PubMed]
- Hozhabri, H.; Lashkari, A.; Razavi, S.-M.; Mohammadian, A. Integration of gene expression data identifies key genes and pathways in colorectal cancer. Med. Oncol. 2021, 38, 1–14. [Google Scholar] [CrossRef] [PubMed]
- Mastrogamvraki, N.; Zaravinos, A. Signatures of co-deregulated genes and their transcriptional regulators in colorectal cancer. NPJ Syst. Biol. Appl. 2020, 6, 1–16. [Google Scholar] [CrossRef]
- Kim, H.-Y.; Kim, Y.-M.; Hong, S. Astaxanthin suppresses the metastasis of colon cancer by inhibiting the MYC-mediated downregulation of microRNA-29a-3p and microRNA-200a. Sci. Rep. 2019, 9, 1–10. [Google Scholar] [CrossRef]
- Hu, S.; Liu, L.; Chang, E.B.; Wang, J.-Y.; Raufman, J.-P. Butyrate inhibits pro-proliferative miR-92a by diminishing c-Myc-induced miR-17-92a cluster transcription in human colon cancer cells. Mol. Cancer 2015, 14, 1–15. [Google Scholar] [CrossRef]
- Guo, Y.; Ye, Q.; Deng, P.; Cao, Y.; He, D.; Zhou, Z.; Wang, C.; Zaytseva, Y.Y.; Schwartz, C.E.; Lee, E.Y.; et al. Spermine synthase and MYC cooperate to maintain colorectal cancer cell survival by repressing Bim expression. Nat. Commun. 2020, 11, 1–16. [Google Scholar] [CrossRef]
- Strippoli, A.; Cocomazzi, A.; Basso, M.; Cenci, T.; Ricci, R.; Pierconti, F.; Cassano, A.; Fiorentino, V.; Barone, C.; Bria, E.; et al. c-MYC Expression Is a Possible Keystone in the Colorectal Cancer Resistance to EGFR Inhibitors. Cancers 2020, 12, 638. [Google Scholar] [CrossRef]
- Lee, K.S.; Kwak, Y.; Nam, K.H.; Kim, D.-W.; Kang, S.-B.; Choe, G.; Kim, W.H.; Lee, H.S. Favorable prognosis in colorectal cancer patients with co-expression of c-MYC and ß-catenin. BMC Cancer 2016, 16, 1–12. [Google Scholar] [CrossRef]
- Wang, J.; Lu, M.; Qiu, C.; Cui, Q. TransmiR: A transcription factor–microRNA regulation database. Nucleic Acids Res. 2009, 38, D119–D122. [Google Scholar] [CrossRef]
- Tong, Z.; Cui, Q.; Wang, J.; Zhou, Y. TransmiR v2.0: An updated transcription factor-microRNA regulation database. Nucleic Acids Res. 2019, 47, D253–D258. [Google Scholar] [CrossRef] [PubMed]
- Seth, A.; Watson, D.K. ETS transcription factors and their emerging roles in human cancer. Eur. J. Cancer 2005, 41, 2462–2478. [Google Scholar] [CrossRef]
- Melotte, V.; Qu, X.; Ongenaert, M.; Van Criekinge, W.; De Bruine, A.P.; Baldwin, H.S.; Van Engeland, M. The N-myc downstream regulated gene (NDRG) family: Diverse functions, multiple applications. FASEB J. 2010, 24, 4153–4166. [Google Scholar] [CrossRef]
- Wang, X.; Sun, D.; Tai, J.; Chen, S.; Yu, M.; Ren, D.; Wang, L. TFAP2C promotes stemness and chemotherapeutic resistance in colorectal cancer via inactivating hippo signaling pathway. J. Exp. Clin. Cancer Res. 2018, 37, 1–16. [Google Scholar] [CrossRef]
- Wu, C.W.; Evans, J.M.; Huang, S.; Mahoney, D.W.; Dukek, B.A.; Taylor, W.R.; Yab, T.C.; Smyrk, T.C.; Jen, J.; Kisiel, J.B.; et al. A Comprehensive Approach to Sequence-oriented IsomiR annotation (CASMIR): Demonstration with IsomiR profiling in colorectal neoplasia. BMC Genom. 2018, 19, 401. [Google Scholar] [CrossRef]
- Shkurnikov, M.Y.; Nersisyan, S.A.; Osepyan, A.S.; Maltseva, D.V.; Knyazev, E.N. Differences in the Drosha and Dicer Cleavage Profiles in Colorectal Cancer and Normal Colon Tissue Samples. Dokl. Biochem. Biophys. 2020, 493, 208–210. [Google Scholar] [CrossRef]
- Na, Y.-J.; Sung, J.H.; Lee, S.C.; Lee, Y.-J.; Choi, Y.J.; Park, W.-Y.; Shin, H.S.; Kim, J.H. Comprehensive analysis of microRNA-mRNA co-expression in circadian rhythm. Exp. Mol. Med. 2009, 41, 638–647. [Google Scholar] [CrossRef] [PubMed]
- Balakrishnan, A.; Stearns, A.T.; Park, P.J.; Dreyfuss, J.M.; Ashley, S.W.; Rhoads, D.B.; Tavakkolizadeh, A. MicroRNA mir-16 is anti-proliferative in enterocytes and exhibits diurnal rhythmicity in intestinal crypts. Exp. Cell Res. 2010, 316, 3512–3521. [Google Scholar] [CrossRef]
- Kinoshita, C.; Aoyama, K.; Matsumura, N.; Kikuchi-Utsumi, K.; Watabe, M.; Nakaki, T. Rhythmic oscillations of the microRNA miR-96-5p play a neuroprotective role by indirectly regulating glutathione levels. Nat. Commun. 2014, 5, 3823. [Google Scholar] [CrossRef]
- Heegaard, N.H.H.; Carlsen, A.L.; Lilje, B.; Ng, K.L.; Rønne, M.E.; Jørgensen, H.L.; Sennels, H.; Fahrenkrug, J. Diurnal Variations of Human Circulating Cell-Free Micro-RNA. PLoS ONE 2016, 11, e0160577. [Google Scholar] [CrossRef]
- Xu, H.; Ma, Y.; Zhang, J.; Gu, J.; Jing, X.; Lu, S.; Fu, S.; Huo, J. Identification and Verification of Core Genes in Colorectal Cancer. BioMed Res. Int. 2020, 2020, 1–13. [Google Scholar] [CrossRef]
- Guo, Y.; Bao, Y.; Ma, M.; Yang, W. Identification of Key Candidate Genes and Pathways in Colorectal Cancer by Integrated Bioinformatical Analysis. Int. J. Mol. Sci. 2017, 18, 722. [Google Scholar] [CrossRef]
- Chen, X.; Shi, K.; Wang, Y.; Song, M.; Zhou, W.; Tu, H.; Lin, Z. Clinical value of integrated-signature miRNAs in colorectal cancer: miRNA expression profiling analysis and experimental validation. Oncotarget 2015, 6, 37544–37556. [Google Scholar] [CrossRef]
- Francavilla, A.; Turoczi, S.; Tarallo, S.; Vodicka, P.; Pardini, B.; Naccarati, A. Exosomal microRNAs and other non-coding RNAs as colorectal cancer biomarkers: A review. Mutagenetics 2019, 35, 243–260. [Google Scholar] [CrossRef]
- Sempere, L.F.; Azmi, A.S.; Moore, A. microRNA -based diagnostic and therapeutic applications in cancer medicine. Wiley Interdiscip. Rev. RNA 2021, e1662. [Google Scholar] [CrossRef]
- Ratti, M.; Lampis, A.; Ghidini, M.; Salati, M.; Mirchev, M.B.; Valeri, N.; Hahne, J.C. MicroRNAs (miRNAs) and Long Non-Coding RNAs (lncRNAs) as New Tools for Cancer Therapy: First Steps from Bench to Bedside. Target. Oncol. 2020, 15, 261–278. [Google Scholar] [CrossRef]
- Chakraborty, C.; Sharma, A.R.; Sharma, G.; Lee, S.-S. Therapeutic advances of miRNAs: A preclinical and clinical update. J. Adv. Res. 2021, 28, 127–138. [Google Scholar] [CrossRef]
- Matsuyama, H.; Suzuki, H.I. Systems and Synthetic microRNA Biology: From Biogenesis to Disease Pathogenesis. Int. J. Mol. Sci. 2019, 21, 132. [Google Scholar] [CrossRef]
- Gregorova, J.; Vychytilova-Faltejskova, P.; Sevcikova, S. Epigenetic Regulation of MicroRNA Clusters and Families during Tumor Development. Cancers 2021, 13, 1333. [Google Scholar] [CrossRef]


| Cluster Chromosome | Host Gene/Locus Name | Host Gene Type | Cluster Location | Expression Regulation and Transcription Site (TSS) |
|---|---|---|---|---|
| miR-106a/18b/20b/19b-2/92a-2 chr. X | Xq26.2 [15] | Non-coding | intergenic | Own TSS [10] |
| miR-106b/93/25 chr. 7 | MCM7 [15] | Protein coding | intron | Co-expression of miR-25 with the host gene [16]. Host gene TSS [17,18,19] |
| miR-17/18a/19a/20a/19b-1/92a-1 chr.13 | MIR17HG [15] | Long non-coding | intron | Co-expression of miR-17, miR-18a, miR-20a and miR-92a with the host gene [16,20]. Multiple TSS [10,11] |
| miR-181a-1/181b-1 chr. 1 | MIR181A1HG [21] | Long non-coding | intron | Multiple TSS [10] |
| miR-181a-2/181b-2 chr. 9 | NR6A1 [22] | Protein coding | intron | Multiple TSS [10] |
| miR-181c/181d chr. 19 | NANOS3 [22,23,24] | Protein coding | intron | Own TSS [10] |
| miR-183/96/182 chr. 7 | MIR96 [23,24] | Non-coding | intergenic | Own TSS [10] |
| miR-191/425 chr. 3 | NDUFA3 [16] | Protein coding | intron | Host gene TSS [25] |
| miR-200c/141 chr. 12 | MIR200CHG [26] | Long non-coding | intergenic | Own TSS [27] |
| miR-203a/203b chr. 14 | MIR203A [28] | Non-coding | intergenic | Own TSS [10] |
| miR-222/221 chr. X | MIR222HG [25] | Long non-coding | intergenic | Own TSS [10] |
| miR-23a/27a/24-2 chr. 19 | MIR23AHG [26] | Long non-coding | intergenic | Own TSS [29] |
| miR-29b-1/29a chr. 7 | LINC-PINT [30] | Long non-coding | intergenic | Multiple TSS [10] |
| miR-301b/miR-130b chr. 22 | PPIL2 [31] | Protein coding | intron | Multiple TSS [10] |
| miR-452/224 chr. X | GABRE [9] | Protein coding | intron | Co-expression with the host gene [17,18,19] |
| miRNA Cluster | Sponging ncRNA | ncRNA Class | Reference |
|---|---|---|---|
| miR-183/96/182 | AGER-1 | intronic ncRNA | [48] |
| miR-203a/203b | BANCR | lincRNA | [49] |
| miR-106b/93/25 | CA3-AS1 | antisense RNA | [50] |
| miR-181a-1/181b-1 miR-181a-2/181b-2 | CCAT1 | lincRNA | [41,42] |
| miR-106b/93/25 | circ_000984 (CDK6) | circRNA | [51] |
| miR-183/96/182 | circ_0026344 (ACVRL1) | circRNA | [52] |
| miR-106b/93/25 | circ_0055625 (DUSP2) | circRNA | [53] |
| miR-203a/203b | circ_0079993 (POLR2J4) | circRNA | [54] |
| miR-106b/93/25 | circ-SMARCA5 (SMARCA5) | circRNA | [55] |
| miR-181a-1/181b-1 miR-181a-2/181b-2 | CRNDE | antisense RNA | [56] |
| miR-106a/18b/20b/19b-2/92a-2/363 | FARSA-AS1 | antisense RNA | [57] |
| miR-203a/203b | FBXL19-AS | antisense RNA | [58] |
| miR-106a/18b/20b/19b-2/92a-2/363 | FBXW7 | lincRNA | [59] |
| miR-17/18a/19a/20a/19b-1/92a-1 | FENDRR | lincRNA | [60] |
| miR-106b/93/25 | FOXD2-AS1 | antisense RNA | [61] |
| miR-183/96/182 | GAS5 | antisense RNA | [62] |
| miR-200c/141 miR-29b-1/29a | H19 | lincRNA | [63,64] |
| miR-17/18a/19a/20a/19b-1/92a-1 | HAND2-AS1 | antisense RNA | [65] |
| miR-106b/93/25 miR-203a/203b | HOTAIR | antisense RNA | [66,67] |
| miR-17/18a/19a/20a/19b-1/92a-1 | HOTAIRM1 | lincRNA | [68] |
| miR-29b-1/29a | LIFR-AS1 | antisense RNA | [69] |
| miR-106b/93/25 | LINC00858 | lincRNA | [70] |
| miR-106b/93/25 | LINC01567 | lincRNA | [71] |
| miR-203a/203b | LINC02595 | lincRNA | [72] |
| miR-29b-1/29a | LINC-PINT-variant D | antisense RNA | [29] |
| miR-200c/141 | lncRNA ATB | pseudogene | [43,44] |
| miR-106b/93/25 miR-106a/18b/20b/19b-2/92a-2/363 | MALAT1 | lincRNA | [73,74,75] |
| miR-200c/141 | MEG3 | lincRNA | [76] |
| miR-203a/203b | NORAD | lincRNA | [77] |
| miR-200c/141 | SNHG15 | intronic ncRNA | [78] |
| miR-17/18a/19a/20a/19b-1/92a-1 miR-183/96/182 | UCA1 | lincRNA | [79] |
| miR-183/96/182 | XIRP2-AS1 | antisense RNA | [80] |
| miR-106b/93/25 | XIST | lincRNA | [81] |
| miR-200c/141 miR-181a-1/181b-1 miR-181a-2/181b-2 | ZEB1-AS1 | antisense RNA | [47,82] |
| Cluster | Family | Seed Sequence |
|---|---|---|
| miR-301b/130b | miR-130-3p/301-3p/454-3p | AGUGCA |
| miR-200c/141 | miR-141-3p/200a-3p | AACACUG |
| miR-106a/18b/20b/19b-2/92a-2/363 miR-106b/93/25 miR-17/18a/19a/20a/19b-1/92a-1 | miR-17-5p/20-5p/93-5p/106-5p/519-3p | AAAGUGC |
| miR-181a-1/181b-1;181a-2/181b-2 miR-181c/181d | miR-181-5p | ACAUUCA |
| miR-183/96/182 | miR-182-5p | UUGGCAA |
| miR-183/96/182 | miR-183-5p | AUGGCAC |
| miR-106a/18b/20b/19b-2/92a-2/363 miR-17/18a/19a/20a/19b-1/92a-1 | miR-18-5p | AAGGUGC |
| miR-191/425 | miR-191-5p | AACGGAA |
| miR-17/18a/19a/20a/19b-1/92a-1 miR-106a/18b/20b/19b-2/92a-2/363 | miR-19-3p | GUGCAAA |
| miR-203a/203b | miR-203a-3p.2 | UGAAAUG |
| miR-203a/203b | miR-203b-3p | UGAACUG |
| miR-222/221 | miR-221-3p/222-3p | GCUACAU |
| miR-452/224 | miR-224-5p | AAGUCAC |
| miR-23a/27a/24-2 | miR-23-3p | UCACAUU |
| miR-23a/27a/24-2 | miR-24-3p | GGCUCAG |
| miR-106b/93/25 miR-106a/18b/20b/19b-2/92a-2/363 miR-17/18a/19a/20a/19b-1/92a-1 | miR-25-3p/32-5p/92-3p/363-3p/367-3p | AUUGCAC |
| miR-23a/27a/24-2 | miR-27-3p | UCACAGU |
| miR-29b-1/29a | miR-29-3p | AGCACCA |
| miR-191/425 | miR-425-5p | AUGACAC |
| miR-452/224 | miR-452-5p/892-3p | ACUGUUU |
| miR-183/96/182 | miR-96-5p/1271-5p | UUGGCAC |
| Cluster | miRNA | Levels in Stool |
|---|---|---|
| miR-106a/18b/20b/19b-2/92a-2/363 | miR-106a | ↑ [107,113] |
| miR-19b | ↑ [114,115] | |
| miR-92a | ↑ [107,114,115,116] | |
| miR-17/18a/19a/20a/19b-1/92a-1 | miR-17 | ↑ [107,115,116] |
| miR-18a | ↑ [115,117] | |
| miR-19a | ↑ [115] | |
| miR-20a | ↑ [107,114,115] | |
| miR-19b | ↑ [114,115] | |
| miR-92a | ↑ [107,114,115,116] | |
| miR-183/96/182 | miR-183 | ↑ [107] |
| miR-96 | ↑ [107] | |
| miR-222/221 | miR-222 | ↓ [107] |
| miR-221 | ↑ [117] | |
| miR-29b/29a | miR-29b | ↓ [117] |
| miR-29a | ↓ [118] | |
| miR-301b/130b | miR-130b | ↑ [119] |
| miR-452/224 | miR-224 | ↓ [118] |
| miRNA Cluster | miRNA | Association with Worse Survival | Association with Disease Reccurence/Relapse |
|---|---|---|---|
| miR-106a/18b/20b/19b-2/92a-2/363 | miR-106a | ↑ TU [104,130,131,132] | ↑P [133]; TU [134] |
| miR-18b | ↑ TU [135] | ||
| miR-92a | ↑ S [136], TU [137,138,139] ↓TU [140] | ↑ S [141] | |
| miR-20b | ↑ TU [142] ↓ TU [140], P [143] | ||
| miR-363 | ↓ S [144] | ||
| miR-106b/93/25 | miR-106b | ↓ TU [74] | ↓ TU [74] |
| miR-93 | ↓ TU [140,145,146,147] | ↓ TU [146] | |
| miR-25 | ↑ TU [148,149] | ||
| miR-17/18a/19a/20a/19b-1/92a-1 | miR-17 | ↑ TU [150,151,152]; S [104] ↓ TU [140] | ↑S [141] |
| miR-18a | ↑ TU [153] | ||
| miR-19a | ↑ S [154] | ||
| miR-20a | ↑ TU [65,130,155]; P [98] ↓ TU [140] | ↑ AT [134] ↑T [65] | |
| miR-19b | ↑ LM [156] ↓ TU [140,157] | ||
| miR-92a | ↑ TU [137,138,139]; S [136] ↓ TU [140] | ↑ S [141] | |
| miR-181a-1/181b-1 miR-181a-2/181b-2 | miR-181a | ↑ TU [158,159,160] | |
| miR-181b | ↑ TU [130] | ||
| miR-181c/181d | miR-181c | ↑ TU [135] | |
| miR-181d | ↓ TU [161] | ||
| miR-183/96/182 | miR-183 | ↑ TU [162,163,164] | |
| miR-96 | ↑ TU [165]; P [166] ↓ TU [167] | ||
| miR-182 | ↑ TU [165,168,169] | ||
| miR-191/425 | miR-191 | ↓ TU [170] | |
| miR-200c/141 | miR-200c | ↑ TU [171,172]; S [173]; P [174] ↓ TU [175,176,177] | |
| miR-141 | ↑ P [166,174,178]; TU [146] ↓ TU [177,179] | ↑ TU [146] | |
| miR-203a/203b | miR-203a | ↑S [180]; TU [130] ↓ TU [55,181] | ↑ AT [134] |
| miR-222/221 | miR-222 | ↑ TU [135] | |
| miR-221 | ↓ TU [182] | ↑ TU [135] | |
| miR-23a/27a/24-2 | miR-23a | ↑ P [98] | |
| miR-27a | ↑ TU [183,184,185,186] | ↑ TU [187] | |
| miR-24 | ↑ TU [187] ↓ TU [188] | ||
| miR-29b/29a | miR-29b | ↑ TU [189] ↓ P [143];TU [64] | |
| miR-29a | ↑ TU [190] ↓ TU [191] | ↑ P [192] ↓ TU [193] | |
| miR-301b/130b | miR-130b | ↑ TU [194] | |
| miR-452/224 | miR-452 | ↑ TU [195] ↓ TU [196] | |
| miR-224 | ↑ TU [197,198] ↓ TU [182] | ↑ TU [197] |
| Cluster | miRNA | Target Genes |
|---|---|---|
| miR-106a/18b/20b/19b-2/ 92a-2/363 | miR-106a-5p | ATG7; AMER1; DUSP2; FOXQ1; GABBR1; TGFBR2 |
| miR-106a-3p | PTEN | |
| miR-18b-5p | CDKN2B; SOX9 | |
| miR-20b-5p | ADAM9; GABBR1; POU5F1 | |
| miR-19b-3p | SMAD4 | |
| miR-92a-5p | AQP8 | |
| miR-92a-3p | BCL2L11; DDK3; FBXW7; GSK3β; KLF4; MOAP1; NF2; RBM4; RECK; SMAD7 | |
| miR-363-3p | EZH2; GATA6; SOX4; SPHK2 | |
| miR-106b/25/93 | miR-106b-5p | ATG16L1; CTSA; DLC1; GABBR1; ITGB8; CDKN1A; PLK3; PRRX1; PTEN; SLAIN2; TRIM8 |
| miR-10b-3p | DLC1 | |
| miR-25-5p | NEDD9; PRKCZ | |
| miR-25-3p | ANGPTL8; ATXN3; MCU; SEMA4C; SMAD7 | |
| miR-93-5p | ATG12; ATG16L1; CCND1; CD274; CTNNB1; FOXA1; HIF1A; MYC; PTEN; SMAD7 | |
| miR-93-3p | ARID4B | |
| miR-17/18a/19a/20a/19b-1/92a-1 | miR-17-5p | BTG3; CLU; CYP7B1; GABBR1; NCOA3; PTEN; RBL2; RND3; SIK1 TGFBR2; TRIM8; VIM |
| miR-17-3p | F2RL3 | |
| miR-18a-5p | ATM; CCND1; CDC42; CDK19; HIF1A; HNRNPA1; ING4; NEDD9; PIAS3; SMAD4; TBPL1 | |
| miR-19a-3p | FOXF2; KRAS; PTEN; TF; TGFBR2; TGM2; THBS1; TIA1; TNFAIP3 | |
| miR-20a-5p | AMER1; ATG5; BID; BNIP2; CDKN1A; CXCL8; FOXJ2; GABBR1; MAP3K5; MICA; PDCD4; RB1CC1; SMAD4; TGFBR2; VEGFA | |
| miR-19b-3p | SMAD4 | |
| miR-92a-5p | AQP8 | |
| miR-92a-3p | BCL2L11; DDK3; FBXW7; GSK3β; KLF4; MOAP1; NF2; RBM4; RECK; SMAD7; PTEN | |
| miR-181a-1/181b-1miR-181a-2/181b-2 | miR-181a-5p | CTNNB1; E2F5; MMP14; PLAG1; PTEN; SRCIN1; STAT1; TCF4; WIF1 |
| miR-181b-5p | PDCD4; PIAS3; RASSF1; TUSC3 | |
| miR-181c/181d | miR-181d-5p | PEAK1; FBXL3; CRY2 |
| miR-183/96/182 | miR-183-5p | ABCA1; AFDN; AKAP12; ATG5; RCN2; UVRAG |
| miR-96-5p | CCND1; FOXO1; FOXO3a; GPC1; KRAS; TP53INP1; TPM1 | |
| miR-96-3p | RECK | |
| miR-182-5p | AGER; DAB2IP; FBXW7; FOXF2; FOXO1; FOXO3a; MTDH; MYC; SATB2; ST6GALNAC2; THBS1 | |
| miR-191/425 | miR-191-5p | C/EBPβ; TIMP3 |
| miR-425-5p | CTNND1; PDCD10 | |
| miR-200c/141 | miR-200c-3p | BMI1; CDK2; ETS1; FLT1; KLF14; SOX2; VLDLR; ZEB1 |
| miR-200c-5p | PRICKLE2 | |
| miR-141-3p | CCND2; DLC1; EGFR; GEMIN2; MAP2K4; MAP4K4; PDCD4; SIRT1; TRAF5; ZEB1 | |
| miR-203a/203b | miR-203a-3p | AKT2; ATM; CPEB4; CREB1; CSE1L; CTNNB1; DNMT3b; EIF5A2; GATA6; NEDD9; PDE4D; RNF6; ROBO1; SIK2; TCF4; THBS2; TLE5; TYMS; KLK6 |
| miR-203b-3p | BCL2L1 | |
| miR-221/222 | miR-221-5p | MBD2 |
| miR-23a/27a/24-2 | miR-23a-3p | ABCF1; APAF1; MARK1; PDK4; SEMA6D |
| miR-27a-3p | BTG1; CALR; FAM172A; RXRα; SFRP1; SGPP1; SMAD2; TP53; VANGL | |
| miR-24-5p | CTNNB1 | |
| miR-24-3p | DHFR; DND1; VHL | |
| miR-29b-1/29a | miR-29b-3p | BCL9L; GRN; SIRT1; TIAM1 |
| miR-29b-5p | SMAD3 | |
| miR-29a-3p | KLF4; MMP2; PTEN; RPS15A; TNFAIP3 | |
| miR-301b/130b | miR-130b-3p | ITGB1; ITGA5 |
| miR-452/224 | miR-224-5p | CDH1; CDKN1A; CDS2; GSK3β; LGALSL; MBD2; PHLPP1; PHLPP2; SFRP2; SLC4A4; SMAD4; USP3 |
| miR-452-3p | GSK3β |
| Pathway | Pathway Code | miRNA Cluster |
|---|---|---|
| Angiogenesis | P00005 | miR-106b/93/25 miR-17/92a-1 |
| Apoptosis signaling pathway | P00006 | miR-203a/203b |
| CCKR signaling map | P06959 | miR-106b/93/25 miR-17/92a-1 miR-181a-1/181b-1; miR-181a-2/181b-2 miR-203a/203b |
| Gonadotropin-releasing hormone receptor pathway | P06664 | miR-17/92a-1 miR-200c/141 |
| Hypoxia response via HIF activation | P00030 | miR-106b/93/25 miR-17/92a-1 |
| Integrin signalling pathway | P00034 | miR-17/92a-1 miR-301b/130b |
| Interferon-gamma signaling pathway | P00035 | miR-181a-1/181b-1; miR-181a-2/181b-2 |
| Interleukin signaling pathway | P00036 | miR-17/92a-1 |
| JAK/STAT signaling pathway | P00038 | miR-181a-1/181b-1; miR-181a-2/181b-2 |
| p53 pathway | P00059 | miR-17/92a-1 miR-203a/203b |
| p53 pathway feedback loops 2 | P04398 | miR-106b/93/25 miR-17/92a-1 miR-181a-1/181b-1; miR-181a-2/181b-2 miR-203a/203b |
| PI3 kinase pathway | P00048 | miR-17/92a-1 miR-183/96/182 |
| Ras Pathway | P04393 | miR-17/92a-1 |
| TGF-beta signaling pathway | P00052 | miR-106a/363 miR-17/92a-1 |
| VEGF signaling pathway | P00056 | miR-17/92a-1 |
| Wnt signaling pathway | P00057 | miR-106b/93/25 |
Publisher’s Note: MDPI stays neutral with regard to jurisdictional claims in published maps and institutional affiliations. |
© 2021 by the authors. Licensee MDPI, Basel, Switzerland. This article is an open access article distributed under the terms and conditions of the Creative Commons Attribution (CC BY) license (https://creativecommons.org/licenses/by/4.0/).
Share and Cite
Pidíková, P.; Herichová, I. miRNA Clusters with Up-Regulated Expression in Colorectal Cancer. Cancers 2021, 13, 2979. https://doi.org/10.3390/cancers13122979
Pidíková P, Herichová I. miRNA Clusters with Up-Regulated Expression in Colorectal Cancer. Cancers. 2021; 13(12):2979. https://doi.org/10.3390/cancers13122979
Chicago/Turabian StylePidíková, Paulína, and Iveta Herichová. 2021. "miRNA Clusters with Up-Regulated Expression in Colorectal Cancer" Cancers 13, no. 12: 2979. https://doi.org/10.3390/cancers13122979
APA StylePidíková, P., & Herichová, I. (2021). miRNA Clusters with Up-Regulated Expression in Colorectal Cancer. Cancers, 13(12), 2979. https://doi.org/10.3390/cancers13122979