
The Hypoxic Microenvironment Induces Stearoyl-CoA Desaturase-1 Overexpression and Lipidomic Profile Changes in Clear Cell Renal Cell Carcinoma

 , ,
, ,  ,
,  and
and 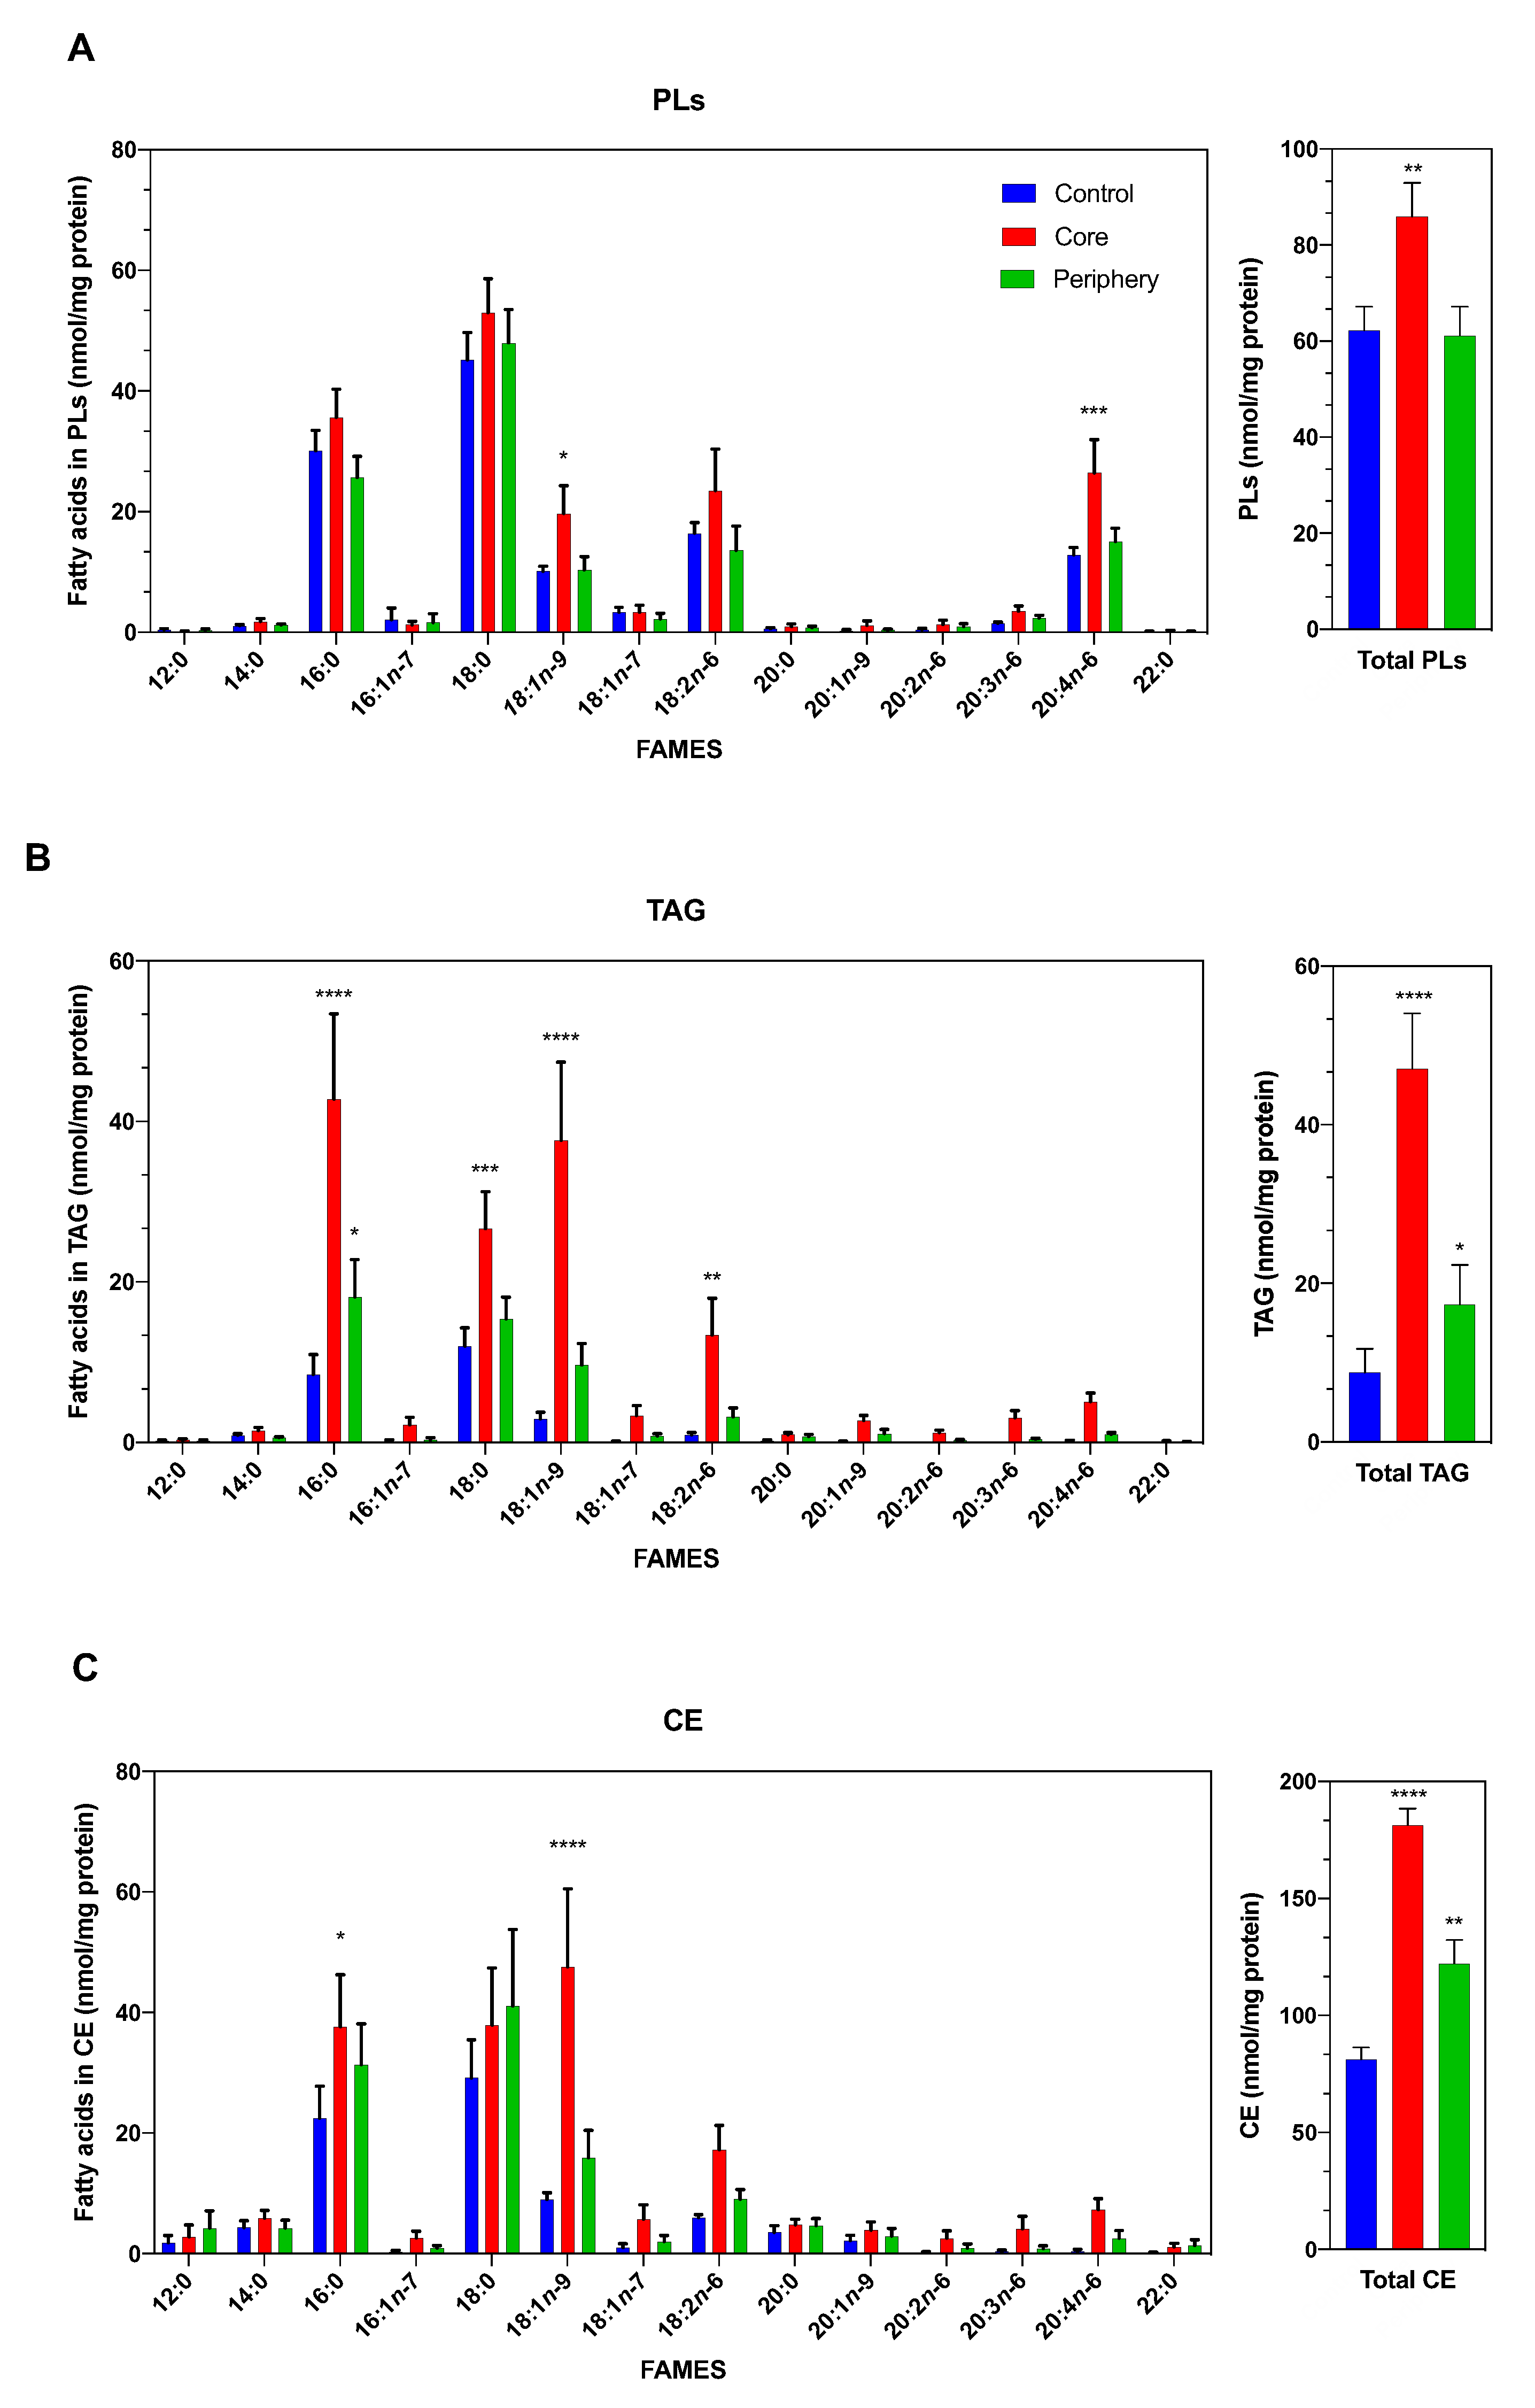
Abstract
Simple Summary
Abstract
1. Introduction
2. Materials and Methods
2.1. Patients and Sampling Procedures
2.2. Cell lines, Proliferation and Viability Assays
2.3. Hypoxic Microenvironment
2.4. Real-Time Quantitative PCR (RT-qPCR)
2.5. SCD-1 Inhibition Assays
2.6. Analyses of Fatty Acids by Gas Chromatography Coupled to Mass Spectrometry (GC/MS)
2.7. Confocal Microscopy
2.8. Apoptosis Detection by Flow Cytometry
2.9. Statistics
3. Results
3.1. The Lipidomic Profile of ccRCC Is Dependent on the Tumor Area Analyzed
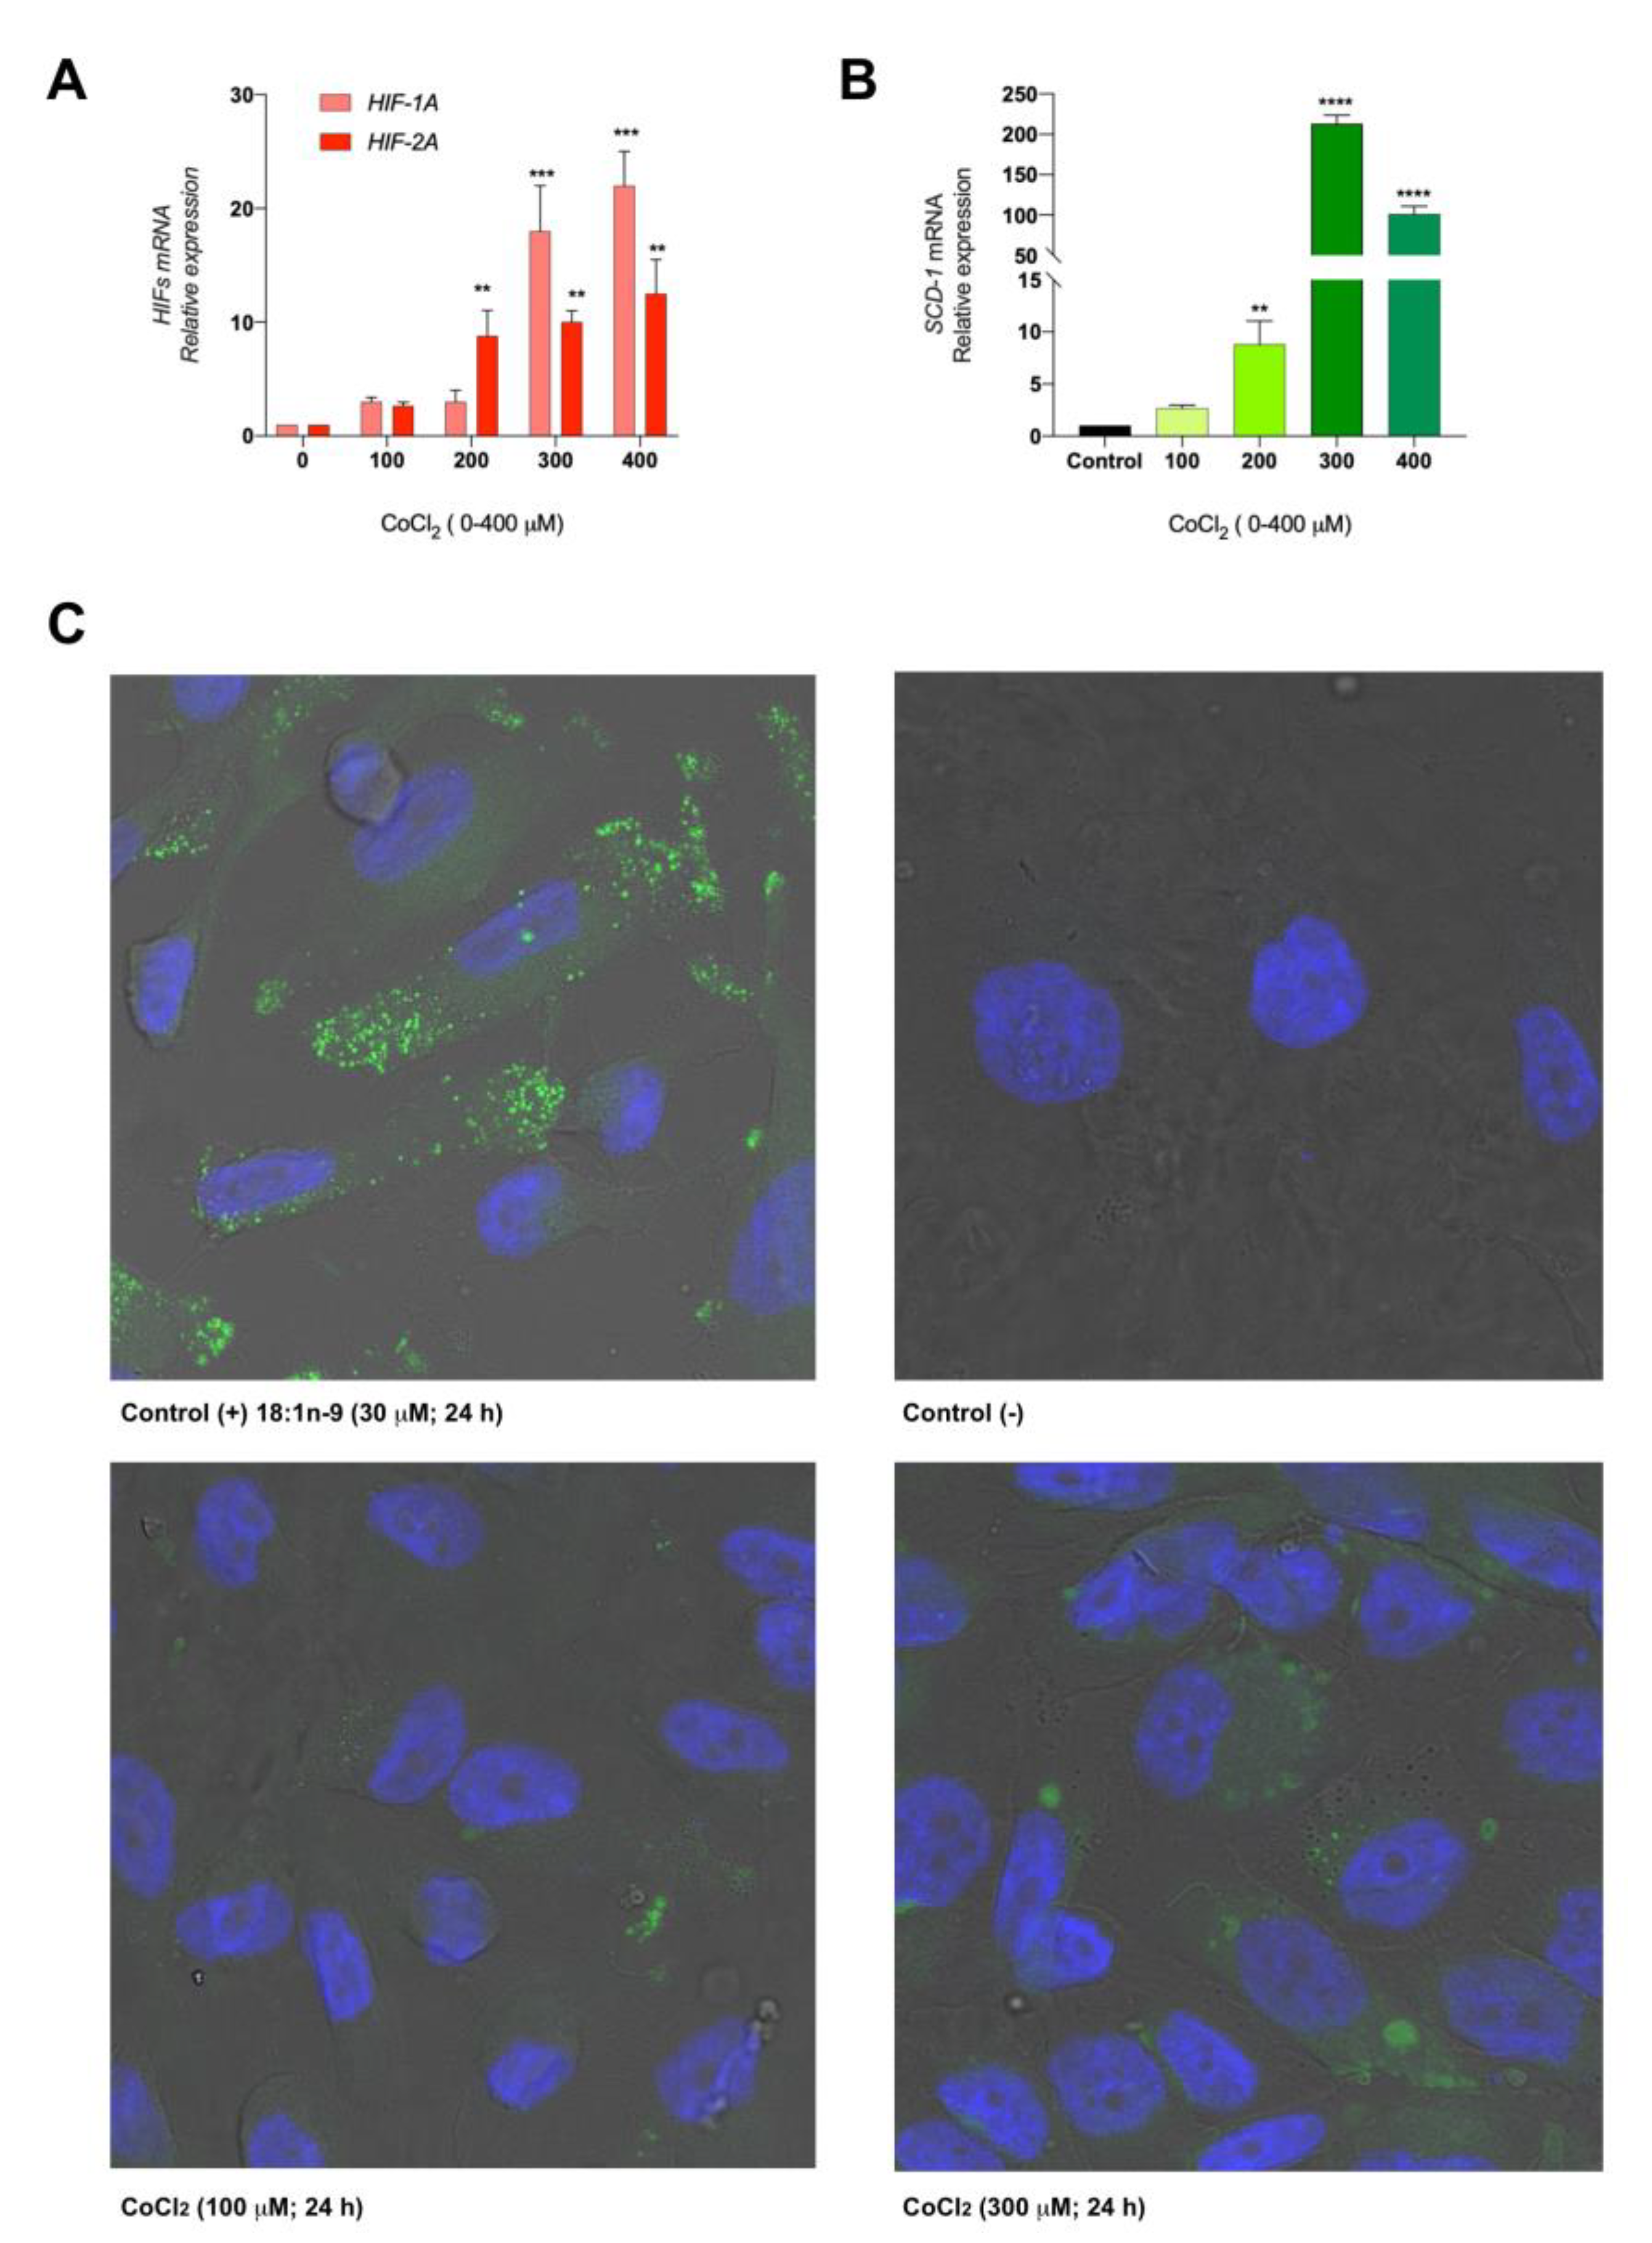
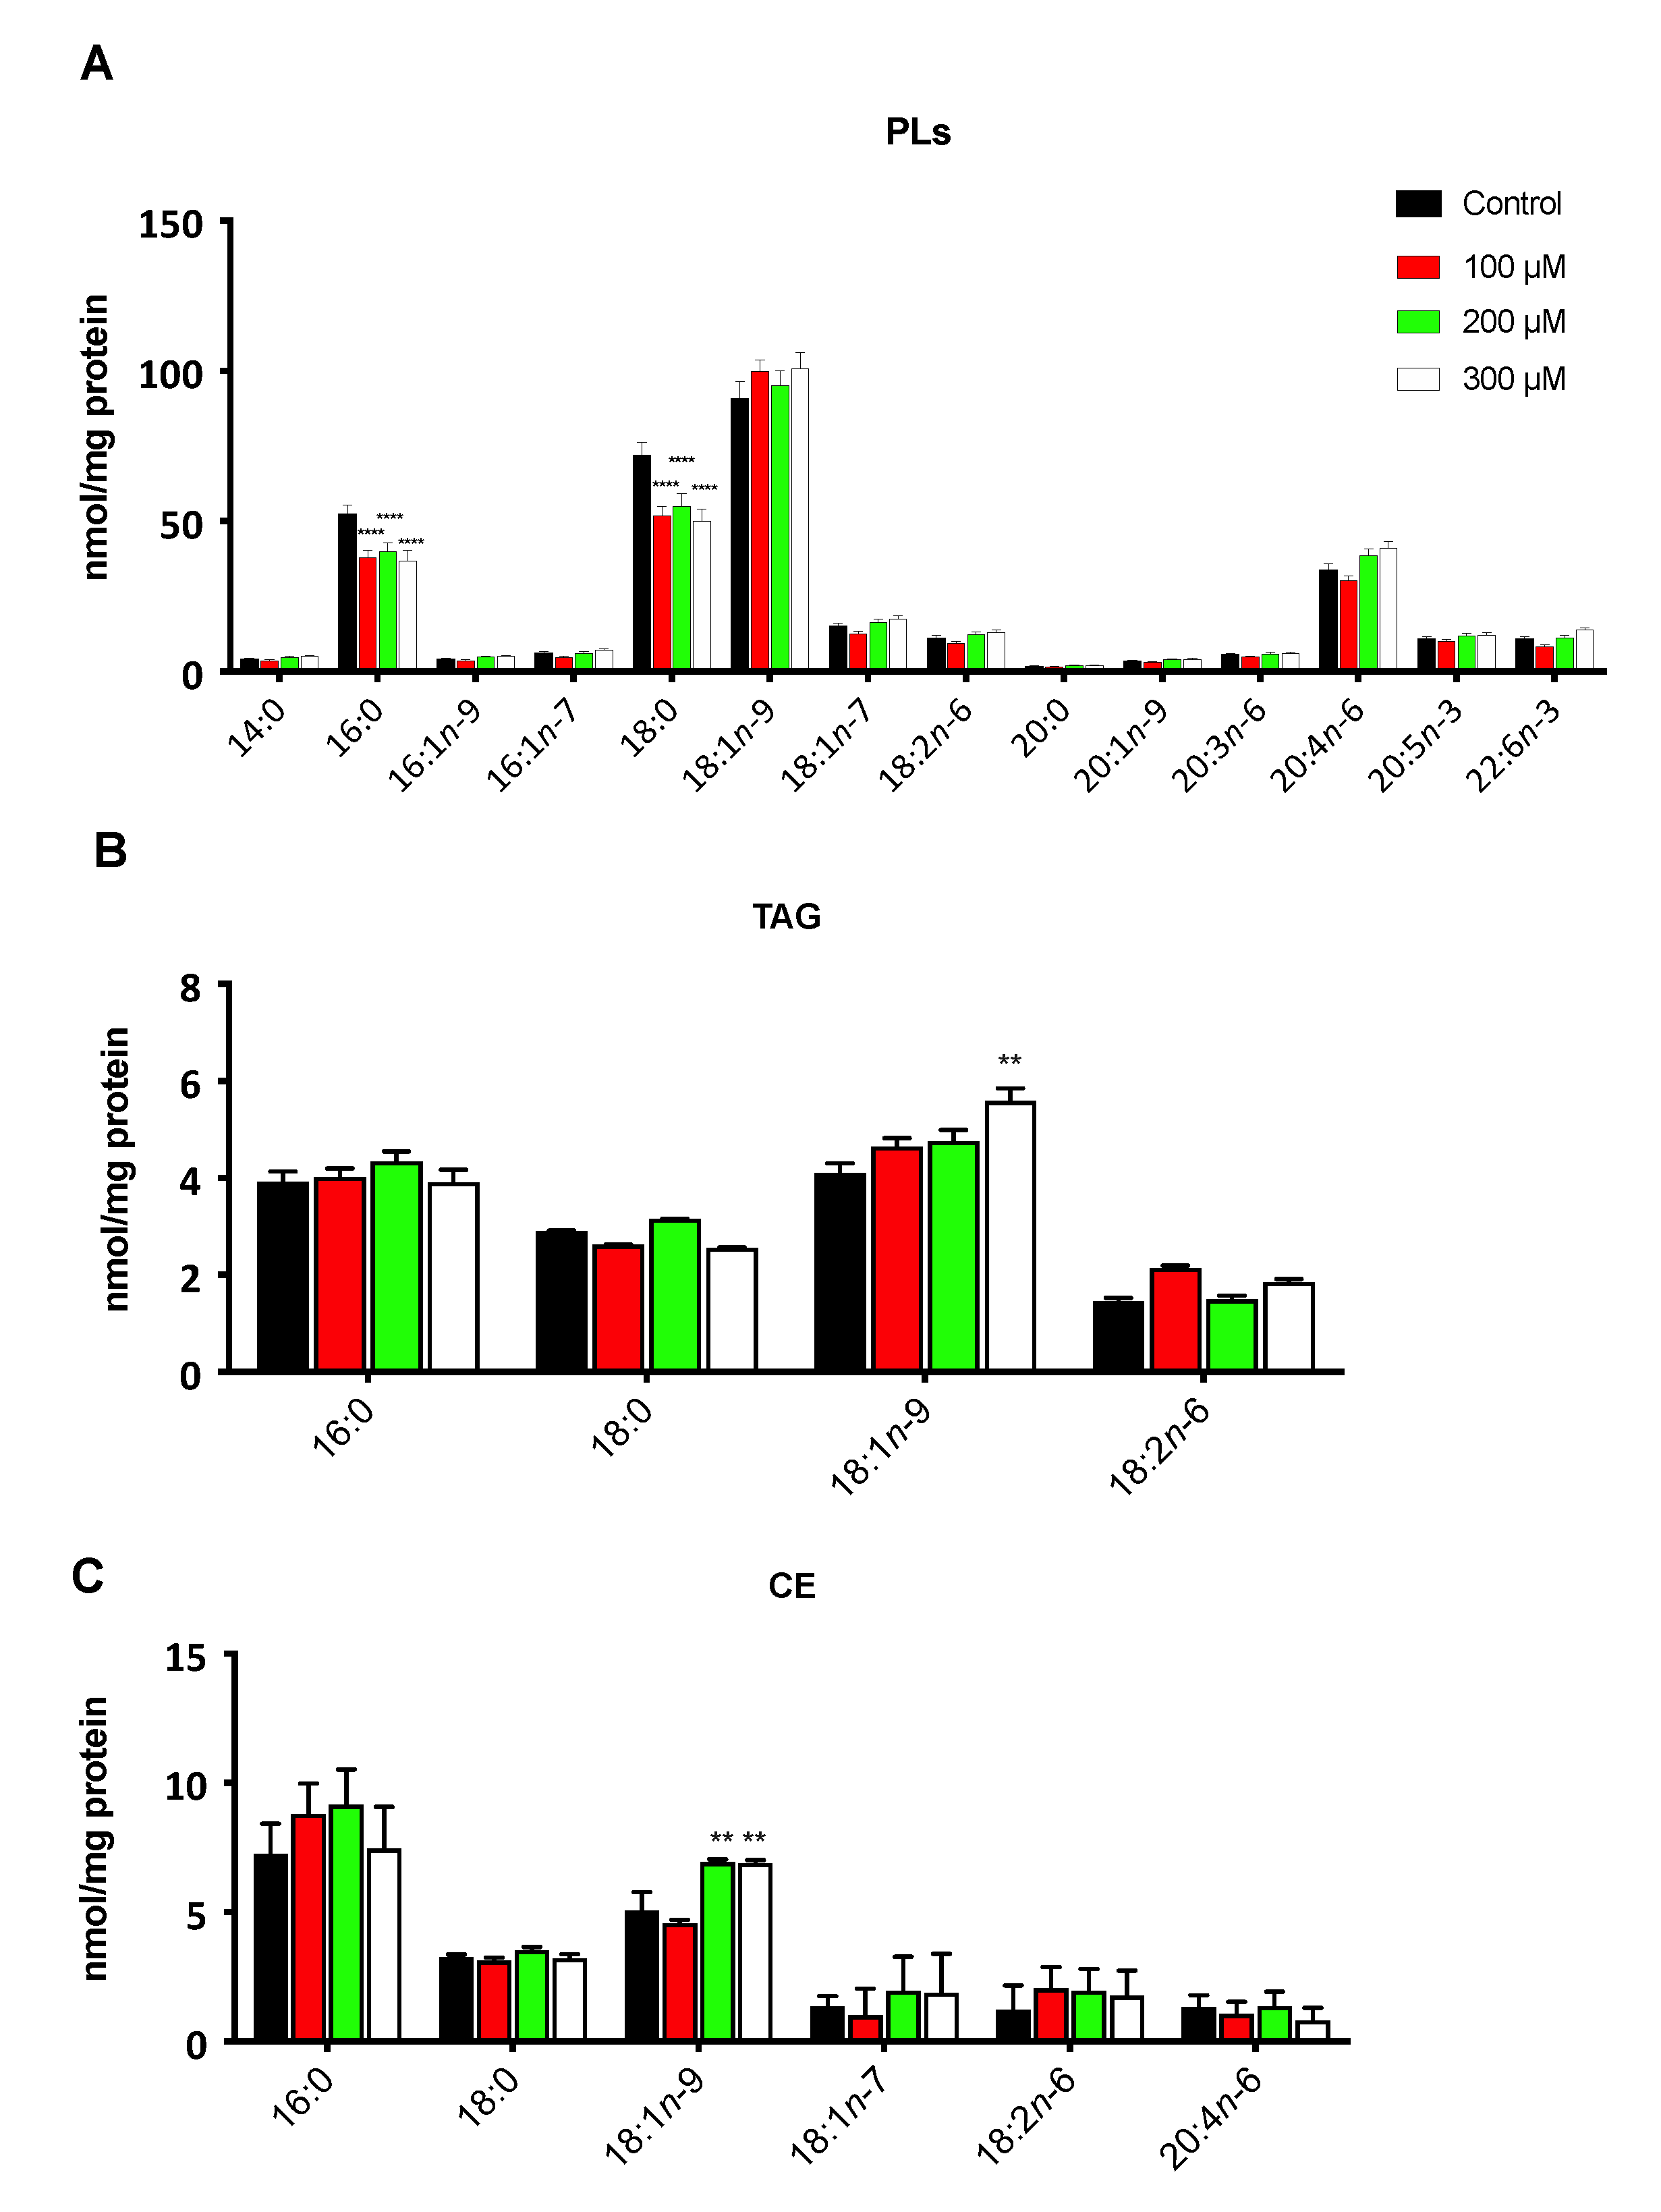
3.2. The Hypoxic Microenvironment Promotes SCD-1 Overexpression, Lipid Droplet Formation and Changes in the Cellular Fatty Acids Profile
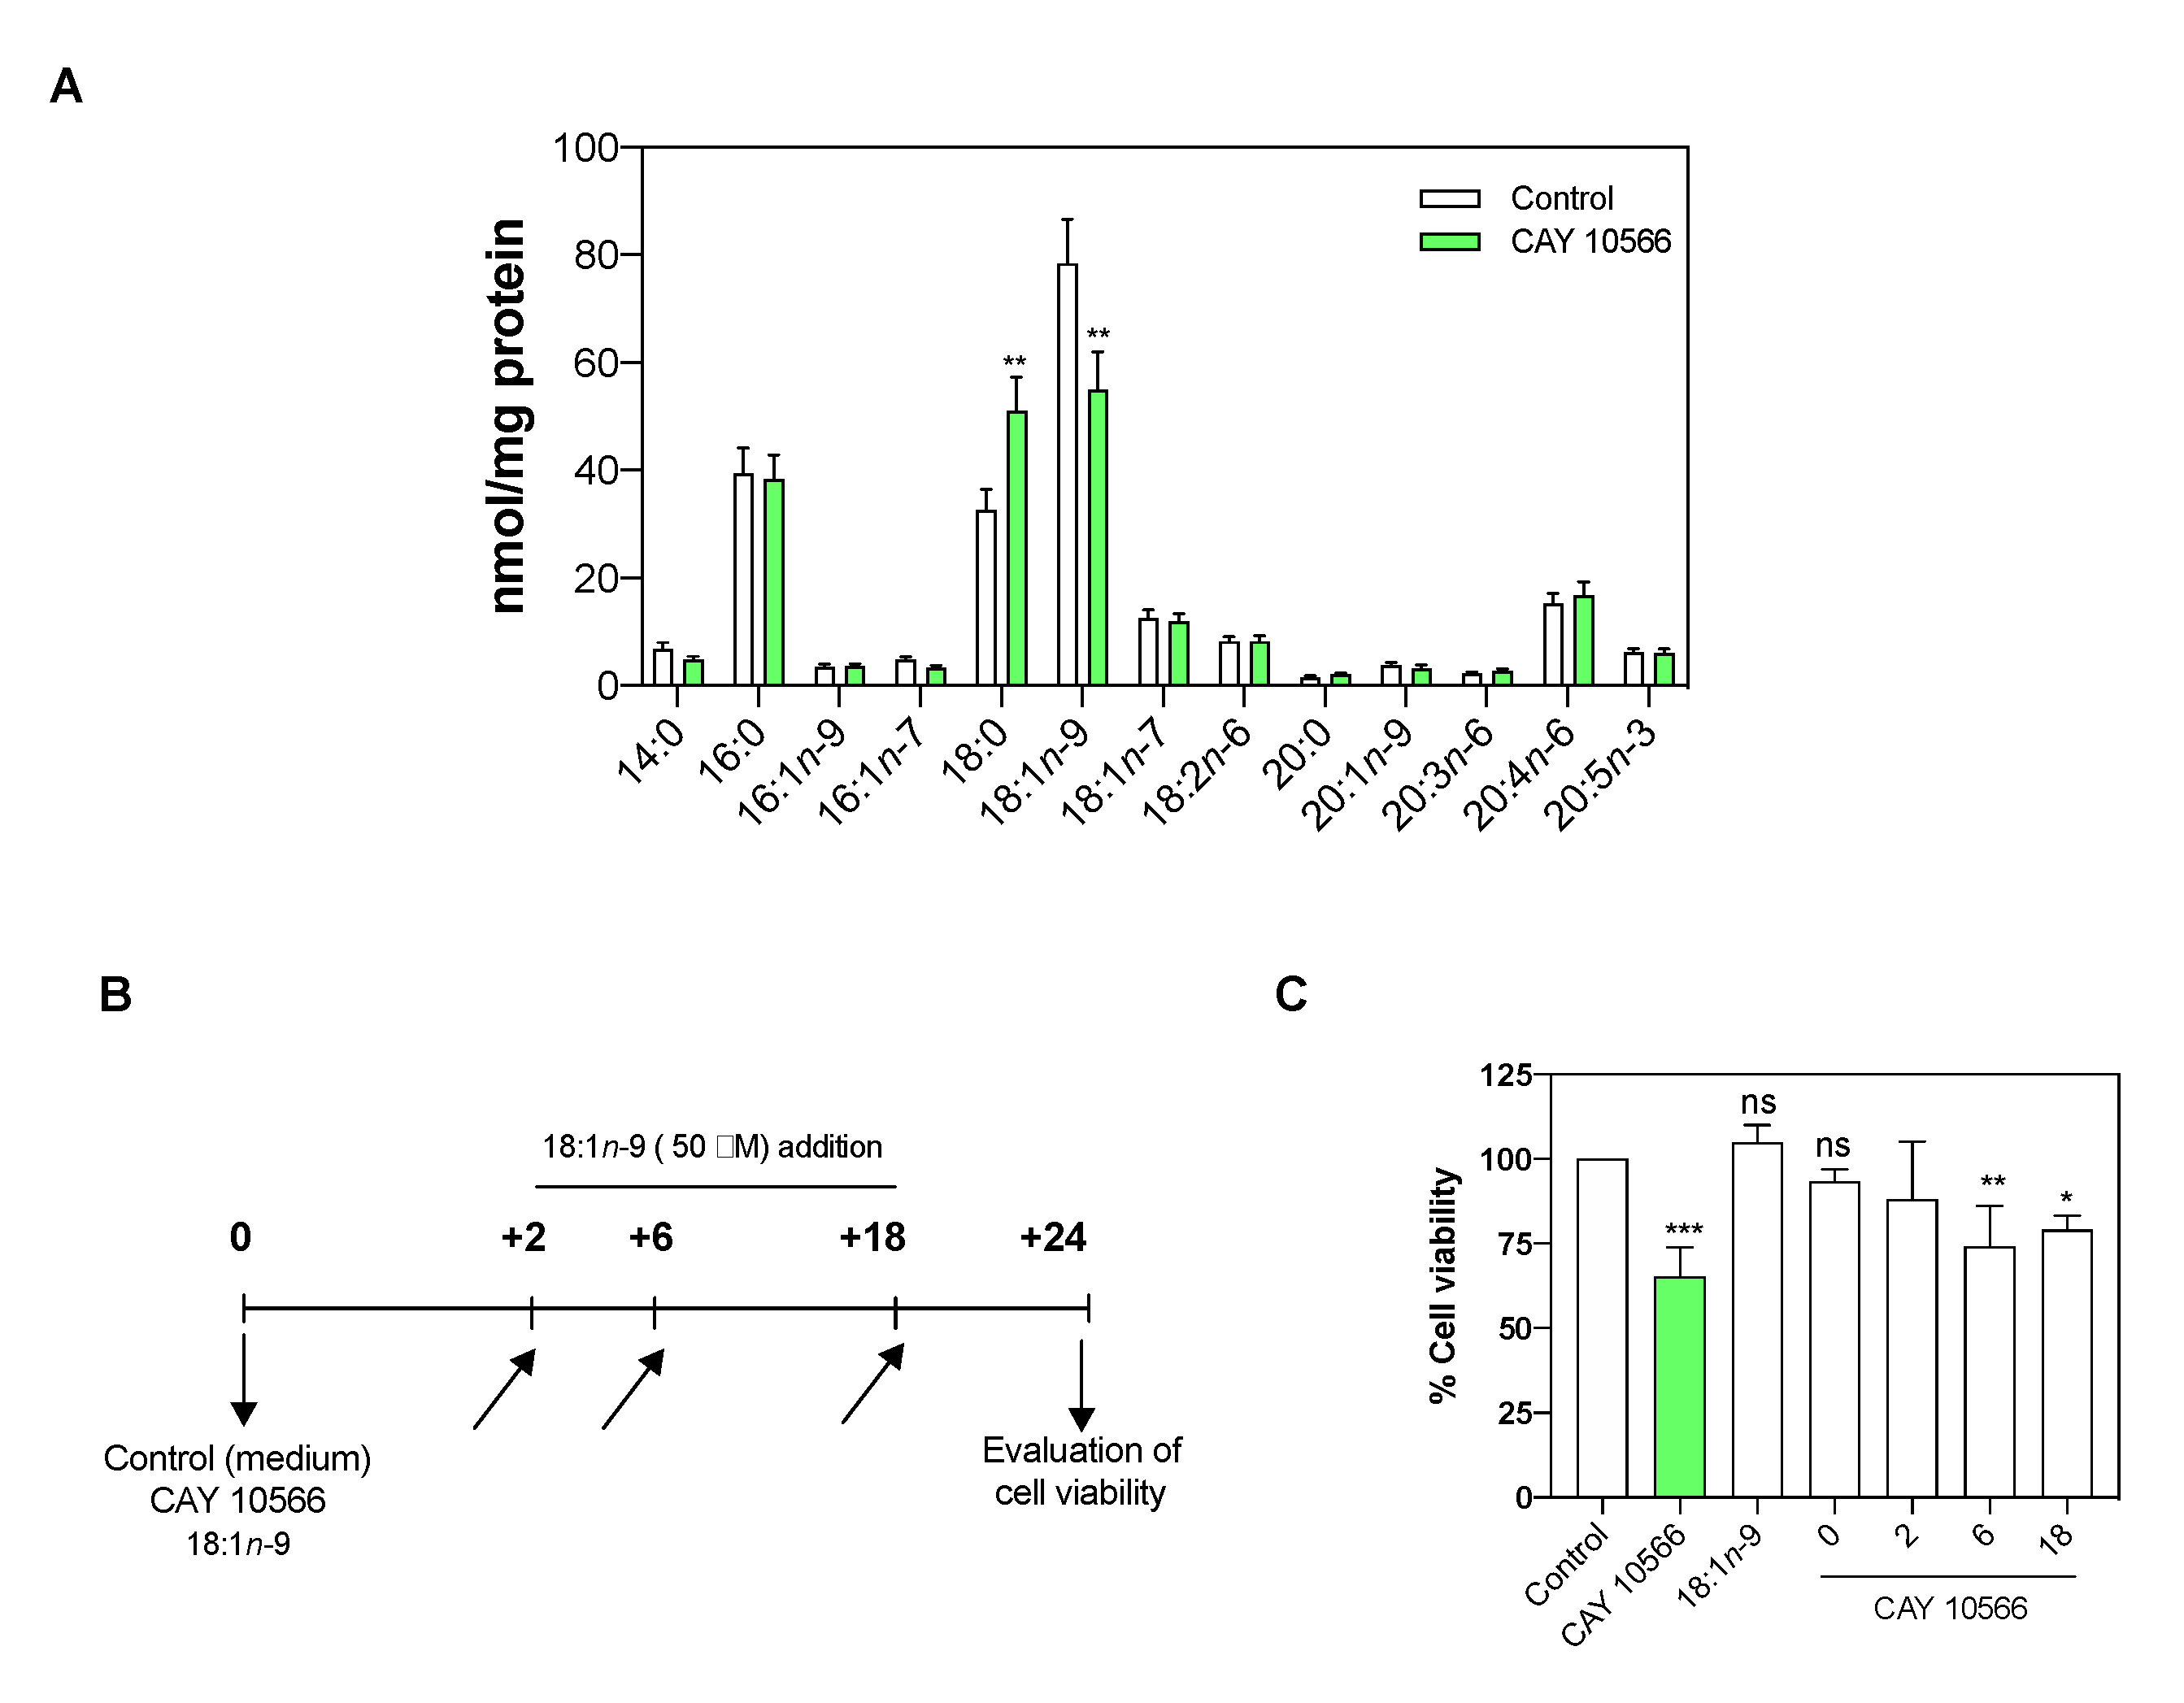
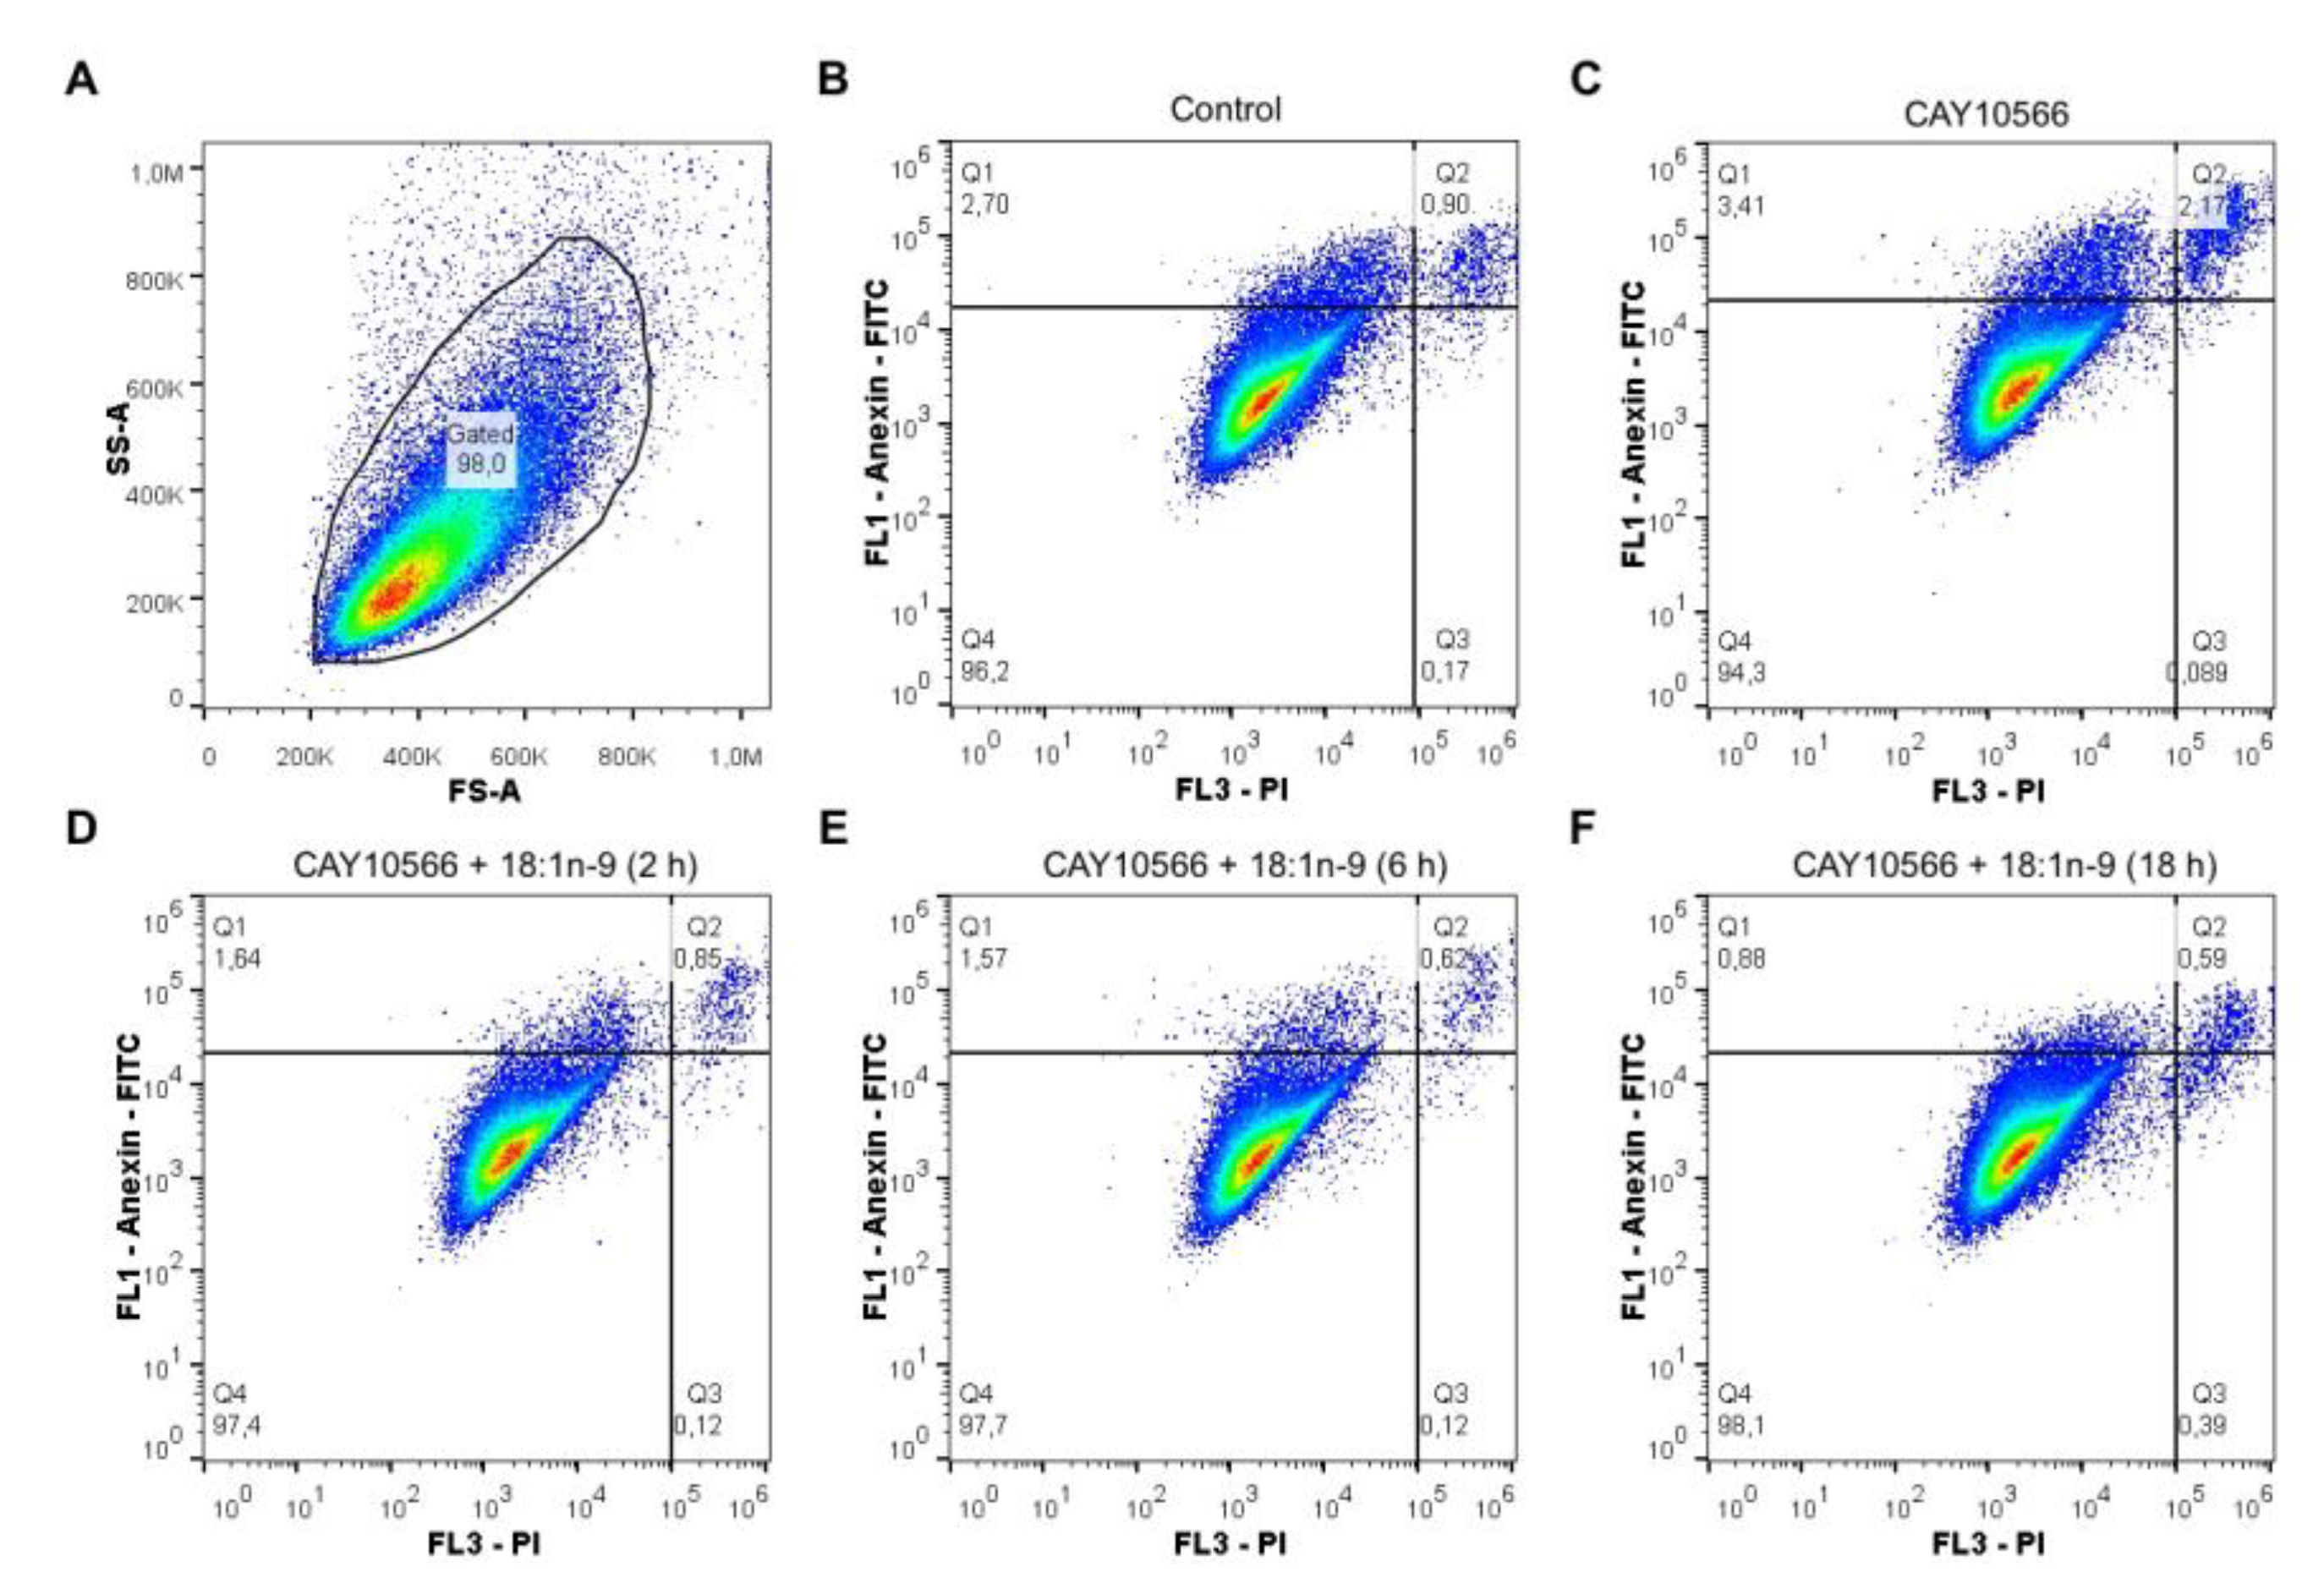
3.3. Oleic Acid Is Essential for ccRCC Cell Proliferation
4. Discussion
5. Conclusions
Supplementary Materials
Author Contributions
Funding
Institutional Review Board Statement
Informed Consent Statement
Data Availability Statement
Acknowledgments
Conflicts of Interest
References
- Wang, H.; Zhang, Y.; Lu, Y.; Song, J.; Huang, M.; Zhang, J.; Huang, Y. The role of stearoyl-coenzyme A desaturase 1 in clear cell renal cell carcinoma. Tumour Biol. 2015, 37, 479–489. [Google Scholar] [CrossRef]
- Motzer, R.J.; Jonasch, E.; Michaelson, M.D.; Nandagopal, L.; Gore, J.L.; George, S.; Alva, A.; Haas, N.; Harrison, M.R.; Plimack, E.R.; et al. NCCN guidelines insights: Kidney cancer, version 2.2020. J. Natl. Compr. Cancer Netw. 2019, 17, 1278–1285. [Google Scholar] [CrossRef] [PubMed]
- Tun, H.W.; Marlow, L.A.; von Roemeling, C.A.; Cooper, S.J.; Kreinest, P.; Wu, K.; Luxon, B.A.; Sinha, M.; Anastasiadis, P.Z.; Copland, J.A. Pathway signature and cellular differentiation in clear cell renal cell carcinoma. PLoS ONE 2010, 5, e10696. [Google Scholar] [CrossRef]
- Abramczyk, H.; Surmacki, J.; Kopeć, M.; Olejnik, A.K.; Lubecka-Pietruszewska, K.; Fabianowska-Majewska, K. The role of lipid droplets and adipocytes in cancer. Raman imaging of cell cultures: MCF10A, MCF7, and MDA-MB-231 compared to adipocytes in cancerous human breast tissue. Analyst 2015, 140, 2224–2235. [Google Scholar] [CrossRef]
- Ackerman, D.; Tumanov, S.; Qiu, B.; Michalopoulou, E.; Spata, M.; Azzam, A.; Xie, H.; Simon, M.C.; Kamphorst, J.J. Triglycerides promote lipid homeostasis during hypoxic stress by balancing fatty acid saturation. Cell Rep. 2018, 24, 2596–2605.e5. [Google Scholar] [CrossRef] [PubMed]
- Igal, R.A. Stearoyl-Coa desaturase-1: A novel key player in the mechanisms of cell proliferation, programmed cell death and transformation to cancer. Carcinogenesis 2010, 31, 1509–1515. [Google Scholar] [CrossRef]
- Beloribi-Djefaflia, S.; Vasseur, S.; Guillaumond, F. Lipid metabolic reprogramming in cancer cells. Oncogenesis 2016, 5, e189. [Google Scholar] [CrossRef]
- Roongta, U.V.; Pabalan, J.G.; Wang, X.; Ryseck, R.P.; Fargnoli, J.; Henley, B.J.; Yang, W.P.; Zhu, J.; Madireddi, M.T.; Lawrence, R.M.; et al. Cancer cell dependence on unsaturated fatty acids implicates stearoyl-CoA desaturase as a target for cancer therapy. Mol. Cancer Res. 2011, 9, 1551–1561. [Google Scholar] [CrossRef] [PubMed]
- Zhou, Y.; Bollu, L.R.; Tozzi, F.; Ye, X.; Bhattacharya, R.; Gao, G.; Dupre, E.; Xia, L.; Lu, J.; Fan, F.; et al. ATP citrate lyase mediates resistance of colorectal cancer cells to SN38. Mol. Cancer Ther. 2013, 12, 2782–2791. [Google Scholar] [CrossRef]
- Wang, C.; Ma, J.; Zhang, N.; Yang, Q.; Jin, Y.; Wang, Y. The acetyl-CoA carboxylase enzyme: A target for cancer therapy? Expert Rev. Anticancer Ther. 2015, 15, 667–676. [Google Scholar] [CrossRef]
- Ueda, K.; Nakatsu, Y.; Yamamotoya, T.; Ono, H.; Inoue, Y.; Inoue, M.K.; Mizuno, Y.; Matsunaga, Y.; Kushiyama, A.; Sakoda, H.; et al. Prolyl isomerase Pin1 binds to and stabilizes acetyl CoA carboxylase 1 protein, thereby supporting cancer cell proliferation. Oncotarget 2019, 10, 1637–1648. [Google Scholar] [CrossRef]
- Svensson, R.U.; Parker, S.J.; Eichner, L.J.; Kolar, M.J.; Wallace, M.; Brun, S.N.; Lombardo, P.S.; Van Nostrand, J.L.; Hutchins, A.; Vera, L.; et al. Inhibition of acetyl-CoA carboxylase suppresses fatty acid synthesis and tumor growth of non-small-cell lung cancer in preclinical models. Nat. Med. 2016, 22, 1108–1119. [Google Scholar] [CrossRef]
- Santos, C.R.; Schulze, A. Lipid metabolism in cancer. FEBS J. 2012, 279, 2610–2623. [Google Scholar] [CrossRef]
- Igal, R.A. Roles of stearoylCoA desaturase-1 in the regulation of cancer cell growth, survival and tumorigenesis. Cancers 2011, 3, 2462–2477. [Google Scholar] [CrossRef]
- Liotti, A.; Cosimato, V.; Mirra, P.; Calì, G.; Conza, D.; Secondo, A.; Luongo, G.; Terracciano, D.; Formisano, P.; Beguinot, F.; et al. Oleic acid promotes prostate cancer malignant phenotype via the G protein-coupled receptor FFA1/GPR40. J. Cell. Physiol. 2018, 233, 7367–7378. [Google Scholar] [CrossRef]
- Liu, Z.; Xiao, Y.; Yuan, Y.; Zhang, X.; Qin, C.; Xie, J.; Hao, Y.; Xu, T.; Wang, X. Effects of oleic acid on cell proliferation through an integrin-linked kinase signaling pathway in 786-O renal cell carcinoma cells. Oncol. Lett. 2013, 5, 1395–1399. [Google Scholar] [CrossRef]
- Chen, L.; Ren, J.; Yang, L.; Li, Y.; Fu, J.; Li, Y.; Tian, Y.; Qiu, F.; Liu, Z.; Qiu, Y. Stearoyl-CoA desaturase-1 mediated cell apoptosis in colorectal cancer by promoting ceramide synthesis. Sci. Rep. 2016, 6, 19665. [Google Scholar] [CrossRef]
- Hess, D.; Chisholm, J.W.; Igal, R.A. Inhibition of stearoyl-CoA desaturase activity blocks cell cycle progression and induces programmed cell death in lung cancer cells. PLoS ONE 2010, 5, e11394. [Google Scholar] [CrossRef] [PubMed]
- Scaglia, N.; Chisholm, J.W.; Igal, R.A. Inhibition of stearoylCoA desaturase-1 inactivates acetyl-CoA carboxylase and impairs proliferation in cancer cells: Role of AMPK. PLoS ONE 2009, 4, e6812. [Google Scholar] [CrossRef] [PubMed]
- Mukherjee, A.; Kenny, H.A.; Lengyel, E. Unsaturated fatty acids maintain cancer cell stemness. Cell Stem Cell 2017, 20, 291–292. [Google Scholar] [CrossRef] [PubMed]
- Suburu, J.; Chen, Y.Q. Lipids and prostate cancer. Prostaglandins Other Lipid Mediat. 2012, 98, 1–10. [Google Scholar] [CrossRef]
- Jiang, L.; Wang, W.; He, Q.; Wu, Y.; Lu, Z.; Sun, J.; Liu, Z.; Shao, Y.; Wang, A. Oleic acid induces apoptosis and autophagy in the treatment of tongue squamous cell carcinomas. Sci. Rep. 2017, 7, 1–11. [Google Scholar] [CrossRef]
- Carrillo, C.; Cavia, M.D.M.; Alonso-Torre, S.R. Efecto antitumoral del ácido oleico; mecanismos de acción; revisión científica. Nutr. Hosp. 2012, 27, 1860–1865. [Google Scholar] [PubMed]
- Massari, F.; Ciccarese, C.; Santoni, M.; Brunelli, M.; Piva, F.; Modena, A.; Bimbatti, D.; Fantinel, E.; Santini, D.; Cheng, L.; et al. Metabolic alterations in renal cell carcinoma. Cancer Treat. Rev. 2015, 41, 767–776. [Google Scholar] [CrossRef]
- Zhang, Y.; Wang, H.; Zhang, J.; Lv, J.; Huang, Y. Positive feedback loop and synergistic effects between hypoxia-inducible factor-2α and stearoyl-CoA desaturase-1 promote tumorigenesis in clear cell renal cell carcinoma. Cancer Sci. 2013, 104, 416–422. [Google Scholar] [CrossRef] [PubMed]
- Arreola, A.; Cowey, C.L.; Coloff, J.L.; Rathmell, J.C.; Rathmell, W.K. HIF1α and HIF2α exert distinct nutrient preferences in renal cells. PLoS ONE 2014, 9, e98705. [Google Scholar] [CrossRef][Green Version]
- Stoyanoff, T.R.; Rodríguez, J.P.; Todaro, J.S.; Espada, J.D.; Melana Colavita, J.P.; Brandan, N.C.; Torres, A.M.; Aguirre, M.V. Tumor biology of non-metastatic stages of clear cell renal cell carcinoma; overexpression of stearoyl desaturase-1, EPO/EPO-R system and hypoxia-related proteins. Tumor Biol. 2016, 37, 13581–13593. [Google Scholar] [CrossRef] [PubMed]
- Peck, B.; Schulze, A. Lipid Desaturation—The next step in targeting lipogenesis in cancer? FEBS J. 2016, 15, 2767–2778. [Google Scholar] [CrossRef]
- Micucci, C.; Matacchione, G.; Valli, D.; Orciari, S.; Catalano, A. HIF2α is involved in the expansion of CXCR4-positive cancer stem-like cells in renal cell carcinoma. Br. J. Cancer 2015, 113, 1178–1185. [Google Scholar] [CrossRef]
- Jin, G.; Liu, B.; You, Z.; Bambakidis, T.; Dekker, E.; Maxwell, J.; Halaweish, I.; Linzel, D.; Alam, H.B.; Arbor, A. Development of a novel neuroprotective strategy: Combined treatment with hypothermia and valproic acid improves survival in hypoxic hippocampal cells. Surgery 2015, 156, 221–228. [Google Scholar] [CrossRef]
- Lazarowski, A.; Caltana, L.; Merelli, A.; Rubio, M.D.; Ramos, A.J.; Brusco, A. Neuronal mdr-1 gene expression after experimental focal hypoxia—A new obstacle for neuroprotection? J. Neurol. Sci. 2007, 258, 84–92. [Google Scholar] [CrossRef] [PubMed]
- Du, J.; Sun, B.; Zhao, X.; Gu, Q.; Dong, X.; Mo, J.; Sun, T.; Wang, J.; Sun, R.; Liu, Y. Hypoxia promotes vasculogenic mimicry formation by inducing epithelial-mesenchymal transition in ovarian carcinoma. Gynecol. Oncol. 2014, 133, 575–583. [Google Scholar] [CrossRef]
- Nishii, K.; Nakaseko, C.; Jiang, M.; Shimizu, N.; Takeuchi, M.; Schneider, W.J.; Bujo, H. The soluble form of LR11 protein is a regulator of hypoxia-induced, urokinase-type plasminogen activator receptor (uPAR)-mediated adhesion of immature hematological cells. J. Biol. Chem. 2013, 288, 11877–11886. [Google Scholar] [CrossRef] [PubMed]
- Borsi, E.; Perrone, G.; Terragna, C.; Martello, M.; Dico, A.F.; Solaini, G.; Baracca, A.; Sgarbi, G.; Pasquinelli, G.; Valente, S.; et al. Hypoxia inducible factor-1 alpha as a therapeutic target in multiple myeloma. Oncotarget 2014, 5, 1779–1792. [Google Scholar] [CrossRef]
- Chiang, C.K.; Nangaku, M.; Tanaka, T.; Iwawaki, T.; Inagi, R. Endoplasmic reticulum stress signal impairs erythropoietin production: A role for ATF4. Am. J. Physiol. Cell Physiol. 2013, 304, 342–353. [Google Scholar] [CrossRef]
- Gao, Y.H.; Wu, Z.X.; Xie, L.Q.; Li, C.X.; Mao, Y.Q.; Duan, Y.T.; Han, B.; Han, S.F.; Yu, Y.; Lu, H.J.; et al. VHL deficiency augments anthracycline sensitivity of clear cell renal cell carcinomas by down-regulating ALDH2. Nat. Commun. 2017, 8, 15337. [Google Scholar] [CrossRef] [PubMed]
- Chen, L.; Xia, G.; Qiu, F.; Wu, C.; Denmon, A.P.; Zi, X. Physapubescin selectively induces apoptosis in VHL-null renal cell carcinoma cells through down-regulation of HIF-2α and inhibits tumor growth. Sci. Rep. 2016, 6, 32582. [Google Scholar] [CrossRef] [PubMed]
- Shinojima, T.; Oya, M.; Takayanagi, A.; Mizuno, R.; Shimizu, N.; Murai, M. Renal cancer cells lacking hypoxia inducible factor (HIF)-1α expression maintain vascular endothelial growth factor expression through HIF-2α. Carcinogenesis 2007, 28, 529–536. [Google Scholar] [CrossRef] [PubMed]
- Wu, D.; Yotnda, P. Induction and testing of hypoxia in cell culture. J. Vis. Exp. 2011, 54, e2899. [Google Scholar] [CrossRef] [PubMed]
- Bligh, E.G.; Dyer, W.J. A Rapid method of total lipid extraction and purification. Can. J. Biochem. Physiol. 1959, 37, 911–917. [Google Scholar] [CrossRef] [PubMed]
- Diez, E.; Balsinde, J.; Aracil, M.; Schüller, A. Ethanol induces release of arachidonic acid but not synthesis of eicosanoids in mouse peritoneal macrophages. Biochim. Biophys. Acta 1987, 921, 82–89. [Google Scholar] [CrossRef]
- Rodríguez, J.P.; Guijas, C.; Astudillo, A.M.; Rubio, J.M.; Balboa, M.A.; Balsinde, J. Sequestration of 9-hydroxystearic acid in fahfa (fatty acid esters of hydroxy fatty acids) as a protective mechanism for colon carcinoma cells to avoid apoptotic cell death. Cancers 2019, 11, 524. [Google Scholar] [CrossRef]
- Astudillo, A.M.; Pérez-Chacón, G.; Balgoma, D.; Gil-De-Gómez, L.; Ruipérez, V.; Guijas, C.; Balboa, M.A.; Balsinde, J. Influence of cellular arachidonic acid levels on phospholipid remodeling and CoA-independent transacylase activity in human monocytes and U937 cells. Biochim. Biophys. Acta 2011, 1811, 97–103. [Google Scholar] [CrossRef] [PubMed]
- Guijas, C.; Meana, C.; Astudillo, A.M.; Balboa, M.A.; Balsinde, J. Foamy monocytes are enriched in cis-7-hexadecenoic fatty acid, 16:1n-9, a possible biomarker for early detection of cardiovascular disease. Cell Chem. Biol. 2016, 23, 689–699. [Google Scholar] [CrossRef] [PubMed]
- Astudillo, A.M.; Meana, C.; Guijas, C.; Pereira, L.; Lebrero, P.; Balboa, M.A.; Balsinde, J. Occurrence and biological activity of palmitoleic acid isomers in phagocytic cells. J. Lipid Res. 2018, 59, 237–249. [Google Scholar] [CrossRef] [PubMed]
- Liu, S.; Yang, Z.; Li, G.; Li, C.; Luo, Y.; Gong, Q.; Wu, X.; Li, T.; Zhang, Z.; Xing, B.; et al. Multi-omics analysis of primary cell culture models reveals genetic and epigenetic basis of intratumoral phenotypic diversity. Genom. Proteom. Bioinform. 2019, 17, 576–589. [Google Scholar] [CrossRef] [PubMed]
- Colavita, J.P.M.; Todaro, J.S.; de Sousa, M.; May, M.; Gomez, N.; Yaneff, A.; Di Siervi, N.; Aguirre, M.V.; Guijas, C.; Ferrini, L.; et al. Multidrug resistance protein 4 (MRP4/ABCC4) is overexpressed in clear cell renal cell carcinoma (ccRCC) and is essential to regulate cell proliferation. Int. J. Biol. Macromol. 2020, 161, 836–847. [Google Scholar] [CrossRef]
- Valdearcos, M.; Esquinas, E.; Meana, C.; Gil-de-Gómez, L.; Guijas, C.; Balsinde, J.; Balboa, M.A. Subcellular localization and role of lipin-1 in human macrophages. J. Immunol. 2011, 186, 6004–6013. [Google Scholar] [CrossRef] [PubMed]
- Koeberle, A.; Shindou, H.; Harayama, T.; Shimizu, T. Palmitoleate is a mitogen, formed upon stimulation with growth factors, and converted to palmitoleoyl-phosphatidylinositol. J. Biol. Chem. 2012, 287, 27244–27254. [Google Scholar] [CrossRef] [PubMed]
- Qin, X.Y.; Su, T.; Yu, W.; Kojima, S. Lipid desaturation-associated endoplasmic reticulum stress regulates MYCN gene expression in hepatocellular carcinoma cells. Cell Death Dis. 2020, 11, 66. [Google Scholar] [CrossRef]
- Grignon, D.J.; Che, M. Clear cell renal cell carcinoma. Clin. Lab. Med. 2005, 25, 305–316. [Google Scholar] [CrossRef]
- Ricketts, C.J.; Linehan, W.M. Intratumoral heterogeneity in kidney cancer. Nat. Genet. 2014, 46, 214–215. [Google Scholar] [CrossRef] [PubMed]
- Saito, K.; Arai, E.; Maekawa, K.; Ishikawa, M.; Fujimoto, H.; Taguchi, R.; Matsumoto, K.; Kanai, Y.; Saito, Y. Lipidomic signatures and associated transcriptomic profiles of clear cell renal cell carcinoma. Sci. Rep. 2016, 6, 28932. [Google Scholar] [CrossRef]
- Sankin, A.; Hakimi, A.A.; Mikkilineni, N.; Ostrovnaya, I.; Silk, M.T.; Liang, Y.; Mano, R.; Chevinsky, M.; Motzer, R.J.; Solomon, S.B.; et al. The impact of genetic heterogeneity on biomarker development in kidney cancer assessed by multiregional sampling. Cancer Med. 2014, 3, 1485–1492. [Google Scholar] [CrossRef] [PubMed]
- Okegawa, T.; Morimoto, M.; Nishizawa, S.; Kitazawa, S.; Honda, K. Intratumor heterogeneity in primary kidney cancer revealed by metabolic profiling of multiple spatially separated samples within tumors. EBioMedicine 2017, 19, 31–38. [Google Scholar] [CrossRef]
- Casuscelli, J.; Vano, Y.; Herve, W.; Hsieh, J.J. Molecular classification of renal cell carcinoma and its implication in future clinical practice. Kidney Cancer 2017, 1, 3–13. [Google Scholar] [CrossRef] [PubMed]
- Zhang, F. Dysregulated lipid metabolism in cancer. World J. Biol. Chem. 2012, 3, 167–174. [Google Scholar] [CrossRef]
- Currie, E.; Schulze, A.; Zechner, R.; Walther, T.C.; Farese, R.V. Cellular fatty acid metabolism and cancer. Cell Metab. 2013, 18, 153–161. [Google Scholar] [CrossRef]
- Minville-Walz, M.; Pierre, A.S.; Pichon, L.; Bellenger, S.; Fèvre, C.; Bellenger, J.; Tessier, C.; Narce, M.; Rialland, M. Inhibition of stearoyl-CoA desaturase 1 expression induces CHOP-dependent cell death in human cancer cells. PLoS ONE 2010, 5, e14363. [Google Scholar] [CrossRef]
- Mason, P.; Liang, B.; Li, L.; Fremgen, T.; Murphy, E.; Quinn, A.; Madden, S.L.; Biemann, H.P.; Wang, B.; Cohen, A.; et al. SCD1 inhibition causes cancer cell death by depleting mono-unsaturated fatty acids. PLoS ONE 2012, 7, e33823. [Google Scholar] [CrossRef] [PubMed]
- Von Roemeling, C.A.; Marlow, L.A.; Wei, J.J.; Cooper, S.J.; Caulfield, T.R.; Wu, K.; Tan, W.W.; Tun, H.W.; Copland, J.A. Stearoyl-CoA desaturase 1 is a novel molecular therapeutic target for clear cell renal cell carcinoma. Clin. Cancer Res. 2013, 19, 2368–2380. [Google Scholar] [CrossRef]
- Kato, H.; Sakaki, K.; Mihara, K. Ubiquitin-proteasome-dependent degradation of mammalian ER stearoyl-CoA desaturase. J. Cell Sci. 2006, 119, 2342–2353. [Google Scholar] [CrossRef]
- Koumenis, C. ER Stress, Hypoxia Tolerance and Tumor Progression. Curr. Mol. Med. 2006, 6, 55–69. [Google Scholar] [CrossRef]
- Abou Khouzam, R.; Goutham, H.V.; Zaarour, R.F.; Chamseddine, A.N.; Francis, A.; Buart, S.; Terry, S.; Chouaib, S. Integrating tumor hypoxic stress in novel and more adaptable strategies for cancer immunotherapy. Semin. Cancer Biol. 2020, 65, 140–154. [Google Scholar] [CrossRef]
- Guštin, E.; Jarc, E.; Kump, A.; Petan, T. Lipid droplet formation in hela cervical cancer cells depends on cell density and the concentration of exogenous unsaturated fatty acids. Acta Chim. Slov. 2017, 64, 549–554. [Google Scholar] [CrossRef]
- Herms, A.; Bosch, M.; Ariotti, N.; Reddy, B.J.N.; Fajardo, A.; Fernández-Vidal, A.; Alvarez-Guaita, A.; Fernández-Rojo, M.A.; Rentero, C.; Tebar, F.; et al. Cell to cell heterogeneity in lipid droplets suggests a mechanism to reduce lipotoxicity. Curr. Biol. 2013, 23, 1489–1496. [Google Scholar] [CrossRef] [PubMed]
- Kohlwein, S.D.; Veenhuis, M.; van der Klei, I.J. Lipid droplets and peroxisomes: Key players in cellular lipid homeostasis or a matter of fat-store’em up or burn’em down. Genetics 2013, 193, 1–50. [Google Scholar] [CrossRef] [PubMed]
- Fujimoto, T.; Ohsaki, Y.; Cheng, J.; Suzuki, M.; Shinohara, Y. Lipid droplets: A classic organelle with new outfits. Histochem. Cell Biol. 2008, 130, 263–279. [Google Scholar] [CrossRef]
- Guijas, C.; Rodríguez, J.P.; Rubio, J.M.; Balboa, M.A.; Balsinde, J. Phospholipase A2 regulation of lipid droplet formation. Biochim. Biophys. Acta 2014, 1841, 1661–1671. [Google Scholar] [CrossRef] [PubMed]
- Tamura, K.; Horikawa, M.; Sato, S.; Miyake, H.; Setou, M. Discovery of lipid biomarkers correlated with disease progression in clear cell renal cell carcinoma using desorption electrospray ionization imaging mass spectrometry. Oncotarget 2019, 10, 1688–1703. [Google Scholar] [CrossRef]
- Noto, A.; Raffa, S.; De Vitis, C.; Roscilli, G.; Malpicci, D.; Coluccia, P.; Di Napoli, A.; Ricci, A.; Giovagnoli, M.R.; Aurisicchio, L.; et al. Stearoyl-CoA desaturase-1 is a key factor for lung cancer-initiating cells. Cell Death Dis. 2013, 4, e947. [Google Scholar] [CrossRef]
- Kamphorst, J.J.; Cross, J.R.; Fan, J.; De Stanchina, E.; Mathew, R.; White, E.P.; Thompson, C.B.; Rabinowitz, J.D. Hypoxic and Ras-transformed cells support growth by scavenging unsaturated fatty acids from lysophospholipids. Proc. Natl. Acad. Sci. USA 2013, 110, 8882–8887. [Google Scholar] [CrossRef]
- Schaffer, J.E. Lipotoxicity: When tissues overeat. Curr. Opin. Lipidol. 2003, 14, 281–287. [Google Scholar] [CrossRef] [PubMed]
- Peck, B.; Schug, Z.T.; Zhang, Q.; Dankworth, B.; Jones, D.T.; Smethurst, E.; Patel, R.; Mason, S.; Jiang, M.; Saunders, R.; et al. Inhibition of fatty acid desaturation is detrimental to cancer cell survival in metabolically compromised environments. Cancer Metab. 2016, 4, 6. [Google Scholar] [CrossRef] [PubMed]
- Imamura, K.; Tomita, N.; Kawakita, Y.; Ito, Y.; Ono, K.; Nii, N. Discovery of novel and potent stearoyl coenzyme A desaturase 1 (SCD1) inhibitors as anticancer agents. Bioorg. Med. Chem. 2017, 25, 3768–3779. [Google Scholar] [CrossRef] [PubMed]


Publisher’s Note: MDPI stays neutral with regard to jurisdictional claims in published maps and institutional affiliations. |
© 2021 by the authors. Licensee MDPI, Basel, Switzerland. This article is an open access article distributed under the terms and conditions of the Creative Commons Attribution (CC BY) license (https://creativecommons.org/licenses/by/4.0/).
Share and Cite
Melana, J.P.; Mignolli, F.; Stoyanoff, T.; Aguirre, M.V.; Balboa, M.A.; Balsinde, J.; Rodríguez, J.P. The Hypoxic Microenvironment Induces Stearoyl-CoA Desaturase-1 Overexpression and Lipidomic Profile Changes in Clear Cell Renal Cell Carcinoma. Cancers 2021, 13, 2962. https://doi.org/10.3390/cancers13122962
Melana JP, Mignolli F, Stoyanoff T, Aguirre MV, Balboa MA, Balsinde J, Rodríguez JP. The Hypoxic Microenvironment Induces Stearoyl-CoA Desaturase-1 Overexpression and Lipidomic Profile Changes in Clear Cell Renal Cell Carcinoma. Cancers. 2021; 13(12):2962. https://doi.org/10.3390/cancers13122962
Chicago/Turabian StyleMelana, Juan Pablo, Francesco Mignolli, Tania Stoyanoff, María V. Aguirre, María A. Balboa, Jesús Balsinde, and Juan Pablo Rodríguez. 2021. "The Hypoxic Microenvironment Induces Stearoyl-CoA Desaturase-1 Overexpression and Lipidomic Profile Changes in Clear Cell Renal Cell Carcinoma" Cancers 13, no. 12: 2962. https://doi.org/10.3390/cancers13122962
APA StyleMelana, J. P., Mignolli, F., Stoyanoff, T., Aguirre, M. V., Balboa, M. A., Balsinde, J., & Rodríguez, J. P. (2021). The Hypoxic Microenvironment Induces Stearoyl-CoA Desaturase-1 Overexpression and Lipidomic Profile Changes in Clear Cell Renal Cell Carcinoma. Cancers, 13(12), 2962. https://doi.org/10.3390/cancers13122962